Sprinkler Systems and Residential Structure Fires
14
Sprinkler Systems and Residential Structure Fires Exploring the Impact of Sprinklers for Life Safety and Fire Spread Fire Chief Len Garis and Dr. Joseph Clare January 2013
Transcript of Sprinkler Systems and Residential Structure Fires

Sprinkler Systems and Residential Structure Fires
Exploring the Impact of Sprinklers for Life Safety and Fire Spread
Fire Chief Len Garis and Dr. Joseph Clare January 2013

1
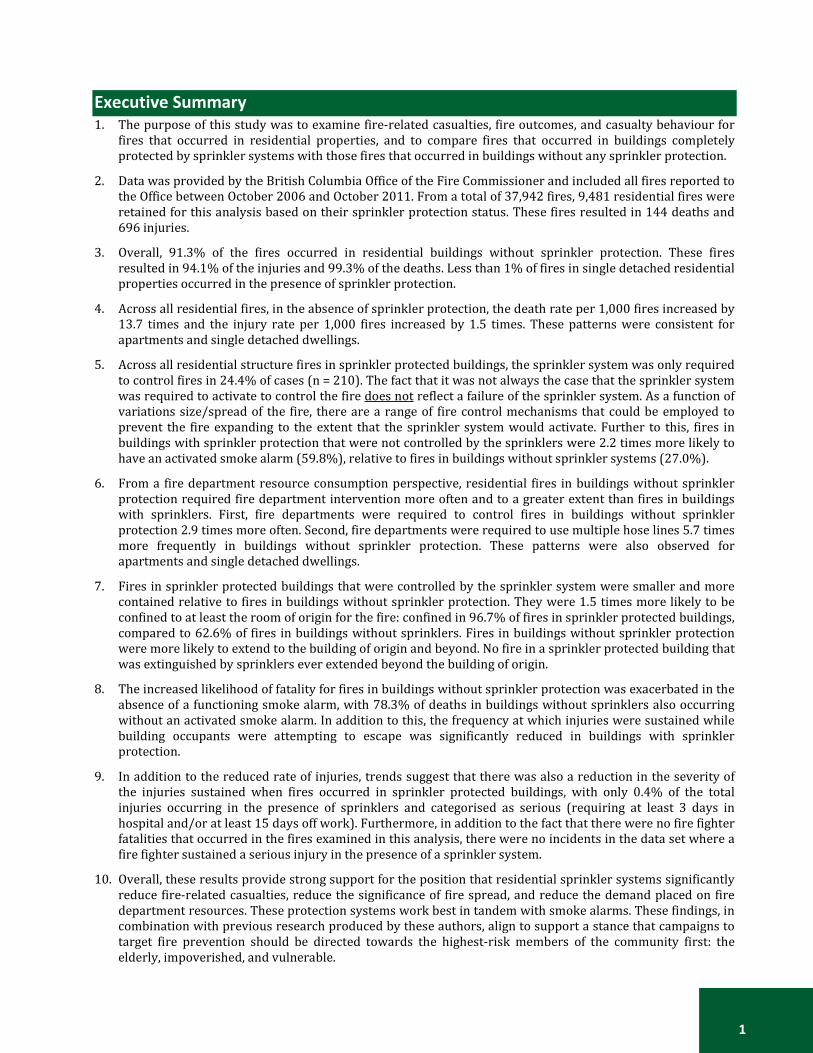
Executive Summary 1. The purpose of this study was to examine fire-related casualties, fire outcomes, and casualty behaviour for
fires that occurred in residential properties, and to compare fires that occurred in buildings completely protected by sprinkler systems with those fires that occurred in buildings without any sprinkler protection.
2. Data was provided by the British Columbia Office of the Fire Commissioner and included all fires reported to the Office between October 2006 and October 2011. From a total of 37,942 fires, 9,481 residential fires were retained for this analysis based on their sprinkler protection status. These fires resulted in 144 deaths and 696 injuries.
3. Overall, 91.3% of the fires occurred in residential buildings without sprinkler protection. These fires resulted in 94.1% of the injuries and 99.3% of the deaths. Less than 1% of fires in single detached residential properties occurred in the presence of sprinkler protection.
4. Across all residential fires, in the absence of sprinkler protection, the death rate per 1,000 fires increased by 13.7 times and the injury rate per 1,000 fires increased by 1.5 times. These patterns were consistent for apartments and single detached dwellings.
5. Across all residential structure fires in sprinkler protected buildings, the sprinkler system was only required to control fires in 24.4% of cases (n = 210). The fact that it was not always the case that the sprinkler system was required to activate to control the fire does not reflect a failure of the sprinkler system. As a function of variations size/spread of the fire, there are a range of fire control mechanisms that could be employed to prevent the fire expanding to the extent that the sprinkler system would activate. Further to this, fires in buildings with sprinkler protection that were not controlled by the sprinklers were 2.2 times more likely to have an activated smoke alarm (59.8%), relative to fires in buildings without sprinkler systems (27.0%).
6. From a fire department resource consumption perspective, residential fires in buildings without sprinkler protection required fire department intervention more often and to a greater extent than fires in buildings with sprinklers. First, fire departments were required to control fires in buildings without sprinkler protection 2.9 times more often. Second, fire departments were required to use multiple hose lines 5.7 times more frequently in buildings without sprinkler protection. These patterns were also observed for apartments and single detached dwellings.
7. Fires in sprinkler protected buildings that were controlled by the sprinkler system were smaller and more contained relative to fires in buildings without sprinkler protection. They were 1.5 times more likely to be confined to at least the room of origin for the fire: confined in 96.7% of fires in sprinkler protected buildings, compared to 62.6% of fires in buildings without sprinklers. Fires in buildings without sprinkler protection were more likely to extend to the building of origin and beyond. No fire in a sprinkler protected building that was extinguished by sprinklers ever extended beyond the building of origin.
8. The increased likelihood of fatality for fires in buildings without sprinkler protection was exacerbated in the absence of a functioning smoke alarm, with 78.3% of deaths in buildings without sprinklers also occurring without an activated smoke alarm. In addition to this, the frequency at which injuries were sustained while building occupants were attempting to escape was significantly reduced in buildings with sprinkler protection.
9. In addition to the reduced rate of injuries, trends suggest that there was also a reduction in the severity of the injuries sustained when fires occurred in sprinkler protected buildings, with only 0.4% of the total injuries occurring in the presence of sprinklers and categorised as serious (requiring at least 3 days in hospital and/or at least 15 days off work). Furthermore, in addition to the fact that there were no fire fighter fatalities that occurred in the fires examined in this analysis, there were no incidents in the data set where a fire fighter sustained a serious injury in the presence of a sprinkler system.
10. Overall, these results provide strong support for the position that residential sprinkler systems significantly reduce fire-related casualties, reduce the significance of fire spread, and reduce the demand placed on fire department resources. These protection systems work best in tandem with smoke alarms. These findings, in combination with previous research produced by these authors, align to support a stance that campaigns to target fire prevention should be directed towards the highest-risk members of the community first: the elderly, impoverished, and vulnerable.

2
Background to Sprinkler Systems and Life Safety: The Purpose of this Research Residential sprinkler systems are designed to automatically discharge to extinguish fires with a view to giving building occupants time to escape [1]. These systems, which have been available for over a century, have been developed to a point where they are able to react within 35 seconds of a fire starting [1]. Within an industrial and commercial context these systems have been demonstrated to increase survival rates and reduce losses relative to buildings without sprinkler protection [1]. Research undertaken by the U.S. Center for Fire Research at the National Institute of Standards and Technology (NIST) [2] has concluded:
• Residential sprinkler systems alone reduce the chances of dying by 69% [3], and • Smoke alarms and residential sprinkler systems operating in tandem reduce the risk of dying in the event
of a fire by 82% [3].
To this end, the official position of the U.S. Fire Administration is, “that all citizens should be protected against death, injury, and property loss resulting from fire in their residence. All homes should be equipped with both smoke alarms and automatic fire sprinklers, and all families should have and practice an emergency escape plan” [3].
These recommendations are even more important given the findings of research demonstrating that fires involving modern fixtures, furniture, and furnishings are growing faster than typically would have occurred in older buildings, likely meaning that the time available for residents to escape flaming fires is significantly reduced [3]. Furthermore, FiRECAMTM simulation modeling results of Bénichou and colleagues [4] from the National Research Council of Canada, showed that sprinkler protection in the absence of improved response times provided better anticipated protection than faster fire department response in the absence of sprinkler protection.
Despite these findings, a 2007 review by Warda and Ballesteros [1] determined there was insufficient evidence to conclude sprinklers are effective at preventing fires and fire-related injury in residential settings. Part of the reason for this conclusion may be that there are limitations associated with typical approaches to estimating the life safety benefits of sprinkler systems that arise from the national level estimates that are generated through analysis of the US Fire Administration (USFA) National Fire Incident Reporting System (NFIRS) database [as discussed by Butry 5].
To address some of the limitations associated with the inability of national estimates approaches to counter the influence of confounding variables (e.g., smoke alarms, socioeconomic factors, and building characteristics) when estimating the life-safety implications of sprinklers, Butry [5] compared fire outcomes for sprinkler-protected buildings with outcomes in comparable buildings that lacked sprinkler protection. To control for the potential confound of a working smoke alarm, Butry ensured that all buildings in the analysis had a working smoke alarm that was located near the fire’s origin. This process demonstrated that sprinklers significantly reduce fire-related casualties (injuries and deaths) per 1,000 fires, over-and-above the benefit provided exclusively by functioning smoke alarms, essentially mirroring the earlier findings [2].
With this body of previous research in mind, the two aims of the current research are:
1. To see how closely Butry’s [5] fire-related casualty findings align with the outcomes of residential fires in British Columbia (BC), Canada.
2. To utilise the additional fire incident information available in BC to examine (a) casualty behaviour, (b) fire spread, and (c) fire department resource consumption.

3
Extrapolating from the previously discussed research findings [1, 5] it is hypothesized that sprinklers will significantly reduce fire-related casualties, minimize fire spread, reduce burden on fire departments when intervening, and also demonstrate benefits for the behaviours of building residents’ in the event of a fire.
Identifying Relevant Cases for Analysis Data was provided by the BC Office of the Fire Commissioner (OFC), including all fires reported to the OFC between October 2006 and October 2011. The overall data set of 37,492 fires was sorted and incidents were retained for analysis if they had occurred in a residential building1 that was classified as either completely sprinkler protected2 or completely without sprinkler protection3 (n = 9,841). As Table 1 displays these residential structure fires resulted in 144 deaths and 696 injuries. The scope of this research considered:
• The frequency of fires in all residential buildings, with separate analysis of patterns for apartments (13.6% of incidents) and single detached dwellings (67.0% of incidents);
• The outcomes for life safety in the presence of sprinkler systems; and • Fire performance and casualty behaviour in the presence of sprinkler systems.
TABLE 1. FREQUENCY OF RESIDENTIAL STRUCTURE FIRES, DEATHS, AND INJURIES, FOR ALL RESIDENTIAL PROPERTIES, APARTMENTS-ONLY, AND SINGLE DETACHED DWELLINGS-ONLY
Property classification # Reporting
locations # Fires % Total
fires # Deaths % Total
deaths # Injuries % Total injuries
All residential properties 365 9,841 100.0% 144 100.0% 696 100.0% Apartment 77 1,294 13.6% 20 13.9% 148 21.3%
Single detached 340 6,352 67.0% 78 54.2% 360 51.7% * Two cases were removed from this analysis (OFC incident numbers 209973 and 217509) as they were coded as being completely without sprinkler protection, but the method of fire control was a variation of a sprinkler system. There were no deaths or injuries involved in these two cases.
The demographic details of the residential fire deaths examined in this sample are displayed in Table 2 and the respective patterns for injuries are displayed in Table 3.
TABLE 2. DEMOGRAPHIC INFORMATION FOR THE DEATHS THAT OCCURRED IN THE FIRES UNDER EXAMINATION
Property classification % Male % 6yrs and under % 65 and over* % First Nations
reported % Fire fighter
All residential properties 52.1% 4.2% 28.5% 2.8% 0.0% Apartment 45.0% 5.0% 45.0% 0.0% 0.0%
Single detached 48.7% 2.6% 29.5% 3.8% 0.0% * To a maximum age of 99 years.
In 2011, children aged 6-and-under represented 6.9% of the BC population and adults aged 65 years and older represented 15.3% of the population [6]. With this in mind, it appears that young children were slightly
1 Property complex values: PC3100, PC3200 (apartment buildings), PC3300, PC3400 (single-detached dwellings), PC3500, PC3600, PC3700, PC3800, and PC3900. 2 Sprinkler protection values: SP1000, SP2000, and SP3000. 3 Sprinkler protection value: SP7000.

4
under-represented in fire deaths (4.2% overall) and injuries (2.9%). In contrast, older members of society demonstrated a dramatically higher likelihood of death (28.5%) as a result of residential structure fire. This pattern was even greater for fatalities in apartment buildings, where 45.0% were aged 65 years and over.
TABLE 3. DEMOGRAPHIC INFORMATION FOR THE INJURIES THAT OCCURRED IN THE FIRES UNDER EXAMINATION
Property classification % Male % 6yrs and under % 65 and over* % First Nations
reported % Fire fighter
All residential properties 64.2% 2.9% 11.4% 2.4% 12.6%
Apartment 58.8% 4.1% 12.8% 0.0% 14.9%
Single detached 65.6% 1.7% 10.8% 3.3% 13.3% * To a maximum age of 99 years.
These findings with respect to males, elderly fatalities, and First Nations fatalities are consistent with previous research focused on high-risk demographic characteristics for fire fatality [1, 7, 8]. From a future planning perspective, these figures are indicative of the need to conduct risk-based, targeted fire-prevention campaigns, given that it is predicted that adults aged 65 years and older will increase in number to from 15.0% of the population in 2010 to 23.7% of the BC population by 2036: an increase of 58.0% [9].
Outcomes for Life Safety with Sprinkler Protection Disaggregating the information presented in Table 1, above, Table 4 displays the relative frequencies of structure fires, deaths, and injuries for residential properties as a function of sprinkler protection status. Some important summary findings from this table include:
• Overall, 8.7% of fires at residential properties occurred in buildings with complete sprinkler protection. 94.1% of injuries and 99.3% of deaths overall occurred in properties that did not have sprinkler protection.
• Over one-third (36.6%) of fires in apartments occurred in sprinkler protected buildings. 95.0% of the deaths and 85.1% of the injuries in apartment buildings occurred without sprinkler protection.
• Less than one percent (0.9%) of the fires in single detached residential buildings occurred in the presence of sprinkler protection. All of the deaths and 99.4% of the injuries that occurred in these single detached structures occurred in the absence of sprinklers.
TABLE 4. RESIDENTIAL STRUCTURE FIRES, DEATHS, AND INJURIES BY SPRINKLER STATUS AND PROPERETY CLASSIFICATION
No sprinkler protection Sprinkler protection
Property classification # Fires # Deaths # Injuries # Fires # Deaths # Injuries
All residential properties 8,981 143 655
860 1 41
Apartment 821 19 126
473 1 22
Single detached 6,293 78 358 59 0 2
These differences in the relative frequencies of fires in the presence of sprinkler protection as a function of property classification are to be expected, given the variations in building code standards and municipal bylaws that operate across BC. It is important to provide some additional information about the fire incident that incurred a death in the building with sprinkler protection. From information available to the researchers,

5
it is unclear whether the fatality occurred as a result of the fire, or whether the occupant may have died as a result of a separate cause. The fire was caused by smoker’s material, confined to the part area of the room of origin, and was extinguished by the sprinkler system. Furthermore, the casualty report indicated that the age, condition, actions, cause of injury, and cause of failure to escape were all coded as ‘unknown’. However, this case has been retained for analysis purposes to maintain consistency with the BC OFC database.
Table 5 indicates the death rate per 1,000 fires and the injury rate per 1,000 fires for all residential properties, apartments, and single detached dwellings. The rate ratios columns compare the rates for fires in buildings without sprinkler protection with those in buildings that were protected by sprinklers. This indicates that the death rate was 13.7 greater and the injury rate was 1.5 times greater in the absence of sprinkler protection. This pattern was largely consistent for fires in apartment buildings. It was not possible to compute the rate ratio for deaths in single detached dwellings as there were no deaths in this property classification when sprinkler protection was present. Overall, the death rate reduced by 92.7% and the injury rate reduced by 34.6% for fires that occurred in sprinkler protected buildings.
TABLE 5. DEATH RATES (PER 1,000 FIRES), INJURY RATES (PER 1,000 FIRES), AND RATE RATIOS, BY SPRINKLER STATUS AND PROPERTY CLASSIFICATION
Property classification
No sprinkler protection Sprinkler protection Rate ratios (no sprinkler: sprinkler)*
Death rate Injury rate Death rate Injury rate Death rate Injury rate All residential properties 15.9 72.9
1.2 47.7
13.7 1.5
Apartment 23.1 153.5
2.1 46.5
10.9 3.3
Single detached 12.4 56.9 0.0 33.9 Undefined 1.7 NB * All rate ratios were significantly returned significant Z-scores (Z’s > |1.96|), with the exception of injury rates in single detached buildings
Understanding the Different Fire Outcomes with Sprinkler Protection
Fire Performance – Method of Fire Control
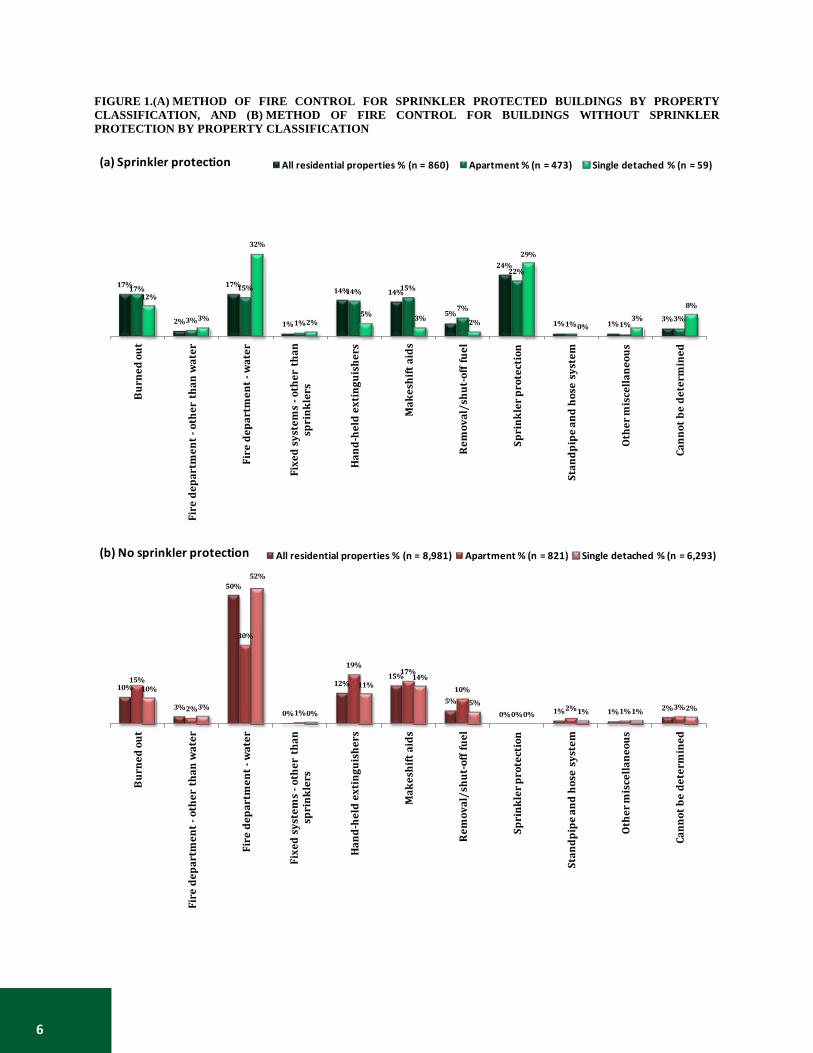
A broad range of methods were employed to control the fires in this sample and the relative frequency at which each was used is demonstrated in Figure 1. Figure 1 (a) displays the various methods of fire control for residential fires in properties with sprinkler protection, displayed separately for all residential property fires, apartment fires, and single detached dwelling fires. Figure 1 (b) displays the equivalent percentages for the residential structures without sprinkler protection.
It is important to note here that, due to variations in the nature of size and spread of the fire, it was not always the case that the sprinkler system was required to activate to control fires in buildings with sprinkler protection. This does not reflect a failure of the sprinkler system as there are a range of fire control mechanisms, including available fuel burned-out, removal of fuel, use of make-shift aids, and use of hand-held extinguishers, that could be employed to prevent the fire expanding to the extent that the sprinkler system would activate. This explains why sprinkler systems were only required to control 24.4% (n = 210 cases) of the fires in buildings with sprinkler protection. Sprinklers also controlled fires in 22.0% of the apartments and 28.8% of the single detached dwellings. This situation is potentially explained (at least in part) by the finding that fires in buildings with sprinkler protection that were not controlled by the sprinklers were 2.2 times more likely to have activated the smoke alarm (59.8%) relative to fires in buildings without sprinkler systems (27.0%).
6
FIGURE 1.(A) METHOD OF FIRE CONTROL FOR SPRINKLER PROTECTED BUILDINGS BY PROPERTY CLASSIFICATION, AND (B) METHOD OF FIRE CONTROL FOR BUILDINGS WITHOUT SPRINKLER PROTECTION BY PROPERTY CLASSIFICATION
17%
2%
17%
1%
14% 14%
5%
24%
1% 1% 3%
17%
3%
15%
1%
14% 15%
7%
22%
1% 1%3%
12%
3%
32%
2%5% 3% 2%
29%
0%3%
8%
Bur
ned
out
Fire
dep
artm
ent -
othe
r th
an w
ater
Fire
dep
artm
ent -
wat
er
Fixe
d sy
stem
s -o
ther
tha
n sp
rink
lers
Han
d-he
ld e
xtin
guis
hers
Mak
eshi
ft a
ids
Rem
oval
/shu
t-of
f fue
l
Spri
nkle
r pro
tect
ion
Stan
dpip
e an
d ho
se s
yste
m
Oth
er m
isce
llane
ous
Cann
ot b
e de
term
ined
(a) Sprinkler protection All residential properties % (n = 860) Apartment % (n = 473) Single detached % (n = 59)
10%
3%
50%
0%
12%15%
5%
0% 1% 1% 2%
15%
2%
30%
1%
19%17%
10%
0%2% 1% 3%
10%
3%
52%
0%
11%14%
5%0% 1% 1% 2%
Bur
ned
out
Fire
dep
artm
ent -
othe
r th
an w
ater
Fire
dep
artm
ent -
wat
er
Fixe
d sy
stem
s -o
ther
tha
n sp
rink
lers
Han
d-he
ld e
xtin
guis
hers
Mak
eshi
ft a
ids
Rem
oval
/shu
t-of
f fue
l
Spri
nkle
r pro
tect
ion
Stan
dpip
e an
d ho
se s
yste
m
Oth
er m
isce
llane
ous
Cann
ot b
e de
term
ined
(b) No sprinkler protection All residential properties % (n = 8,981) Apartment % (n = 821) Single detached % (n = 6,293)

7
As suggested by the patterns displayed across Figure 1 (a) and (b), there were some obvious differences in the broad methods used to control fires in residential buildings as a function of sprinkler protection status. These main patterns include:4
• The fire department was required to use water to control fires 2.9 times more often in buildings without sprinkler protection (49.6% compared to 16.9% in sprinkler protected buildings). This pattern was also found for fires in apartments and single detached dwellings.
• When the fire department used water to control fires, more resources were required in buildings without sprinkler protection. Multiple hose lines, which is taken as a proxy measure for a large attack force being involved in containing the fire, were required 5.7 times more often overall (25.8% of all fires in buildings without sprinkler protection, compared to 4.5% of fires in sprinkler protected buildings). This pattern held true for apartment fires, where incidents in buildings without sprinkler protection were 4.1 times more likely to require multiple hose lines (45.6% vs.21.9% of fires, respectively), and for fires in single detached dwellings without sprinklers, which were 1.6 times likely to require multiple hose lines (27.4% vs. 16.9% fires, respectively).
• Although comparable for the total sample of fires, the frequency of hand-held extinguisher use to control fires was greater for fires in apartments without sprinklers (19.1% vs. 14.0% in buildings with sprinklers) and for fires in single detached buildings without sprinklers (11.4% vs. 5.1%).
Fire Performance – Extent of Fire Spread
The varying extent to which fires spread throughout the residential buildings is displayed in Figure 2. Figure 2 (a) demonstrates the fire spread in buildings with sprinkler protection, but only examines the 24.4% (n = 210 cases) of fires in which the sprinkler system was responsible for controlling the fire spread (and the corresponding n = 104 apartment fires and n = 17 single detached fires). Figure 2 (b) shows the equivalent patterns of fire spread in residential buildings without sprinkler systems. (Figure 3 examines the fire spread for the remaining fires in sprinkler protected buildings.) As previously, the variations in fire spread are examined for the whole set of residential structure fires, and then separately for the fires that occurred in apartment buildings and single detached dwellings, both with and without sprinkler protection.
As with the methods of fire control explored previously, there were some significant differences in the extent to which the fires spread between sprinkler-controlled fires and the fires that occurred in buildings without sprinkler protection. The main results, based on the percentages indicated in Figure 2 (a) and (b) are as follows:5
• Fires controlled by sprinklers were confined to the object, part room, or room of origin 96.7% of the time, which was a 1.5 times more frequent than for fires in buildings without sprinklers (62.6%). This difference was less pronounced for fires in apartment buildings: 95.2% of fires controlled by sprinklers were confined to at least the room of origin, compared to 84.7% of those in buildings without sprinklers. The difference was greatest for fires in single detached properties: 94.1% confined within the room of origin when controlled by sprinklers, compared to 59.6% when controlled by other means.
• Overall, fires controlled by sprinkler systems were less likely to extend as far as the floor of origin (2.9%) compared to fires in buildings without sprinklers (6.7%). This difference was not observed for apartment fires, but was consistent for fires in single detached dwellings.
4 All differences discussed here were significant, with planned comparisons returning Z’s > |1.96|. 5 All differences discussed here were significant, with planned comparisons returning Z’s > |1.96|.

8
• At all other extents of fire spread, there was an increased likelihood of the fire spreading to the building, beyond the building, and being confined to the roof for fires in buildings without sprinkler protection.
• No fires that were extinguished by sprinkler systems ever extended beyond the building of origin.
FIGURE 2.(A) EXTENT OF FIRE SPREAD FOR SPRINKLER PROTECTED BUILDINGS (WHERE THE METHOD OF FIRE CONTROL WAS THE SPRINKLER SYSTEM) BY PROPERTY CLASSIFICATION, AND (B) EXTENT OF FIRE SPREAD FOR BUILDINGS WITHOUT SPRINKLER PROTECTION, BY PROPERTY CLASSIFICATION
As a side note, the extent of fire spread for fires in sprinkler protected buildings that were not controlled by the sprinkler system are indicated in Figure 3, below. Overall, 6 of the fires that occurred in the total residential properties that were protected by sprinklers were coded as having extended beyond the building of origin. Additional investigation of the area at which these fires originated revealed that they all started on the outside: 2 fires in a court, patio, or terrace area, 2 on exterior walls, 1 on an exterior balcony, and 1
33%
45%
19%
3%0% 0% 0%
29%
46%
20%
5%
0% 0% 0%
29%
53%
12%
0%
6%
0% 0%
1. Confined to object of origin
2. Confined to part of
room/area of origin
3. Confined to room of origin
4. Confined to floor level of
origin
5. Confined to building of
origin
6. Extended beyond
property of origin
7. Confined to roof/attic space
(a) Sprinkler protection (where method of fire control was the sprinkler system)
All fires % (n = 210) Apartment % (n = 104) Single detached % (n = 17)
29%25%
9%7%
24%
5%2%
39%
33%
13%
5%8%
1% 1%
28%
23%
8%7%
26%
5%2%
1. Confined to object of origin
2. Confined to part of
room/area of origin
3. Confined to room of origin
4. Confined to floor level of
origin
5. Confined to building of
origin
6. Extended beyond
property of origin
7. Confined to roof/attic space
(b) No sprinkler protection
All fires % (n = 8,981) Apartment % (n = 821) Single detached % (n = 6,293)

9
exposure fire. Furthermore, 2 of the fires were coded as having been incendiary in origin. In short, these fires look like they originated outside of the building, which most likely put them beyond the reach of built in fire protection systems. Separate research in progress [10] reveals that balcony fires in multi-residential buildings are more likely to have required visual sighting/personal detection, more likely to have extended to the building or beyond, and more likely to have required fire department intervention to control the fire. In contrast, only 30.4% of the 463 fires that extended beyond the buildings without sprinkler protection occurred in an outside area or as a result of an exposure.
FIGURE 3. EXTENT OF FIRE SPREAD FOR SPRINKLER PROTECTED BUILDINGS, WHERE THE METHOD OF FIRE CONTROL WAS NOT THE SPRINKLER SYSTEM BY PROPERTY CLASSIFICATION
Behaviour of Fire-Related Casualties
As discussed previously, the likelihood of experiencing both types of fire-related casualties, injuries and deaths, was increased for fires in buildings without sprinkler protection (see Table 5, above). In addition to this, it is interesting to examine the behaviour for these fire-related casualties to see if there are any systematic differences in how people respond to fires in the presence or absence of sprinklers. Table 6 displays variations in the actions of the fire-related casualties for the incidents in buildings with and without sprinkler protection. With respect to deaths, 20.3% occurred when the victims either did not act or received delayed warning. Importantly, and aligned with the findings of Butry [5], of the 143 deaths that occurred in buildings without sprinklers, only 21.7% occurred in the presence of an activated smoke alarm. In relation to injuries, the main findings of note include:6
• More casualties were injured while attempting to escape from buildings without sprinkler protection (19.1% vs. 9.1% in buildings with sprinklers).
• In combination, casualties in buildings without sprinkler protection were more frequent as a result of loss of judgement/panic, delayed warning, or failure to act (11.3%) than in buildings with sprinkler protection (2.4%).
6 All differences discussed here were significant, with planned comparisons returning Z’s > |1.96|.
58%
27%
6%2%
5%1% 1%
64%
22%
7%3% 3%
1% 1%
29%
23%
12%
2%
28%
2% 2%
1. Confined to object of origin
2. Confined to part of
room/area of origin
3. Confined to room of origin
4. Confined to floor level of
origin
5. Confined to building of
origin
6. Extended beyond
property of origin
7. Confined to roof/attic space
Sprinkler protection (where method of fire control was not the sprinkler system)
All residential properties % (n = 650) Apartment % (n = 369) Single detached % (n = 42)

10
TABLE 6. ACTION OF FIRE CASUALTY (INJURIES AND DEATHS) BY SPRINKLER PROTECTION STATUS
No sprinkler protection Sprinkler protection
Action of casualty #
Injuries %
Injuries #
Deaths %
Deaths #
Injuries %
Injuries Death
Injured while attempting to escape 125 19.1% 24 16.8%
3 9.1% 0 Over-exertion / heart attack 4 0.6% 2 1.4%
0 0.0% 0
Voluntarily entered/remained - rescue 42 6.4% 4 2.8%
1 3.0% 0
Voluntarily entered/remained - fire fighting 226 34.5% 2 1.4%
20 60.6% 0 Voluntarily entered/remained - property 39 6.0% 1 0.7%
0 0.0% 0
Loss of judgement/panic 28 4.3% 9 6.3%
0 0.0% 0 Received delayed warning 12 1.8% 5 3.5%
0 0.0% 0
Did not act 34 5.2% 24 16.8%
1 3.0% 0 Unclassified 60 9.2% 8 5.6%
8 24.2% 0
Unknown 85 13.0% 64 44.8%
8 24.2% 1
Total 655 100.0% 143 100.0% 41 100.0% 1
As is indicated by Table 7 there were relatively even distributions of causes of fire-related injury in residential structure fires that occurred regardless of sprinkler protection status. The major cause of injury in all cases was smoke inhalation, which also caused 54% of the deaths.
TABLE 7. CAUSE OF FIRE-RELATED CASUALTY (INJURIES AND DEATHS) BY SPRINKLER PROTECTION STATUS
No sprinkler protection Sprinkler protection
Cause of fire-related casualty #
Injuries %
Injuries #
Deaths %
Deaths #
Injuries %
Injuries Death
Smoke inhalation 304 46.4% 77 53.8%
16 39.0% 0 Burns - fire/flames 185 28.2% 15 10.5%
9 22.0% 0
Burns - hot substances 63 9.6% 1 0.7%
7 17.1% 0 Struck by objects/persons 10 1.5% 0 0.0%
0 0.0% 0
Injury - falls 29 4.4% 0 0.0%
2 4.9% 0 Injury - explosives 2 0.3% 0 0.0%
0 0.0% 0
Unclassified 36 5.5% 4 2.8%
5 12.2% 0
Unknown 26 4.0% 46 32.2%
2 4.9% 1
Total 655 100.0% 143 100.0% 41 100.0% 1
As detailed in Table 2 (p.3), there were no fire fighter casualties as a result of the fires examined in the production of this report. To provide some additional information about the extent of injuries that were experienced by the casualties in this sample, Table 8 explores injury severity as a function of sprinkler protection status, for both fire fighters and civilians. Although there were no significant differences in the severity of injury sustained (Table 8), the following summary trends are worth noting. Casualties who sustained injuries were: (a) 87.4% civilian, (b) 94.1% located in buildings without sprinkler protection, (c) only serious (≥ 3 days in hospital/> 15 days off work) 12.4% of the time, (d) serious in the presence of sprinkler protection 0.4% of the time, and (e) never involved a serious injury to a fire fighter in the presence of sprinklers. When viewed as a rate per 1,000 fires as a function of sprinkler protection status, two patterns are worth highlighting:

11
• Injury rate for fire fighters was 2.0 times greater in buildings without sprinkler protection;7 and • Injury rates for civilians were significantly higher than those for fire fighters for fires that occurred in
buildings with sprinklers (9.3 times more frequent) and without sprinklers (6.8 times more frequent).8
TABLE 8. SEVERITY OF INJURIES (%) AND INJURY RATES FOR CIVILIANS AND FIRE FIGHTERS BY SPRINKLER PROTECTION STATUS
Civilian injuries (n=608) Fire fighter injuries* (n=88)
Severity of injuries No sprinkler protection (n=571)
Sprinkler protection (n=37) No sprinkler
protection (n=84) Sprinkler
protection (n=4) < 1 day in hospital/off work 55.0% 67.6% 56.0% 75.0% 1-2 days in hospital and/or off work 1-15 days 30.5% 24.3% 36.9% 25.0%
≥ 3 days in hospital and/or off work > 15 days 14.5% 8.1% 7.1% 0.0%
Total 100.0% 100.0% 100.0% 100.0%
Injury rate per 1,000 fires 63.6 43.0 9.4 4.7 * The OFC data codes this as fire fighter/police/RCMP combined.
Conclusions Overall, these results strongly indicate that residential sprinkler systems have a significant positive impact in reducing fire-related casualties. The death and injury rates per 1,000 fires were significantly lower for fires that occurred in buildings that were protected by sprinkler systems. Fire department resources were required less frequently and less extensively to control fires in buildings that were protected by sprinklers. For the cases examined here, when sprinklers did control fires, they never extended beyond the building of origin, and were contained to the room of origin 1.5 times more often than fires in buildings without sprinkler protection (which reached the building of origin 24% of the time and beyond the building of origin 5% of the time). In addition to the fact that injuries occurred less frequently in fires that took place in buildings with sprinklers, when they did occur it was more likely that the casualty was trying to fight the fire voluntarily. No fire fighter deaths were involved in the cases examined here, and a serious injury to a fire fighter was not observed in the presence of a sprinkler system.
In combination with the previous analysis from this dataset that looked at smoke alarms and the impact of these safety devices on fire-related casualties [11], the general patterns that have emerged from BC data appear entirely consistent with those cited by the US Fire Administration [3]:
1. When fire sprinklers alone are installed in a residence, the chances of dying in a fire are reduced by 69%, when compared to a residence without sprinklers.
2. When smoke alarms alone are installed in a residence, a reduction in death rate of 63% can be expected, when compared to a residence without smoke alarms.
3. When both smoke alarms and fire sprinklers are present in a home, the risk of dying in a fire is reduced by 82%, when compared to a residence without either.
Thankfully, there have been so few fire-related fatalities in sprinkler protected buildings in BC, these US Fire Administration estimates are an appropriate best guess for likely outcomes locally with respect to smoke
7 Differences were not significant with planned comparison returning Z = 1.37. 8 Differences were significant with planned comparisons returning Z’s > |1.96|.

12
alarms and residential sprinkler systems. Although we cannot calculate a reliable additional benefit of having both sprinkler systems and functioning smoke alarms, based on the findings from this research and those previously released [12], it can be concluded that fire-related death rates do reduce by 42.4% with working smoke alarms and 92.7% with sprinkler systems.
With respect to the applied implications for these findings and targeting fire prevention/public safety resources, it is important to acknowledge the fact that the presence of both a sprinkler system and a functioning smoke alarm may be a proxy measure for affluence and relative social advantage [5]. This pattern, in addition to the uneven distribution of risk known to be associated with not having a functioning smoke alarm [11-13], mean that targeted prevention efforts associated with sprinklers and smoke alarms should build on equivalent logic, focusing on elderly citizens, the impoverished, and the vulnerable members of society who need help first.
References [1] L.J. Warda and M.F. Ballesteros, Interventions to prevent residential fire injury, in Handbook of Injury and Violence
Prevention, L. Doll, S. Bonzo, and J. Mercy, Editors. 2007. p. 97-115. [2] D.T. Butry, M.H. Brown, and S.K. Fuller, Benefit-cost analysis of residential fire sprinkler systems, NISTIR 7451,
2007, National Institute of Standards and Technology: Gaithersberg, MD. [3] U.S. Fire Administration. USFA position on residential fire sprinklers. 2008 [cited 2012 28 September]; Available
from: http://www.usfa.fema.gov/about/position_statements/sprinklers_position.shtm. [4] N. Bénichou, D. Yung, and G. Hadjisophocleous, Impact of fire department response and mandatory sprinkler
protection on life risks in residential communities, 1999, National Research Council: Ottawa. p. 8. [5] D.T. Butry, Comparing the performance of residential fire sprinklers with other life-safety technologies. Accident
Analysis and Prevention, 2012. 48: p. 480-494. [6] BCStats. Population estimates. 2012 [cited 2012 10 September]; Available from:
http://www.bcstats.gov.bc.ca/StatisticsBySubject/Demography/PopulationEstimates.aspx. [7] M. Gilbert, M. Dawar, and R. Armour, Fire-related deaths among aboriginal people in British Columbia, 1991-2001.
Canadian Journal of Public Health, 2006. 97(4): p. 300-304. [8] M. Wijayasinghe, Making sense of smoke alarm data and home fire deaths. Alberta Fire News, 2004. August: p. 16-
19. [9] BCStats, Overview of the BC and regional population projections 2011 to 2036, 2011, BCStats. p. 8. [10] L. Garis and J. Clare, Significance of area of origin for fires that commence on the balconies of multi-residential
buildings, in press, Centre for Public Safety and Criminal Justice Research, School of Criminology and Criminal Justice, University of the Fraser Valley.
[11] L. Garis and J. Clare, Smoke alarms work, but not forever: posing the challenge of adopting multifaceted, sustained, interagency responses to ensuring the presence of a functioning smoke alarm, 2012, Centre for Public Safety and Criminal Justice Research, School of Criminology and Criminal Justice, University of the Fraser Valley.
[12] J. Clare, et al., Reduced frequency and severity of residential fires following delivery of fire prevention education by on-duty fire fighters: cluster randomised controlled study. Journal of Safety Research, 2012. 43: p. 123.128.
[13] K. Wuschke, J. Clare, and L. Garis, Interpreting temporal and geographic clustering of fires within the context of environmental criminology theory. Fire Safety Journal, in press.
Author Biographical Information and Acknowledgements Len Garis is the Fire Chief for the City of Surrey, B.C. and is an Adjunct Professor in the School of Criminology and Criminal Justice at the University of the Fraser Valley and a member of the Institute of Canadian Urban Research Studies, Simon Fraser University. Contact him at [email protected].
Dr Joseph Clare, strategic planning analyst for the Surrey Fire Service, is an Associate Professor in the Crime Research Centre, University of Western Australia, and a member of the Institute of Canadian Urban Research Studies, Simon Fraser University. Contact him at [email protected].
Special thanks to Rebecca Denlinger, BC Fire Commissioner and Shelley Ballantyne, Emergency Management BC, for the provision of the BC data discussed in this report, without whom this work would not have been possible.