Spring Thaw? Before Looking At The Near Term Situation, Let’s Take A Longer Term Perspective.
48
-
Upload
brett-hunter -
Category
Documents
-
view
217 -
download
3
Transcript of Spring Thaw? Before Looking At The Near Term Situation, Let’s Take A Longer Term Perspective.


Spring Thaw?Spring Thaw?


Before Looking At The Near Before Looking At The Near Term Situation, Let’s Take A Term Situation, Let’s Take A
Longer Term PerspectiveLonger Term Perspective

5.35.8
-0.5-0.2
5.3
4.6
5.6
3.2
-0.2
2.5
-1.9
4.5
7.2
4.1
3.5 3.4
4.1
3.5
1.9
-0.2
3.3
2.7
4.0
2.5
3.7
4.54.2
4.5
3.7
0.8
1.6
2.5
3.6
2.9 2.8
2.0
1.1
72 74 76 78 80 82 84 86 88 90 92 94 96 98 00 02 04 06 08
The U.S. Has A Good RecordThe U.S. Has A Good RecordThe Pessimists are Usually WrongThe Pessimists are Usually Wrong
Real Gross Domestic Product, % ChangeReal Gross Domestic Product, % Change
Recession years

5.35.8
-0.5-0.2
5.3
4.6
5.6
3.2
-0.2
2.5
-1.9
4.5
7.2
4.1
3.5 3.4
4.1
3.5
1.9
-0.2
3.3
2.7
4.0
2.5
3.7
4.54.2
4.5
3.7
0.8
1.6
2.5
3.6
2.9 2.8
2.0
1.1
72 74 76 78 80 82 84 86 88 90 92 94 96 98 00 02 04 06 08
The U.S. Has A Good RecordThe U.S. Has A Good RecordThe Pessimists are Usually WrongThe Pessimists are Usually Wrong
Real Gross Domestic Product, % ChangeReal Gross Domestic Product, % Change
Recession yearsLongest expansion in Longest expansion in
historyhistory
Mild recession
Longest peace Longest peace time expansion in time expansion in
historyhistory

5.35.8
-0.5-0.2
5.3
4.6
5.6
3.2
-0.2
2.5
-1.9
4.5
7.2
4.1
3.5 3.4
4.1
3.5
1.9
-0.2
3.3
2.7
4.0
2.5
3.7
4.54.2
4.5
3.7
0.8
1.6
2.5
3.6
2.9 2.8
2.0
1.1
72 74 76 78 80 82 84 86 88 90 92 94 96 98 00 02 04 06 08
The U.S. Has A Good RecordThe U.S. Has A Good RecordThe Pessimists are Usually WrongThe Pessimists are Usually Wrong
Real Gross Domestic Product, % ChangeReal Gross Domestic Product, % Change
Recession years
Mild recession
What about the economy now?What about the economy now?
Longest peace Longest peace time expansion in time expansion in
historyhistory
17 years of growth in real GDP17 years of growth in real GDP

Things Look Pretty Bad Right Now, ButThings Look Pretty Bad Right Now, But
• The election delayed policy to aid the economy for months
• Only recently has a tax and spending stimulus plan been passed, let along had time to affect the economy
• The new financial stability plan has just been developed and not yet implemented
• Except for ½ of the TARP, the policy response has been limited to monetary policy– Liquidity has increased– Credit markets have improved
Let’s look at the numbersLet’s look at the numbers

Two Consecutive Declines in Real GDPTwo Consecutive Declines in Real GDP
-8.0
-6.0
-4.0
-2.0
0.0
2.0
4.0
6.0
8.0
80:181:182:183:184:185:186:187:188:189:190:191:192:193:194:195:196:197:198:199:100:101:102:103:104:105:106:107:108:1
Recession
Percent Change From Prior Quarter at Annual RatePercent Change, Same Quarter, Prior Year

ISM Manufacturing Index Drops To ISM Manufacturing Index Drops To Very Low Levels Very Low Levels
Some hope?

Real Consumer SpendingReal Consumer SpendingDrops To Very Low Levels Drops To Very Low Levels
Some hope?

Employment Decline Worse Than 1982Employment Decline Worse Than 1982

Unemployment Rate Still Below 1982 LevelsUnemployment Rate Still Below 1982 Levels
As long as we’re talking about employmentAs long as we’re talking about employment

Unemployment Claims ExaggeratedUnemployment Claims ExaggeratedInitial ClaimsInitial Claims
Also Continuing ClaimsAlso Continuing Claims
Date Claims Workers %
Apr 4, 2009 654,000 134,500,000 0.49%
Oct 2,1982 695,000 88,894,000 0.78%

Unemployment Claims ExaggeratedUnemployment Claims ExaggeratedContinuing ClaimsContinuing Claims
Anything positive?Anything positive?
DateContinuing
Claims Workers %
Mar 28, 2009 5,840,000 133,019 ,000 4.4%
Nov 6, 1982 4,713,000 88,770,000 5.3%

Yes! Productivity Yes! Productivity Growth Remains StrongGrowth Remains Strong

Yes! Productivity Yes! Productivity Growth Remains StrongGrowth Remains Strong
Anything else positive?Anything else positive?

Oil/Gasoline Prices Oil/Gasoline Prices Are Down SharplyAre Down Sharply
Higher oil prices in 2008 were like a $170 billion tax increase and lower prices in 2009 are like a $355 billion tax cut = $525 billion positive swing

Oil/Gasoline Prices Oil/Gasoline Prices Are Down SharplyAre Down Sharply
It’s not just energyIt’s not just energy
Higher oil prices in 2008 were like a $170 billion tax increase and lower prices in 2009 are like a $355 billion tax cut = $525 billion positive swing

Commodity Prices Commodity Prices Are Down SharplyAre Down SharplyCRB IndexesCRB Indexes

Commodity Prices Commodity Prices Are Down SharplyAre Down SharplyCRB IndexesCRB Indexes
Then why are things bad?Then why are things bad?

What HappenedWhat Happened• Very low interest rates to prevent deflation
• Government pressure to increase home ownership
• Excess global savings created demand for assets
• Securitization created supply of complex securities backed by subprime adjustable rate mortgages
• Complex securities rated too high leading to excess leverage
• Easy mortgages drove up house prices and construction• Houses became unaffordable• Interest rates increased• Remaining buyers couldn’t afford houses• House prices dropped and construction tanked
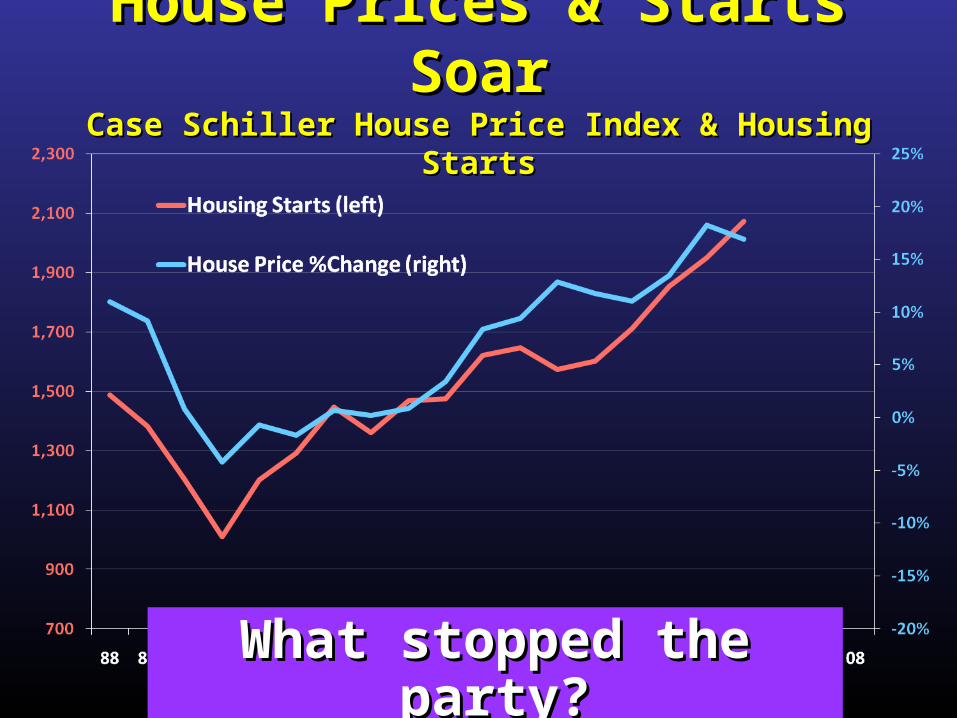
House Prices & Starts SoarHouse Prices & Starts SoarCase Schiller House Price Index & Housing StartsCase Schiller House Price Index & Housing Starts
What stopped the party?What stopped the party?
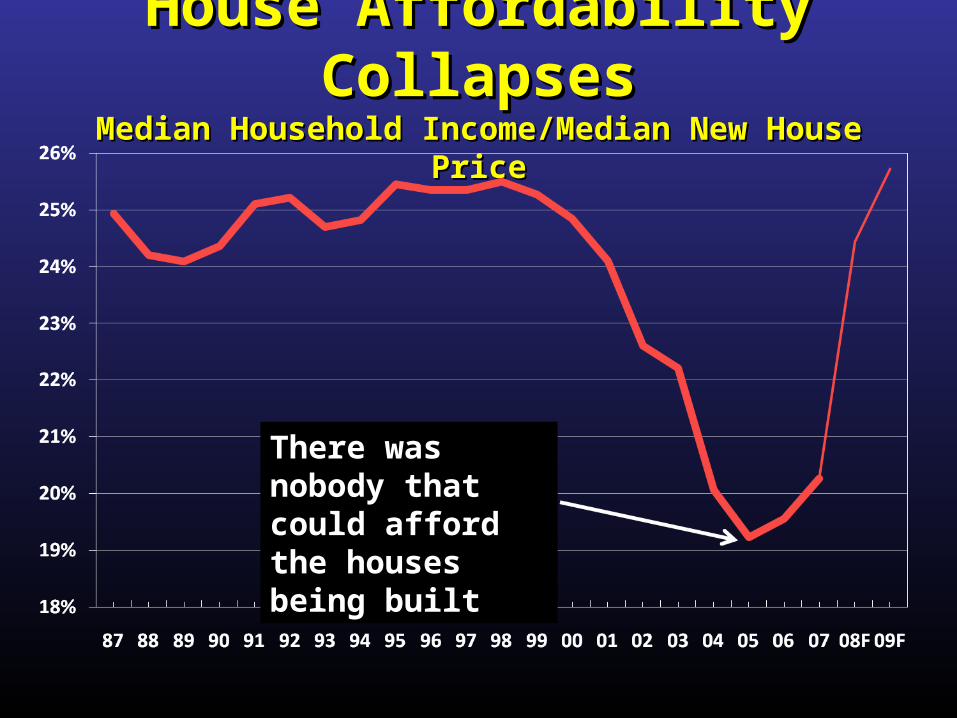
House Affordability CollapsesHouse Affordability CollapsesMedian Household Income/Median New House PriceMedian Household Income/Median New House Price
There was nobody that could afford the houses being built
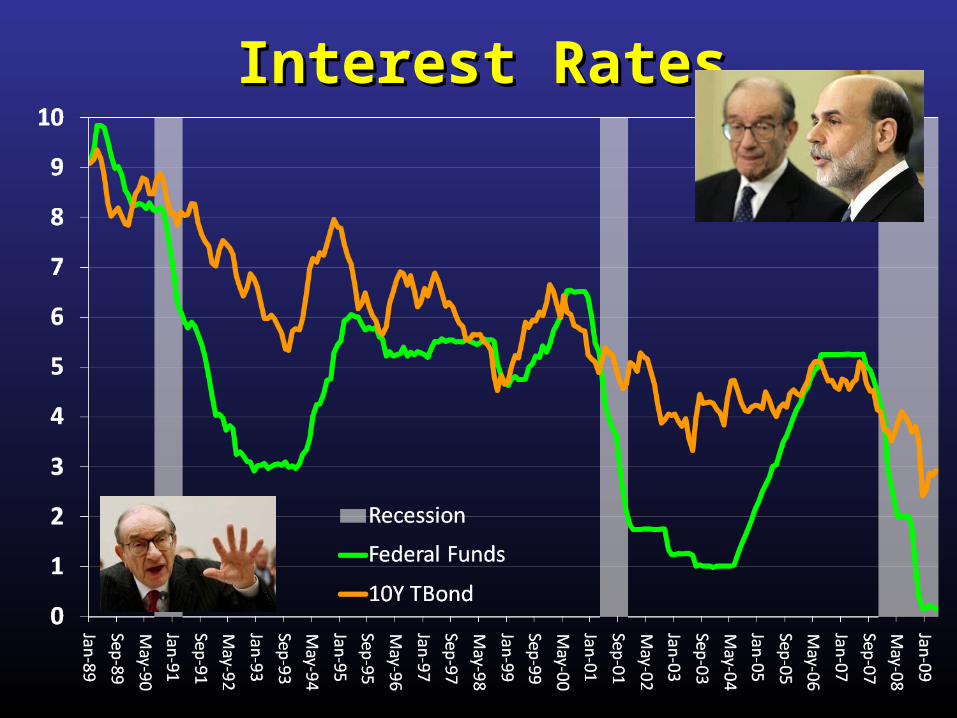
Interest RatesInterest Rates

Interest RatesInterest Rates

House Prices & Starts CollapseHouse Prices & Starts CollapseCase Schiller House Price Index & Housing StartsCase Schiller House Price Index & Housing Starts

ForeclosuresForeclosures
Subprime - Adjustable

ResultsResults• Home foreclosures• Mortgage backed securities declined in value and
were down-rated• Holders, including most major financial
institutions, were forced to mark them down sharply (recently modified)
• Capital problems for financial institutions• Uncertainty about future capital positions created
a general tightening of credit to all borrowers• Without access to credit overall spending
collapsed

All Home Mortgages Suffer as Banks TightenAll Home Mortgages Suffer as Banks TightenNet % Senior Loan Officers Reporting Tighter Lending StandardsNet % Senior Loan Officers Reporting Tighter Lending Standards
-40
-20
0
20
40
60
80
100
120
90:391:191:392:192:393:193:394:194:395:195:396:196:397:197:398:198:399:199:300:100:301:101:302:102:303:103:304:104:305:105:306:106:307:107:308:108:309:1
RecessionAll MortgagesPrimeSubprime

Business Loans Also Suffer As Banks TightenBusiness Loans Also Suffer As Banks TightenNet % Senior Loan Officers Reporting Tighter Lending StandardsNet % Senior Loan Officers Reporting Tighter Lending Standards
-40
-20
0
20
40
60
80
100
90:3
91:1
91:3
92:1
92:3
93:1
93:3
94:1
94:3
95:1
95:3
96:1
96:3
97:1
97:3
98:1
98:3
99:1
99:3
00:1
00:3
01:1
01:3
02:1
02:3
03:1
03:3
04:1
04:3
05:1
05:3
06:1
06:3
07:1
07:3
08:1
08:3
09:1
RecessionCommercial & IndustrialCommercial Real Estate

Consumer Loans Also Harder to GetConsumer Loans Also Harder to GetNet % Senior Loan Officers Reporting Tighter Lending StandardsNet % Senior Loan Officers Reporting Tighter Lending Standards
-20
-10
0
10
20
30
40
50
60
70
80
96
:1
96
:3
97
:1
97
:3
98
:1
98
:3
99
:1
99
:3
00
:1
00
:3
01
:1
01
:3
02
:1
02
:3
03
:1
03
:3
04
:1
04
:3
05
:1
05
:3
06
:1
06
:3
07
:1
07
:3
08
:1
08
:3
09
:1
Recession
Credit Cards
Other Consumer Loans
Doesn’t sound good, Doesn’t sound good, what’s being done?what’s being done?

Past Fed/Treasury ActionsPast Fed/Treasury Actions
• Lowered interest rates• Increased lending to major financial
institutions• Provided liquidity directly to credit
markets• Supported money market funds• Supported commercial paper market• Injected capital directly into banks
How did it work?

Fed cuts not working
Short-Term Interest RatesShort-Term Interest Rates

Long-Term Interest RatesLong-Term Interest Rates
Fed actions will bring mortgage rates down from 6.5% to about 4.5%, equivalent to a 20% reduction in mortgage principal

Further Help Is On The WayFurther Help Is On The WayEconomic Recovery & Reinvestment PlanEconomic Recovery & Reinvestment Plan
• $500 billion government spending
• $287 billion of tax cuts
• Largest fiscal stimulus since World War II (bigger than Great Depression stimulus)

Federal Budget DeficitFederal Budget Deficit% of GDP% of GDP
Recession That’s a lot of stimulus

Further Help Is On The Way Further Help Is On The Way Financial Stability Plan + Fed Financial Stability Plan + Fed
• Major expansion of support for consumer, auto, floorplan, student, commercial real estate, and small business loan securitization (up to $1 trillion)
• Mortgage/home owner support program• Expanded support for mortgage market ($1.25
trillion)• Program to reduce the negative impact of
troubled assets on the banking system (up to $1 trillion)
• Fed purchase of long term Treasury securities ($300 billion in next 6-months)

Further Help Is On The Way Further Help Is On The Way Financial Stability Plan + Fed Financial Stability Plan + Fed
• Major expansion of support for consumer, auto, floorplan, student, commercial real estate, and small business loan securitization (up to $1 trillion)
• Mortgage/home owner support program• Expanded support for mortgage market ($1.25
trillion)• Program to reduce the negative impact of
troubled assets on the banking system (up to $1 trillion)
• Fed purchase of long term Treasury securities ($300 billion in next 6-months)How many $How many $

Total Commitment $12.1 trillion
Total Spent$2.5 trillion
http://www.nytimes.com/interactive/2009/02/04/business/20090205-bailout-totals-graphic.html
As Of April 1, 2009

Total Commitment $12.1 trillion
Total Spent$2.5 trillion
http://www.nytimes.com/interactive/2009/02/04/business/20090205-bailout-totals-graphic.html
As Of April 1, 2009

What Will Happen?What Will Happen?• It hasn’t happened before
• Unprecedented global financial crisis
• Unprecedented global response
Net result – serious recession
• 2.0% decline in 2009 real GDP and peak unemployment rate of about 10%
• May or may not be the worst recession since World II, but not a depression!

What Will Prevent A Depression And Make What Will Prevent A Depression And Make The Decline Stop?The Decline Stop?
• Automatic stabilizers that did not exist at the beginning of the depression
– Social Security– Unemployment compensation– Welfare, Medicare, Medicaid– Large federal government
• Massive fiscal stimulus• Extremely aggressive Federal Reserve and Treasury actions• Lower energy prices• Higher housing affordability• Pent-up auto demand• Inventory swing • &

Policy Makers Are DeterminedPolicy Makers Are Determined
But we will not stand down until we have achieved our goals of repairing and reforming our financial system and restoring prosperity.
This is a challenge more complex than any our financial system has ever faced, requiring new programs and persistent attention to solve. But the President, the Treasury and the entire Administration are committed to see it through because we know how directly the future of our economy depends on it.
“… we must move forward, quickly and aggressively, with a middle-class rescue plan that will create jobs, provide relief to families, help homeowners and restore our financial system,"
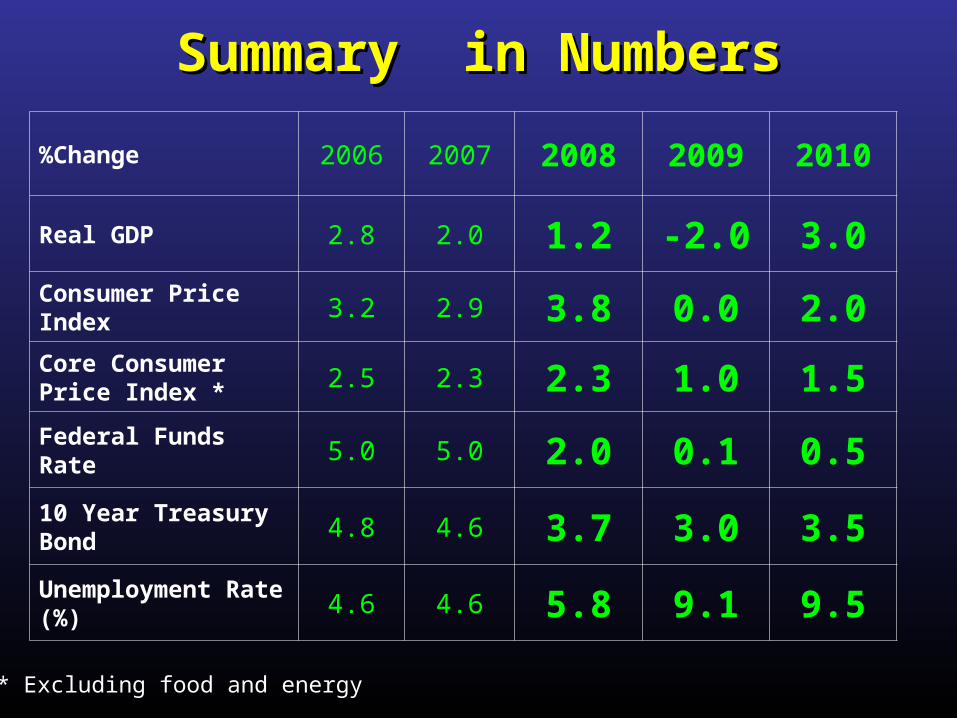
%Change 2006 2007 2008 2009 2010
Real GDP 2.8 2.0 1.2 -2.0 3.0
Consumer Price Index 3.2 2.9 3.8 0.0 2.0Core Consumer Price Index * 2.5 2.3 2.3 1.0 1.5
Federal Funds Rate 5.0 5.0 2.0 0.1 0.5
10 Year Treasury Bond 4.8 4.6 3.7 3.0 3.5
Unemployment Rate (%) 4.6 4.6 5.8 9.1 9.5
Summary in NumbersSummary in Numbers
* Excluding food and energy

Take AwaysTake Aways