
Spring 2021 Volume 10, Issue 1 The Crater Chronicle
6
The Crater Chronicle National Weather Service - Medford, Oregon Spring 2021 Volume 10, Issue 1 Tohoku Anniversary 1-2 Cool Season Lightning 2-3 Wintry Travel in the Spring 4 Expressing Uncertainty 5 About Us 6 Inside This Issue Spring Began on March 20th at 2:37 am PDT. The Ten Year Anniversary of the Japanese Earthquake and Tsunami of March 11, 2011 Ryan Sandler, Warning Coordination Meteorologist I can’t believe it’s been 10 years since the Tohoku earthquake and tsunami off the Japanese coast. It seems like only yesterday that I received a call in the middle of the night to come into work because a tsunami was racing toward the West Coast. I was tired but excited because I’m fascinated by the science of tsunamis. As is typical of many large earthquakes, it was initially underestimated with a 7.9 magnitude but was quickly upgraded to an 8.9. That may not sound like a big up- grade but on the earthquake scale it’s a huge difference. That 1.0 increase unleash- es 32 times more energy. It was eventually upgraded to between 9.0 and 9.1 which made it the 4th largest earthquake ever recorded. As the Japanese coast was getting devastated by tsunamis surging more than 30 feet in some locations, much of that undersea earthquake energy was speeding across the Pacific Ocean. About two hours after the initial earthquake, the tsunami reached the first deep-water tsunami buoy. This buoy measured a change of more A historical marker located in Brookings-Harbor
Transcript of Spring 2021 Volume 10, Issue 1 The Crater Chronicle

The Crater Chronicle
National Weather Service - Medford, Oregon
Spring 2021
Volume 10, Issue 1
Tohoku Anniversary 1-2
Cool Season Lightning 2-3
Wintry Travel in the Spring 4
Expressing Uncertainty 5
About Us 6
Inside This Issue
Spring Began on
March 20th at
2:37 am PDT.
The Ten Year Anniversary of the Japanese Earthquake and Tsunami of March 11, 2011
Ryan Sandler, Warning Coordination Meteorologist
I can’t believe it’s been 10 years since the Tohoku earthquake and tsunami off the Japanese coast. It seems like only yesterday that I received a call in the middle of the night to come into work because a tsunami was racing toward the West Coast. I was tired but excited because I’m fascinated by the science of tsunamis. As is typical of many large earthquakes, it was initially underestimated with a 7.9 magnitude but was quickly upgraded to an 8.9. That may not sound like a big up-grade but on the earthquake scale it’s a huge difference. That 1.0 increase unleash-es 32 times more energy. It was eventually upgraded to between 9.0 and 9.1 which made it the 4th largest earthquake ever recorded.
As the Japanese coast was getting devastated by tsunamis surging more than 30 feet in some locations, much of that undersea earthquake energy was speeding across the Pacific Ocean. About two hours after the initial earthquake, the tsunami reached the first deep-water tsunami buoy. This buoy measured a change of more
A historical marker located in Brookings-Harbor
The Crater Chronic le Volume 10, Issue 1 Page 2
than 3 ½ feet in water level. It doesn’t sound like much but just a 6-inch change in the deep ocean would have been significant. If you were on a boat near that buoy, you wouldn’t even notice this tsunami wave racing under-neath you because this 3 ½ feet change occurred over 18 minutes. When the tsunami reached the West Coast, it luckily occurred near low tide so there was little coastal inundation. If it had occurred during high tide, it would have been a much worse situation. However, strong tsunami currents pushed in and out of the harbors causing damage to docks and boats up and down the West Coast. In Oregon, the worst damage was in the Port of Brookings-Harbor where 7 million dollars worth of damage occurred. In Oregon, a major federal disaster was declared for Curry, Coos, and Lincoln counties. In Japan, nearly 16,000 people were killed with around 360 billion dollars of damage. By comparison, we were very lucky, but it is only a matter of time before we experience a great subduction zone earthquake off our coast. The last earthquake of around 9.0 off our coast occurred in 1700 and we could see another one in our lifetime. The NWS is proud to sponsor TsunamiReady communities, and we will continue to work on earthquake and tsunami preparedness with our partners and communities. For more information on the TsunamiReady program go to https://www.weather.gov/TsunamiReady/
T he warm season is when the majority of lightning activity in the United States occurs. During the cool season, lightning activity drops because the charge separation needed for lightning to occur is more difficult to achieve. As warm rain processes are replaced by ice production in clouds during the cool season, water no longer exists in dif-ferent phases, and charge separation is inhibited. Cool season lightning is most common downwind of the Great
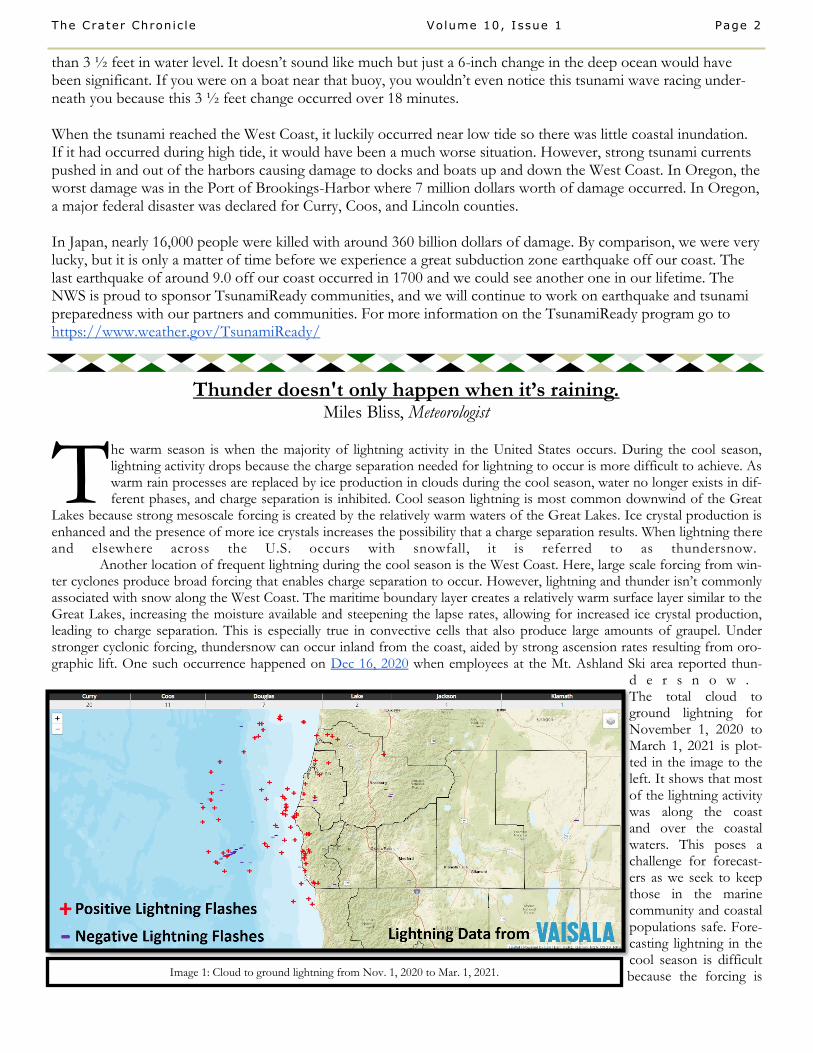
Lakes because strong mesoscale forcing is created by the relatively warm waters of the Great Lakes. Ice crystal production is enhanced and the presence of more ice crystals increases the possibility that a charge separation results. When lightning there and elsewhere across the U.S. occurs with snowfall, it is referred to as thundersnow. Another location of frequent lightning during the cool season is the West Coast. Here, large scale forcing from win-ter cyclones produce broad forcing that enables charge separation to occur. However, lightning and thunder isn’t commonly associated with snow along the West Coast. The maritime boundary layer creates a relatively warm surface layer similar to the Great Lakes, increasing the moisture available and steepening the lapse rates, allowing for increased ice crystal production, leading to charge separation. This is especially true in convective cells that also produce large amounts of graupel. Under stronger cyclonic forcing, thundersnow can occur inland from the coast, aided by strong ascension rates resulting from oro-graphic lift. One such occurrence happened on Dec 16, 2020 when employees at the Mt. Ashland Ski area reported thun-
d e r s n o w . The total cloud to ground lightning for November 1, 2020 to March 1, 2021 is plot-ted in the image to the left. It shows that most of the lightning activity was along the coast and over the coastal waters. This poses a challenge for forecast-ers as we seek to keep those in the marine community and coastal populations safe. Fore-casting lightning in the cool season is difficult because the forcing is
Thunder doesn't only happen when it’s raining. Miles Bliss, Meteorologist
Image 1: Cloud to ground lightning from Nov. 1, 2020 to Mar. 1, 2021.

The Crater Chronic le Volume 10, Issue 1 Page 3
not as strong and pro-nounced as in the warm sea-s o n . Exiting the cool season and emerging i n t o t h e warmer spring months, light-ning activity i n v a r i a b l y picks up. Cli-matologically, the first peak is between mid-April and the first week of May as seen high-lighted in the
black box above. There is also a transition from the activity being centered at the coast, to spreading further inland. The image below shows a density map of cloud to ground lightning strikes in southwest Oregon and northern California; the deeper the purple coloring, the more lightning strikes occur in that area. Before lightning activity makes its seasonal shift inland, we recommend that you re-familiarize yourself with lightning safety information by visiting https://www.weather.gov/safety/lightning.
Image 2: Lightning Climatology for Siskiyou County. The black box shows where lightning begins to pick up in an inland County.
Image 3: Lightning density for the month of May. The darker the purple shading, the more lightning strikes occur in that area.

The Crater Chronic le Volume 10, Issue 1 Page 4
E ver wonder why snow has a harder time sticking to the roads during the spring months (March, April), especially during the daylight hours? There are a number of factors for this. The main contributing factor is a
higher sun angle and longer daylight hours. The tilt of the earth as it orbits around the sun causes the rays to strike the Northern Hemisphere at higher and higher angle through the spring. As the sun angle becomes higher, the more direct rays provide greater heating to the road surface compared to the winter as the sunlight becomes more concentrated on road surfaces (right). At the same time, there are more hours in the day, thus providing a longer period of time for road surface temperatures to warm up. As a re-sult, it must snow at a heavier rate compared to the night time or in the winter in order for it to accumulate during the daytime. Meteorologists factor in the intensity of snowfall rates, time of day and surface temperatures as well as strength and track of the storm when making a snowfall forecast and determining the potential impacts on travel. Because of the stronger sun angle, more heat from the sun is directed to the road surface and it can be
very warm. At the same time heating is also occurring below the surface because of conduc-tion (left). After sunset, both air and surface road temperatures drop. However, heat from the sun’s energy that is stored below the road surface is directed to-wards the surface, which slows the rate of cooling. Another, minor factor involves friction from vehicle tires and automobile exhaust which also aids in warming of the roads.
Spring Time Snow & Road Accumulation
Mike Petrucelli, Meteorologist
Image courtesy of MassLive.com
Image courtesy of Hindawi.com

The Crater Chronic le Volume 10, Issue 1 Page 5
U sing two to four deterministic models to build a forecast has worked well in explaining the
dynamics that cause a weather event to play out. The number of outcomes that forecasters
were able to foresee were limited in this methodology, and this initiated the development of
ensembles. Although forecasters are still able to determine why certain impacts are forecast,
ensembles have allowed for previously unanticipated weather events to be anticipated. This in a way, has
turned weather forecasting from trying to predict what could be possible, to eliminating the scenarios with-
in the ensembles that do not seem reasonable. However, trying to reflect this information in a single value
forecast has become a challenging pursuit. It would be better to present this ensemble information to the
public in a way that is easily understood.
This pursuit to enhance forecasts has meteorologists using tools to assess the probabilities of certain
thresholds and various scenarios based on the ensemble output. For meteorologists, we have a plethora of
tools to express this such as density functions, exceedance probabilities, clustering, neighborhood probabil-
ities and more. One day multiple forms of this information may be available, but for now, we are exploring
communicating exceedance probabilities.
In exceedance probabilities, the forecast information is in terms of how likely an event is to be above or
below a certain value. To do this, three pieces of information are presented and the graphic below repre-
sents an example of how that may look. The first exceedance probability represents a 90% chance that the
given value is exceeded. This implies that 10% of the time, the observed value is lower than the forecast
value. Next is what is most likely, and this is what you would find in our forecast. The second exceedance
threshold represents a 10% chance of a larger value occurring than what was expected.
This new shift does require some introspection by the forecast user. The reflection requires one to deter-
mine how much risk can be taken on. In our example graphic below, if you needed to travel through the
Diamond Lake area but could not do so if 4” or greater of snow fell, would you be willing to make that
journey knowing that the chance of less than 4” of snow occurring is only 10%?
Expressing Uncertainty
Miles Bliss, Meteorologist

The Crater Chronic le Volume 10, Issue 1 Page 6
Our Vision
Professionals focusing on science, teamwork, and customer service to design and deliver the best decision-support information to our com-munity.
Our Mission
Our team at the National Weather Service Office in Medford strives to deliver the best observational, forecast, and warning infor-mation through exceptional customer service, extensive training and education, maintaining quality electronic systems, and relying upon an outstanding team of weather spotters and cooperative observers. We do this within the overall mission of the NWS to build a Weather-Ready Nation:
To provide weather, hydrologic, and climate forecasts and warnings for the United States, its territories, adjacent waters and ocean are-as, for the protection of life and property and the enhancement of the national economy. NWS data and products form a national infor-mation database and infrastructure which can be used by other gov-ernmental agencies, the private sector, the public, and the global community.
Our Values
Trust, Integrity, Professionalism, Service, Teamwork, Ingenuity, Expertise, and Enthusiasm.
National Weather Service
Medford Weather Forecast
Office
4003 Cirrus Drive
Medford, OR 97504-4198
Visit Our Website!
http://www.weather.gov/medford
Phone: (541) 773-1067
Email: [email protected]
Newsletter Editor:
Misty Firmin, Meteorologist
Email: [email protected]
National Weather Service - Medford, Oregon
About Us
The Weather Forecast Office in Medford, Ore-
gon, is one of more than 120 field offices of the
National Weather Service, an agency under the
National Oceanic and Atmospheric Administra-
tion and the United States Department of Com-
merce. The Weather Forecast Office in Med-
ford serves 7 counties in southwestern Oregon
and 2 counties in northern California, providing
weather and water information to more than a
half-million citizens. We are also responsible
for the coastal waters of the Pacific Ocean from
Florence, Oregon, to Point St. George, Califor-
nia, extending 60 miles offshore. The office is
staffed 24 hours a day, 7 days a week, and 365
days a year by a team of 26 meteorologists, hy-
drologists, electronic technicians, hydro-
meteorological technicians, and administrative
assistants.
www.facebook.com/NWSMedford
www.twitter.com/NWSMedford


