Spring 2010 APMV Complete Illustrative Solutions...Babbel & Fabozzi, Investment Management for...
51
APMV Spring 2010 Solutions Page 1 APMV Complete Illustrative Solutions Spring 2010 1. Learning Objective: (5b) Identify and describe financial and non-financial risks faced by an entity, including but not limited to: Currency risk, credit risk, spread risk, liquidity risk, interest rate risk, equity risk, product risk, operational risk, legal risk and political risk. Source: Babbel & Fabozzi, Investment Management for Insurers, Chapter 19. Commentary on Question: This is a recall and synthesis question asking candidates to (a) explain how currency risk impacts a particular situation, (b) how currency risk is mitigated, and (c) the impact and mitigation of credit risk. Solution: (a) Investment income will be converted to US dollars at point-in-time currency exchange rates. Exchange rates may be volatile causing fluctuation in investment income and operating income. (b) Swaps, forwards, and futures have BoD approval. Swaps and forwards allow for exact matching of dates and amounts of foreign cash flow. Futures do not allow for exact matching. (c) The rating should be taken into account in determining the amount to hedge. More important to mitigate default risk, may want to use credit default swaps.
Transcript of Spring 2010 APMV Complete Illustrative Solutions...Babbel & Fabozzi, Investment Management for...
APMV Spring 2010 Solutions Page 1
APMV Complete Illustrative Solutions
Spring 2010
1. Learning Objective:
(5b) Identify and describe financial and non-financial risks faced by an entity,
including but not limited to:
Currency risk, credit risk, spread risk, liquidity risk, interest rate risk, equity
risk, product risk, operational risk, legal risk and political risk.
Source:
Babbel & Fabozzi, Investment Management for Insurers, Chapter 19.
Commentary on Question: This is a recall and synthesis question asking candidates to (a) explain how currency risk
impacts a particular situation, (b) how currency risk is mitigated, and (c) the impact and
mitigation of credit risk.
Solution:
(a) Investment income will be converted to US dollars at point-in-time currency
exchange rates.
Exchange rates may be volatile causing fluctuation in investment income and
operating income.
(b) Swaps, forwards, and futures have BoD approval.
Swaps and forwards allow for exact matching of dates and amounts of foreign
cash flow.
Futures do not allow for exact matching.
(c) The rating should be taken into account in determining the amount to hedge.
More important to mitigate default risk, may want to use credit default swaps.
APMV Spring 2010 Solutions Page 2
2. Learning Objectives: (5a) Explain the rationale for managing risk and for the selection of the appropriate
hedging level.
(5b) Identify and describe financial and non-financial risks faced by an entity,
including but not limited to:
Currency risk, credit risk, spread risk, liquidity risk, interest rate risk, equity
risk, product risk, operational risk, legal risk and political risk.
(5f) Compare and select risk management techniques that can be used to deal with
financial and non-financial risks listed in (5b).
Sources:
Study Note V-C161-09, “On the Determinants of Corporate Hedging.”
Babbel & Fabozzi, Investment Management for Insurers, Chapter 21, “Hedging
Mortgage Pass-through Securities.”
Commentary on Question:
This question combines recall and analysis and requires candidates to apply their
knowledge of hedging to a particular situation encountered by the hypothetical company
from the Case Study.
Solution:
(a)
The more convex the effective tax schedule, the greater the reduction in
expected tax.
Statutory progressivity causes the tax schedule to be convex.
Tax preference items cause the tax schedule to be convex.
(b)
Purchase futures of …
o a Treasury Note with a duration shorter than that of the MBS and
o a Treasury Note with a duration longer than that of the MBS.
Calculate the “average” price changes of …
o the MBS,
o the shorter duration Note, and
o the longer duration Note
over …
o the “level” scenario, and
o the “twist” scenario.
Determine the unique quantities of the two Treasury bonds to simultaneously
hedge the MBS‟ price response to both “level” and “twist” scenarios.

APMV Spring 2010 Solutions Page 3
2. Continued
(c)
Effectiveness
o The shift (”level” factor) and reshape (“twist” factor) collectively explain
most of the past changes in the yield curve.
o The two Notes can hedge virtually all of the interest risk in mortgage
backed securities.
o The hedging error is a measure of the negative convexity of the security.
Compliance
o The strategy is consistent with the objective to reduce potential volatility
in the future operating income.
o Government bond futures are an approved derivative class.
o The strategy satisfies the guideline for approved counterparties.
APMV Spring 2010 Solutions Page 4
3. Learning Objectives: (5b) Identify and describe financial and non-financial risks faced by an entity,
including but not limited to:
Currency risk, credit risk, spread risk, liquidity risk, interest rate risk, equity
risk, product risk, operational risk, legal risk and political risk.
(5f) Compare and select risk management techniques that can be used to deal with
financial and non-financial risks listed in (5b).
(5l) Explain how derivatives, synthetic securities, and financial contracting may be
used to manage risk and recommend appropriate ones for a given situation.
Sources:
Tilman, Asset/Liability Management of Financial Institutions, 2003, Chapter 13 and
Chapter 16.
Commentary on Question: This is an analysis question asking candidates to assess different options embedded in the
products LifeCo is selling. The candidates are asked to assess how the option will
respond in proposed economic scenarios.
Candidates are asked to evaluate LifeCo‟s rating based on different scenarios.
The expected answers are based on the content of chapter 13 and chapter 16 of Tilman,
Asset/Liability Management of Financial Institutions, 2003
Credit is given to those answers that could correctly analyze the options embedded in
LifeCo‟s products, risk management and how will it impact LifeCo‟s credit rating.
Solution:
(a)
The embedded option is the Guaranteed Minimum Death Benefit (GMDB).
The GMDB is a put option on the variable annuity policy value.
The risk of this embedded option to LifeCo is if the account value falls below
the guaranteed minimum benefit.
(b)
LifeCo earns mortality and expense (M&E) fees from the variable annuity line
which is tied to the account value. Hence, if the account value declines due to
deteriorating market conditions, then LifeCo‟s income will also be adversely
impacted.
In addition, if the policyholder surrenders under deteriorating market
conditions, surrender charges and M&E fees over the life of the policy may
not be sufficient to cover acquisition expenses.
LifeCo‟s advancement of acquisition expenses in exchange for M&E fees to
be collected over the life of the contract constitutes a call option written to the
agent.
APMV Spring 2010 Solutions Page 5
3. Continued
(c)
Variable annuity fees is an exchange of options: LifeCo has a windfall by
way of excess mortality and expense charge should markets rise to a greater
level than expected, while the policyholder receives a put option on the policy
value.
LifeCo could sell the right to these excess fees which is an equity call option
and can buy equity puts to hedge the risk of falling markets.
(d)
The new feature contains an embedded equity put option.
If the separate account value decreases so that market value < book value,
than the policyholder can exercise the put option to receive book value.
(e) Embedded option in LTD product:
Call option on right to receive future benefits
Embedded option in new feature:
Put option on policy value.
APMV Spring 2010 Solutions Page 6
4. Learning Objectives: (1c) Determine how a client‟s objectives, needs and constraints affect the selection of
an investment strategy or the construction of a portfolio. Considerations include:
Funding objective
Investment policy
Risk-return trade-off
Regulatory requirements
Target rating from rating agency
Risk appetite
Liquidity constraints
Capital, tax, and accounting considerations.
Sources: V-C138-09 Managing Your Advisor
V-C13-07 Investment Case Study
CIA Educational Note: Liquidity Risk Management
Commentary on Question: This is a recall and analysis question asking candidates to evaluate investment strategy
for LifeCo‟s pension portfolio. The correct answers are expected to be based on the
content in study notes V-C138-09 (Managing Your Advisor) and the Case Study. Credit
is given for answers that provide correct investment policy objectives and constraints,
identify constraints on the asset sales and recommend improvements to LifeCo‟s asset
portfolio consistent with the objectives provided.
Solution:
(a)
Accounting
o Consider the effect of realizing gains/losses on the relevant accounting
bases
Tax Considerations
o Consider the tax implications of realizing gains/losses
Embedded Value / Economic Value Added
o Ensure that EV/EVA is maintained when executing portfolio trades
ALM Issues
o Ensure that the portfolio is rebalanced to maintain duration match
Credited Rates
o Asset portfolio returns should support the credited rates on liabilities
Policyholder Equity Issues
o Maintain appropriate diversification/asset mix
APMV Spring 2010 Solutions Page 7
4. Continued
(b)
(i)
Maintaining adequate required capital is necessary as a buffer against
potential losses.
However, LifeCo can manage the asset portfolio efficiently in order to
reduce required capital and invest the funds in value-added projects,
thus adding to the overall profitability of the company.
(ii)
Reduce earnings & surplus sensitivity to interest rate fluctuations.
Reduce C3 – interest rate risk capital and reduce losses/volatility that
may be incurred from interest rate fluctuations.
Timing of gain/loss realization can profit LifeCo and add value to the
company.
(iii)
By matching duration without asset sales, LifeCo can avoid tax and
crediting rate consequences.
(iv) Mitigating liquidity & marketability risk can help LifeCo:
Avoid “fire-sales” due to liquidity crunch,
Prepare for contingencies such as a „run on the bank,
Determine liquidity resources available in order to meet liquidity need.
Other benefits of strategies (i) thru (iv):
Maintain LifeCo‟s credit standing from rating agencies,
Meet regulator requirements, limits, etc,
Avoid rating downgrades,
Improve LifeCo‟s reputation and attract new business/maintain consumer
base.
(c)
(i)
Current required asset capital on Payout Annuities Portfolio is
32.4/700 = 4.63%. This is over the company‟s target.
Sell any of the following capital intensive instruments:
o Equities, at 20% capital
o Below Investment Grade Private Placement Bonds at 7%
o Commercial Mortgages at 5%
o Below Investment Grade Public Bonds at 4.69%
APMV Spring 2010 Solutions Page 8
4. Continued
Replace the above with any of the following low capital intensity
instruments:
o Government Securities
o Investment Grade Bonds
o Pass-through and CMO Cash
For example, switching from Commercial Mortgages to CMOs will
reduce the current required capital asset from 4.63% to below 3%.
(ii)
Asset duration is 6.1 compared to liability duration of 7.3, a mismatch
of 1.2.
To bridge the gap between asset & liability duration, LifeCo can sell
low duration assets (eg. Short duration corporate bonds) and purchase
assets with longer duration (long duration corporate bonds).
Trades should be timed and executed by analyzing yield curve.
(iii)
LifeCo can minimize duration mismatch without asset sales by using
derivatives to lengthen portfolio duration.
For example, LifeCo can set up an interest rate swap agreement to pay
floating rates in return for long term fixed rates.
(iv)
Asset mix has 5% in Below Investment Grade Public Corporate bonds
and 6% in Below Investment Grade in Private Corporate Bonds. This
is below the Investment Policy limit set at 20% and 25% respectively.
The biggest illiquid investment is in commercial mortgages,
potentially in violation of LifeCo‟s investment policy limit asset mix.
One possible justification is that Payout Annuities are illiquid
liabilities, so relatively high allocation to illiquid Commercial
Mortgages could be warranted.
LifeCo could rebalance its portfolio to hold less of Commercial
Mortgages and more of liquid asset classes such as Government or
Public bonds.
APMV Spring 2010 Solutions Page 9
5. Learning Objectives: (2a) Define and compare specialized financial instruments that can be used in the
constructions of an asset portfolio supporting financial institutions and pension
plan liabilities.
(5e) Explain the limitations of risk metrics.
(5i) Calculate effective duration and effective key-rate durations of a portfolio.
(5j) Contrast modified duration and effective duration measures.
(6d) Describe and critique the role of rating agencies in evaluating credit risk.
Sources:
Babbel & Fabozzi, Investment Management for Insurers, Chapter 17.
Fabozzi, Handbook of Fixed Income Securities, 7th
Edition, 2005, Chapter 1 and Chapter
13.
Crouhy, Galai, & Mark, Risk Management, 2001, Chapters 8 – 11.
Commentary on Question:
This question combines recall, analysis and application of risk management metrics to a
product line of the hypothetical Case Study company, LifeCo. It requires candidates to
demonstrate their understanding of effective duration through descriptions and
calculations, and requires candidates to evaluate the appropriateness of this risk metric
for a particular situation.
Solution:
(a)
Effective duration calculation uses stochastic interest scenarios to take into
account embedded cashflow optionality under different interest rate
environments.
Can use interest rate lattice
o Calculate value at each node
o Calculate duration by comparing PVs at each node taking into account
change in interest rate between nodes
Can adjust yield curve
o Shift interest rates up/down 50 bps
o Determine PVs under new interest rate scenarios
o Calculate duration as percentage change in PVs when interest rates change
by 100 bps

APMV Spring 2010 Solutions Page 10
5. Continued
(b)
( ) ( / )S A L LD D D A S D
8.9AD 416.6A 6.0LD 406L 416.6 406 10.6S A L
(8.9 6.0) (416.6 /10.6) 6.0 2.9 39.3 6 120SD
(c) SD has limited use as a risk metric because it is very sensitive to the accuracy of
assets and liabilities.
(d) Not adequate, not appropriate.
Agency credit rating not updated on time.
Historical default probabilities do not reflect current credit environment and do
not predict future.
Rating agency default probability does not take into account individual company
credit worthiness.
Need to use available market information and credit models.
APMV Spring 2010 Solutions Page 11
6. Learning Objectives: (2a) Describe and compare specialized financial instruments that can be used in the
construction of an asset portfolio supporting financial institutions and pension
plan liabilities.
Source:
Fabozzi, Handbook of Fixed Income Securities, 7th
Edition, 2005, Chapter 16, Floating –
Rate Securities (pp. 373-379, 382-383)
Commentary on Question:
This question combines recall of the risk characteristics and uses of floaters within an
ALM program, as well as the evaluation of the appropriateness of floaters to mitigate the
risks inherent in LifeCo‟s product portfolio.
Solution:
(a) Cap Risk
The floater‟s coupon rate likely will be capped, whereas the short-term funding
may not be.
Basis Risk
The floater‟s reference rate may not be the same as the reference rate for funding.
Price Risk
If the floater‟s risk changes for the worse, the quoted margin will no longer
compensate the investor for the security‟s risks.
(b) 1. The asset/liability management strategies can be used to manage the floating
rate funding agreements.
2. LifeCo can invest in floating rate products matching the product duration.
(c) 1. Time remaining to the next coupon reset date.
2. Changes in the market‟s required margin/credit quality.
3. Possibility of cap or floor, and whether or not the cap or floor is reached.
(d) Risk Arbitrage Strategies
For example, money managers using leverage to invest in securities that earn a
higher spread over their borrowing rate. The manager will be exposed to cap risk,
basis risk and price risk.

APMV Spring 2010 Solutions Page 12
6. Continued
Betting on Changes in the Required Margin
If the floater‟s risk does not change and the compensation demanded by the
market does not change either, the floater‟s price will be par on every coupon
reset date. If conditions change such that the required spread is greater than (or
less than) the quoted margin the floater will trade at discount (premium) to par.
Arbitrage Between Fixed and Floating Rate Markets Using Asset Swaps
An asset-based swap transaction involves the creation of synthetic security via the
purchase of an existing security and the simultaneous execution of a swap.
APMV Spring 2010 Solutions Page 13
7. Learning Objectives: (4e) Recommend an investment strategy for a given situation:
Portfolio policy and objectives
Asset selection criteria
Capital market expectations
Risk management strategy.
Sources: V-C114-07: The Real Estate Portfolio Management Process [1995]
Commentary on Question: This is a recall and evaluate question asking candidates to demonstrate their
understanding of the Portfolio Management Process described in Chapter 25 The Real
Estate Portfolio Management Process and use it to evaluate the appropriateness of a real
estate investment.
Solution:
(a)
Required rate of return might not be good.
Factors may not be appropriate.
o Selection of the factors is critical.
o Too many factors will generate noise.
o Factors may be dependent (high correlation may make the model not
valid).
Use solely the historical data to predict the future.
Assume the sensitivity factors to be constant in the future.
Need other methods to find variance and covariance of returns.
(b)
Need more factors specific to real estate, e.g.:
o Employment growth, local demographics
o High cost of information, transaction, and liquidity
o Industrial production
o Risk premium
o Term structure of interest rate
R-squared is too low.
APMV Spring 2010 Solutions Page 14
7. Continued
Make sure the model has the following characteristics:
o No multi-collinearity, i.e. error term is not correlated to other significant
factors (or no two factors are highly correlated).
o No missing significant risk factors, i.e. error term is not correlated with the
asset return.
o Parsimonious, i.e. selection of very few risk factors explains most of the
return.
o High R-Squared, able to explain most of the return.
o Requires an APT model.
o The return is a function of its sensitivities to unexpected changes in
several factors.
Check the time horizon of historical data used to calculate the 'ib s .
(c) Should not use the discount rate from the multifactor model. Since there is risk,
should discount i‟s with the rate which has risk adjustment or adjust the cash flow
to be able to discount at risk-free. Should include all cash flows.
The exit value needs to be considered in the calculation.
V(0) = PV net cash flows + end of year 5 operating income / reversionary
capitalization rate /( 1+ IRR)^5
= 35 + 13/0.9/((1+8%)^5)
= 133 > 120, good buy.
(d) 1. Investors constrains and objectives required return, risk tolerance
2. Market conditions and expectations
3. Time horizon
4. Portfolio size
5. Liquidity and diversification benefit
6. Tax and regulatory considerations:
Volatility
Immobility of real estate
Hard to divide into small pieces
Subject to neighborhood deterioration
Need maintenance and operating cost
Need managing experience and hands on experience
Tax subsidiaries subject to policy change
High transaction cost
Low liquidity
Limited information/low transparency
High commission/due diligence cost
APMV Spring 2010 Solutions Page 15
7. Continued
7. Need to go through portfolio management process
Need to look at national market, regional market, and local market
8. Need to reconcile the results with judgments
9. Need to see if it is optimal
Build risk-return indifference curves
Optimal at intersection between the indifference curve and efficient
frontier
Include other valuation methods (replacement cost, comparable deals)
(e) Fundamental analysis
Scenario/probabilistic forecast
Applies estimated probability to various potential outcome
Then compute their expected return, SD, and correlation
Monte Carlo simulation approach
Generate returns under uncertainty
Need to estimate distribution of each outcome
Compare result to efficient frontier of all real estate market segments.
APMV Spring 2010 Solutions Page 16
8. Learning Objectives: (2a) Describe and compare specialized financial instruments that can be used in the
construction of an asset portfolio supporting financial institutions and pension
plan liabilities.
Sources: V-C146-09, Greer, R., “The Role of Commodities in Investment Portfolios,”
CFA Conference proceedings Quarterly December 2007, pp. 35-46. Vol 24 #4
Ch. 15, Inflation-Linked Bonds, in Handbook of Fixed Income Securities, 7th Edition,
2005
Commentary on Question: This question asks candidates to explain how non-standard assets can be used to
complement an existing portfolio, as well as to discuss the economic drivers of a specific
type of bond. Finally, it requires candidates to demonstrate knowledge of inflation-linked
bonds through two calculations.
Solution:
(a) Commodities have historically been shown to have negative correlation with both
equities and fixed income and, therefore, provide a good form of diversification.
They also have been shown to be positively correlated with the inflation rate.
Inflation-linked bonds provide good diversification with traditional financial
assets due to a low correlation with those assets. Cash flows are linked to the
inflation rate because the principal amount grows with inflation. This provides
good inflation protection.
(b) The economic drivers of return for long-only commodity indexation are:
T-Bill return – represents the return earned on the collateral
Risk premium – the assumption of price risk of commodities
Rebalancing – reflects the fact that commodities are not highly correlated with
each other
Convenience yield – evident when there is low inventory relative to market
demand
Expectational variance – due to unusual or unexpected occurrences
(c) The indexed principal in years 1 and 2 are as follows:
Indexed Principal1 = 1000 CPI1 / CPI0 = 1000 102 / 100 = 1020
Indexed Principal2 = 1000 CPI2 / CPI0 = 1000 106 / 100 = 1060
APMV Spring 2010 Solutions Page 17
8. Continued
Then the coupon payments in years 1 and 2 are:
Coupon Payment1 = Indexed Principal1 Real yield = 1020 0.03 = 30.6
Coupon Payment2 = Indexed Principal2 Real yield = 1060 0.03 = 31.8
(d) Indexed Principal3 = 1000 CPI3 / CPI0 = 1000 CPI3 / 100 = 10 CPI3
Coupon Payment3 = Indexed Principal3 Real yield = 10 CPI3 0.03 = 0.3
CPI3
Total Cash Flow at time 3 = Indexed Principal3 + Coupon Payment3
= 10 CPI3 + 0.3 CPI3
= 10.3 CPI3
Therefore, the cash flows for each of the three years of the bond are 30.6, 31.8,
and 10.3 CPI3.
Assuming a 7% realized nominal yield,
1000 = 30.6/(1.07) + 31.8/(1.07)2 + [10.3 CPI3]/(1.07)
3
Solving the equation, we find that CPI3 = 112.2314.
APMV Spring 2010 Solutions Page 18
9. Learning Objectives: (5i) Explain how derivatives, synthetic securities and financial contracting may be
used to manage risk and recommend appropriate ones for a given situation
Sources:
Fabozzi, Handbook of Fixed Income Securities, 7th
Edition, 2005, Chapter 47.
Study Note V-C157-09, Hedging with Derivatives in Traditional Insurance Products.
Commentary on Question:
This recall and analysis question requires candidates to demonstrate their knowledge of
securitization of a Long Term Care insurance liability stream and apply their knowledge
of swaps to determine an appropriate strategy for immunizing the Long Term Care
insurance liability stream.
Solution:
(a) Advantage:
Increased earnings
Reduced interest rate risk
Increased assets under management
Risk:
Risk of deviation of lapse and mortality experience from that assumed in
pricing
Level premium long term care policies are lapse supported policies
The lower than expected terminations might lead to higher reserves
The selloff of future cash flows makes the financial position worse than it
would be without the securitization
(b)
Duration of assets = duration of liabilities
Present value of assets > Present value of liabilities
The PV should be calculated using the IRR of the asset
Dispersion of assets must be slightly greater (as close as possible) than the
dispersion of liabilities
Controls the risk of pathological shifts in the yield curve
(c)
The consideration of the discount rate to be used in assets and liabilities.
Both liabilities and assets duration are derived using the IRR of the assets.
IRR is not determinable unless we know the precise assets portfolio.
It will create an iterative process, as an assumed target IRR will be used to
determine the liabilities durations, dispersions and PVs.
APMV Spring 2010 Solutions Page 19
9. Continued
Asset portfolio will be constructed based on the statistics (liabilities durations,
dispersions and PV) of the liabilities.
The constructed assets IRR will be compared with the assumed target IRR,
and if it differs, a new IRR is substituted and the process repeated.
The consideration of the degree of the market risk in the immunized portfolio
if strict cash flow matching of assets and liability is not viable.
If not strict cash flow matching, some sale and purchase of assets might be
required for rebalancing purpose in the future. This introduces some degree
of market risk as the price of the security is uncertain in the future, since it
depends on interest rate curve and spread.
(d)
Objective is to transform the earned rates on the assets from a variable rate to
a fixed rate through two transactions.
Enter into a forward swap that will take effect when the premium payments
are expected to be received, with a notional amount of the premium payment,
in which the Company receives a fixed interest rate on the notional amount
and pays the swap counterparty LIBOR on the notional amount once the
premium is received. In practice the net amount payable to either the
Company or the counterparty is remitted.
Enter into an offsetting swap when the premium is received, in which the
Company receives LIBOR on the same notional amount and pays a fixed rate
on this same notional amount.
Would need to execute these transactions for each year in which premium
payments are expected to be received.
APMV Spring 2010 Solutions Page 20
10. Learning Objective:
(2a) Compare and select specialized financial instruments that can be used in the
construction of an asset portfolio supporting financial institutions and pension
plan liabilities.
Source:
Fabozzi, Handbook of Fixed Income Securities, 7th
Edition, 2005, Chapter 30.
Commentary on Question:
The recall portion of this question requires candidates to demonstrate their knowledge of
the characteristics of cash flow and market value Collateralized Debt Obligations
(CDOs). The question further requires candidates to apply their knowledge of CDOs by
performing calculations involving a hypothetical transaction.
Solution:
(a) Objective
CFCDO depends on Collateral CF to pay I & P
MVCDO depends on ability to sell to redeem debt
Rating Focus
CFCDO rating: Timely payment of I & P (1) and default recoveries (1)
MVCDO rating: Price volume, liquidity, MV
Manager Focus
CFCDO focus: Control default & recoveries
MVCDO focus: Maximize return & minimize price volume
Structural Protection
CFCDO: OC is measured at par value, OC failed to divert paydown senior
notes, no forced collateral liquidation
MVCDO: OC based on MV * advance rate, OC failed to sell asset to bring
down OC ratio
Diversity and Concentration Limit
CFCDO: Very strict
MVCDO: Substantial diversification (cause may impact advance rate)
Trading Limits
CFCDO: Limited
MVCDO: Flexible
Collateral (one point for each asset stated)
CFCDO: Bank loan, high yield bond, ABS emerging market bonds
MVCDO: Above, equities, convertible, distressed debt

APMV Spring 2010 Solutions Page 21
10. Continued
(b)
Enter 70,000,000 notional of swap receiving LIBOR and pay 10year
treasury + bps
Working 1: 70mil * (treasury + 400bps – (treasury + 150bps) + LIBOR –
(LIBOR + 50bps))=1.4mil
Working 2: 20mil * (treasury + 400bps – (treasury + 250bps)) = 0.3mil
Working 3: 10mil * (treasury + 400bps) + 1.4mill + 0.3mil = 10mil *
(treasury + 2100bps)

APMV Spring 2010 Solutions Page 22
11. Learning Objectives: (7a) Describe and assess techniques that can be used to select or build a benchmark for
a given portfolio or portfolio management style.
(7b) Recommend a benchmark for a given portfolio or portfolio management style.
(7c) Describe and assess performance measurement methodologies for investment
portfolios.
Sources: Quantitative Analysis of Fixed Income Portfolios Relative to Indices; Handbook of
Portfolio Management, Chapter 20. (pp. 425-427)
Quantitative Management of Benchmarked Portfolios; Handbook of Fixed Income
Securities, Chapter 44. (pp. 1017-1022)
Commentary on Question: To get full marks on the question in part (a) the candidate was expected to identify each
of the four main points outlined in the material as well as provide at least 12 supporting
points (those bulleted under each section below).
On part (b), note that a candidate could get full marks by indicating a market index, a
customized index or a combination index all of which are an appropriate answer. What is
important is the argument and in order to obtain full marks the successful candidate
recommended an index and included at least 3 points to support their recommendation.
In order to gain full marks on part (c), the candidate should have provided a customized
benchmark and calculated the expected return. The proposed benchmark does not have
to align with that illustrated below as long as the reasons are briefly explained.
In order to obtain full marks on part (d), the candidate was expected to provide at least
three of the points outlined below.
Solution:
(a) Reflecting Investor Opportunity Set and Constraints of the Investment Policy:
(Management Style)
Asset class allocation
Minimum credit rating threshold
Limits of exposure to an industry, country
Attributes like maturity, age, coupon
APMV Spring 2010 Solutions Page 23
11. Continued
Assets/Liabilities Issues
Regulatory requirements
Liquidity considerations
Sometimes, none of the ready-made indexes matches the desired
characteristics of the portfolio
Targeting Duration/Cash-flow Profile
The portfolio is expected to have a particular term-structure exposure.
Liability funding portfolios often are managed with a specific duration target.
A diversified benchmark may be appropriate which matches the expected
liabilities stream when the policy is the pursuit of outperformance while
ensuring sufficient cash flows.
Some portfolios may contain a large proportion of securities with embedded
optionality.
Duration of such portfolios is likely to be unstable, changing in response to
interest-rate movements.
Asset-Swapped Indexes
Some investors can take credit positions but are required to match their
interest-rate exposure to their funding source (ex. 3-month LIBOR).
Book Accounting Based Indexes
Some investors are less concerned about short-term market fluctuations, and
they do not use market prices.
The liabilities are not marked-to-market and the assets are supposed to be held
until maturity.
Book, values, book return or book yield may then be used.
(b) Recommendation: A market based benchmark would be appropriate
It may even be better because the portfolio is relatively small.
The fixed income securities of the portfolio are very regular ones for which a
market index is available.
Even for portfolios for which market-weighted indices may seem
inappropriate, such as insurance companies and banks, those investors have
used market-based benchmarks for performance and risk measurement.
Recommendation: A customized index is appropriate
When the investment policy constraints are dictated by: Assets/Liabilities;
Duration; Cash flows; Regulatory requirements.
It would be unfair to measure the performance against an index which is not
subject to these limitations.
APMV Spring 2010 Solutions Page 24
11. Continued
Recommendation: A combination index may be appropriate
Insurance companies divide their portfolios along Product lines with
investment guidelines matched to the expected liability stream for each
product.
This creates demand for benchmarks tailored to liability cash flows, while
maintaining the advantages of using broad market-weighted indices.
(c)
The easiest way is to take a narrow definition and to create a benchmark in
proportion of the assets invested in it.
Policy loans are to be excluded as they earn the contractual rate.
The customized benchmark could be:
100/230*(LB GVT Bonds Barclays) + 65/230*(LB Public corporate Bonds
Barclays) + 65/230*(ML CMO‟S Merrill Lynch)
The expected return would be:
100/230*(5%) +65/230*(5.75%) +65/230*(6.25%) = 5.6%
(d)
Construct an optimized portfolio from a universe of securities within the
investment policy which is constrained to match the liability cash flow.
Construct a term structure of spreads based on all securities in the investable
universe and combine it with a Treasury yield curve to obtain a Yield curve
reflective of the chosen asset mix.
The liability cash flow can be modeled as a portfolio of hypothetical „zero-
coupon bonds‟ which are marked to market by discounting along this curve.
This portfolio can then be used as a benchmark to provide returns, durations,
cash flow profile and other statistics for comparison with the actual portfolio.
APMV Spring 2010 Solutions Page 25
12. Learning Objectives: (7c) Describe and assess performance measurement methodologies for investment
portfolios.
Sources:
Maginn & Tuttle, Managing Investment Portfolios: A Dynamic Process, Third Edition
Ch. 12, “Evaluating Portfolio Performance,” by Bailey, Richards, & Tierney
Commentary on Question: This is a fairly straightforward recall, calculation and analysis problem. Credit is given
for applying the correct formulas to the calculation of different performance measures
and correctly analyzing the results by comparing to the benchmark market performance.
Solution:
(a) Note: The question did not explicitly state whether the 900K account value at
9/15/09 was ex-ante or ex-post. Therefore there are two acceptable approaches
and sets of answers for the Time Weighted Return (TWR). This does not affect the
calculation of the Market Weighted Return (MWR).
1. Assume the 900K account value includes the 600K cash inflow:
Subperiod 1 Return R1 = (900K-600K)/500K-1 = -40%
Subperiod 2 Return R2 = 1500K/900K = 67%
TWR = (1+R1)*(1+R2) - 1 = 0%
2. Assume the 900K account value does not include the 600K cash inflow
Subperiod 1 Return R1 = 900K/500K-1 = 80%
Subperiod 2 Return R2 = 1500K/(900K+600K) = 0%
TWR = (1+R1)*(1+R2) - 1 = 80%
Solve the following equation for MWR:
500K*(1+MWR)^1 + 600K*(1+MWR)^0.5 = 1500K
MWR ~ 52%
(b)
MWR represents the average growth rate of all money invested in an account.
TWR represents the growth of a single unit of money invested in the account.
The difference between MWR and TWR is due to the cash inflow at 9/15.
MWR = TWR when there is no mid-period cash flow or if the performance of
subperiods are equal.
(c)
Jensen Alpha = Ra-Rf-βα*(Rm-Rf) = 0.5%
Treynor Measure = (Ra-Rf)/ βα = 6%
Sharpe Ratio = (Ra-Rf)/σα = 0.30
M^2 = Rf+[(Ra-Rd)/σα]*σm = 5.6%

APMV Spring 2010 Solutions Page 26
12. Continued
(d) To analyze the manager‟s performance measures, they must be compared to those
of the market and not in a vacuum.
Market Performance Measures
Jensen Alpha = 0%
Treynor Measure = 5%
Sharpe Ratio = 0.42
M^2 = 7%
Both the Jensen‟s Alpha and Treynor Measure of the fund are better than
those of the market, indicating that the manager is skillful.
Both the Sharpe Ratio and M^2 of the fund are worse than those of the
market, indicating that the manager is not skillful.
The Jensen‟s Alpha and Treynor Measure come to the conclusion opposite to
the Sharpe Ratio and M^2, since the manager takes on a large amount of
nonsystematic risk relative to the systematic risk.
APMV Spring 2010 Solutions Page 27
13. Learning Objectives: (8b) Describe how behavioral finance explains the existence of some market
anomalies.
(8c) Identify and apply the concepts of behavioral finance with respect to investors,
option holders and policyholders, including optimal behavior, real behavior,
model behavior and empirical studies.
Sources: V-C 122-07: “Anomalies: the Law of One Price in Financial Markets”
Lamont & Thaler, Journal of Economic Perspectives, Fall 2003
Proceedings, December 2006
Commentary on Question:
This question requires candidates to assess and explain a situation where the generally
accepted rules of efficient markets do not apply.
Solution:
(a) “Stub value” is the value of Zim-Zam remaining after subtracting the value of
Apps for Actuaries (AFA).
(b) Stub value = 45 less(value for AFA price) 45 (1.25 60) 45 75 30/ share
(c) Buy shares of Zim-Zam and sell short shares of AFA, since the value of AFA is
overpriced at 1.25 times the share price of Zim-Zam.
(d) Inconsistent with (any 3 of the following):
Efficient market hypothesis
Rationality
Law of One Price
Framing
Under/overreaction and Overconfidence
Framing
Representative Bias
Availability Bias
(e) It may be difficult to sell shares short, due to the costs associated with borrowing
and transaction costs to implement the strategy.
APMV Spring 2010 Solutions Page 28
14. Learning Objectives:
(1d) Evaluate the particular issues influencing investment strategies for institutional
investors, including
Liquidity requirements,
Valuation concerns,
Cash flow variability,
Compliance risk,
Regulatory constraints,
Taxation impacts, and
Investment management mandates.
Sources: V-C138-09 (Managing Your Advisor)
Liquidity risk Measurement – CIA Educational Note
Liquidity Modeling and Management, RSA, Volume 27, No. 2
Commentary on Question: This is a recall, analysis and synthesis question asking candidates to evaluate investment
strategy for a product with liquidity optionality. The correct answers are expected to be
based on the content in study note V-C138-09 (Managing Your Advisor), CIA
Educational Note - Liquidity Risk Measurement, and Liquidity Modeling and
Management note from the Record of the Society of Actuaries, RSA Volume 27 No. 2.
Credit is given for answers that provide correct definitions of the risk, suggest an
appropriate investment policy for the product in question and outline a liquidity
management strategy consistent with the recommendations provided in the study notes.
Solution:
(a) Reference is CIA Educational Note – Liquidity Risk Management.
These are straightforward definitions taken directly from the study note. Poorer
candidates will often focus on market risk only, which is not the focus of the
question, or confuse the definitions of liquidity risk and liquidation risk.
Liquidity Risk is the inability to meet financial commitments as they fall due
through ongoing cash flow or asset sales at market value.
It is important to note that liquidity risk is distinct from market risk: liquidity risk
can exist without potential loss on sale of an asset (i.e. market risk – see next
item). While market risk is generally viewed as an asset issue, liquidity risk is an
asset/liability issue. The interaction of assets and liabilities is what matters (see
the RSA reference, page 3).
APMV Spring 2010 Solutions Page 29
14. Continued
Market Risk is the potential loss when the sale of an asset is required to fund the
cash demand. The loss could arise from deterioration in value of an asset due to
changes in interest rates, general market declines, decrease in credit quality of the
asset, or any other reason.
This risk is not to be confused with marketability risk, although marketability risk
is closely associated with the next item, liquidation risk.
Liquidation Risk is the potential loss when the sale of an asset is urgently required
which may result in the proceeds being below fair market value.
It is important to understand the distinction between liquidity risk and liquidation
risk. Liquidation risk can exist whether or not there is a need to meet financial
commitments (i.e. liquidity risk).
(b) References are Liquidity Modeling and Management (RSA), and Managing Your
Advisor.
The candidate is expected to critique the suggested strategy, i.e. discuss why the
various elements of the strategy are either appropriate or not appropriate in the
situation, rather than just identifying these elements.
Assets should be diversified along several dimensions to manage the liquidity
risks (RSA). While the student‟s suggested strategy has the potential to yield
gains, it comes at the increased cost of diversification, liquidity and
downgrade/spread risks, due to the concentration in lower investment grade assets
(i.e. along one dimension only).
Investing in zero-coupon bonds could create liquidity problems when
policyholders surrender their annuities and asset cash flows are not available to
match the liability. A laddered maturity structure (Managing Your Advisor, page
5) is preferable, minimizing the cash need surge for the company (RSA, page 8
paragraph 5).
BB spreads at the time of liquidation could be higher than 3%, since they are 3%
„on average‟. If spreads widen, the company would realize a loss in the event of
the asset sale.
It must be noted that the level of credit spreads and the change in these spreads
are the potential problem here, not necessarily the overall level of the yield curve
(although both are linked). The change in credit spreads introduces another
dimension to yield curve dynamics. A poorer candidate might concentrate on
yield movements without distinguishing interest rate levels and spreads.
APMV Spring 2010 Solutions Page 30
14. Continued
(c) Reference is Managing Your Advisor, which describes each of these investment
strategies.
A candidate is expected to understand and describe each of the strategies, being
able to compare them in order to ascertain which strategy is most appropriate for
the situation. It is expected that a candidate can demonstrate why each strategy
is more appropriate or less appropriate than the others. It is not enough to
simply choose one strategy and fit it into the given situation (e.g. by simply listing
the characteristics of the strategy that support the requirements or the situation).
Finally, a candidate is expected to unequivocally identify their preferred strategy.
Describing only one strategy without identifying this as the preferred strategy will
not be taken as a recommendation in and of itself. Recommendation of more than
one strategy is also not appropriate.
A laddered maturity is the recommended strategy.
Preferable to support portfolios with uncertain cash flows or policyholder
behavior, such as the non-forfeiture provision in the annuity.
Built with a bond maturing every few months, with asset portfolio cash flows
comprising coupon and principal payments.
Cash is readily available for benefit outflows and surrenders and to reinvest in
the current market rates for expected annuity cash flows.
In a bullet structure, asset cash flows are concentrated at one point.
More appropriate to support fixed and known benefit payments or lump sums,
not liabilities with policyholder optionality.
Could recommend cash flow matching with bullet bonds (more like an overall
laddered structure).
Generally more expensive than a laddered approach and in this case uncertain.
In Barbell structure, long and short duration assets are weighted to match an
immediate liability. This is a compromise between bullet and laddered
approaches.
Cash would be available from the short duration asset to support annuity
surrenders, although these are still uncertain.
Longer-duration asset will support policyholders who elect to keep the
annuity.
(d) Reference is CIA Educational Note – Liquidity Risk Management.
This is a straightforward list-type question taken directly from the study note,
allowing candidates to demonstrate that they are familiar with and understand
the syllabus material.
APMV Spring 2010 Solutions Page 31
14. Continued
Strategic Considerations:
Set corporate guidelines on short-term borrowings and/or asset mix; manage
overall balance sheet risk
Incorporate rating agencies‟ expectations
Address organizational level at which liquidity will be managed (total
company versus legal entity/segment)
Develop a contingency plan in the event of liquidity crisis
Operational Considerations:
ALM work closely with cash management function; define short- and
medium-term cash needs; possible impacts of different scenarios on liquidity
Assess how business trends and asset mix may impact liquidity in the future
(e.g. dynamic capital adequacy testing, other financial planning activities)
Thoughtful product design; how product features impact liquidity
Enforcement of various product features that impact liquidity

APMV Spring 2010 Solutions Page 32
15. Learning Objectives: (1c) Determine how a client‟s objectives, needs and constraints affect the selection of
an investment strategy or the construction of a portfolio. Considerations include:
Funding objective
Investment policy
Risk-return trade-off
Regulatory requirements
Target rating from rating agency
Risk appetite
Liquidity constraints
Capital, tax, and accounting considerations
(1d) Evaluate the particular issues influencing investment strategies for institutional
investors, including
liquidity requirements,
valuation concerns,
cash flow variability,
compliance risk,
regulatory constraints,
taxation impacts, and
investment management mandates.
Sources: V-C141-09: Modern Valuation Techniques, pp. 8-18
Commentary on Question: The question tests candidates‟ understanding of state price deflators and utility functions.
Solution:
(a)
(i) Calculating the State Price Security Prices:
120 105 1A B 95 105 0A B
25 1A .04A
.0362B
Feast state price .04*100 .0362*100 38
120 105 0A B 95 105 1A B
25A=-1 A=-.04
.0457B
Famine state price .04*100 .0457*100 .57
(ii) Calculating the Risk Neutral Probabilities:
120*9 96*(1 9) 105 105(1 9) 105p
1.2 .95 .95 105p p
P(feast) = .4, P(famine) = .6

APMV Spring 2010 Solutions Page 33
15. Continued
(b) D(s)= marginal_utility(w(s))*{w(0)/E[w(s)*marginal_utility(w(s))]}
A higher deflator in one state versus another coincides with a higher marginal
utility in that state than in the other for an investor who is investing optimally.
The goal of an investor who is investing optimally is to maximize utility. Hence,
he will place greater value on each additional dollar from a state where his
marginal utility is higher than he will each additional dollar from a state where his
marginal utility is lower.
Payouts from states with relatively higher marginal utility will not be as heavily
discounted (receiving a larger deflator) in an investor's valuation of securities than
will payouts from states with lower marginal utilities.
(c) Option 1 fund value in feast = 95 * (120/100) = 114
Option 1 fund value in famine = 95 * (95/100) = 90.25
Option 2 fund value in feast = 95 * (105/100) = 99.75
Option 2 fund value in famine = 95 * (105/100) = 99.75
Option 3 fund value in feast = .5*95*(120/100) + .5*95*(105/100) = 106.88
Option 3 fund value in famine = .5*95*(95/100) + .5*95*(105/100) = 95
Option 1 expected member utility = (110*.5 + 90.25*.5)^.5 = 9.994
Option 2 expected member utility = (99.75*.5 + 99.75*.5)^.5 = 9.987
Option 3 expected member utility = (106.88*.5 + 95*.5)^.5 = 10.042
I recommend investment option three because it maximizes expected member
utility.
APMV Spring 2010 Solutions Page 34
16. Learning Objectives: (1e) Explain principles of risk-based capital management and their impact upon
portfolio management, including, for example,
Regulatory requirements,
Rating agency standards, and
Economic capital measures.
Sources: V-C175-09 Theory of Risk Capital in Financial Firms
V-C139-09 New Insurance Capital Model Embraces Trends in Risk Management
V-C140-09 SOA Specialty Guide to Economic Capital
Commentary on Question:
This question asks candidates to establish a linkage of risk and reward using risk capital concepts.
Solution:
(a) Components in FPC Model are:
Financial Market Risk (Interest rate risk)
o MR-1 = Interest rate delta (mismatch) risk charge
o MR-2 = Interest rate gamma (convexity) risk charge
o MR-6 = Liability option risk charge
Credit Risk (Asset default risk)
o CR-1 = Nonfinancial market related credit exposure charge
o CR-2 = OTC counterparty credit risk charge
o CR-3 = Credit concentration risk charge
Operation Risk
o OR-1 = Financial intermediation operation risk charge
o OR-2 = OTC derivative operation risk charge
(b) Calculating ROE without Consideration of Risk Capital
Revenue = 5.5%*1000 = 55
Expense = 3.0%*1000 + 0.35%*1000 = 30 + 3.5 = 33.5
Return = 55 – 33.5 = 21.5
Equity = 5
ROE = Return / Equity = 21.5/5 = 430%
(c) Calculating ROE with Risk Capital
Revenue = 5.5%*1000 = 55
Expense = 3.0%*1000 + 0.35%*1000 + 1.5%*1000 (risk charge) = 48.5
Risk Adjusted Return = 55 – 48.5 = 6.5
ROE = 6.5/15 = 43.3%

APMV Spring 2010 Solutions Page 35
16. Continued
(d) Traditional method has several short-falls because:
It doesn‟t reflect risk in the return measure.
It will overstate ROE because returns are overstated and equity is understated.
It overstates returns because it often fails to reflect cost of insurance provided
implicitly by shareholders.
It understates equity because it ignores the risk capital.
(e) Hedging away market risk exposures reduces asset risk.
Thus, hedging market exposure reduces the required amount of risk capital
provided by shareholders.
If there were no spread costs for risk capital, larger amount of risk capital would
impose no additional costs on the firm. In this case, firms may well be indifferent
to hedging or not.
But if there are spread costs, and if these costs depend on the amount of risk
capital, then a reduction in risk capital from hedging will lead to lower cost of risk
capital if hedges can be acquired at relatively small spread.

APMV Spring 2010 Solutions Page 36
17. Learning Objectives: (4b) Assess a portfolio position against portfolio management objectives and
recommend a strategy to rebalance the portfolio.
Sources: Investment Management for Insurers, Chapter 26 - The Use of Derivatives in Managing
Equity Portfolios
Commentary on Question:
This is a calculation and analysis question asking candidates to develop hedging
strategies using derivatives.
Solution:
Part (i)
(a) Futures contracts should be used to hedge this position.
(b)
∆V = ∆S + h ∆F, where V is the value of the portfolio, S is the value
of the security, F is the futures contract used for hedging, h is the
hedge ratio.
∆V = (20%) ∆S
∆S = βs ∆I, where I is the S&P 500 Index, and ∆F = βF∆I
Therefore, h = (-0.8 x 1.1 / 1.0) = -0.88
The contract size for the S&P 500 futures contract is (250 x 1000 =
$250,000)
The number of futures contract required is:
= -0.88 x ($10,000,000) / $250,000
= -35.2
To hedge the position, take a short position of 35.2 S&P 500 futures
contract
(c) The cost of a futures contract at inception is zero.
Part (ii)
(a) The protective put strategy should be used to hedge this position; ie. To
hold the security, and take a long position in the put option of the strategy.

APMV Spring 2010 Solutions Page 37
17. Continued
(b)
The number of put option contracts traded is $10,000,000/($100*100)
= 1,000
The minimum payoff of this hedged portfolio, net of put option cost is
K-p
To protect the hedged portfolio from falling below $10,000,000:
1000*100*(K-p) = $10,000,000 → (K-p) = $100
Long 100,000 put option contracts with strike price $125 and maturity
5 years
(c) Cost of hedging strategy is 1000*$25*100 = $2,500,000
Part (iii)
(a) The collar structure should be used to hedge this position; i.e. to hold the
security, long a put option, and short a call option, where the strike of call
(KC) is higher than the strike of put (KP).
(b)
The number of put option contracts traded is $10,000,000/($100*100)
= 1,000
The minimum payoff of this hedged portfolio, net of put option cost, is
KP-(p-c), where p is the put option price, and c is the call option price
The maximum payoff of this hedged portfolio, net of put option cost,
is KC-(p-c)
To protect the hedged portfolio from falling below $12.5 million:
1000*100*(KP-(p-c)) = $12,500,000 → (KP-(p-c)) = $125
To protect the hedged portfolio from rising above $14.5 million:
1000*100*(Kc-(p-c)) = $14,500,000 → (Kc-(p-c)) = $145
From the table, the call and put options that satisfy the above are:
Call: KC = 150, c = 23
Put: KP = 130, p = 28
Long 1,000 put option contracts with strike price $130 and maturity 5
years; short 1,000 call option contracts with strike price $150 and
maturity 5 years
(c) Cost of hedging strategy is 1,000*(28 - 23)*100 = $500,000

APMV Spring 2010 Solutions Page 38
17. Continued
(d)
If stock price declines, investor is better off using the collar strategy
If stock price declines for 10% to $90:
Change of portfolio value according to futures strategy: 20%*(-10%) = -2%
Payoff from collar = ($90 + (130-90) – (28-23) – 100)/$100 = 25%
Payoff from protective put = ($90 + (125-90) – 25 – 100)/$100 = 0%
The cost of collar structure is also cheaper because part of upside potential is
lost through the short position in call option

APMV Spring 2010 Solutions Page 39
18. Learning Objectives: (6a) Define and evaluate credit risk as related to fixed income securities, derivatives
and reinsurance ceded.
(6b) Define and evaluate spread risk as related to fixed income securities and
derivatives.
(6f) Recommend a credit risk management strategy for a given situation.
Sources:
Crouhy, Galai, & Mark, Risk Management, 2001
Ch. 7, Credit Rating Systems
Ch. 8, Credit Migration Approach to Measuring Credit Risk
Ch. 9, The Contingent Claim Approach to Measuring Credit Risk
Ch. 10, Other Approaches: The Actuarial and Reduced-Form Approaches to
Measuring Credit Risk
Commentary on Question: This question tests candidates‟ comprehension of credit risk concepts as described in Risk
Management – Couchy and their ability to analyze and apply the knowledge to a given
situation.
Solution:
(a) BigBucks is exposed to credit risk from H&M when there is a chance that H&M
will not have sufficient assets to pay its debt obligation when it becomes due. (i.e.
Probability(VT < F) > 0).
(b) BigBucks can eliminate the credit risk of H&M by purchasing a put option on the
value of H&M‟s assets V with a strike price of F maturing at time T.
Payoff structure for BigBucks:
Time 0 T
Assets V0 VT ≤ F VT > F
BigBucks:
a) Loan -B0 VT F
b) Buy a put -P0 F - VT 0
Total - B0 – P0 F F

APMV Spring 2010 Solutions Page 40
18. Continued
(c) Based on the Merton credit risk model and the data provided:
Probability of default = N(-d2)
N(-d2) = 0.0719
Expected severity of loss = (-N(-d1)/N(-d2)*V0 + F*e (-r*T)
)
= (-0.0483/0.0719*130 + 100*e (-0.05*1))
= 7.8
The cost for BigBucks to eliminate H&M‟s credit risk is equal to the cost of a put
option:
P0 = Expected severity of loss*Probability of default
= (7.8)*(0.0719)
= 0.56
(d) The higher volatility on the value of assets represents an increase to the risk of
default and investors will demand a higher yield to maturity to compensate for the
increased risk. Holding the risk free rate constant, this will increase credit spread,
equal to the difference between the yield to maturity and the risk free rate (i.e. π =
yT – rf). As a result, I would recommend a decrease in H&M‟s credit rating.
APMV Spring 2010 Solutions Page 41
19. Learning Objectives: (6b) Define and evaluate spread risk as related to fixed income securities and
derivatives.
(6e) Explain and recommend best practices in credit risk management including:
Credit and underwriting policies
Comprehensive due diligence
Diversification requirements and aggregate counter-party exposure limits
Use of credit derivatives and credit support agreements
Sources: JP Morgan “Bond-CDS Basis Handbook”
Commentary on Question:
In order to get full marks for part (a) of the question, it would be expected that the
candidate would be able to calculate the price of each bond with the appropriate discount
rate.
In order to get full marks for part (b), it was expected the candidate would get a minimum
of 9 of the points outlined below.
In order to get full marks on part (c), the candidate would be required to calculate at least
6 of the 8 cashflows that took place correctly.
Solution:
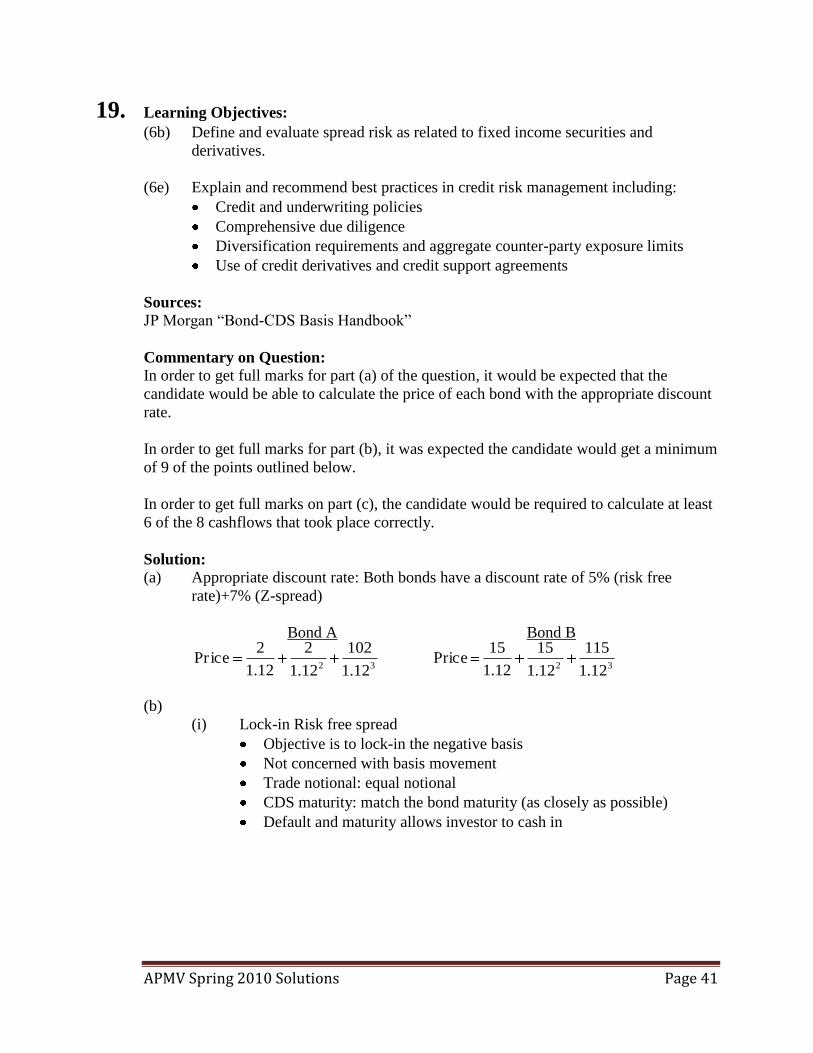
(a) Appropriate discount rate: Both bonds have a discount rate of 5% (risk free
rate)+7% (Z-spread)
Bond A Bond B
(b)
(i) Lock-in Risk free spread
Objective is to lock-in the negative basis
Not concerned with basis movement
Trade notional: equal notional
CDS maturity: match the bond maturity (as closely as possible)
Default and maturity allows investor to cash in
32 12.1
102
12.1
2
12.1
2icePr
32 12.1
115
12.1
15
12.1
15Price

APMV Spring 2010 Solutions Page 42
19. Continued
(ii) Basis Trading
Objective is to profit from the basis becoming more positive/less
negative in the short/medium term
Trade notional: Duration weighed
CDS maturity: Higher CDS maturities will imply higher CDS
duration
(iii) Profit from a default
Jump-to-Default Trading
Trade Notional: equal notional
CDS maturity: enough to include the period where the investor is
expecting the default happen
(c)
(i) Buy Bond A and buy CDS protection with 3-year maturity under the
locking the risk-free spread strategy.
Time Cashflow
0 - Bond PRICE A
1 2-5 = -3
2 2-5 = -3
3 -3
(ii) Buy Bond B and buy CDS protection with 2-year maturity under the profit
from default strategy.
Time Cashflow
0 - Bond Price B
1 15-5
2 100 (1-.60-.05)+100(.60)
3 0

APMV Spring 2010 Solutions Page 43
20. Learning Objectives:
(6a) Define and evaluate credit risk as related to fixed income securities, derivatives,
and reinsurance ceded.
(6b) Define and evaluate spread risk as related to fixed income securities and
derivatives.
Sources: V-C166-09: M. Gibson, Understanding the Risk of Synthetic CDOs, July 2004.
Commentary on Question:
This question tests candidate‟s understanding of synthetic CDO‟s structure and valuation.
It also tests candidate‟s understanding on the impact of each tranche from different
attributes.
Solution:
(a) 1
1
( )n
i i i
i
Contingent D EL EL
1
{( ) }n
i i i
i
Fee s D H L EL
The Mark to Market of the tranche = Fee- Contingent
Set Mark to Market = 0 at inceptions
(i.e. Contingent = Fee)
0.05 0.05(2) 0.05(3)2 (4 2) (10.5 4)Contingent e e e
Contingent = 9.3
(exp( .05) (70 ) exp(2 .05) (70 10.05))
175.615
9.3/175.61 5.3%(530bp)
Fee s c x
Fee s
S
(b) Expected Loss Leverage (10.5/ 70) /(15.3 10.5 3.4 /1000) 5.14 Leverage
Unexpected Loss Leverage (31.5/ 70) / 27.6 31.5 22.1/1000) 5.54Leverage
(c)
(i) Increase in Credit Spread
Expected Loss of Mezzanine increases with credit spread as the
probability of default increases.
If credit enhancement is high, the leverage would increase.
This is because high risk assets need to be more leveraged to generate the
same expected losses. There are more equity tranche amounts to absorb
the risk.

APMV Spring 2010 Solutions Page 44
20. Continued
(ii) Increase in Credit Enhancement of Mezzanine Tranche
Expected Loss of Mezzanine decreases as credit enhancement increases as
there are larger equity tranches to absorb the risk.
The leverage will decrease as well as the risk of the tranche has been
shifted to lower tranche. (3 points for the correct direction and 2 points
for explanation.)
(d) The value of the senior tranche falls as correlation rises.
The value of the equity tranche increases as correlation rises.
The value of the Mezzanine tranche increases very slightly or unchanged as
correlation rises.
A higher correlation of defaults implies a greater likelihood that losses will wipe
out the equity and Mezzanine tranches and inflict losses on the senior tranche.
Higher correlation also makes the extreme case of very few defaults more likely.
Value of the equity tranche rises as correlation rises.
Mezzanine tranches are subject to both effects, which can broadly cancel each
other out making Mezzanine tranches less sensitive to correlation, as in Figure 4.
APMV Spring 2010 Solutions Page 45
21. Learning Objectives: (4b) Assess a portfolio position against portfolio management objectives and
recommend a strategy to rebalance the portfolio
(4c) Evaluate complex situations associated with the presence of embedded options,
hedging strategies, accounting considerations, taxation and capital requirements
under a range of economic environments
(4e) Recommend an investment strategy for a given situation
Portfolio policy and objectives
Asset selection criteria
Capital market expectations
Risk management strategy
Sources: Tilman, Ch 6, “The role of alternative investments in asset/liability management of
financial institutions” p.69
Litterman, Ch. 26, “Strategic asset allocation and hedge funds” p. 487
Magin & Tuttle, Ch 8, “Alternative investments Portfolio Management” by Yau,
Schneeweis, Robinson, & Weiss, p. 542, 554, 559
Commentary on Question:
This is a retrieval and calculation question expecting the candidates to demonstrate their
knowledge of hedge fund monitoring and evaluation techniques.
Solution:
(a)
Backfill bias
o Hedge fund reporting is voluntary
o Managers are likely to go back and report results only if they are good
Survivorship bias
o Poor performers have exited the business
o Index drops from 50 to 25 funds over the year
Infrequent reporting
Asset value weighting may be a problem
Index and fund categorization mismatch
o Duichong is a long-short hedge fund
o Lehman Sisters is a Global Macro hedge fund index

APMV Spring 2010 Solutions Page 46
21. Continued
(b) downside deviation = 1n
)]0,rr[min(n
1i
2
t
r = 0.005, r1 = 0.08, r2 = 0.24, r3 = -0.07, r4 = -0.15, n = 4
downside deviation = 3
)005.015.0()005.007.0( 22
= 0.099
annualized = 0.099 x n = 0.099 x 4 = 0.198
(c) annualized return = r = 4x)1)]85.0(x)93.0(x)24.1(x)08.1([( 4/1 = 5.74%
annualized rf = 0.005 x 4 = 0.02
r = (0.08+0.24-0.07-0.15)/4 = 0.025
quarterly s.d. = 1n
)rr(n
1i
2
t
=
3
)025.15.()025.07.()025.24(.)025.08(. 2222
= 0.172
annualized s.d. = 0.172 x 4 = 0.344
Sharpe Ratio = s.d. annualized
rr f = 344.
02.00574.0 = 0.1087
Sortino Ratio = deviation downside
rr f = 198.
02.00574.0 = 0.1889
(d) PAP Life should use the Sortino ratio to evaluate the hedge fund performance
PAP Life has low risk tolerance
More concerned about downside risk
Sortino ratio gives better risk adjusted performance measure for hedge fund
(e)
Recommend Duichong hedge fund
Duichong has a higher Sortino ratio than High Return
APMV Spring 2010 Solutions Page 47
22. Learning Objectives: (3a) Critique and propose asset allocation strategies that can be used to construct an
asset portfolio.
Sources: Ch. 9-10 and 26-28 of Litterman, Modern Investment Management.
V-C151-09 Sharpe, Expected Utility Asset Allocation
Maginn, Managing Investment Portfolios Ch. 8.
Tilman, Asset/Liability Management of Financial Institutions Ch. 6.
Commentary on Question: This is a recall and comprehension question asking the candidates to demonstrate their
understanding of approaches used in developing a strategic asset allocation for a pension
plan, as described in Ch. 9-10 and 26-28 of Litterman, Modern Investment Management.
Solution:
(a) 1. The two points listed are correct. The following points could be added:
level of diversification
currency hedging
structure of active risk
duration matching.
Bond/equity split is the most important.
2. Bonds and public equities should be included. Consideration should be given
to domestic/foreign split. Long duration bonds should be added. Real estate
and commodities may be considered.
PE & HF may be inappropriate – high cost of due diligence and illiquidity.
PE may be inappropriate due to high risk.
On the other hand, HF may be appropriate – search for yield, diversification,
more mature HF market.
Since the plan in question is underfunded:
it may benefit from higher equity allocation as expected return on assets is
increased;
it may not benefit from global diversification;
there is greater benefit from duration matching.
Stocks & PE may be inappropriate – poor hedge for fixed-income liabilities.
HFs can be counted as floating asset that could be converted to fixed using
swaps, so consider swaps.
APMV Spring 2010 Solutions Page 48
22. Continued
3. This is questionable. EF results are very sensitive to assumptions. Historical
data is very sensitive to choice of historical period. Constraints may be
needed. There is potential for extreme portfolios.
There are issues with historical PE returns, lack of consistent historical HF
return data.
There are informational inefficiencies with HFs.
There is skewness in HF returns that is not captured in EF analysis.
It‟s important to take HF fees into account.
Historical returns are poor predictors of future returns. Expected returns
should be based on current conditions/typical relationships. Equilibrium
approach to setting expected returns is preferred.
Historical data may be robust enough to set risk characteristics (volatility &
correlations).
Benefits of the equilibrium approach: better neutral point, reliance on
observable info and identification of key trade-offs.
Could consider “reverse optimization” to set realistic assumptions.
4. Sharpe ratio good in the absence of liabilities, but not for a pension plan.
Better to optimize funded ratio or surplus.
Better measure: RACS (risk-adjusted change in surplus)
RACS = E[St+1 – St(1+Rf)]/ [St+1]
Where, St is surplus at time t and Rf is the risk-free rate.
Need qualitative evaluation.
Need to develop intuition for the structure.
(b) Should model liabilities, match duration.
Liability stream resembles a bond; hence liabilities could be modeled as a bond
portfolio.
Use current projected benefit payment information (cash flow) priced using
current term structure of interest rates.
Publicly traded bond index could be used as a proxy.
Index may be levered to match duration.
RL-Rf = (RB-Rf) + Where, RL is the return on liability index, Rf is the risk-free
rate, RB is the return on bond index.
is the duration matching parameter, is the noise term.
Additional sources of uncertainty: mortality rates, employee demographics and
salary growth.
Funding ratio low, so liabilities matter.
This is a mature plan; hence liquidity needs should be analyzed.
Consider dynamic analysis to investigate long-run impact of payouts.
Determine required returns.
Consider “hurdle rate” approach for HFs.
Consider expected utility asset allocation.
Consider a projection of outcomes over several years.
APMV Spring 2010 Solutions Page 49
23. Learning Objectives: (2a) Describe and compare specialized financial instruments that can be used in the
construction of an asset portfolio supporting financial institutions and pension
plan liabilities.
(5f) Compare and select risk management techniques that can be used to deal with
financial and non-financial risks listed in (5b). (Currency risk, credit risk, spread
risk, liquidity risk, interest rate risk, equity risk, product risk, operational risk,
legal risk and political risk)
Sources:
Fabozzi, Handbook of Fixed Income Securities, 7th
Edition, 2005 Ch.23, Agency
Mortgage-Backed Securities (pp. 513-527)
Babbel, D. and Fabozzi, F.J., Investment Management for Insurers Ch.20, Valuation and
Portfolio Risk Management with Mortgage-Backed Securities
Commentary on Question:
This question requires candidates to demonstrate a working knowledge of the features
and dynamics of Agency pass-through securities. Beyond a recitation of the features, the
question requires candidates to describe the importance of key features in the portfolio
management process, and to evaluate the appropriateness of several typical models that
are used to assess the appropriateness of these securities.
Solution:
(a)
(i) The WAC is important because it not only tells investors about the interest
rates of the underlying mortgages but also reveals the sensitivity of the
loan pool to prepayments.
When current mortgage rates available to borrowers are less than the
current WAC of the loan pool by 150 basis points or more, investors
would anticipate the pass-through to exhibit faster prepayment speeds.
(ii) WAM is another important measure because it gives investors an idea of
how many payments are remaining before the principal of the pool is
retired.
Specifically, the WAM represents an average maturity weighted by the
loan balances of the pool.
WALA is just the converse of WAM and represents the average age of the
underlying loans in the pool weighted by their balance.
APMV Spring 2010 Solutions Page 50
23. Continued
(b) 1. Turnover - prepayments that result from changing residences constitute a
base prepayment rate.
Due-on-sale clause: most conventional mortgages contain a due-on-sale
clause, which stipulates that the mortgage must be paid in full when the
house is sold.
Assumable: means the loan can be transferred to the new homeowner as
long as the new borrower meets minimum credit requirements.
2. Refinancing – represents the largest and most variable source of pre-
payments.
Borrowers with high credit quality who want to take advantage of lower-
cost mortgages in a falling-interest-rate environment are the key
refinancers.
Cash-out refinance: borrowers who refinance in order to borrow more
money than the existing loan balance on their property, provided that there
is sufficient equity in the house.
Credit curing: borrowers with previously tarnished credit histories are able
to refinance at more favorable rates because of improvements in their
credit ratings.
3. Defaults:
Not technically prepayments, but have the same financial effect as
prepayments in that the principal balance of the defaulted loan is returned
to the investor in the case of agency MBS.
Because of the explicit and implicit governmental guarantee provided to
the government-sponsored enterprises, the investor is protected from the
credit risk of individual borrowers that compose the pool.
Defaults of agency MBS represent only a small fraction of monthly
prepayments because of the high credit quality of the underlying
mortgages and therefore can be forecast as a component of prepayments.
(c)
(i) Static models:
Hedge against small changes from the current state of the world.
A term structure is an input to the model which matches assets and
liabilities under this structure.
The assets and liabilities will move in the same direction and by equal
amounts.
This is the fundamental principle behind portfolio immunization.
APMV Spring 2010 Solutions Page 51
23. Continued
(ii) Single-period, stochastic models:
Do not permit the specification of a stochastic process that describes
changes of the economic environment from its current status.
A stochastic ALM model describes the distribution of returns of both
assets and liabilities in the volatile environment and ensures that
movements of both sides of the balance sheet are highly correlated.
The implementation of this strategy requires the generation of
scenarios of holding period returns.
Does not account for the fact that the portfolio manager is likely to
rebalance the portfolio once some surplus is realized.
As the stochastic process evolves across time different portfolios may
be more appropriate for capturing the correlations of asset and
liability, the single-period model may recommend a conservative
strategy.
(iii) Multi-period, dynamic models:
This is a stochastic model of the previous section to a setting with
multiple time periods.
Assumes that a portfolio manager must make investment decisions
facing an uncertain future.
This model is substantially more flexible than the previous two
models.
This model explicitly allows for portfolio rebalancing at future time
periods, as more information about the uncertain scenarios becomes
available.
Transaction costs can also be incorporated.
By explicitly representing the scenario in the constraints we can
include scenarios not only of interest rates but also of prepayments,
spreads, etc.