Spreadsheets for Images - Computer...
8
Spreadsheets for Images Marc Levoy Computer Science Department Stanford University Abstract We describe a data visualization system based on spreadsheets. Cells in our spreadsheet contain graphical objects such as images, volumes, or movies. Cells may also contain widgets such as buttons, sliders, or curve editors. Objects are displayed in miniature inside each cell. Formulas for cells are written in a general-purpose programming language (Tcl) aug- mented with operators for array manipulation, image processing, and rendering. Compared to flow chart visualization systems, spreadsheets are more expressive, more scalable, and easier to program. Com- pared to conventional numerical spreadsheets, spreadsheets for images pose several unique design problems: larger formulas, longer computation times, and more complicated intercell depen- dencies. In response to these problems, we have extended the spreadsheet paradigm in three ways: formulas can display their results anywhere in the spreadsheet, cells can be selectively dis- abled, and multiple cells can be edited at once. We discuss these extensions and their implications, and we also point out some unexpected uses for our spreadsheets: as a visual database browser, as a graphical user interface builder, as a smart clipboard for the desktop, and as a presentation tool. CR Categories: I.4.0 [Image Processing]: General — Image pro- cessing software; I.3.6 [Computer Graphics]: Methodology and Techniques — Interaction techniques, Languages; D.3.2 [Pro- gramming Languages]: Language Classifications — Data-flow languages Additional keywords: data visualization, user interfaces, flow charts, visual programming languages, spreadsheets 1. Introduction The majority of commercially available image processing and data visualization systems employ a flow chart paradigm. Users select processing modules from a menu and wire them together using a mouse. Although elegant in principle, flow charts are limited in expressiveness and scalability. Useful program- ming constructs like procedure calls and variable substitution can- not be conveniently expressed in these systems. Flow charts spend their screen real estate on operators and their interconnec- tions, which becomes uninteresting once the flow chart has been Address: Center for Integrated Systems Email: [email protected] Stanford University Web: http://www-graphics.stanford.edu Stanford, CA 94305-4070 specified, and they run out of screen space if the chart exceeds a few dozen operators. Flow charts also provide no convenient mechanism for managing multiple datasets. We propose an alternative paradigm based on spreadsheets. Broadly speaking, a spreadsheet is a system for specifying con- straints among cells arranged in a grid. Cells may contain a con- stant data value or a formula that evaluates to a data value. For- mulas may reference the value of other cells, but they may not alter the value of other cells. Formulas are typically written in a simple, interpreted language. Examples of spreadsheet systems are Microsoft’s Excel, Lotus’s 1-2-3, and Borland’s Quattro. We have implemented a spreadsheet for images (hen- ceforth denoted SI) in which we extend the notion of a data value to include graphical objects such as images. These objects are displayed in miniature inside each cell. Double clicking on a cell brings up the full-size object. Cells may also contain interactive widgets. Manipulating a widget modifies the data associated with the cell. If formulas in other cells reference the modified cell, they are recomputed as well. Formulas in our spreadsheet are written in Tcl, a general- purpose programming language that provides variables, assign- ment statements, procedures, and a full complement of control structures. The formula for a cell can range from a one-line expression to an entire program. To support editing of such for- mulas, SI is intimately tied to Emacs, a popular, customizable text editor. Double clicking on a cell brings up an Emacs window devoted to that cell. Compared to flow chart systems, the presence of an embed- ded formula language makes SI more expressive. The infinite grid of the spreadsheet, together with the ability to resize cells, gives SI better scalability. SI also spends its screen space on operands rather than operators, which are usually more interesting to the user. Finally, because spreadsheets are two-dimensional, they provide a natural mechanism for applying multiple operators to multiple datasets. Compared to conventional numerical spreadsheets, SI offers three important extensions. Firstly, a formula in SI can display its result anywhere in the spreadsheet. This allows users to intermix functional and imperative programming styles, simpli- fying many common tasks. Secondly, SI allows cells to be selec- tively disabled. This allows users to work on one part of the spreadsheet at a time, a useful feature in the face of long cell com- putation times. Thirdly, SI allows multiple cells to be edited at once and fired as a group. This simplifies development of compli- cated spreadsheets. These three extensions complicate the depen- dency analysis and the cell firing algorithm, as we shall see. The remainder of the paper is organized as follows. Sec- tion 2 presents our reasons for choosing Tcl as our formula language, and it describes how Tcl and SI fit together. Section 3 describes the logical structure and command set of SI. The remaining sections describe SI’s implementation, our experiences with SI, comparisons with other systems, and the future of SI.
Transcript of Spreadsheets for Images - Computer...

Spreadsheets for ImagesMarc Levoy
Computer Science DepartmentStanford University
AbstractWe describe a data visualization system based on
spreadsheets. Cells in our spreadsheet contain graphical objectssuch as images, volumes, or movies. Cells may also containwidgets such as buttons, sliders, or curve editors. Objects aredisplayed in miniature inside each cell. Formulas for cells arewritten in a general-purpose programming language (Tcl) aug-mented with operators for array manipulation, image processing,and rendering.
Compared to flow chart visualization systems, spreadsheetsare more expressive, more scalable, and easier to program. Com-pared to conventional numerical spreadsheets, spreadsheets forimages pose several unique design problems: larger formulas,longer computation times, and more complicated intercell depen-dencies. In response to these problems, we have extended thespreadsheet paradigm in three ways: formulas can display theirresults anywhere in the spreadsheet, cells can be selectively dis-abled, and multiple cells can be edited at once. We discuss theseextensions and their implications, and we also point out someunexpected uses for our spreadsheets: as a visual databasebrowser, as a graphical user interface builder, as a smart clipboardfor the desktop, and as a presentation tool.
CR Categories: I.4.0 [Image Processing]: General — Image pro-cessing software; I.3.6 [Computer Graphics]: Methodology andTechniques — Interaction techniques, Languages; D.3.2 [Pro-gramming Languages]: Language Classifications — Data-flowlanguages
Additional keywords: data visualization, user interfaces, flowcharts, visual programming languages, spreadsheets
1. IntroductionThe majority of commercially available image processing
and data visualization systems employ a flow chart paradigm.Users select processing modules from a menu and wire themtogether using a mouse. Although elegant in principle, flow chartsare limited in expressiveness and scalability. Useful program-ming constructs like procedure calls and variable substitution can-not be conveniently expressed in these systems. Flow chartsspend their screen real estate on operators and their interconnec-tions, which becomes uninteresting once the flow chart has been������������������������������������
Address: Center for Integrated Systems Email: [email protected] University Web: http://www-graphics.stanford.eduStanford, CA 94305-4070
specified, and they run out of screen space if the chart exceeds afew dozen operators. Flow charts also provide no convenientmechanism for managing multiple datasets.
We propose an alternative paradigm based on spreadsheets.Broadly speaking, a spreadsheet is a system for specifying con-straints among cells arranged in a grid. Cells may contain a con-stant data value or a formula that evaluates to a data value. For-mulas may reference the value of other cells, but they may notalter the value of other cells. Formulas are typically written in asimple, interpreted language. Examples of spreadsheet systemsare Microsoft’s Excel, Lotus’s 1-2-3, and Borland’s Quattro.
We have implemented a spreadsheet for images (hen-ceforth denoted SI) in which we extend the notion of a data valueto include graphical objects such as images. These objects aredisplayed in miniature inside each cell. Double clicking on a cellbrings up the full-size object. Cells may also contain interactivewidgets. Manipulating a widget modifies the data associated withthe cell. If formulas in other cells reference the modified cell,they are recomputed as well.
Formulas in our spreadsheet are written in Tcl, a general-purpose programming language that provides variables, assign-ment statements, procedures, and a full complement of controlstructures. The formula for a cell can range from a one-lineexpression to an entire program. To support editing of such for-mulas, SI is intimately tied to Emacs, a popular, customizable texteditor. Double clicking on a cell brings up an Emacs windowdevoted to that cell.
Compared to flow chart systems, the presence of an embed-ded formula language makes SI more expressive. The infinitegrid of the spreadsheet, together with the ability to resize cells,gives SI better scalability. SI also spends its screen space onoperands rather than operators, which are usually more interestingto the user. Finally, because spreadsheets are two-dimensional,they provide a natural mechanism for applying multiple operatorsto multiple datasets.
Compared to conventional numerical spreadsheets, SIoffers three important extensions. Firstly, a formula in SI candisplay its result anywhere in the spreadsheet. This allows usersto intermix functional and imperative programming styles, simpli-fying many common tasks. Secondly, SI allows cells to be selec-tively disabled. This allows users to work on one part of thespreadsheet at a time, a useful feature in the face of long cell com-putation times. Thirdly, SI allows multiple cells to be edited atonce and fired as a group. This simplifies development of compli-cated spreadsheets. These three extensions complicate the depen-dency analysis and the cell firing algorithm, as we shall see.
The remainder of the paper is organized as follows. Sec-tion 2 presents our reasons for choosing Tcl as our formulalanguage, and it describes how Tcl and SI fit together. Section 3describes the logical structure and command set of SI. Theremaining sections describe SI’s implementation, our experienceswith SI, comparisons with other systems, and the future of SI.
������������������������������������������������������load, store, display,openwindow*, closewindow*,popwindow, pushwindow
Register manipulation
loadsheet, storesheet,winsize*, titleheight,view-pixel*
Spreadsheet services
cellsize*, view-cell,cut*, copy*,paste*, delete*,enable*, disable*
Cell manipulation
regexists, queryreg,codereg, codecell
Data structure queries��������������������������������������������������������������������
��������������
��������������
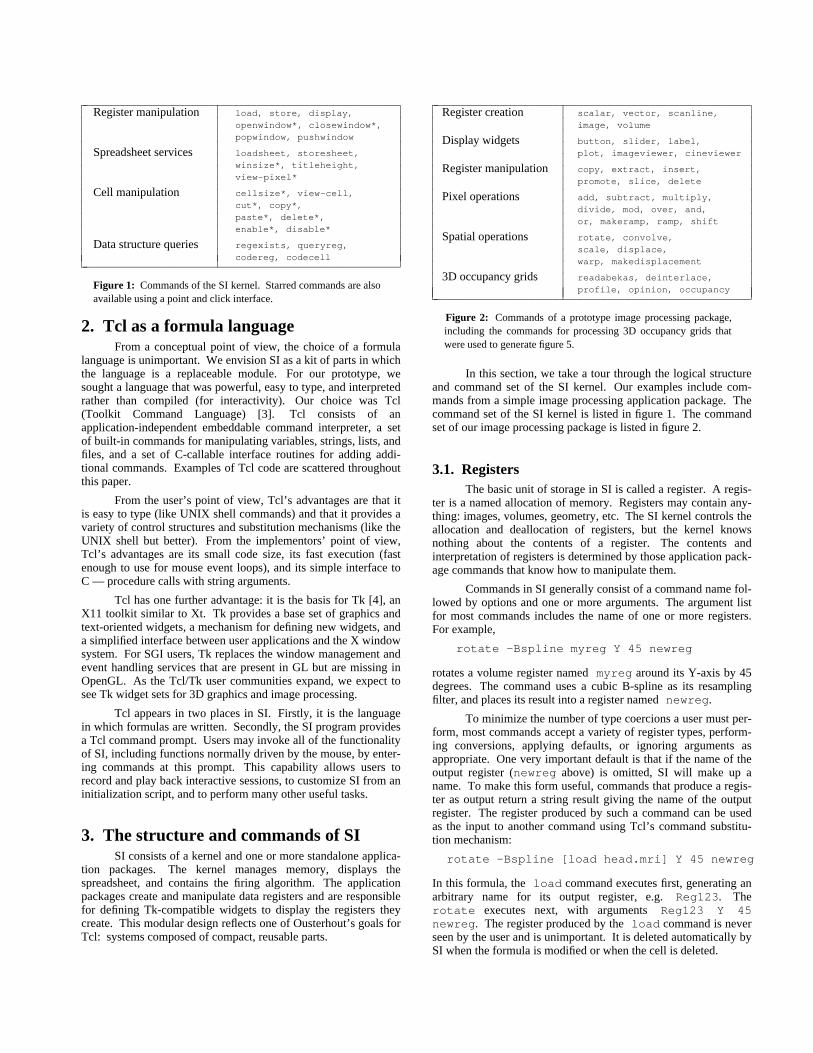
Figure 1: Commands of the SI kernel. Starred commands are alsoavailable using a point and click interface.
2. Tcl as a formula languageFrom a conceptual point of view, the choice of a formula
language is unimportant. We envision SI as a kit of parts in whichthe language is a replaceable module. For our prototype, wesought a language that was powerful, easy to type, and interpretedrather than compiled (for interactivity). Our choice was Tcl(Toolkit Command Language) [3]. Tcl consists of anapplication-independent embeddable command interpreter, a setof built-in commands for manipulating variables, strings, lists, andfiles, and a set of C-callable interface routines for adding addi-tional commands. Examples of Tcl code are scattered throughoutthis paper.
From the user’s point of view, Tcl’s advantages are that itis easy to type (like UNIX shell commands) and that it provides avariety of control structures and substitution mechanisms (like theUNIX shell but better). From the implementors’ point of view,Tcl’s advantages are its small code size, its fast execution (fastenough to use for mouse event loops), and its simple interface toC — procedure calls with string arguments.
Tcl has one further advantage: it is the basis for Tk [4], anX11 toolkit similar to Xt. Tk provides a base set of graphics andtext-oriented widgets, a mechanism for defining new widgets, anda simplified interface between user applications and the X windowsystem. For SGI users, Tk replaces the window management andevent handling services that are present in GL but are missing inOpenGL. As the Tcl/Tk user communities expand, we expect tosee Tk widget sets for 3D graphics and image processing.
Tcl appears in two places in SI. Firstly, it is the languagein which formulas are written. Secondly, the SI program providesa Tcl command prompt. Users may invoke all of the functionalityof SI, including functions normally driven by the mouse, by enter-ing commands at this prompt. This capability allows users torecord and play back interactive sessions, to customize SI from aninitialization script, and to perform many other useful tasks.
3. The structure and commands of SISI consists of a kernel and one or more standalone applica-
tion packages. The kernel manages memory, displays thespreadsheet, and contains the firing algorithm. The applicationpackages create and manipulate data registers and are responsiblefor defining Tk-compatible widgets to display the registers theycreate. This modular design reflects one of Ousterhout’s goals forTcl: systems composed of compact, reusable parts.
������������������������������������������������������scalar, vector, scanline,image, volume
Register creation
button, slider, label,plot, imageviewer, cineviewer
Display widgets
copy, extract, insert,promote, slice, delete
Register manipulation
add, subtract, multiply,divide, mod, over, and,or, makeramp, ramp, shift
Pixel operations
rotate, convolve,scale, displace,warp, makedisplacement
Spatial operations
readabekas, deinterlace,profile, opinion, occupancy
3D occupancy grids�����������������������������������������������������������������������
�����������������
�����������������
Figure 2: Commands of a prototype image processing package,including the commands for processing 3D occupancy grids thatwere used to generate figure 5.
In this section, we take a tour through the logical structureand command set of the SI kernel. Our examples include com-mands from a simple image processing application package. Thecommand set of the SI kernel is listed in figure 1. The commandset of our image processing package is listed in figure 2.
3.1. RegistersThe basic unit of storage in SI is called a register. A regis-
ter is a named allocation of memory. Registers may contain any-thing: images, volumes, geometry, etc. The SI kernel controls theallocation and deallocation of registers, but the kernel knowsnothing about the contents of a register. The contents andinterpretation of registers is determined by those application pack-age commands that know how to manipulate them.
Commands in SI generally consist of a command name fol-lowed by options and one or more arguments. The argument listfor most commands includes the name of one or more registers.For example,
rotate -Bspline myreg Y 45 newreg
rotates a volume register named myreg around its Y-axis by 45degrees. The command uses a cubic B-spline as its resamplingfilter, and places its result into a register named newreg.
To minimize the number of type coercions a user must per-form, most commands accept a variety of register types, perform-ing conversions, applying defaults, or ignoring arguments asappropriate. One very important default is that if the name of theoutput register (newreg above) is omitted, SI will make up aname. To make this form useful, commands that produce a regis-ter as output return a string result giving the name of the outputregister. The register produced by such a command can be usedas the input to another command using Tcl’s command substitu-tion mechanism:
rotate -Bspline [load head.mri] Y 45 newreg
In this formula, the load command executes first, generating anarbitrary name for its output register, e.g. Reg123. Therotate executes next, with arguments Reg123 Y 45newreg. The register produced by the load command is neverseen by the user and is unimportant. It is deleted automatically bySI when the formula is modified or when the cell is deleted.

3.2. Display widgetsThe contents of registers are by themselves undisplayable.
The second building block in SI is a display widget. It is a viewof a register. Some types of registers may have more than onewidget that knows how to display them; others may have none.Such a register would need to be converted to a displayable typein order to view it.
Display widgets are associated with registers using awidget command. For example,
cineviewer -rocking [load head.mri]
loads a volume into a register, then opens a window on the works-tation screen that contains an instance of the cine viewer widget.This widget contains image subwindows and interactive controlsfor viewing slices of a volume as a flipbook animation. The-rocking option specifies that the animation should alternatedirections rather than circling from the last frame back to the firstframe.
3.3. CellsThe third building block in SI is a cell. In addition to their
usual appearance, all display widgets in SI know how to drawthemselves in miniature inside a spreadsheet cell. Miniature ver-sions of widgets may be live, meaning that they respond to mouseevents just like the full-size widget, or dead, in which case doubleclicking on the miniature version brings up the full-size widget.
Display widgets are associated with cells by adding a cellname argument to the widget command. To display a miniatureversion of the cine viewer widget in cell a1, we type
cineviewer -rocking [load head.mri] a1 (1)
So far, we have assumed that all formulas are entered at the SIprogram prompt. If a formula is instead typed into an Emacs win-dow that is associated with a particular cell, the cell name argu-ment may be omitted:
a1: cineviewer -rocking [load head.mri]
We use the notation "a1:" (typeset in Times Roman) to signifythat the formula that follows (typeset in Courier) is contained inthe cell a1. The "a1:" does not appear in the cell. Every type ofregister has a default display widget. For volumes, it is the cineviewer. Therefore, the formula in cell a1 could be furthersimplified to read
a1: load head.mri
Executing this formula would cause the specified file to be loadedinto a volume register, and a miniature version of the cine viewerto be displayed in the cell. If the formula contains more than onecommand separated by newlines, only the register returned by thelast command executed will be displayed in the cell.
In the common case, the user doesn’t need to think aboutregisters or display widgets when writing formulas. The vastmajority of formulas will look like this last example. The key toproviding both brevity and flexibility in the formula language liesin the liberal use of defaults.
3.4. Chaining formulas togetherCell names may be used in any context in which a register
name is valid. This allows us to reference the data in a cell byeither its register name or its cell name. Here is a simple three-cell spreadsheet:
a1: load alps.rgbb1: rotate a1 45c1: ramp b1 [makeramp {{0 255} {255 0}}]
The first command loads an image into cell a1. A miniature ver-sion of the image is displayed in the cell. The second commandrotates the image by 45 degrees and displays the result in cell b1.The third command inverts the pixel values in the rotated image,displaying its result in cell c1. The makeramp commandaccepts a Tcl list of coordinate pairs and returns a Tcl list of coor-dinates piecewise linearly interpolated from the specified coordi-nates. In this example, the command would return the Tcl list{{0 255} {1 254} {2 253}...}}. This list becomes aninput argument to the ramp command, which modifies the imagefrom cell b1.
3.5. Ways to reference a cellAs in numerical spreadsheets, references to cells can be
relative or absolute. b1 is a relative reference. If a formulacontaining this reference were moved down one row using cut andpaste, the reference would be changed to b2. If the formula isbeing edited in an Emacs window at the time it is relocated, SIsends the updated text to Emacs. In contrast, the notation /b1,b/1, or /b/1 forces the column, row, or both coordinates to beabsolute, respectively. Absolute references are not modified if thecells are relocated.
SI also supports arithmetic calculations on cell references.For example, a1+2+3 references the cell two rows down andthree columns right from the base address a1. If a formula con-taining this reference were moved down one row, the base addressa1 would be changed to a2, and the reference would staycorrect. Note that this construction is similar to Excel’sOFFSET(A1,2,3), but is somewhat easier to type.
Finally, all of Tcl’s substitution mechanisms can be appliedto cell references. Thus, a1+$i+$j references the cell whoserow and column offsets from a1 are given by the Tcl variablesi and j respectively. Similarly, a1+[foo]+[bar] referencesthe cell whose offsets are the values returned by the Tcl com-mands foo and bar. Finally, every occupied cell in thespreadsheet has associated with it a Tcl command that returns thecontents of the register displayed in that cell. Thus,a1+[b1]+[b2] references the cell whose offsets are the valuescontained in cells b1 and b2.
3.6. Active widgetsIn addition to being live or dead, widgets may be passive,
meaning that they only display their underlying registers, oractive, meaning that they both display and modify their underly-ing registers. For example:
a1: load alps.rgbb1: sliderb2: rotate a1 [b1]
The command slider in cell b1 is a widget command, Since itis invoked without arguments in this example (compare to thecineviewer command in example (1)), a default scalar integerregister is created, and the slider displays the contents of thatregister. The operand [b1] in cell b2 invokes the commandb1, which returns the current value of the slider in cell b1, and therotate command rotates the image in cell a1 by this amount.Since the formula in cell b2 depends on cell b1, moving the slidercauses the rotation to be recomputed.

The spreadsheet for this example is shown in figure 3. Theslider widget is really Tk’s "scale" widget. The options visible onthe slider command in the figure are options defined by Tk forits scale command. In addition to these Tk-defined options,most active widgets accept a -[no]continuous option.Specifying -continuous means that the widget will fire itsdescendents repeatedly (as fast as possible) until the mouse buttonis released. If the slider in the previous example were so defined,dragging the slider bar back and forth would cause the image torotate back and forth. To reduce computational delays if cell b2were the beginning of a long sequence of operations, active widg-ets also accept a -[no]firedescendents option. Specify-ing -nofiredescendents means that the widget will fireonly its immediate children as long as the mouse button is down.When the button is released, the widget’s other descendents willbe fired.
3.7. Control structuresSI supports all of the control structures in Tcl, including
if, while, for, foreach, and case. Of particularinterest are the looping commands. Loops in SI take one of threegeneral forms:
Single-cell loops. The easiest way to code a loop isentirely within one cell using the Tcl for command:
a1: load alps.reg tempfor {set i 0} {$i <= 90} {incr i 30}
{rotate temp $i a1}
This formula will step the alpine pasture image through four rota-tional positions, each of which will appear briefly in cell a1.
Multi-cell for-loop. If the user has already built asequence of processing steps and decides retrospectively to iterateone or more parameters of the sequence over a range of values,this can be done without reworking the entire spreadsheet byinserting one additional cell at the beginning of the loop to triggerit:
a2: for {set i 0} {$i <= 90} {incr i 30}{byte $i a2; fire b2} (2)
b1: load alps.regb2: rotate b1 [a2]b3: ramp b2 [makeramp {{0 0} {255 100}}]
The original spreadsheet consisted of cells b1 through b3. Cell a2has been added to control the loop. The byte command createsa scalar byte register and displays it in a2 using a Tk label widget.The fire command executes cell b2 as a subroutine. When cellb2 and its descendents (b3 in this example) have finished execut-ing, control is returned to a2, which increments i and loops.
Multi-cell while-loop. If the user wishes to predicate looptermination on a value computed by the loop body, two cells arerequired to control the loop:
a1: load alps.reg (3)c1: byte 3b2: convolve -box [c1] [c1] a1c3: if {[max [gradient b2]] > 50}
{byte [expr [c1] + 1] c1}
In this example, the byte command in cell c1 initializes theloop. The if command in cell c3 evaluates a data object com-puted by the loop body and conditionally modifies cell c1, onwhich the loop body depends. The loop body will thereby bereexecuted repeatedly until the condition becomes false. In this
Figure 3: Slider widget being used to control a rotation. Cell b2rotates the image in cell a1 by the angle specified on the slider incell b1. Each time the slider is moved, cell b2 (and its descendents,if it had any) are recomputed.
example, cell a1 is blurred by a box filter of increasing width(starting at 3x3), stopping when the maximum gradient magnitudein the image drops below 50.
4. Selected implementation details
4.1. The user interfaceSI is implemented in C, C++, Tcl/Tk, and Emacs Lisp.
These depend on UNIX and the X window system but are other-wise platform independent. Some of the widgets currently dependon GL — the nonportable version of Silicon Graphics’s graphicslibrary — but these will shortly be converted to OpenGL, aplatform-independent library.
The unique characteristics of SI pose several challenginguser interface design problems. Firstly, our cells are larger thanthose in numerical spreadsheets, so fewer of them are displayed atonce. To make navigation easier, we provide an accelerated scrol-ling tool and the ability to quickly change the size of all cells.(Individual cells cannot be resized, as this would destroy the regu-larity of the spreadsheet grid.)
Secondly, our longer formulas and powerful languagesemantics lead to more complicated intercell dependencies than innumerical spreadsheets. To keep users from getting lost, the for-mula for each cell is displayed inside the cell. Long formulas canoptionally be decimated to fit (see figures 5 and 6). Although thedecimated text is not legible, its overall structure is clearly visible.To clarify intercell dependencies, the dependency graph can bedisplayed as an overlay (see figures 4 and 5).
Thirdly, our cells take longer to compute than cells innumerical spreadsheets — several minutes in extreme cases. Tokeep the spreadsheet visually consistent during long computa-tions, cells that depend on modified cells are grayed out (inMacintosh style) to indicate that they are out of date. As each cellfires, it is highlighted to provide feedback of its progress. Themouse is alive during cell computations and can be used to navi-gate through the spreadsheet or abort an errant computation.

As a further response to long cell computation times, SIallows cells to be selectively disabled, allowing the user to workon one part of the spreadsheet at a time. In addition, the user canselect a group of cells to edit simultaneously in Emacs, and thenfire the entire group at once with a single keystroke. While mostof the features described above are cosmetic, these last two pro-foundly affect the firing algorithm, which is discussed in the nextsection.
4.2. Managing dependenciesThe dependency relationships in SI are represented by a
directed acyclic graph having two types of nodes, formulas andobjects. Objects consist of cell names, register names, Tcl vari-ables, and Tcl procedures. When a formula consumes an object(e.g. specifies a cell as input, invokes a Tcl procedure, etc.), this isrepresented in the graph by a directed edge from the object to theformula. When a formula produces an object (e.g. specifies a cellas output, defines a Tcl procedure, etc.), this is represented by adirected edge from the formula to the object.
Following user modification of one or more formulas orobjects, the dependency graph is traversed as described in Appen-dix A, and the modified formulas and their descendents arerecomputed. The time required to perform a dependency analysisis usually several orders of magnitude smaller than the timerequired to execute a formula or decimate an image for display, sowe do not discuss it further here.
SI’s firing algorithm differs from the firing algorithmsfound in conventional spreadsheets in two ways. Firstly, the abil-ity to specify objects as outputs in formulas forces us to distin-guish formulas from objects in the dependency graph and givesrise to producer edges (that is, edges from formulas to objects).Surprisingly, this additional flexibility does not complicate thedependency analysis in any substantive way.
The second difference arises from our ability to selectivelydisable and reenable cells and to edit several formulas at once.Conventional spreadsheets do not allow either action. As a result,our firing algorithm begins with a queue of edited or reenabledformulas which need to be executed. To further complicatematters, Tcl allows conditionally executed commands and substi-tutions in command operands (see section 3.5). This prevents usfrom lexically scanning a formula in advance of execution todetermine the set of objects it will consume or produce. Withoutthis information, it is impossible to determine which formula onthe queue should be executed first.
This is a standard problem in operating system design, andthere are standard solutions to it. The solution used in SI (anddescribed in the appendix) is to execute modified formulas in arbi-trary order, requeueing them if they consume undefined or invalidobjects. If the dependency relationships are indeed acyclic, thisalgorithm is guaranteed to find a valid firing order. The presenceof a cycle leads to a condition called livelock, and it will bedetected by our firing algorithm. This solution can lead to wastedcomputation if a formula contains a long computation followed bya reference to an invalid object, requiring the formula to berequeued and recomputed from scratch later, but such cases arerare. In practice, formulas usually make their consumer refer-ences early, so the time lost to requeuing is negligible, and theuser sees only the final firing order. We are currently investigat-ing other solutions, including blocking a formula’s execution untilthe invalid object is available (in this case, cycles lead to a condi-tion called deadlock), lexically scanning the cell to resolve asmany references as possible, or allowing formulas to declare a setof objects they might consume or produce when executed.
5. Experience and examplesOur experience with SI has been limited but positive.
Although its image processing package offers only rudimentaryfunctionality, we have used it in several research projects (seefigure 5). We have also found some unexpected uses for SI, suchas summarizing research results for colleagues and giving publicpresentations (see figure 6). Sometimes, we use it simply as asmart clipboard for storing images on our desktop, like the Macin-tosh clipboard but more powerful. Other plausible applicationsfor SI are as a database browser, as an exposure sheet for com-puter animation, or as a video postproduction planner.
The ability to specify outputs in formulas makes SI verydifferent from a conventional spreadsheet, so it is worthwhile toconsider how this additional power might be used. Consider thespreadsheet shown in figure 4. The user in this example began bybuilding a pipeline for classifying 3D medical datasets. Puzzledby the classified volume displayed in cell d2, the user added thefollowing diagnostic code to the formula in that cell:
set means ""for {set z 0} {$z < [d2 zlen]} {incr z} {
lappend means [mean [slice d2 $z]]}set order [lorder $means]for {set i 0} {$i < 5} {incr i} {
slice d2 b4+0+$i [lindex $order $i]}
This code creates a Tcl list containing the mean pixel intensity foreach of the [d2 zlen] slices in the classified volume, callslorder, a Tcl proc (defined elsewhere in the formula) to gen-erate a second list containing slice numbers in order of decreasingmean slice pixel intensity, and displays the brightest 5 slices incells b4 through f4. Still puzzled, the user created formulas incells f5 and g5 to analyze one of these slices.
In this example, the ability to display results anywhere inthe spreadsheet made it easy to insert the visual equivalent of aprintf statement into an existing formula — without having toreorganize the spreadsheet. The ability to define and referencelocal variables made it easy to write the for-loops needed to sortthe slices — conventional spreadsheets don’t allow local variablesin formulas. The flexibility to use an imperative programmingstyle (that is, with assignment statements) in cell d2 to producecell f4 and a functional programming style in cell g5 to consumecell f4 extends but does not break the spreadsheet paradigm — onthe contrary, it seems very natural. This example would havebeen difficult to write without this flexibility.
6. Comparisons and discussionSpreadsheets for images are not a new idea. Piersol’s ASP
package [6], a spreadsheet program based on the Smalltalk-80object-oriented programming environment, anticipates many ofthe features of SI. Cells are allowed to contain any sort of object,including images and other spreadsheets, and formulas are writtenin Smalltalk — a general purpose programming language. Inkeeping with the conventional spreadsheet paradigm, formulas incells in ASP are not permitted to alter the value of other cells.
Palaniappan’s IISS environment [5] combines a customMathematica-like formula language, Mark Overmars’s Forms UItoolkit, and the Khoros image processing library. IISS appears toallow assignment statements, but a complete definition of theirlanguage and firing algorithm has not yet been published.
A key feature of SI is its ability to intermix functional andimperative programming (see the example in section 5).

Figure 4: A simple classification pipeline for a 3D medical dataset. A slice chosen using the slider in cell b1 is classified according to the transferfunction selected in cell c1. The unclassified and classified slices are displayed in cells b2 and c2, respectively. When the user presses the button incell d1, the entire volume is classified and displayed in cell d2. In addition, the brightest 5 slices are displayed in row 4. The display of theseclassified slices is controlled by the formula in cell d2 (see section 5). An Emacs editor window is also visible; it is currently editing the contents ofthe formula in cell d2.
Interestingly, conventional numerical spreadsheets also offerimperative programming, usually in the form of a second, hiddencommand language that is more flexible than the cell formulalanguage. To write an imperative program using Excel Version4.0 [2], the user creates an auxiliary spreadsheet called a macrosheet that has special properties. Formulas in a macro sheet canassign values to any cell in the macro sheet using theSET.VALUE() function. This notation is not permitted in themain spreadsheet. The advantage of a two-language design is thatit presents a simple programming model to the novice computeruser. The disadvantage is that the jump in complexity fromspreadsheet programming to macro sheet programming is large.
The currently dominant paradigm for visualizing imagedata is flow charts, so it is worthwhile comparing them to SI. Theearliest system to combine a graph-based execution model with avisual programming interface was Paul Haeberli’s ConMan [1].Currently popular flow-chart visualization packages include AVS,Explorer, apE, Khoros, IBM’s Data Explorer, PV-Wave,Wavefront’s Data Visualizer, FIELDVIEW from Intelligent Light,VoxelView, and many others. SGI’s Explorer [7] is perhaps themost highly developed of these packages, so we base our com-parisons on it. Three major factors can be identified:
Expressiveness. The "repeat" and "while" modules of Explorerapproximate the for and while loops of Tcl. Explorer con-tains no modules, however, that evaluate conditionals or performsubstitutions (unless the user writes a custom module).
Scalability. The "micro" form of a module icon in Explorermeasures 116 x 40 pixels; 30 modules and their associated wiringmakes for a crowded window. Modules may be coalesced into asingle icon, but the user must perform this reduction. Cells in SIcan be resized down to 12 x 17 pixels simply by dragging the win-dow frame, allowing up to 6000 cells to be displayed at once.Although cells are unreadable at that size, such a view makes iteasy to navigate through a large spreadsheet.
Customization. Explorer provides extensive support for writingcustom modules, but the jump in complexity from visual program-ming to module programming in C or Fortran is nontrivial. In SI,the formula language is also the customization language. Thetransition from novice user to expert user is therefore smooth. Tofacilitate rapid module prototyping, Explorer also offers an inter-preted language called Shape. Its power is greater than Tclbecause it directly supports array manipulations, but its interfaceto the flow chart via the encapsulating "LatFunction" module issomewhat cumbersome.
7. Status and future workThe kernel of SI is complete and relatively stable. Our
efforts are now focused on building application packages. Theimage processing package used in these examples needs morecommands and a richer library of widgets. We plan to soon add avolume visualization package, a polygon mesh package, and asurface fitting package.
The most critical issue for the future of SI is performance.Spreadsheets offer a natural mechanism not present in flow charts— and not yet exploited in SI — for controlling computationalexpense; images need only be computed at a resolution commen-surate with the size of the cells in which they are displayed. In theearly stages of a data exploration, miniature images suffice, andcomputations should be fast. If the user stretches the spreadsheet,images get bigger and computations slow down. If the user dou-ble clicks on a cell, that cell is recalculated at full resolution.Many image processing operators lend themselves in an obviousway to such computation shedding; spatial warps can be subsam-pled; frequency domain operators can be windowed; polygonalmeshes can be retiled using fewer polygons. Our goal is to makethese optimizations transparent to the user.

Another area for future development is the formulalanguage. Tcl is not an ideal solution in many respects. It offersonly one datatype — strings. Because there are no numericaldatatypes, arithmetic expressions are cumbersome to write, as theexamples in this paper demonstrate. Tcl also does not supportmultidimensional arrays. All manipulation of arrays (and henceimages) in SI must be done through C-language commands.Finally, Tcl does not have the speed of a compiled language likeC. We often find ourselves prototyping a computation in Tcl, thenrewriting it in a combination of Tcl and C. Alternatives to Tclinclude Lisp, a C or C++ interpreter (several now exist), or a newlanguage that combines the simplicity of Tcl with the power of anarray manipulation language like Mathematica or MATLAB.
To summarize, SI combines the power of a data analysislanguage, the interactivity of a flow chart visualizer, and theextemporaneous qualities of a spreadsheet. While the power of SIseems useful and easily manageable in examples such as the oneshown in figure 4, SI is nevertheless a general programmingenvironment, and it is possible to create confusing programs usingit. In particular, the flow of control in the while-loop in section3.7 is not obvious. In general, the presence of conditionally exe-cuted commands and substitutions in command operands meansthat the reference patterns of formulas in SI are dynamic; cyclescan appear and disappear during spreadsheet recomputation. Theability of SI to display the dependency graph and to detect cycleshelps, but it is not foolproof. We are continuing to refine thedesign of SI as we search for a data analysis paradigm that is sim-ple enough to keep a novice out of trouble yet powerful enough tosatisfy the needs of a scientist/programmer.
8. AcknowledgementsDiscussions with David Heeger, Richard Frank, Bob
Brown, and Robert Skinner were useful in the early stages of theproject. I wish to particularly acknowledge many fruitful discus-sions with Philippe Lacroute. This research was supported by theNSF under contract CCR-9157767 and by Software Publishing.
9. References[1] Haeberli, Paul, ‘‘ConMan: A Visual Programming
Language for Interactive Graphics,’’ Computer Graphics(Proc. SIGGRAPH), Vol. 22, No. 4, Atlanta, Georgia,August, 1988, pp. 103-111.
[2] Microsoft Corporation, Excel User’s Guide 2, MicrosoftCorporation, Document Number XL26297-1092, 1992.
[3] Ousterhout, John K., ‘‘Tcl: An Embeddable CommandLanguage,’’ Proc. 1990 Winter USENIX Conference.
[4] Ousterhout, John K., ‘‘An X11 Toolkit Based on the TclLanguage,’’ Proc. 1991 Winter USENIX Conference.
[5] Palaniappan, K., Hasler, A.F., Manyin, M., ‘‘ExploratoryAnalysis of Satellite Data Using the Interactive ImageSpreadsheet (IISS) Environment,’’ Preprint volume of the9th Internation Conference on Interactive Information andProcessing Anaheim, California, January, 1993, pp. 145-152.
[6] Piersol, K.W., ‘‘Object Oriented Spreadsheets: The Ana-lytic Spreadsheet Package,’’ Proc. OOPSLA ’86, Sep-tember, 1986, pp. 385-390.
[7] Silicon Graphics Inc., IRIS Explorer User’s Guide and IRISExplorer Module Writer’s Guide, Silicon Graphics Inc.,Document numbers 007-1371-020 and -1369-, 1992-1993.
Appendix A: The firing algorithmDependency relationships in SI are represented by by a
directed acyclic graph having two types of nodes, formulas andobjects, as described in section 4.2. Formula are marked asmodified or unmodified, and objects are marked as modified orunmodified, and as valid or invalid. Formulas become modified inone of three ways:
(1) The user changes a formula using the Emacs text editor.
(2) The user adds, deletes, cuts, pastes, or loads a cell.
(3) The user enables for firing a previously disabled cell.
Following user modification of one or more formulas, an execu-tion queue is created and is initialized to the set of modified for-mulas, arranged in arbitrary order. The firing algorithm thenproceeds as follows:
Step 1: execute a formula. Remove a formula i fromthe front of the queue, delete all edges originating or ter-minating at i, and submit it to the Tcl interpreter for execu-tion. For each object j consumed (or produced) by formula ias it executes, add a directed edge from j to i (or from i to j)to the graph. If two producer references point to the sameobject, a collision has occurred; flag it as an error. If i isfound to consume an undefined or invalid object (e.g. anempty or invalidated cell, an undefined Tcl procedure, etc.),abort execution and move i to the back of the queue. If noformula on the queue can be executed successfully, thespreadsheet contains a cycle; flag it as an error.
Step 2: invalidate its descendents. If formula i exe-cutes successfully, mark as invalid all objects k such thatthere exists a path of length one or more originating from iand terminating at k. Allow cycles of length two involving aformula and an object. This allows a formula toread/modify/write a register. Cycles of length greater thantwo are flagged as errors.
Step 3: fire its direct consumers. Add to the execu-tion queue all direct consumers of all objects produced by i,i.e. all formulas m for which the graph now contains adirected edge of length two from i to m (passing through anobject).
Following user modification of an object (e.g. by manipulating anactive widget or by resetting a global variable at SI’s Tcl com-mand prompt), all formulas that consume (either directly orindirectly) the object are queued for execution using a similaralgorithm.
To avoid introducing cycles into the dependency graph,multi-cell loops require the following special treatment. In thefor-loop of example (2) (section 3.7), the fire command in cella2 executes cell b2 and its descendents as a subroutine. The sub-routine returns when the execution queue is empty, allowing cella2 to continue execution. This mechanism bypasses the usualdependency analysis, allowing us to omit from the graph a pro-ducer edge from the formula in cell a2 to cell b2 and a consumeredge from cell b3 to the formula in cell a2, which would form acycle. In the while-loop of example (3), the byte command incell c3 conditionally overwrites cell c1, creating an edge in thegraph from c3 to c1 and temporarily creating a cycle. This edge isdeleted each time c3 begins execution. On the last iterationthrough the loop, the byte command is not executed and noedge is created. Therefore, in the quiescent states that precedeand follow execution of the loop, the graph is acyclic.

Figure 5: This spreadsheet depicts the flow of data in a 3D fax machine - a machine we are building in our lab for digitizing the shape andexternal appearance of physical objects using a laser scanner and precision motion platform. When the button in cell a1 is pressed, fourlaser reflection image sequences are loaded into cells a2 through a5, respectively. A cine viewer widget associated with each cell displays aframe from that image sequence in miniature in the cell. The slice specified in the slider in cell b1 is then loaded into cells b2 through b5.Two different occupancy grid algorithms are applied to these slices, leading after some intermediate steps to the results shown in cells c5and i5. Volume renderings of the complete volumetric occupancy grid have been imported from another spreadsheet and are shown in cellsc6 and i6. The user has double clicked on cell i6, so its image is also shown full size at the bottom of the screen. The scene is a pile ofwooden children’s blocks. An Emacs editor window is also visible; it is currently editing the contents of the formula in cell g2.
Figure 6: This spreadsheet was used to give a live classroom demonstration of the effects of image quantization. The original 8-bitimages are in cells a3 through a5. The sliders in cells c1 through i1 are used to set the number of bits to which the images appearing in thatcolumn are quantized. This example demonstrates how the two-dimensional grid of a spreadsheet lends itself naturally to visualizingmultiple operators applied to multiple datasets. The user has double clicked on cells g3 and c5, so they are also shown at full size. Thisspreadsheet took about 10 minutes to construct.