
Spreadsheets and Microsoft Excel. Introduction n A spreadsheet (called a worksheet in Excel) is a...
37
Spreadsheets and Microsoft Excel
-
Upload
james-oconnor -
Category
Documents
-
view
220 -
download
0
Transcript of Spreadsheets and Microsoft Excel. Introduction n A spreadsheet (called a worksheet in Excel) is a...
Spreadsheets andMicrosoft Excel

Introduction
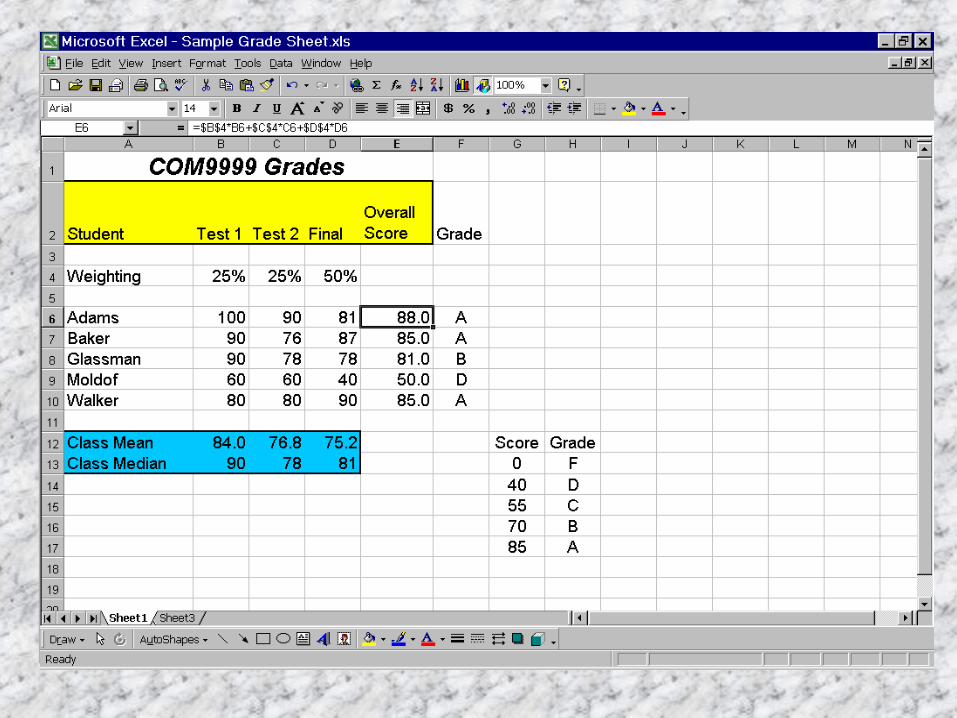
A spreadsheet (called a worksheet in Excel) is a two-dimensional array of cells containing data to be computed and analyzed.
Each cell may contain text, often used as row or column headings, numerical values, or formulas, which are used to compute other numerical values.
Cells may contain other types of data too.

Here is a particular example, including additional formatting features, like text that spans multiple cells and color:
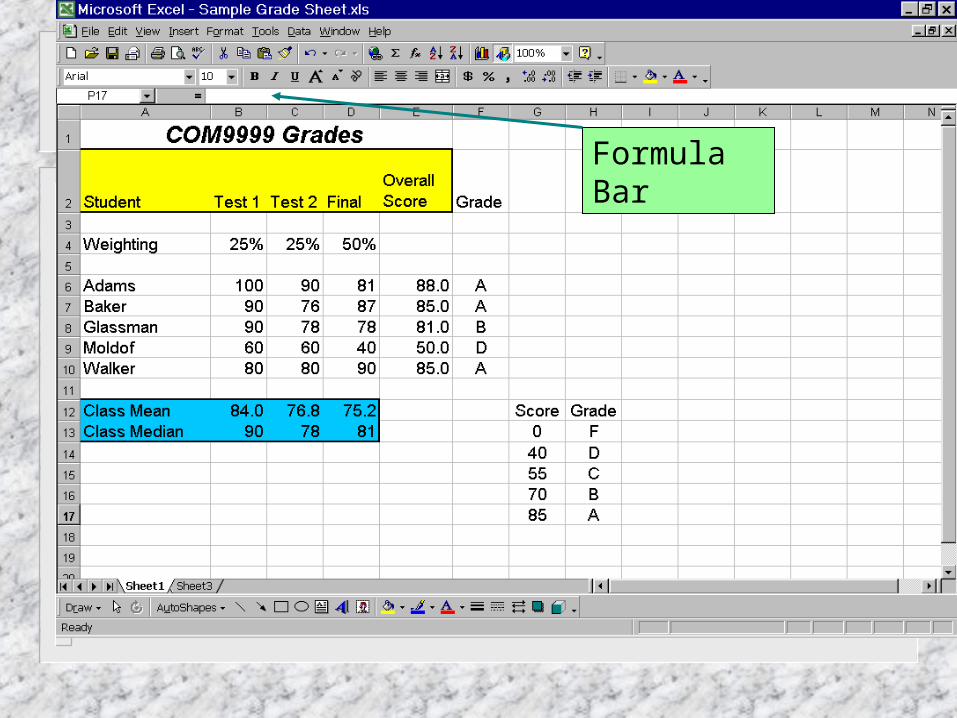
Formula Bar
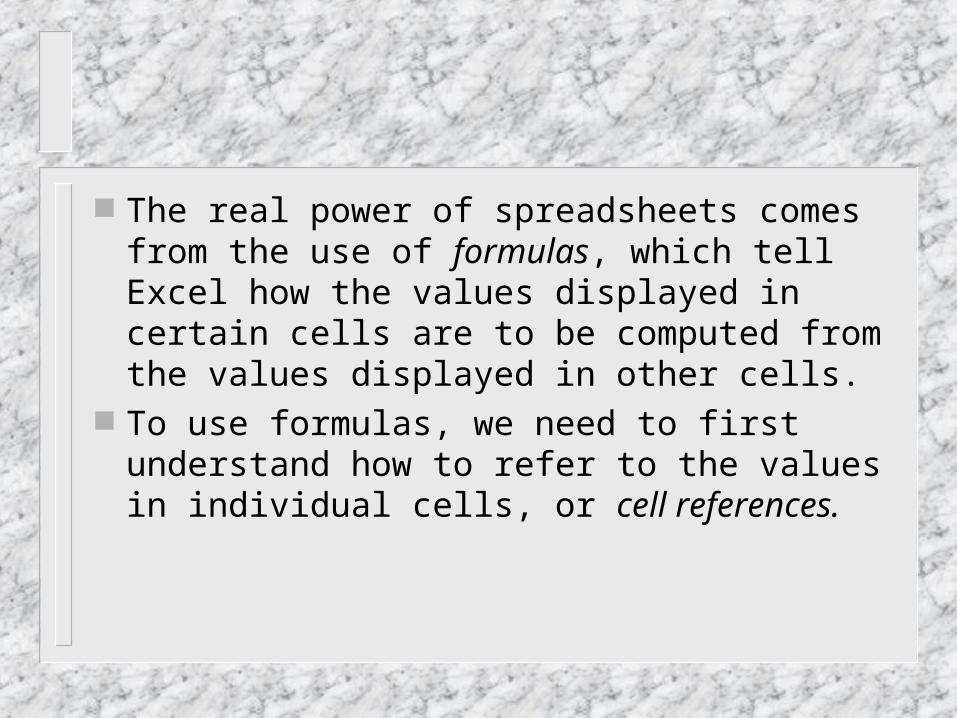
The real power of spreadsheets comes from the use of formulas, which tell Excel how the values displayed in certain cells are to be computed from the values displayed in other cells.
To use formulas, we need to first understand how to refer to the values in individual cells, or cell references.
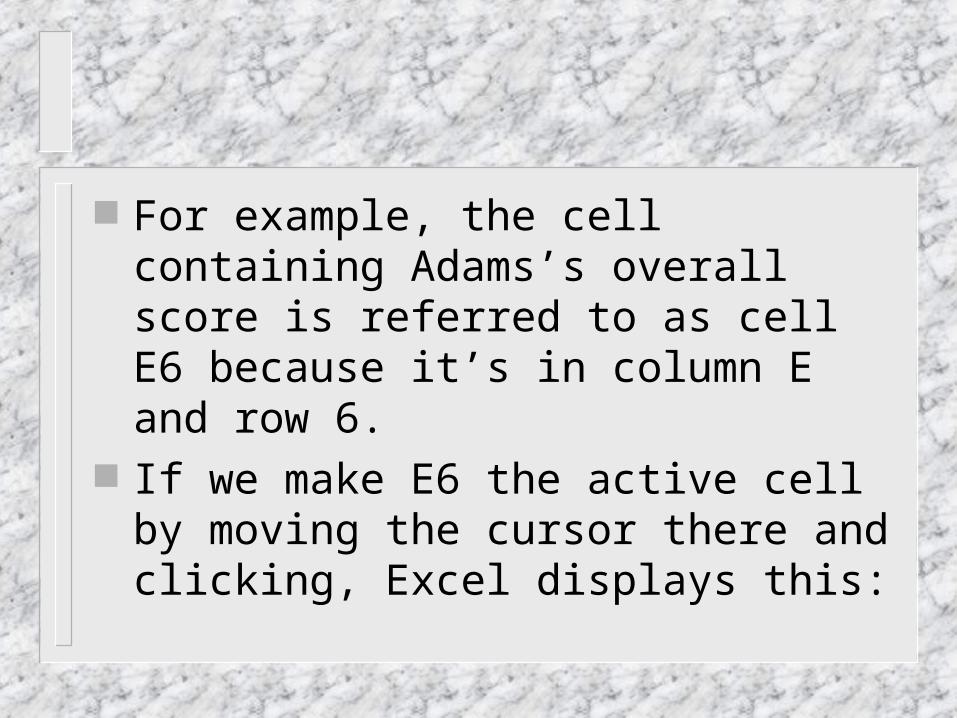
For example, the cell containing Adams’s overall score is referred to as cell E6 because it’s in column E and row 6.
If we make E6 the active cell by moving the cursor there and clicking, Excel displays this:
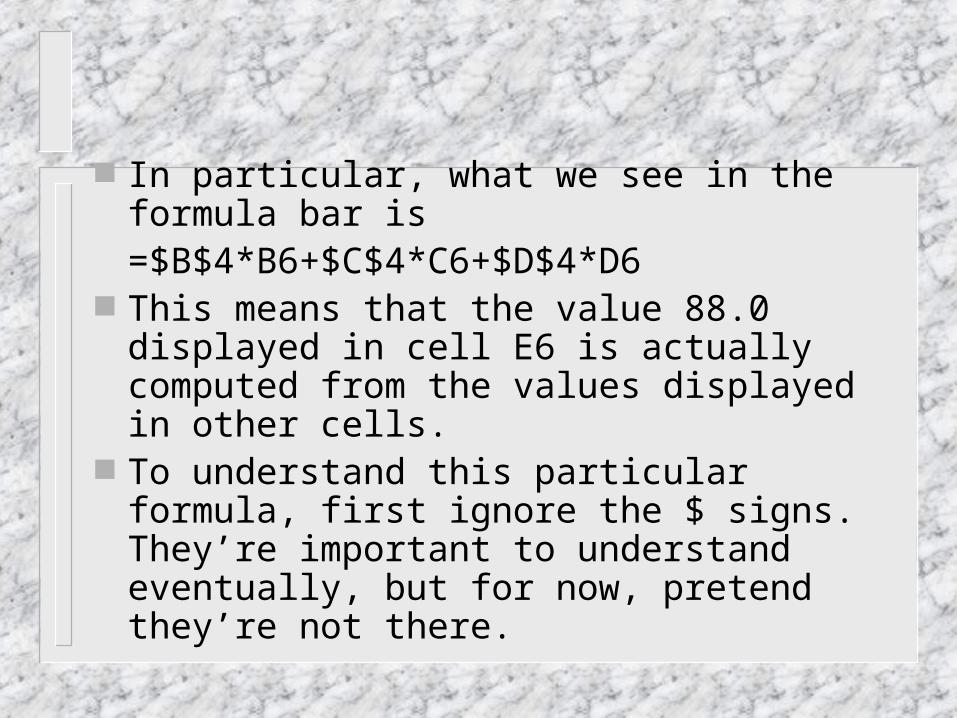
In particular, what we see in the formula bar is
=$B$4*B6+$C$4*C6+$D$4*D6 This means that the value 88.0 displayed in
cell E6 is actually computed from the values displayed in other cells.
To understand this particular formula, first ignore the $ signs. They’re important to understand eventually, but for now, pretend they’re not there.
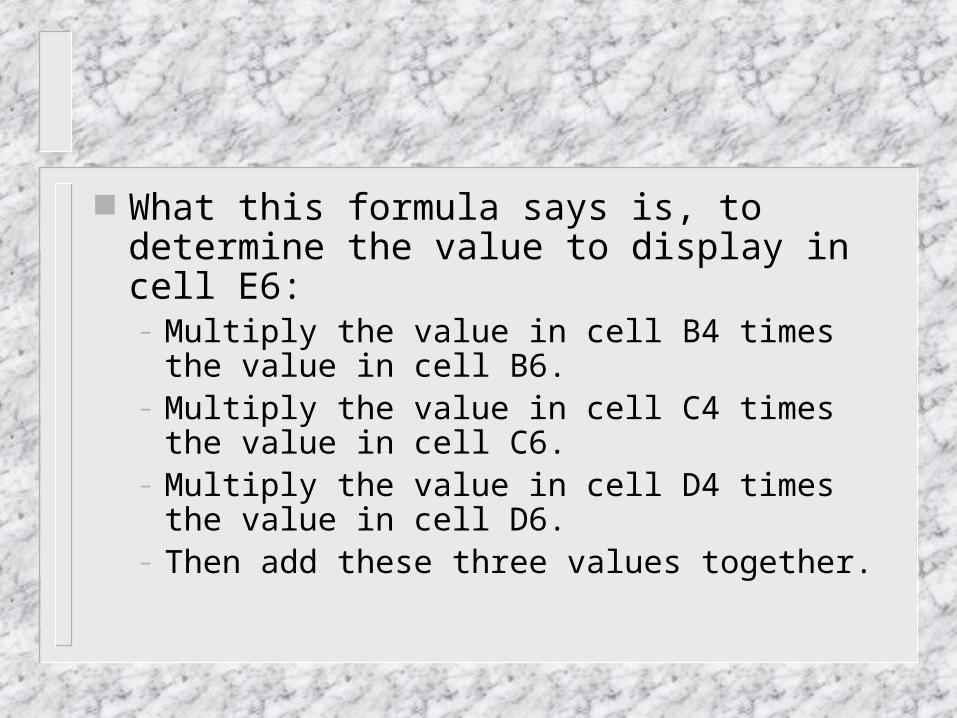
What this formula says is, to determine the value to display in cell E6:– Multiply the value in cell B4 times the value in
cell B6.– Multiply the value in cell C4 times the value in
cell C6.– Multiply the value in cell D4 times the value in
cell D6.– Then add these three values together.
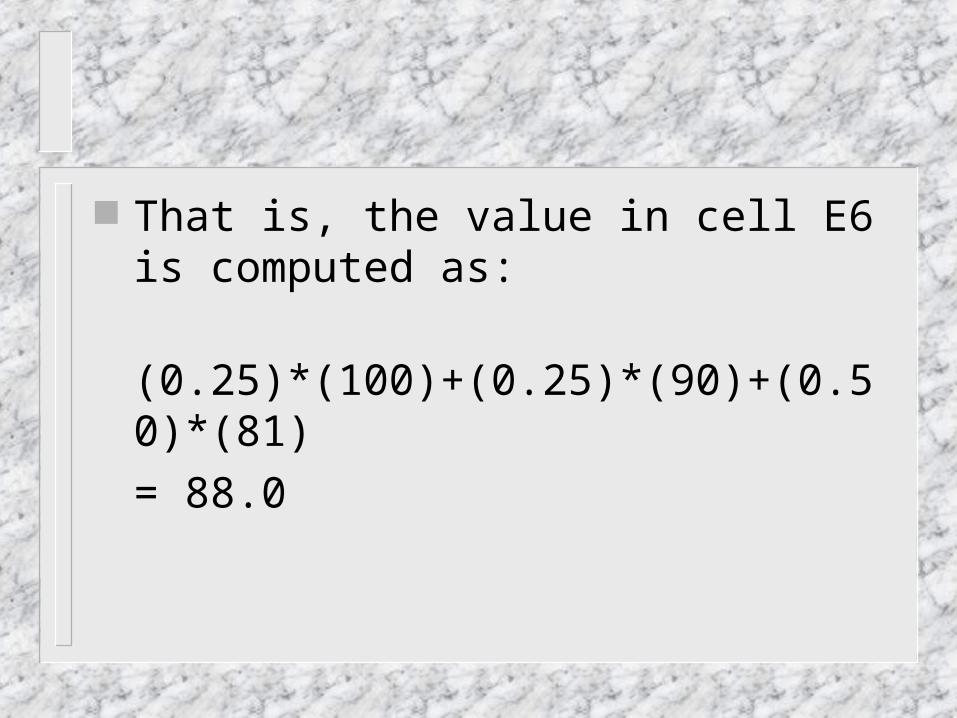
That is, the value in cell E6 is computed as:
(0.25)*(100)+(0.25)*(90)+(0.50)*(81)
= 88.0

The beauty of using a formula in a spreadsheet is that if any cells’ values change, all other cells whose values depend on the changed values (through a formula like this one) are changed themselves, entirely automatically.
For example, suppose we find that Adams should have gotten 85 rather than 81 on the final exam. As soon as we edit the value in cell D6 to make it 85, the spreadsheet looks like this:
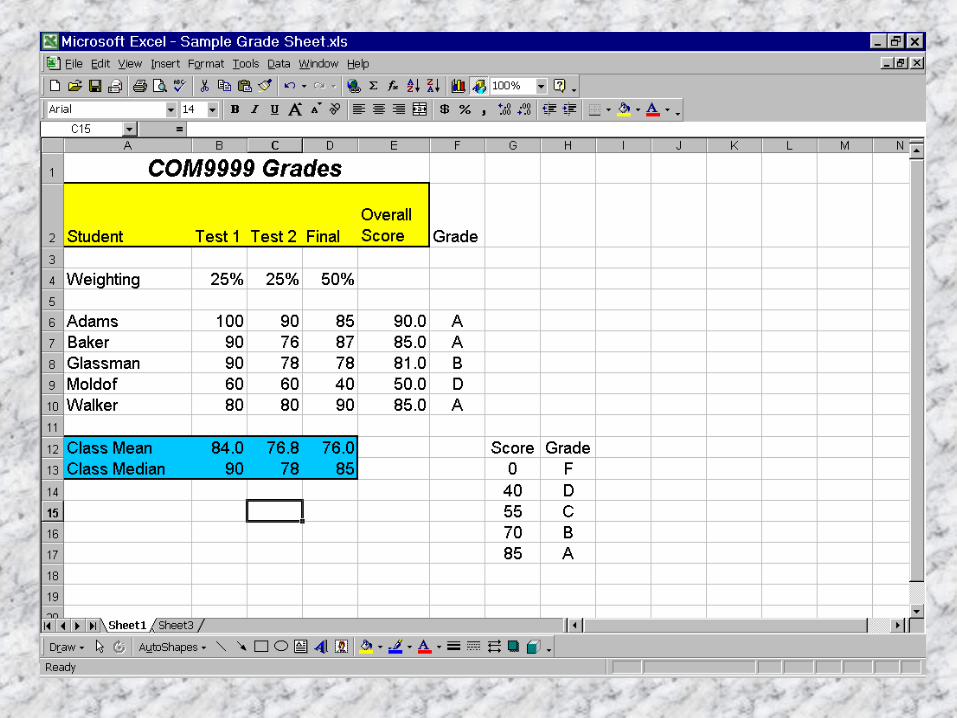
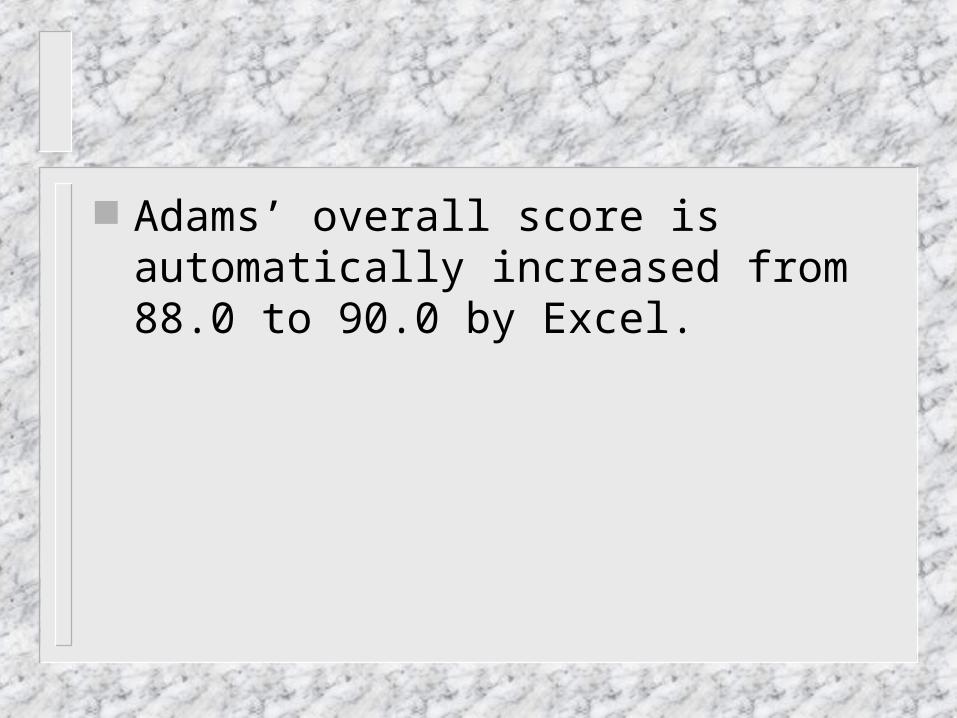
Adams’ overall score is automatically increased from 88.0 to 90.0 by Excel.

Now, what about those $ signs? Suppose we look at how Baker’s overall
score is computed by making C7 the active cell:
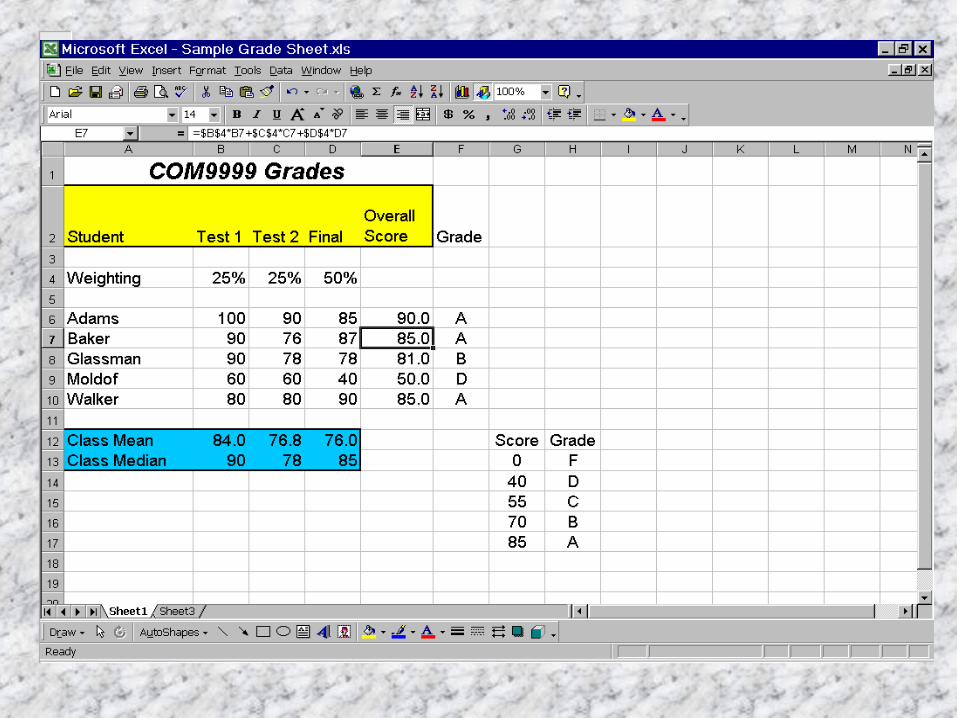
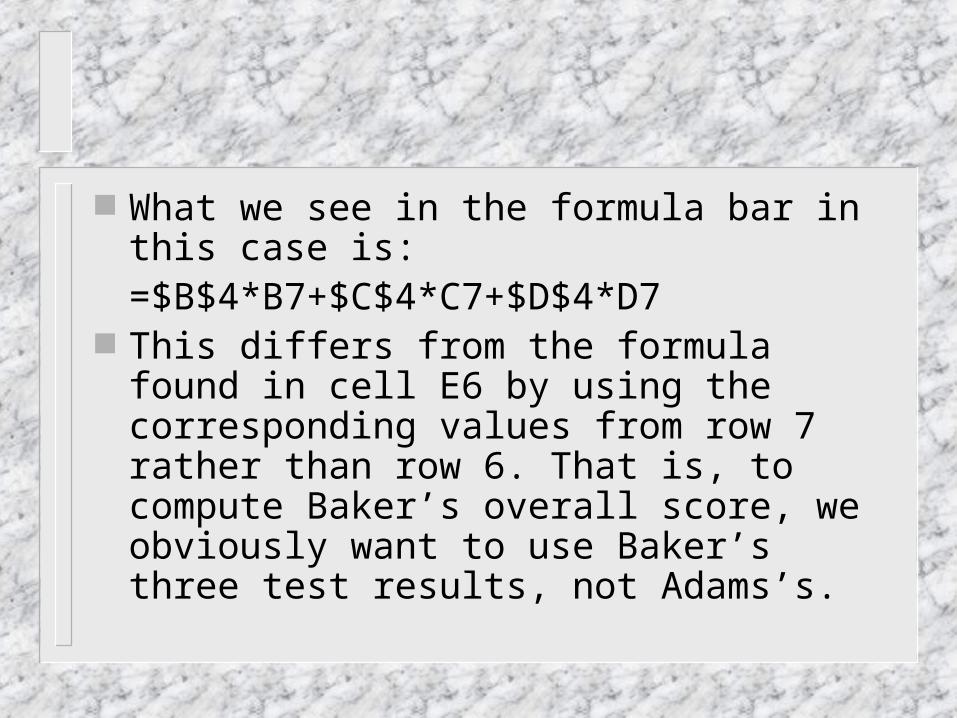
What we see in the formula bar in this case is:
=$B$4*B7+$C$4*C7+$D$4*D7 This differs from the formula found in cell
E6 by using the corresponding values from row 7 rather than row 6. That is, to compute Baker’s overall score, we obviously want to use Baker’s three test results, not Adams’s.
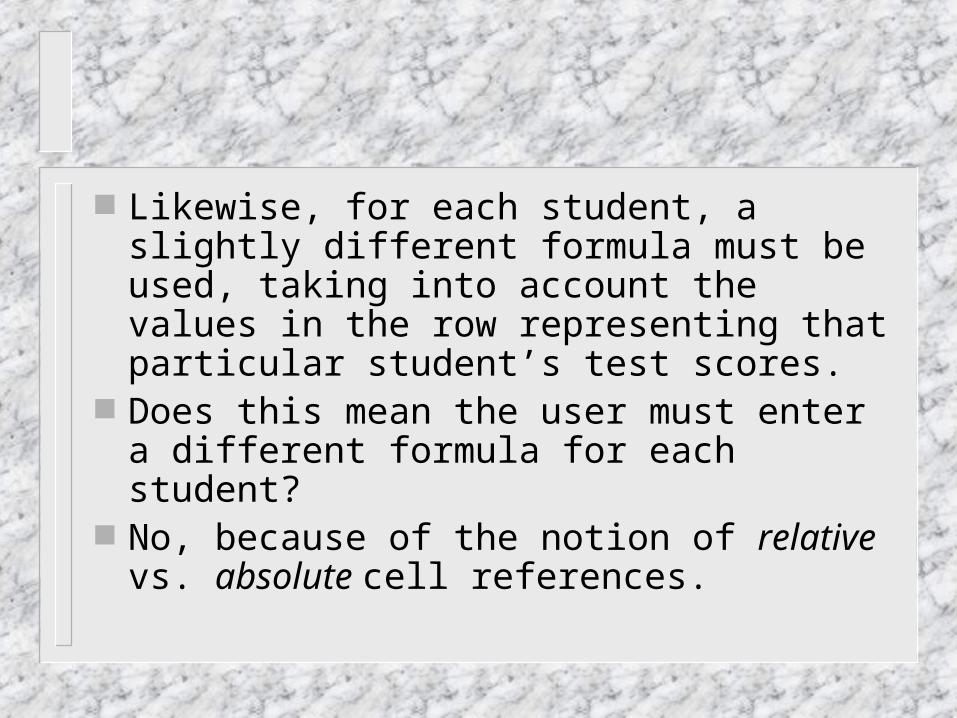
Likewise, for each student, a slightly different formula must be used, taking into account the values in the row representing that particular student’s test scores.
Does this mean the user must enter a different formula for each student?
No, because of the notion of relative vs. absolute cell references.

In the formula
=$B$4*B6+$C$4*C6+$D$4*D6
the cell references B6, C6, and D6 are relative, while the references to cells B4, C4, and D4 are absolute. This is what the $ signs do – create an absolute cell reference.
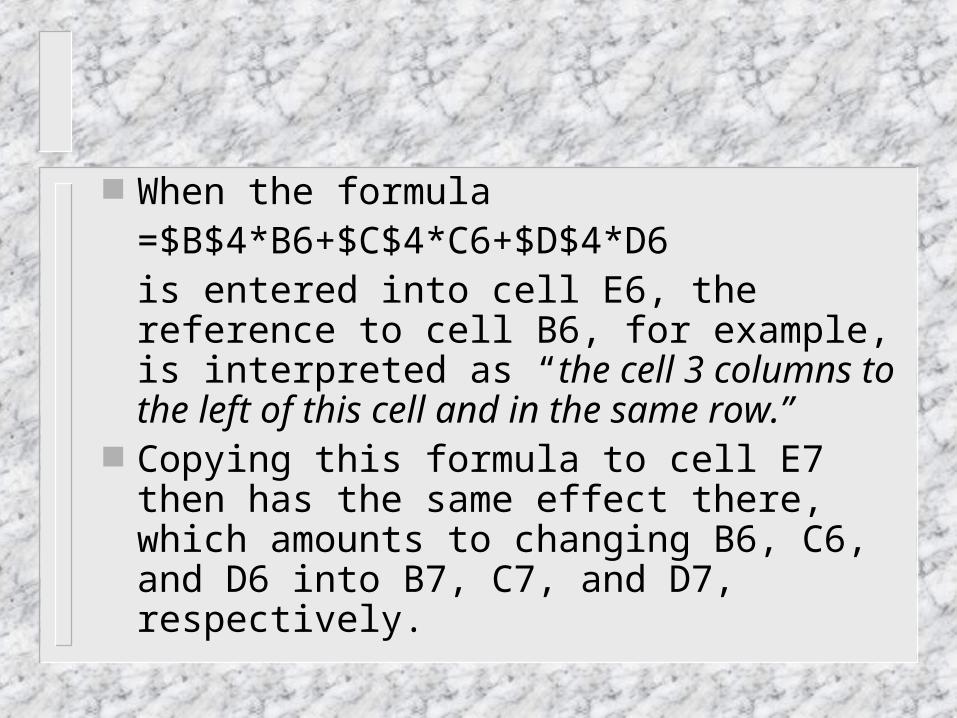
When the formula=$B$4*B6+$C$4*C6+$D$4*D6
is entered into cell E6, the reference to cell B6, for example, is interpreted as “the cell 3 columns to the left of this cell and in the same row.”
Copying this formula to cell E7 then has the same effect there, which amounts to changing B6, C6, and D6 into B7, C7, and D7, respectively.
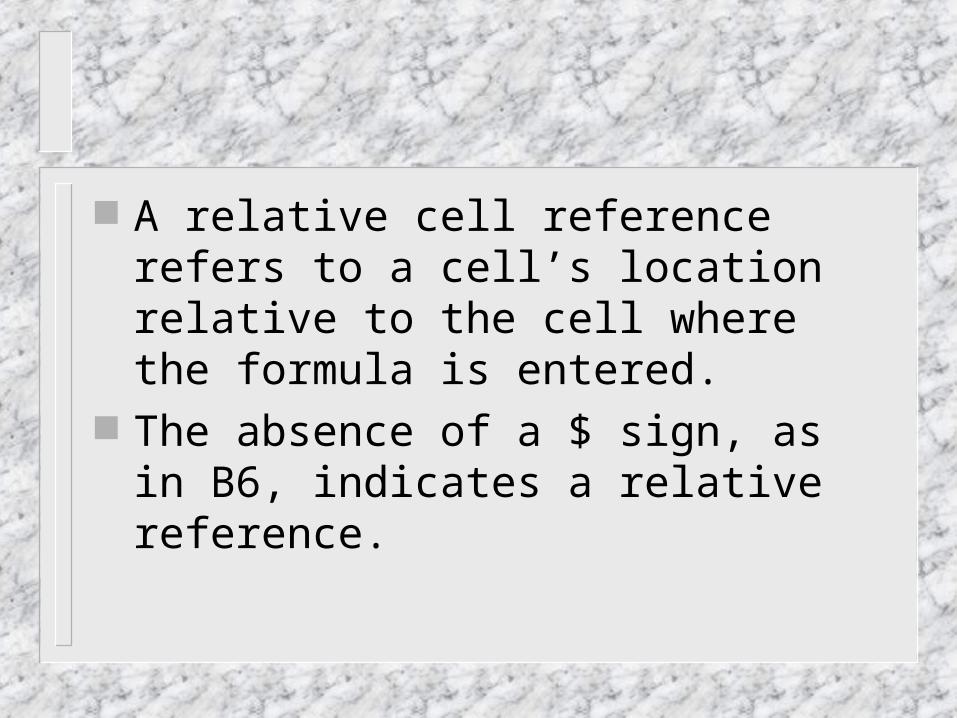
A relative cell reference refers to a cell’s location relative to the cell where the formula is entered.
The absence of a $ sign, as in B6, indicates a relative reference.
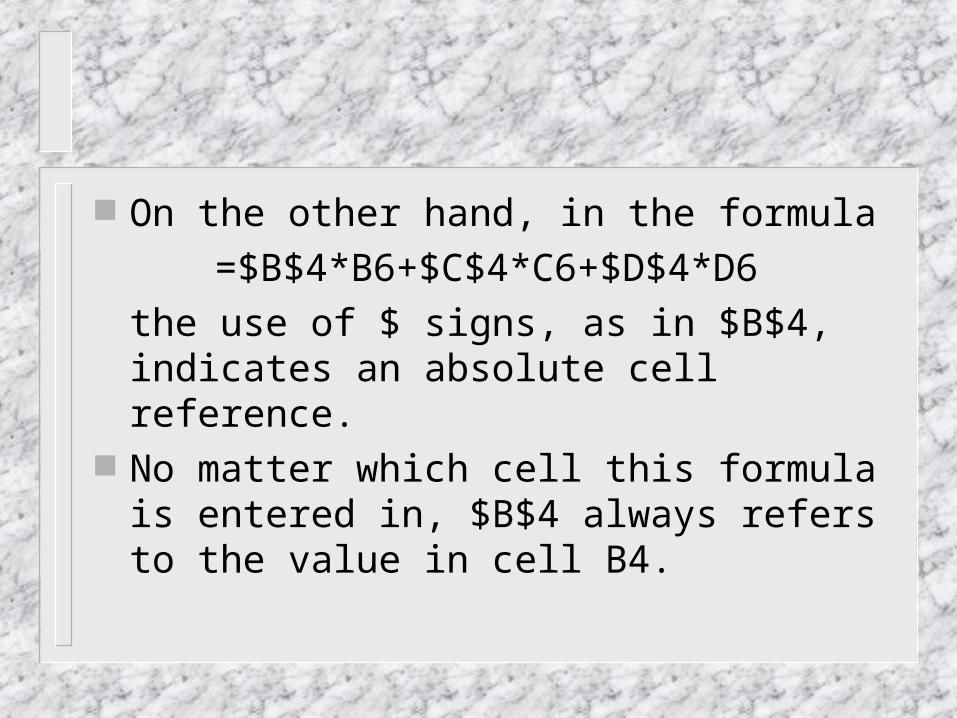
On the other hand, in the formula
=$B$4*B6+$C$4*C6+$D$4*D6
the use of $ signs, as in $B$4, indicates an absolute cell reference.
No matter which cell this formula is entered in, $B$4 always refers to the value in cell B4.

In this particular example, this is what we want because the cells B4, C4, and D4 contain the weightings to be applied in computing the overall score for every student.
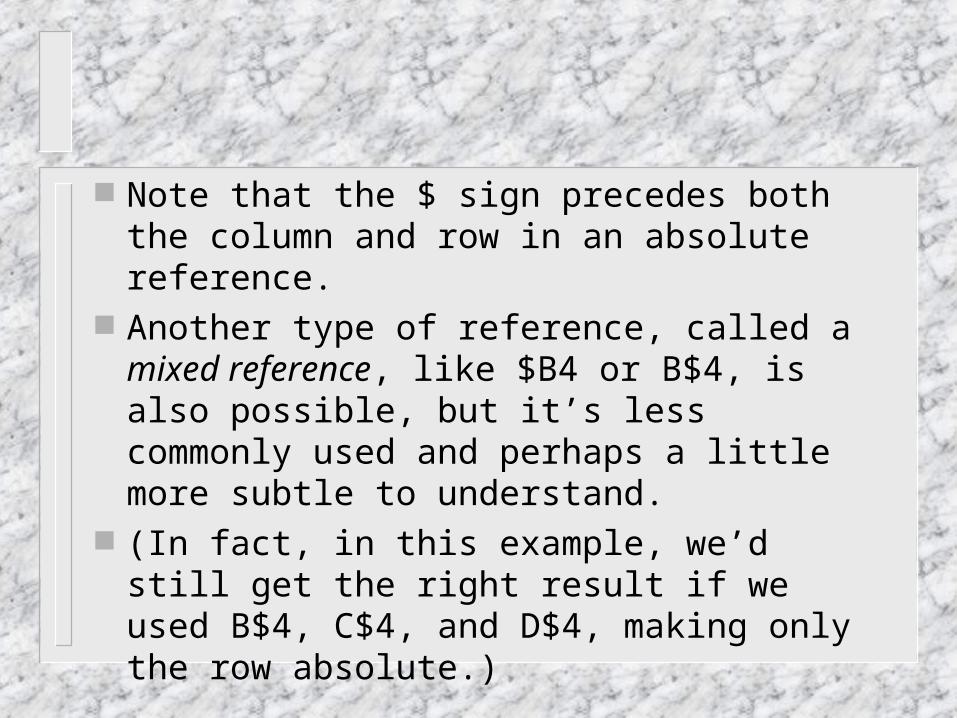
Note that the $ sign precedes both the column and row in an absolute reference.
Another type of reference, called a mixed reference, like $B4 or B$4, is also possible, but it’s less commonly used and perhaps a little more subtle to understand.
(In fact, in this example, we’d still get the right result if we used B$4, C$4, and D$4, making only the row absolute.)
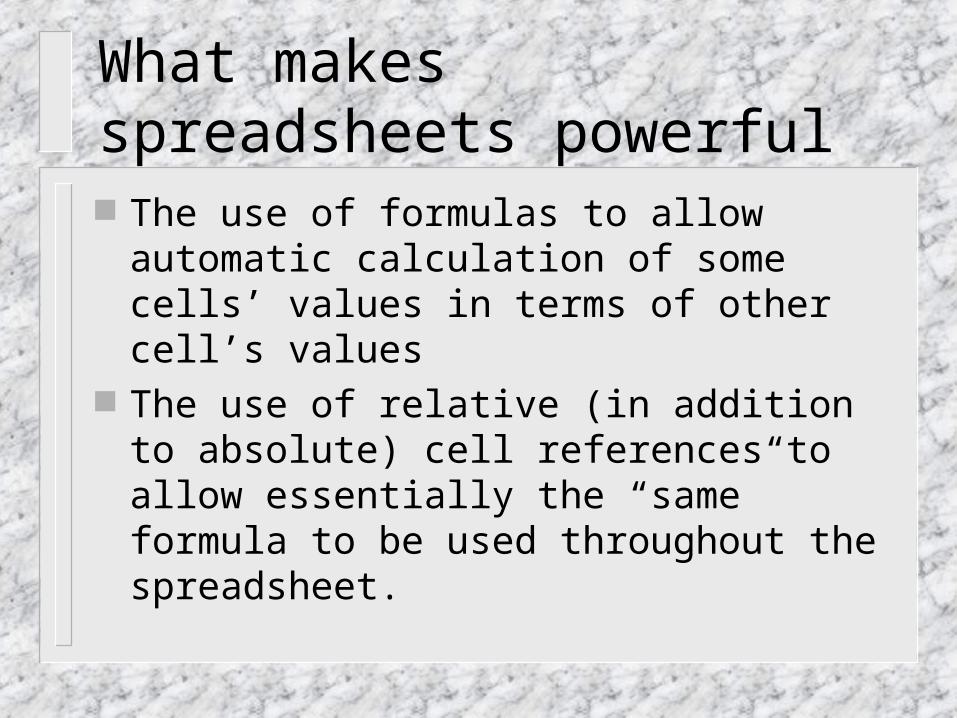
What makes spreadsheets powerful The use of formulas to allow automatic
calculation of some cells’ values in terms of other cell’s values
The use of relative (in addition to absolute) cell references to allow essentially the “same” formula to be used throughout the spreadsheet.
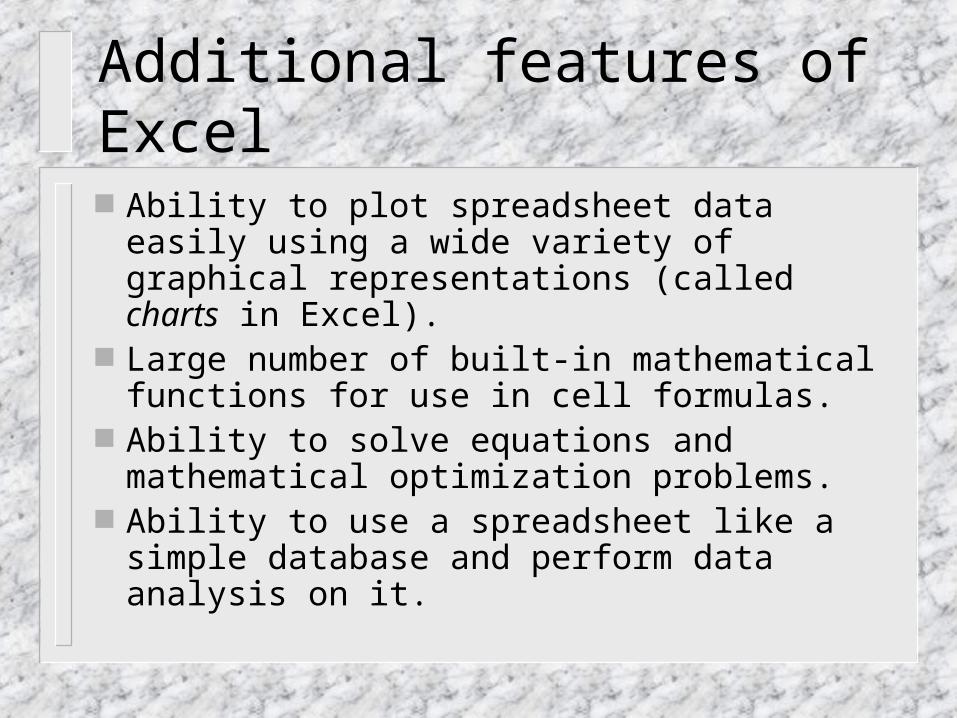
Additional features of Excel
Ability to plot spreadsheet data easily using a wide variety of graphical representations (called charts in Excel).
Large number of built-in mathematical functions for use in cell formulas.
Ability to solve equations and mathematical optimization problems.
Ability to use a spreadsheet like a simple database and perform data analysis on it.
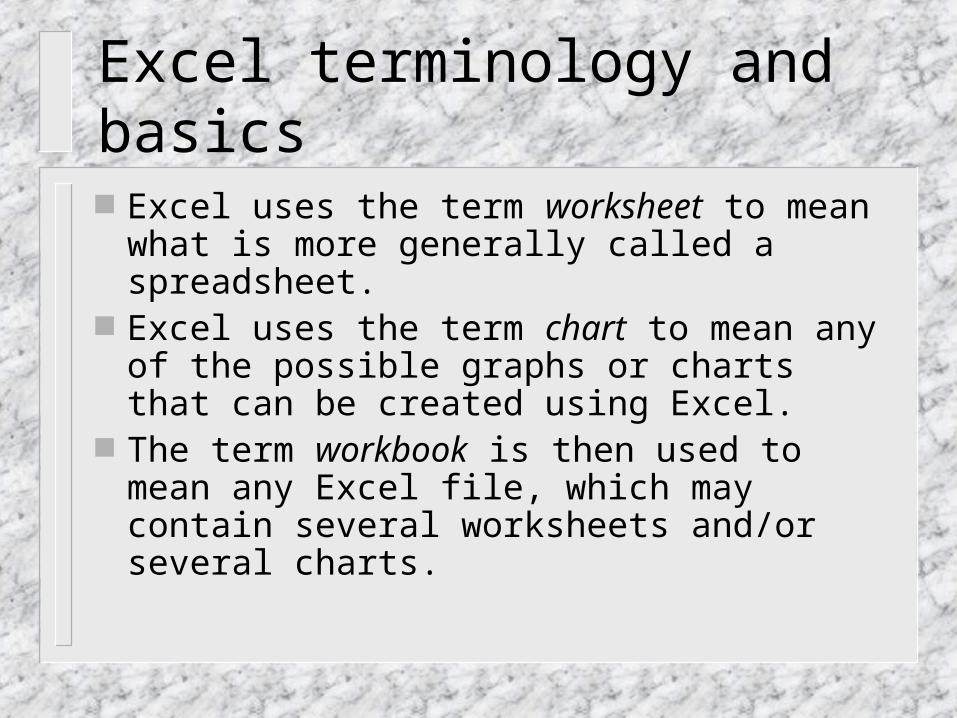
Excel terminology and basics
Excel uses the term worksheet to mean what is more generally called a spreadsheet.
Excel uses the term chart to mean any of the possible graphs or charts that can be created using Excel.
The term workbook is then used to mean any Excel file, which may contain several worksheets and/or several charts.
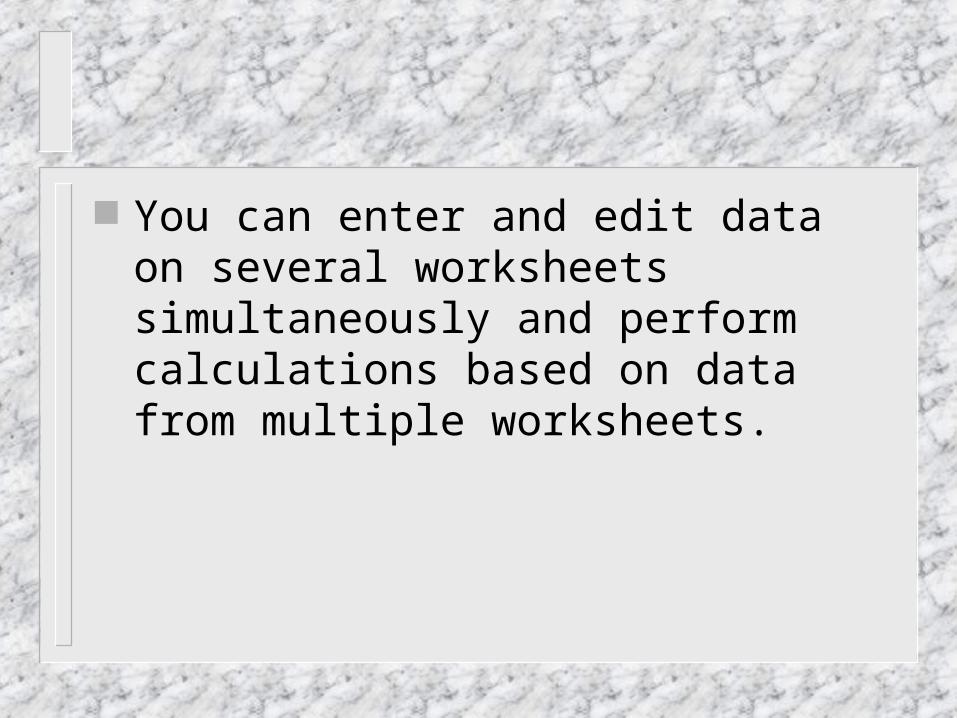
You can enter and edit data on several worksheets simultaneously and perform calculations based on data from multiple worksheets.
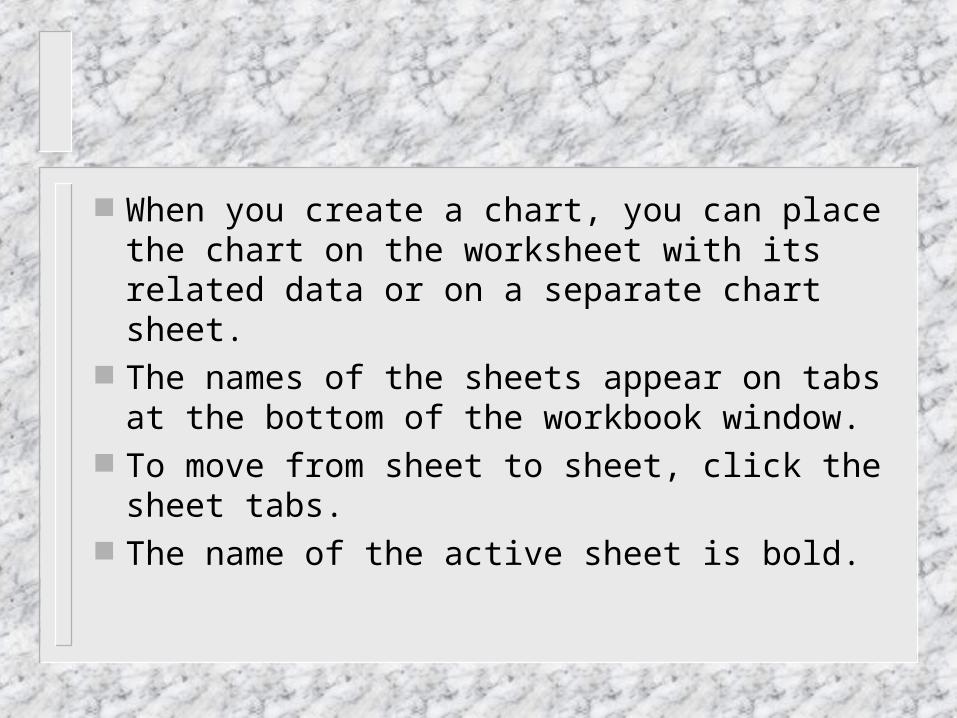
When you create a chart, you can place the chart on the worksheet with its related data or on a separate chart sheet.
The names of the sheets appear on tabs at the bottom of the workbook window.
To move from sheet to sheet, click the sheet tabs.
The name of the active sheet is bold.

Names of worksheets within a workbook.

What’s displayed vs. what’s “really there” Think of every cell in a worksheet as
having– a surface layer, consisting of what’s displayed
for that cell; and– an underlying layer, consisting of either a
formula or internal representation of a constant value.
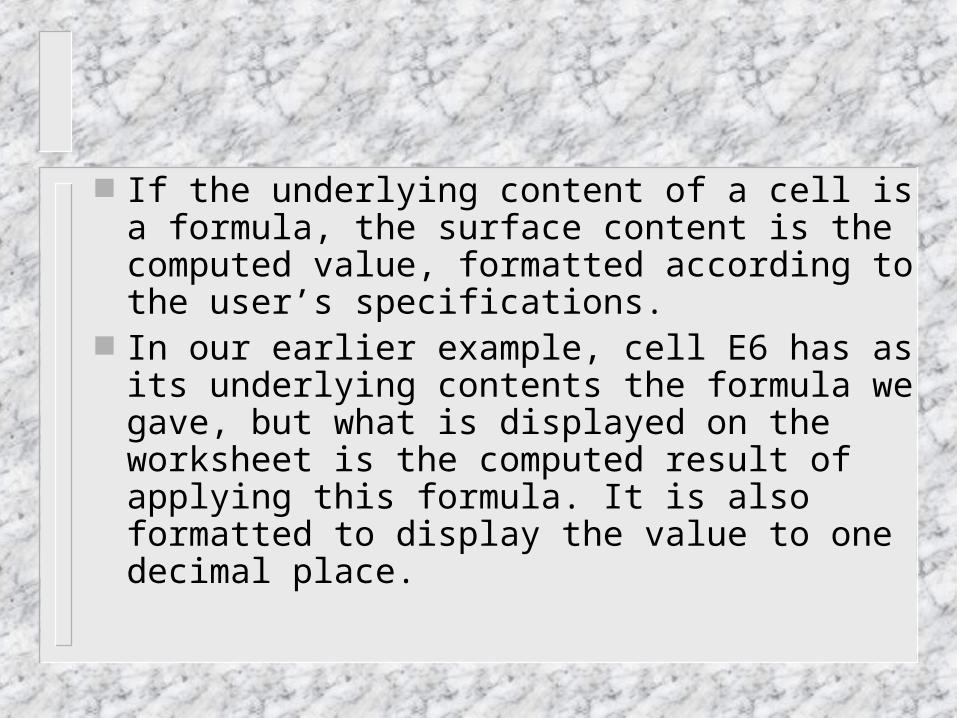
If the underlying content of a cell is a formula, the surface content is the computed value, formatted according to the user’s specifications.
In our earlier example, cell E6 has as its underlying contents the formula we gave, but what is displayed on the worksheet is the computed result of applying this formula. It is also formatted to display the value to one decimal place.

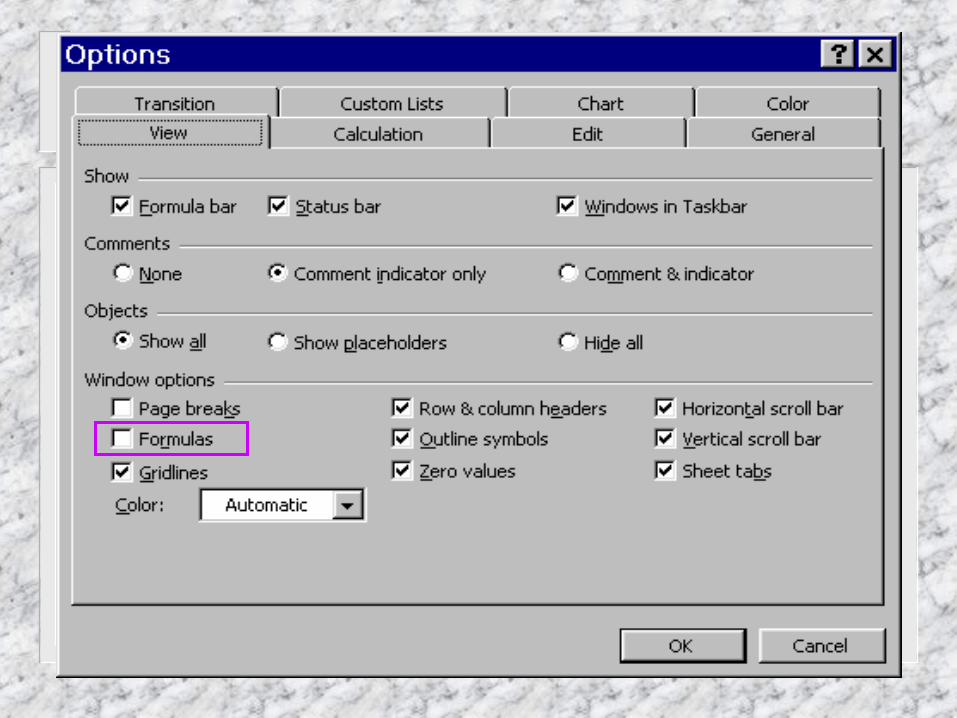
However, it is also possible to have the formulas themselves displayed, rather than the computed values, by checking the appropriate box in the Tools => Options… dialog box:
Even when the contents of a cell is a constant, the value you see on the screen depends on how you choose to format and display the stored value.
For example, a cell that displays a date as "6/22/96" also contains a serial number that is the underlying stored value for the date in the cell.
You can change the surface display of the date to another format (for example, to "22-Jun-96"), but changing the surface display of a value on a worksheet does not change the underlying stored value.
Another example is the use of % format. In the earlier sample worksheet, the contents of cell B4 is displayed as 25%, but internally it’s just the same as 0.25.


