SPreAD-GIS: an ArcGIS toolbox for modeling the propagation ...
32
SPreAD-GIS: an ArcGIS toolbox for modeling the propagation of engine noise in a wildland setting Version 1.2 June 26, 2009 Sarah E. Reed, Ph.D. Postdoctoral Scholar University of California, Berkeley Jacob P. Mann GIS Consultant Jennifer L. Boggs Associate GIS Analyst The Wilderness Society Contact information: Jennifer L. Boggs Center for Landscape Analysis The Wilderness Society 655 Montgomery Street, Suite 1000 San Francisco, CA 94111 Phone: (415) 398-1111 Email: [email protected] Suggested citation: Reed, S.E., J.P. Mann and J.L. Boggs. 2009. SPreAD-GIS: an ArcGIS toolbox for modeling the propagation of engine noise in a wildland setting. Version 1.2. The Wilderness Society, San Francisco, CA. Noise model based on: Harrison, R.T., R.N. Clark, and G.H. Stankey. 1980. Predicting impact of noise on recreationists. ED&T Project No. 2688: Noise Pollution Prediction Method. USDA Forest Service, Equipment Development Center, San Dimas, CA.
Transcript of SPreAD-GIS: an ArcGIS toolbox for modeling the propagation ...

SPreAD-GIS: an ArcGIS toolbox for modeling the propagation of engine noise in a wildland setting
Version 1.2 June 26, 2009
Sarah E. Reed, Ph.D. Postdoctoral Scholar
University of California, Berkeley
Jacob P. Mann GIS Consultant
Jennifer L. Boggs
Associate GIS Analyst The Wilderness Society
Contact information: Jennifer L. Boggs Center for Landscape Analysis The Wilderness Society 655 Montgomery Street, Suite 1000 San Francisco, CA 94111 Phone: (415) 398-1111 Email: [email protected] Suggested citation: Reed, S.E., J.P. Mann and J.L. Boggs. 2009. SPreAD-GIS: an ArcGIS toolbox for modeling the propagation of engine noise in a wildland setting. Version 1.2. The Wilderness Society, San Francisco, CA. Noise model based on: Harrison, R.T., R.N. Clark, and G.H. Stankey. 1980. Predicting impact of noise on recreationists. ED&T Project No. 2688: Noise Pollution Prediction Method. USDA Forest Service, Equipment Development Center, San Dimas, CA.

SPreAD-GIS User’s Guide, v. 1.2 2
SPreAD-GIS: an ArcGIS toolbox for modeling
the propagation of engine noise in a wildland setting
Version 1.2 June 26, 2009
Table of Contents 1. Abstract …………………. …………..………………………….…………. 3
2. Background and Purpose …………..………………………….…………. 3
3. Model Structure ……………………………………………………………. 7
4. Installing SPreAD-GIS …………………………………………………….. 10
5. Model Inputs ……………………………………………………………….. 10
6. Model Outputs ……………………………………………………………… 16
7. References ……………………………...………………………………….. 18
Appendices A. Review of Sound Models ……………………………………..………….. 19
B. Definitions of Intermediate Datasets ……..……………………..………. 23
C. Sample Exercise ………………………………. ….………….....……….. 27

SPreAD-GIS User’s Guide, v. 1.2 3
Abstract The nationwide Travel Management Planning process provides an
unprecedented opportunity to plan for and manage the soundscapes of U.S. National Forests. Since the first Executive Order governing motorized recreation, issued by the Nixon administration in 1972, federal agencies have been required to consider noise propagation when analyzing the potential impacts of motor vehicle activity on public lands. The Travel Management Rule, published by the Forest Service in 2005, also requires that decisions to designate roads, trails, and other areas for motorized use take engine noise into account. However, accurate and affordable methods for modeling potential noise impacts are critical gaps in the information needed to complete this process. The goal of our project was to identify the best methods for forecasting potential noise propagation from off-road vehicle activity in forested or other natural ecosystems. In this document, we describe the different factors that affect environmental noise propagation, discuss our review of existing spatial models and software packages, and explain how to install and use the new tool that we developed: SPreAD-GIS. Although we developed this tool for use in the Forest Service Travel Management Planning process, we hope it will be useful for a wide range of transportation and recreation planning and research applications.
Background and Purpose Sound propagation is the transmission of acoustic energy through space. Sound waves are introduced into a medium, such as air, by a vibrating object. The vibrating object creating the disturbance could be the vocal chord of a person, the string of a musical instrument, or the rumbling of an engine. In fluids such as air and water, sound waves propagate as disturbances to the ambient pressure level. A sound is defined as any variation in pressure that is detectable by a human’s (or another species’) ear, whereas the concept of noise is more subjective. Noise is generally defined as sound that is unwanted, causes a disturbance, or disrupts a communication system.
Environmental noise refers the propagation of unwanted or disturbing sounds outdoors. Also known as noise pollution, the most common sources of environmental noise are human transportation systems, especially motor vehicles and aircraft. Increasing levels of environmental noise have been linked to a wide array of human health and environmental effects. Prolonged exposure to environmental noise can have physiological and psychological effects on humans, including hearing impairment and loss, interference with communication, sleep disturbance, stress, and declines in job productivity, learning, and social behavior (Berglund & Lindvall 1995). Similarly, environmental noise can affect the physiology and behavior of wildlife species. While the particular impacts vary by species and habitat, studies have shown that transportation noise can lead to increased stress levels, decreased reproductive

SPreAD-GIS User’s Guide, v. 1.2 4
success, disruption of communication systems, displacement, flight, and changes in habitat use and foraging behavior (Havlick 2002, Ouren et al. 2007). In contrast to many other countries, particularly those in the European Union, the U.S. currently has no comprehensive noise control policy, and no single agency is authorized to coordinate noise monitoring or enforce federal regulations. Federal regulation of environmental noise began in 1972, when Congress passed the Noise Control Act, noting that “inadequately controlled noise presents a growing danger to the health and welfare of the Nation’s population.” The Noise Control Act was amended by the Quiet Communities Act of 1978, which established a federal agenda for research and education on noise impacts and promoted the development of State and local programs to monitor and control environmental noise. During this time, the Office of Noise Abatement and Control (ONAC) of the Environmental Protection Agency (EPA) coordinated all federal activities related to environmental noise control. In 1981, however, the Reagan Administration determined that environmental noise issues were best managed at the state or local level, and the ONAC lost its funding. Subsequently, regulation of environmental noise within the federal domain devolved to several different agencies, including the Department of Transportation, Department of Labor, and Federal Aviation Administration, each of which created noise control programs of its own. Many states and cities have also adopted noise ordinances, which vary in scope and degree of enforcement. Most of the early policies addressing environmental noise on federal lands focused on U.S. National Parks. Concern over the adverse effects of increasing numbers of recreational airplane and helicopter flights over Grand Canyon National Park led to passage of the National Parks Overflights Act in 1987. This legislation required the National Park Service (NPS) to study the impacts of aircraft noise on visitors and natural resources. The research studies mandated by the Act, and the subsequent Director’s Order on Soundscape Preservation and Noise Management in 2000, led to the creation of the NPS Natural Sounds Program, whose mission is to “protect, maintain, or restore acoustical environments throughout the National Park System.” The National Parks Overflights Act also required that the Forest Service assess the impacts of aircraft overflights on National Forest System wilderness areas. The resulting study was limited in scope, but reported few adverse effects of overflights on National Forest wilderness users (Harrison et al. 1992).
More recently, federal land managers have begun to focus their attention on the acoustic footprint of other types of engine noise on public lands – specifically, noise from automobiles and motorized recreational vehicles. For example, Zion National Park has restricted motor vehicle access to Zion Canyon to reduce traffic congestion, improve visitor experiences, and preserve the natural soundscape (Miller 2008). Controversy continues over air and noise emissions from the use of snowmobiles in Yellowstone and Grand Teton National Parks. A National Parks Conservation Association study demonstrated that, on a busy winter weekend, snowmobiles were audible at least 90

SPreAD-GIS User’s Guide, v. 1.2 5
percent of the time at eight popular recreation sites located more than 0.5 miles from a road (NPCA 2000). Despite these recent advances, little is known about the acoustic impacts of recreational roads and trails on public lands, particularly on National Forest and BLM lands in the western U.S., where motorized activity is concentrated. The nationwide Travel Management Planning process offers an unprecedented opportunity to inventory and plan for the soundscapes of U.S. National Forests. Beginning with the earliest Executive Order issued by the Nixon Administration in 1972, the Forest Service has been required to consider the impacts of noise in its management of motorized recreation. The Order states that off-road vehicle areas and trails should be located to minimize damage to natural resources, harassment of wildlife species, and conflicts with other recreational users, “taking into account noise and other factors” (E.O. 11644). The Travel Management Rule issued in 2005 also requires that decisions to designate roads, trails, and other areas for motorized use take sound into account (36 CFR 212.55(b)). To date, however, we are not aware of any forest travel analysis that has included spatially-explicit maps or models of potential noise impacts from motorized activity.
We recognize that monitoring and modeling noise is a critical gap in the information needed for transportation and recreation planning, and the goal of our project is to provide a straightforward, accurate, and affordable approach for modeling noise impacts. To identify the best methods for forecasting potential noise propagation from off-road vehicle activity in forested or other natural ecosystems, we reviewed existing models and software packages available for modeling sound propagation. Based on the results of our review, we decided to adapt the System for the Prediction of Acoustic Detectability (SPreAD; Harrison et al. 1980) to an ArcGIS environment. In this document, we describe the different factors that affect environmental noise propagation, discuss our review of existing spatial models and software packages, and explain how to install and use the new tool that we developed: SPreAD-GIS. Factors Affecting Environmental Noise Propagation
In the absence of interference, sound waves propagate geometrically; sound levels decline as the square of the distance from the sound’s source. Several additional factors influence the propagation of environmental noise in forested or wildland settings. Acoustic energy is absorbed by the atmosphere, as a function of elevation, air temperature, and humidity (Harris 1966). Additionally, temperature and wind gradients can cause sound waves to retract, or bend, changing the spatial pattern of sound propagation (Ingard 1953, Wiener & Keast 1959).
Sound is also absorbed by the ground. The magnitude of attenuation depends on the surface’s porosity or permeability to air (Aylor 1971). Hard, smooth surfaces such as pavement absorb little sound, whereas soft, porous surfaces such as grasses or bare soil can cause sound levels to attenuate substantially. Sound waves can also be

SPreAD-GIS User’s Guide, v. 1.2 6
scattered by vegetation above ground. While empirical data on vegetation loss is limited, the magnitude of attenuation is likely to be a function of the structure, extent, and density of vegetation (Kragh 1981, Fang & Ling 2003).
Terrain features determine the relative importance of ground versus atmospheric effects. Attenuation of noise propagated from hilltops or across valleys primarily depends on geometric spreading and atmospheric absorption (Piercy et al. 1977). On the other hand, a steep hill or ridgeline can act as a sound barrier, creating a ‘shadow zone’ away from the source where sound waves are not directly transmitted (Embleton 1996).
Lastly, the intensity and frequency of environmental noise disturbances vary according to the characteristics of the sound’s source. For example, noise propagated around recreational routes depends on the number and types of vehicles passing by, their engine types (i.e., 2- or 4-stroke), and travel speed (Martin et al. 2005). While the sound propagated from two or more vehicles traveling together is not strictly additive, traffic volume along a route does influence overall noise levels (Dooling & Popper 2007).
The degree to which environmental noises impact humans or wildlife species depends on the ambient sound conditions, as well as individuals’ auditory sensitivity. Ambient sound conditions can vary substantially by time of day, day of the week, and season. For instance, cooling air temperatures between day and night can change the direction of sound waves’ refraction and increase sound levels near the ground; this is one reason that distant sounds, such as trains, are more audible at night. Similarly, ambient conditions are often much quieter in the winter because snow-covered ground absorbs much more sound than do other ground surfaces.
Determining the ‘effect’ of environmental noise depends on the physiological characteristics of the listener as well as defining a threshold for what constitutes a disturbance. In some environments, simply having a mechanical noise be audible may constitute a sufficient disturbance for humans. In other environments, sounds may only become disturbing if they exceed typical sound levels or occur at unusual times of day. For wildlife species, noise disturbances are typically described in terms of effects that are likely to be biologically detrimental. For example, noise disturbances can cause increased stress levels or other physiological effects in individual animals, mask detection and discrimination of communication signals between individuals, or reduce habitat quality for wildlife populations. Review of existing software packages and spatial models
In January and February 2008, we reviewed eight existing software tools available for developing spatial models of sound propagation. We evaluated the models on the basis of their cost, ease of use, and capacity to incorporate various factors that are likely to affect sound propagation in a forest landscape (Appendix A). Based on the results of our review, we decided to develop our model by adapting the System for the

SPreAD-GIS User’s Guide, v. 1.2 7
Prediction of Acoustic Detectability (SPreAD; Harrison et al. 1980) to an ArcGIS environment.
SPreAD is a tool that was developed nearly 30 years ago by the U.S. Forest Service (USFS) and Environmental Protection Agency (EPA) to predict the acoustic impacts of recreational activity in wildland settings. SPreAD was explicitly designed to model how noise propagates in forested and other natural ecosystems. Accordingly, the SPreAD calculation process incorporates the majority of the factors that we hoped to include in our model, including wind and atmospheric effects, ground and vegetation effects, and sound source characteristics. Unlike many of the commercial applications, which summarize the frequency spectrum into a single summary sound level tuned to the human ear (i.e., an A-weighted sound level), SPreAD’s calculation process tracks the propagation of different frequencies through space. This is especially important for predicting the impacts of noise on wildlife, because different species respond to noise disturbances at different frequencies.
We found that many of the existing programs were either developed in proprietary software at high cost to the user, or had limited functionality or user support available. Further, most of the programs were unable to incorporate other information relevant to recreation planning or land management decisions. Developing SPreAD in ArcGIS allowed us to create a tool that could be extended to researchers and land managers at universities and public agencies and implemented using their existing GIS software at no additional cost.
Current status of the SPreAD-GIS model
We used ArcGIS ModelBuilder and Python scripts to adapt SPreAD to an ArcGIS environment. In December 2008, we released version 1.1 of the SPreAD-GIS model for testing by interested colleagues. We revised the model based on the feedback we received, and we plan to release the public version of the model (version 1.2) at the end of June 2009.
Model Structure The System for the Prediction of Acoustic Detectability (SPreAD) was originally
developed as a system of worksheets and tables, where the user could enter information about the sound source and environment and manually calculate noise propagation from a single point source to a single point receiver (Harrison et al. 1980). We have adapted the SPreAD model to ArcGIS, automating the hand calculation method to predict the propagation of noise in all directions throughout the area of interest.
The model can be run for a point, line, or polygon sound source. The SPreAD calculation process includes six discrete stages (called ‘blocks’ in the paper model, and ‘modules’ in the GIS model), each of which introduces an additional factor that influences how sound propagates through space. The six modules must be run in order,

SPreAD-GIS User’s Guide, v. 1.2 8
since each module depends on outputs from the previous steps for input data. SPreAD-GIS tracks the resulting noise propagation patterns for eight one-third octave frequency bands (400, 500, 630, 800, 1000, 1250, 1600, and 2000 Hz):
1) Spherical Spreading Loss1 Calculates the decline in sound level as a function
of distance from the sound’s source. WARNING: Running the Spherical Spreading Loss
module results in automatic deletion of intermediate data and results from all prior runs of SPreAD-GIS.
2) Atmospheric Absorption Loss Calculates the decline in sound level due to
absorption by the atmosphere. Atmospheric absorption is a function of air temperature, humidity, and elevation.
3) Foliage and Ground Cover Loss Calculates the decline in sound level due to
absorption by the ground and scattering by vegetation. The rate of foliage and ground cover loss is a function of the predominant land cover type (conifer, hardwood, shrub, grass, barren, water, or urban) and distance from the sound source.
1The example shown here illustrates noise propagation at 800 Hz from a single motorcycle engine operating in a mid-elevation mixed forest on a summer day with a westerly wind.

SPreAD-GIS User’s Guide, v. 1.2 9
4) Downwind and Upwind Loss Calculates the directional changes in sound level due to blowing wind. Sound levels decline much less rapidly (and may even increase) in downwind areas compared to upwind and crosswind areas. Downwind and upwind areas are defined according to the prevailing wind direction, wind speed, and seasonal conditions.
5) Terrain Effects Calculates the decline in sound levels due to barrier effects from hills or ridgelines, and determines the areas of the landscape that are primarily influenced by ground effects, barrier effects, or atmospheric effects.
6) Predicted Noise Propagation Tracks noise propagation patterns for eight frequency bands, summarizes propagation results for A-weighted sound levels (dBA), and calculates the difference between the introduced noise and background sound levels. The excess noise calculation can be used to identify areas where introduced noise is likely to be audible and/or impact species of concern.
It is important to note that SPreAD-GIS is a static model. The results represent the spatial pattern of potential noise disturbances around the source for a single snapshot in time. Ultimately, the model could be integrated with traffic, recreational visitation, or other dynamic models to forecast the frequency and duration of noise disturbances under different scenarios; however, these improvements are beyond the scope of our current project.

SPreAD-GIS User’s Guide, v. 1.2 10
Installing SPreAD-GIS Using the SPreAD-GIS model requires that you have an ArcInfo-level licensed copy of ArcGIS 9.3 (ESRI, Redlands, CA) with the Spatial Analyst extension and Python installed on your computer. The latest version of Python is typically included with ArcGIS and installed in the C: directory. If you need to install a copy of Python, go to: http://www.python.org/download/. Be sure to select a version of Python that is compatible with the current version of ArcGIS and the scripts you will be using.2 Copy the ‘SPreAD-GISv1.2.zip’ file to your computer. Unzip the folder, and place the ‘SPreAD_model’ folder directly into your C: drive. Do not change the name of the folder or any of its sub-folders, and do not move them. They must remain in the C: drive for the model to run correctly. After each model run is complete, you may move the results to another location.
Open a blank project in ArcMap. Open ArcToolbox, right-click in the ArcToolbox window, and select ‘Add toolbox.’ Navigate to ‘C:\SPreAD_model\toolbox’ and add the ‘SPreAD-GISv1.2.tbx’ file. When you open the toolbox, you will see that it is divided into a series of six Python scripts, each of which includes help documentation:
1. Spherical Spreading Loss 2. Atmospheric Absorption 3. Foliage & Ground Cover Loss 4. Upwind & Downwind Loss 5. Terrain Effects 6. Noise Propagation Results
Before starting a new SPreAD-GIS project, be sure to define a scratch workspace (Environment Settings > General Setting > Scratch Workspace) with sufficient space to store the intermediate data for the model calculations. Also, keep a clean copy of the entire ‘SPreAD_model’ folder somewhere easily accessible. Many errors in SPreAD-GIS calculations can be addressed by re-installing the entire ‘SPreAD_model’ folder and re-running your model from the beginning.
Model Inputs Before running SPreAD-GIS, you will need to collect and prepare several
datasets and parameters that are required inputs for the model. Make sure that all of the GIS datasets are in the same projection.
1) Sound Source Location
The sound source file is a dataset representing the location(s) from which noise propagates through the environment. It can be a point, polyline, or polygon
2SPreAD-GIS v. 1.1 was developed using Python 2.5.1.

SPreAD-GIS User’s Guide, v. 1.2 11
feature class representing one or more point sound source(s) (e.g., a single vehicle), a linear source (e.g., a road), or source area (e.g., parking lot).
The sound source file should contain only features that you wish to model as identical and simultaneous sound sources. In other words, if your file contains sound sources that you wish to model separately, or some features that are one kind of source and some that are another kind of source, then you should divide up your data file and run SPreAD-GIS separately for each source.
The attribute table for the sound source data file must contain a single field labeled ‘ID.’ If it is a multi-part file (e.g., multiple point sources), then the value in this field must be the same for all features, preferably ‘1,’ because this is the field that will be used to convert the sound source to a raster dataset. Place the sound source location file in the ‘source_data’ folder.
2) Sound Source Characteristics
You will need to provide several characteristics of the sound source you wish to model. You have the option of entering custom sound level measurements for your sound source, or you may choose from a list of nine different types of engines for which source sound level data is provided in the model. Detailed noise emissions data are available for a wide range of engines from vehicle manufacturers or public agencies (e.g., Martin et al. 2005). If you choose the custom source sound level data option, then you must have measurement data for each of the eight one-third octave frequency bands (400, 500, 630, 800, 1000, 1250, 1600, and 2000 Hz).
The nine engine options included with the model are: motorcycle, all-terrain vehicle, snowmobile, chain saw, heavy equipment, automobile, helicopter, power line transformer, and other 2-stroke engine. If you choose one of the built-in engines, then you must also enter an estimated A-weighted sound level (dBA) for the source engine. If you don’t have an estimated sound level for the source you wish to model, then you may refer to the suggested values in the table below:

SPreAD-GIS User’s Guide, v. 1.2 12
Engine type Sound level
(dBA)
Motorcycle 83
All-terrain vehicle 78
Snowmobile 75
Chain saw 86
Heavy equipment 86
Automobile 75
Helicopter 102
Power line transformer 60
Other 2-stroke engine 90
Lastly, you must enter the distance at which the sound level of the source engine was measured. If you choose to enter custom source sound level data, you will want to verify the measurement distance, because it varies according to the specific noise emission test methods used (Martin et al. 2005). The default measurement distance is 50 feet for the noise sources included in the SPreAD-GIS model.
3) Model Extent:
The model extent is a dataset – usually, a polygon – that represents the desired spatial extent for your model analysis. The model extent can be any size or shape, but remember that processing time will increase for larger areas. Place the model extent file in the ‘source_data’ folder.
4) Digital Elevation Model (DEM):
You will need to prepare a digital elevation model (DEM) for your study area. At a minimum, the extent of the elevation dataset must encompass the model extent selected in the previous step. The elevation values in the ‘VALUE’ field should be converted to feet, and the cell size of the DEM must be 100 ft (30.49 m). Name this file ‘dem_ft’ and place it in the ‘source_data’ folder.
5) Land Cover Dataset:
You will also need to prepare a land cover dataset for your study area. Convert the file to a raster dataset, with a cell size of 100 ft (30.49 m). Create a new field and label it ‘SPREADTYPE.’ Re-classify each land cover type into one of the

SPreAD-GIS User’s Guide, v. 1.2 13
seven SPreAD-GIS model land cover type categories, and list the appropriate code in the ‘SPREADTYPE’ field:
Land cover type SPREADTYPE
Coniferous forest CON
Hardwood forest HWD
Grassland/herbaceous HEB
Shrubland SHB
Barren BAR
Water WAT
Urban URB
Clip the land cover dataset to the model extent that you previously selected, and place the file in the ‘source_data’ folder.
6) Weather Conditions:
Collect representative weather conditions for the time of day and season for which you will be running the model scenarios, including: temperature (°F), relative humidity (%), prevailing wild direction (°), and wind speed (mph). You could calculate median or average values for each parameter, or you could run the model repeatedly for a reasonable range of values.
In the fourth module (Upwind & Downwind Loss), you will also be asked to provide a general description of the seasonal conditions for which you will be running the model (e.g., clear, calm summer day); your response determines the shape of the upwind and downwind areas around the sound source.
7) Ambient Sound Conditions:
Lastly, you will be asked to characterize the ambient sound conditions for your study area, so that the model may predict where excess noise from the sound source would be audible at different frequencies. Just as for the sound source, you have the option of entering custom ambient sound measurements for your study area, or you may choose from a series of background sound spectra. If you choose the custom ambient sound level data option, then you must have measurement data for each of the eight one-third octave frequency bands (400, 500, 630, 800, 1000, 1250, 1600, and 2000 Hz).
The ambient sound spectra included with the model are calculated as a function of the broad ecosystem type and location (coniferous forest, hardwood forest,

SPreAD-GIS User’s Guide, v. 1.2 14
grassland, shrubland, desert or running water) and estimated A-weighted sound level (dBA). If you do not have an estimate for the ambient sound levels for your study area, then we suggest using a conservative estimate of 25 dBA for most areas and 45 dBA for areas adjacent to running water.
As you begin to prepare data for your first model run, here are a few more things
to think about:
1) Start Small: Each module of the SPreAD-GIS model has many geoprocessing steps, and depending on the size of your study area and your computer’s processing speed, a single run of the model could take anywhere from several minutes to an hour. To begin, we suggest making your model extent as small as possible. Early tests of the model have indicated that a meaningful distance for noise propagation around a single sound source ranges from approximately 2 to 5 km.
2) Simplify Complex Lines:
The SPreAD-GIS model makes calculations along straight line pathways radiating away from the sound source(s). When working with polyline source files, particularly files that have many messy or complex line segments, these overlapping pathways can produce errors in the calculations. Consider using the Simplify Line or Smooth Line tools in the Data Management toolbox to simplify the input line segments and reduce the possibility of error in these calculations.
3) Separate Overlapping Areas: For the moment, the SPreAD-GIS model only has the capacity to model noise propagation unidirectionally away from the nearest sound source. Consider what this means for two sound sources that are located close together, one downwind of the other. Halfway (in Euclidean surface distance) between these two sources, the calculation will shift from representing areas as being downwind of the first source to being upwind of the second source. This may not be desirable, as noise will propagate greater distances downwind than upwind, and areas closer to the second source would experience greater noise propagation from the first source.3 Instead, we suggest running the model for the two sources separately and then overlaying the results, selecting the maximum noise propagation value from the two model runs.
3A similar issue will apply to areas that are upslope versus downslope of a source.
SPreAD-GIS User’s Guide, v. 1.2 15
4) Try a Range of Input Values: The model results will be sensitive to your choices of input values for source characteristics, weather conditions, and ambient sound conditions. We suggest that you run the model multiple times for a range of plausible values for these parameters.
5) Other Troubleshooting: The model, and ArcGIS in general, is sensitive to having input or output data files open in either ArcMap or Windows. Before running the model, be sure to close all open data files and windows, including Windows Explorer, and remove any data layers used in the model from active ArcMap data frames.
When you encounter an error in a module calculation, try running that module again. First, take a close look at your input data. Have you named all of the data files as instructed (e.g., is your elevation dataset named ‘dem_ft’)? Have you entered information into all of the required fields (e.g., if you chose not to enter custom sound level data for your source, did you enter an estimated dBA value)? Once you are confident that your input data is correct, try running the module in which you encountered the error a second time – sometimes, minor errors intermediate data calculations are overwritten and the module will work fine.
If this doesn’t work (or anytime you are in doubt about how to proceed), re-install a clean copy of the entire ‘SPreAD_model’ folder and re-run your model from the beginning. There is a good chance that any errors you encounter are a function of a missing data file or folder, or a data file that cannot be overwritten for some reason. Do not attempt to move or delete any intermediate data files manually; the directory structure is very sensitive to additions and deletions. Instead, re-install the entire ‘SPreAD_model’ folder in your C: drive.
Lastly, many of the problems we encountered during testing of SPreAD-GIS were associated with the relative locations of sound source features and extents of raster datasets. If you encounter repeated errors in the calculation processes for the Atmospheric Absorption or Foliage & Ground Cover Loss modules, try moving the sound source feature slightly (< 50 ft) or buffering your source location (e.g., using a polygon that is a 100-ft buffer around your point source as the sound source location).

SPreAD-GIS User’s Guide, v. 1.2 16
Model Outputs The SPreAD-GIS model tracks noise propagation patterns for eight frequency
bands (400, 500, 630, 800, 1000, 1250, 1600, 2000 Hz) and also summarizes the noise propagation results for A-weighted sound levels (dBA). Running the final module will yield two types of results:
1) Baseline Noise Propagation The predicted pattern of noise propagation around the source, accounting for attenuation due to spherical spreading loss, atmospheric absorption, foliage and ground cover loss, upwind and downwind loss, and terrain effects.
2) Excess Noise Propagation
Calculates the difference between introduced noise and background sound levels. The excess noise calculation can be used to identify areas where introduced noise is likely to be audible, or where it may impact species of concern.
The two types of results will appear in the ‘C:\SPreAD_model\results’ folder.
Noise propagation patterns will be calculated for each of the eight frequency bands (e.g., ‘400_prop’), and also summarized for A-weighted sound levels (e.g., ‘dba_prop’). Each result will be in the format of a floating-point raster dataset, with a cell size of 100 ft (30.49 m) and an extent equal to the model extent specified during the first module. Cells where the noise propagation is expected to be greater than zero will have a value equal to the predicted sound level (for a particular frequency or dBA) at that distance from the source. All other cells will have a value of 0.
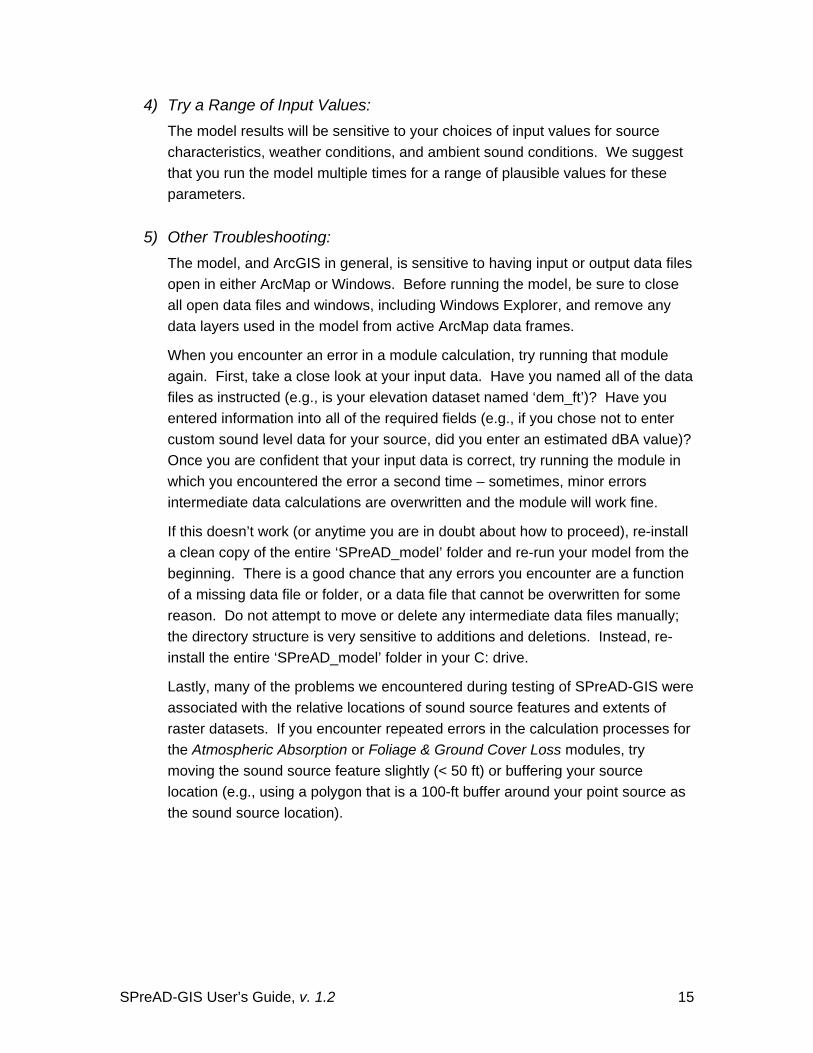
There are many different ways to display the noise propagation results. For example, the raster datasets could be symbolized to display the decline in sound levels with changes in shade or color. Or, you could use the Surface toolset of the Spatial
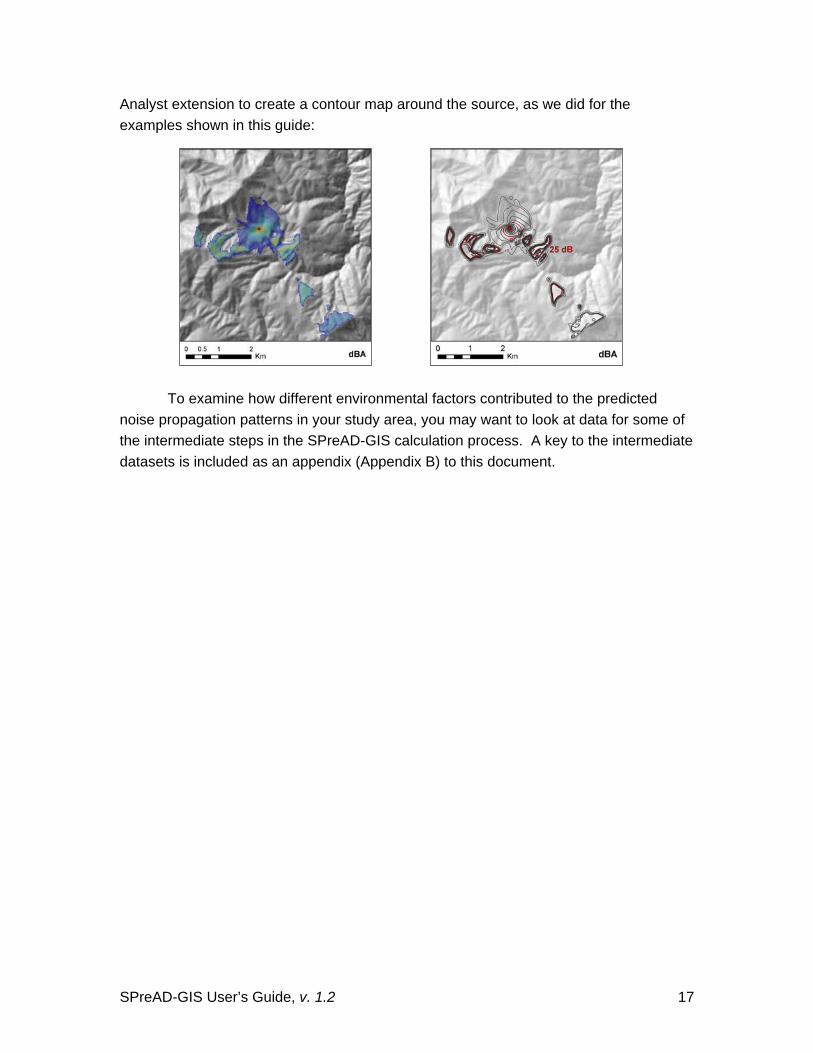
SPreAD-GIS User’s Guide, v. 1.2 17
Analyst extension to create a contour map around the source, as we did for the examples shown in this guide:
To examine how different environmental factors contributed to the predicted
noise propagation patterns in your study area, you may want to look at data for some of the intermediate steps in the SPreAD-GIS calculation process. A key to the intermediate datasets is included as an appendix (Appendix B) to this document.

SPreAD-GIS User’s Guide, v. 1.2 18
References Aylor, D. 1971. Noise reduction by vegetation and ground. Journal of the Acoustical
Society of America 51: 198-205.
Berglund, B. and T. Lindvall (eds.). 1995. Community noise. Archives of the Center for Sensory Research 2: 1-195.
Dooling, R.J. and A.N. Popper. 2007. The effects of highway noise on birds. Environmental BioAcoustics, Rockville, MD.
Embleton, T.F.W. 1996. Tutorial on sound propagation outdoors. Journal of the Acoustical Society of America 100: 31-48.
Fang, C. and D. Ling. 2003. Investigation of the noise reduction provided by tree belts. Landscape and Urban Planning 63: 187-195.
Harris, C.M. 1966. Absorption of sound in air versus humidity and temperature. Journal of the Acoustical Society of America 40: 148-159.
Harrison, R.T., R.N. Clark and G.H. Stankey. 1980. Predicting impact of noise on recreationists. USDA Forest Service, Equipment Technology & Development Center, San Dimas, CA.
Harrison, R., L. Hartmann, and W. Makel. 1992. Report to Congress: Potential impacts of aircraft overflights of National Forest System wildernesses. USDA Forest Service, Equipment Technology & Development Center, San Dimas, CA.
Havlick, D.G. 2002. No Place Distant: Roads and Motorized Recreation on America’s Public Lands. Island Press, Washington, D.C.
Ingard, U. 1953. A review of the influence of meteorological conditions on sound propagation. Journal of the Acoustical Society of America 25: 405-411.
Kragh, J. 1981. Road traffic noise attenuation by belts of trees. Journal of Sound and Vibration 74: 235-241.
Martin, S.A., A. Leung and P. Pallini. 2005. California off-highway vehicle noise study. Wyle Laboratories, Inc., El Segundo, CA.
Ouren, D.S., C. Haas, C.P. Melcher, S.C. Stewart, P.D. Ponds, N.R. Sexton, L. Burris, T. Fancher and Z.H. Bowen. 2007. Environmental effects of off-highway vehicles on Bureau of Land Management lands: a literature synthesis, annotated bibliographies, extensive bibliographies, and internet resources. U.S. Geological Survey, Open-File Report 2007-1353, Reston, VA. Available at: http://www.fort.usgs.gov/products/publications/22021/22021.pdf.
Piercy, J.E., T F.W. Embleton and L.C. Suthrland. 1977. Review of noise propagation in the atmosphere. Journal of the Acoustical Society of America 61: 1403-1418.
Wiener, F.M. and D.N. Keast. 1959. Experimental study of the propagation of sound over ground. Journal of the Acoustical Society of America 31: 724-733.

SPreAD-GIS User’s Guide, v. 1.2 19
Appendix A
Overview of Sound Modeling Packages
Jacob P. Mann GIS consultant Sarah E. Reed, Ph.D. Landscape Ecologist, The Wilderness Society March 7, 2008
Eight sound modeling software packages were surveyed with the goal of developing a spatial
model of noise propagation from off-highway vehicle (OHV) activity in California National Forests.
Reviewed software included domestic and foreign as well as publicly- and privately-developed
packages. Results of the survey are arranged in a spreadsheet matrix for comparison.
Survey considerations included: the original intent or application of the software package; data
formats for model inputs and outputs; the capacity of the model to incorporate various factors
affecting sound propagation in a forest landscape, including topography, barriers, vegetation,
ground surface characteristics and weather effects; options for different types of vehicle noise
sources, including roads, traffic and aircraft; ease of use; compatibility with geographic
information system (GIS) software; cost; operating system; and date of most recent version or
update. Contact information for software distributors is included in the matrix.
CadnaA – Computer Aided Noise Abatement Originally developed for industrial, urban, or freeway noise applications in Europe, this program is
fully-featured and appears to integrate well with GIS. It would likely be adaptable to forecast
acoustic disturbances from OHV activity in a forest landscape. Software licenses cost between
$6,000 and $10,000 depending on features selected. The distributor has offered a full working
version, including technical support, to TWS for up to two months when needed.
INM – Integrated Noise Model An FAA-developed program for use in modeling aircraft noise impacts near airports. It does not
handle roads or vehicular traffic and apparently lacks compatibility with GIS software or data
formats. INM is not likely to be useful for modeling noise propagation around OHV routes.

SPreAD-GIS User’s Guide, v. 1.2 20
Noise Map A UK-based package for modeling and mapping noise from roads, railways, industrial,
construction, and other open sites. Noise Map appears to be of similar quality and functionality
(and one might assume, cost) as the CadnA and LIMA packages. It would likely have a good
amount of functionality for assessing OHV impacts, although some model factors were unstated
in the product literature. We have not yet received a response to requests for pricing or demo
version information.
NMSim – Noise Model Simulation Developed by Wyle Labs in southern California for modeling aircraft, railroad, and highway noise,
NMSim has been used for some National Park Service (NPS) applications, including modeling
aircraft flights over Grand Canyon National Park. The package claims compatibility with GIS, but
we have found integration to be difficult in practice. The software is available for free, but the
downloadable version was updated several years ago and is somewhat archaic. Working with
NMSim would require back-versioning GIS data for use with the program (e.g., the program uses
DEM files in a non-SDTS format only). Further developments to the program are in use by Wyle
Labs, but they are not included in the free, publicly-available version.
SoundPLAN / SP Essential Developed in Germany and sold by NAVCON engineering in southern California. It has full
functionality, although though compatibility for input and output of GIS data is unclear. Licenses
cost between $3,000 and $7,000, and a discount is possible.
TNM – Traffic Noise Model U.S. Federal Highway Administration (FHA) program for modeling noise from highway
development projects, including the design of effective, cost-efficient highway noise barriers.
Although many public agencies use TNM, including the California Department of Transportation,
it is very highway-specific in scope and has poor GIS compatibility.
LIMA German-developed package for evaluating noise distribution for environmental planning, city
planning, preservation of silent areas, and noise reduction measures. LIMA appears to have full
functionality for modeling acoustic disturbances from OHV activity, including GIS compatibility
and direct integration with ArcGIS. We have not yet received a response from the U.S. sales
representative, but estimate the cost will be in the $6,000 to $10,000 range.

SPreAD-GIS User’s Guide, v. 1.2 21
SPreAD – System for the Prediction of Acoustic Detectability Spreadsheet routine developed by the U.S. Forest Service (USFS) and Environmental Protection
Agency (EPA) to evaluate acoustic impacts in conjunction with the USFS Recreation Opportunity
Spectrum (ROS). SPreAD was developed with the explicit objective of modeling acoustic impacts
from OHV sources and includes most of the important factors affecting sound in a forest
landscape, except topography or terrain effects. The hand calculation method was updated to a
computerized version in a Linux operating system in 1998, but this version is not publicly-
available. It is important to note that the current version of SPreAD is not spatially-explicit. It is a
method for calculating the potential propagation of sound from a single point source to a single
point receiver. It may be possible, however, to adapt these calculations to a contemporary
ArcGIS modeling process, as the acoustic science underlying SPreAD is well-researched and
specifically tailored to the vehicles and environments to be modeled.

SPreAD-GIS User’s Guide, v. 1.2 22
Cad
naA
Inte
grat
ed N
oise
Mod
el (I
NM
)N
oise
Map
Noi
se M
odel
Sim
ulat
ion
(NM
Sim
)So
undP
LAN
/ SP
Ess
entia
lTr
affic
Noi
se M
odel
(TN
M)
LIM
ASP
reAD
Inte
nded
Use
/ Ap
plic
atio
nsur
ban
/ ind
ustri
al /
airp
ort n
oise
pr
edic
tion
and
asse
smen
t.ai
rcra
ft no
ise
impa
cts
near
ai
rpor
ts d
evel
oped
by
FAA
mod
elin
g an
d m
appi
ng n
oise
from
ro
ads,
railw
ays,
indu
stria
l, co
nstru
ctio
n, a
nd o
ther
ope
n si
tes
mod
elin
g no
ise
from
airc
raft,
ra
ilroa
ds, a
nd h
ighw
ays
calu
late
s no
ise
from
road
s,
railw
ays
or in
dust
ry
mod
elin
g hi
ghw
ay n
oise
, in
clud
ing
the
desi
gn o
f effe
ctiv
e,
cost
-effi
cien
t hig
hway
noi
se
barr
iers
envi
ronm
enta
l pla
nnin
g,
pres
erva
tion
of s
ilent
are
as, n
oise
re
duct
ion
mea
sure
s
eval
uate
aco
ustic
impa
cts
in
conj
untio
n w
ith R
ecre
atio
n O
ppor
tuni
ty S
pect
rum
(RO
S)
Inpu
tsAr
cvie
w s
hape
files
, AS
CII
Poly
s,
ASC
II G
ridno
t sta
ted
DX
F, s
hape
file
DE
M, D
LG, A
SCII
DX
F, A
SCII,
GIS
(?)
DX
FG
ISta
bula
r dat
a
Out
puts
shap
efile
s, ta
bula
r and
gra
phic
re
sults
not s
tate
dex
port
resu
lts in
cho
ice
of A
SCII
form
ats:
DX
F, s
hape
file,
map
sgr
id n
oise
map
s, a
nim
ated
fly
over
sgr
id n
oise
map
sta
bula
rG
ISta
bula
r dat
a
Wea
ther
and
Atm
osph
ere
Effe
cts
not s
tate
dno
t sta
ted
not s
tate
dve
rtica
l tem
pera
ture
and
win
d pr
ofile
s in
new
ver
sion
(not
pu
blic
ly-a
vaila
ble)
not s
tate
dno
t sta
ted
not s
tate
dye
s
(te
mp,
hum
idity
, ele
vatio
n, w
ind)
Gro
und
Effe
cts
impl
ied
not s
tate
dno
t sta
ted
yes
yes
yes
yes
yes
Vege
tatio
n Ef
fect
s"fo
liage
are
as c
an b
e m
odel
ed a
s di
stin
ct o
bjec
ts w
ith a
rbitr
ary
shap
e"no
t sta
ted
not s
tate
dno
t exp
licitl
yye
s - "
miti
gatio
n ar
eas"
"A
ttenu
atio
n ov
er/th
roug
h ro
ws
of
build
ings
and
den
se v
eget
atio
n""s
cree
n" a
nd "a
ttenu
atio
n ar
eas"
yes
Topg
raph
yco
ntou
r lin
es, p
oint
s (T
IN-s
tyle
)no
t sta
ted
"gro
und
cont
our p
oint
s", "
verti
cal
nois
e co
ntou
r cro
ss-s
ectio
ns"
"acc
ount
for d
iffer
ent t
ypes
of
terr
ain
whe
n co
mpu
ting
nois
e pr
opag
atio
n," i
nclu
ding
wat
er o
r so
ft di
rt
topo
and
spo
t ele
vatio
ns, d
igita
l gr
ound
mod
el (D
GM
)so
und
berm
s, te
rrai
n lin
esye
sye
s
Bar
riers
yes,
var
iabl
eno
t sta
ted
not s
tate
dye
sVa
riabl
e re
flect
ivity
val
ues
for
soun
dwal
ls.
yes
yes
yes
Roa
ds /
Traf
ficye
sno
yes
yes
yes
yes
(incl
udin
g us
er-d
efin
ed v
ehic
les)
yes
yes
(sin
gle
poin
t sou
rce,
incl
udin
g fre
quen
cy s
pect
rum
)
Airc
raft
yes
yes
not s
tate
dye
sno
t sta
ted
noye
sno
GIS
Com
patib
ility
auto
in/o
ut a
vaila
ble
as a
run-
time
calc
ulat
ion
prog
ram
not s
tate
dim
port/
expo
rt of
sha
pefil
espo
ssib
le, s
omew
hat a
rcha
icun
know
nno
t sta
ted
yes
(ext
ensi
on th
at e
mbe
ds L
IMA
into
Ar
cGIS
as
an e
xten
sion
or
geop
roce
ssin
g to
ol)
no
(not
spa
tially
exp
licit)
Ope
ratin
g Sy
stem
Win
dow
sW
indo
ws
Win
dow
sW
indo
ws
Win
dow
sW
indo
ws
Win
dow
sLi
nux
Last
upd
ate
2008
2007
unsu
reea
rly 2
000s
2006
2004
2008
1998
Cos
t$6
,000
- $9
,500
(d
epen
ding
on
optio
ns)
$300
no
t ava
ilabl
efre
e$3
,000
- S
P es
sent
ial
$6
,500
- SP
full
$695
un
know
n
(com
para
ble
to C
adna
A)fre
e
(in
prin
t for
m, n
ot c
ompu
teriz
ed)
Dem
o Ve
rsio
nye
s
(1
- 2
mon
ths)
noun
know
nfre
eSP
Ess
entia
lun
know
nun
know
nfre
e
Orig
in /
Con
tact
Ric
hard
Pep
pin
410-
290-
7726
R
Pepp
in@
aol.c
omFA
A / A
TAC
/ V
OLP
E -
Uni
ted
Stat
esAt
kins
Aco
ustic
s - U
K
Wyl
e La
bora
torie
s - C
A U
SBr
auns
tein
+ B
ernd
t - G
erm
any
| D
ist.
By N
avco
n En
gine
erin
g, C
A U
SM
cTra
ns -
Uni
v of
Flo
rida
US
Brue
l & K
jaer
USF
S SD
TDC
(San
Dim
as) 9
09-
599-
1267
mai
lroom
_wo_
sdtd
c@
fs.fe
d.us
Web
Add
ress
http
://w
ww
.acu
-vib
.com
.au/
cadn
aht
tp://
ww
w.fa
a.go
v/ab
out/o
ffice
_org
/hea
dqua
rters
_offi
ces/
aep/
mod
els/
inm
_mod
el/
http
://w
ww
.noi
sem
ap.c
om/
http
://w
ww
.wyl
elab
s.co
m/p
rodu
cts
/aco
ustic
softw
arep
rodu
cts/
nmsi
mht
tp://
ww
w.n
avco
n.co
m/S
ound
PLAN
ht
tp://
ww
w.fh
wa.
dot.g
ov/e
nviro
nmen
t/noi
se/tn
m/in
dex
http
://w
ww
.sta
pelfe
ldt.d
e/fra
mes
tarte
ht
tp://
ww
w.fs
.fed.
us/e
ng/p
ubs/
htm
l/982
3130
8/98
2313
08

SPreAD-GIS User’s Guide, v. 1.2 23
Appendix B Definitions of Intermediate Datasets The following is a list of the intermediate and results datasets produced from running each of the SPreAD-GIS modules. Where applicable, raster datasets are listed for propagation at the 800 Hz frequency level only (e.g., all800), but nomenclature for rasters representing other frequencies is the same (e.g., aal400, aal500, aal630, aal1000, aal1250, aal1600, aal2000). Definitions are given for key datasets, and an asterisk (*) indicates the final result grid for each module. If you would like to follow SPreAD-GIS’ calculation of the effects of different factors on noise propagation at 800 Hz, for instance, then load each of the datasets marked with an asterisk (*) C:\SPreAD_model\intermediate\ eucdist – euclidean distance from sound source (m), up to the model extent eucdist_ft – euclidean distance from sound source, converted to feet (ft) sound_src – sound source location, converted to a raster dataset diveucdis100 C:\SPreAD_model\intermediate\ssl\ (Module 1 – Spherical Spreading Loss) *ssl800 – decline in sound levels due to spherical spreading loss at 800Hz div_eucdist int_divdist source800 ssl_neg ssl_reclass C:\SPreAD_model\intermediate\aal\ (Module 2 – Atmospheric Absorption Loss) aac800 – constant raster of atmospheric absorption coefficient for input elevation,
temperature, and humidity at 800 Hz aal800 – decline in sound levels due to atmospheric absorption at 800 Hz *sslaal800 – cumulative spherical spreading loss and atmospheric absorption at 800Hz C:\SPreAD_model\intermediate\veg\ (Module 3 – Foliage & Ground Cover Loss) landcov_final – decline in sound levels due to scattering by vegetation and absorption by
the ground *salveg800 – cumulative spherical spreading loss, atmospheric absorption, and
vegetation loss at 800Hz

SPreAD-GIS User’s Guide, v. 1.2 24
eucdist_neg eucdist_z landcovplus1 landcov_perft max_eucdist pathdist1 pathdist3 veg_divdist veg_lossrate zonegrid1 C:\SPreAD_model\intermediate\veg\ (Module 4 – Downwind & Upwind Loss) *salvegwin800 – cumulative spherical spreading loss, atmospheric absorption,
vegetation loss, and downwind and upwind loss at 800Hz wind800 – downwind and upwind loss at 800 Hz 800rcl_div100 800xdist con_eucldir_1 con_eucldir_2 dist2shdw_1 dist2shdw_2 dist2shdw_3 distshadowdiv distshad_int downwind dw800_1 dw800_2 dw800_3 dw800_4 eucdist2_ft eucldir_wind eucldist_wind finalmeanw fltshdwfc800 ln_800xdist ln_800xdist_2 meanwind minus_con_eu1 minus_con_eu2 phi propwinang

SPreAD-GIS User’s Guide, v. 1.2 25
prop_angle shdwfct800dbf times_800rcl1 updownwind upwind upwind_rcls windang2 C:\SPreAD_model\intermediate\topo\ (Module 5 – Terrain Effects) barloss_800 – calculated barrier loss values due to topography at 800 Hz *savgwntop800 – cumulative spherical spreading loss, atmospheric absorption,
vegetation loss, wind loss, and terrain effects at 800Hz topo_zones – areas of the landscape dominated by barrier (1), atmospheric (2), and
ground (3) effects on noise propagation bf_800 bpd constant_0 constant_3 dist1-12 elev1-12 elev_sr elev_src eucdir_class eucdir_dist eucdir_elev eucdir_src extent_pts_elev h_b h_b_rc l_800 slope sound_source topo_zones topo_zones_1 topo_zones_2 vicinity vicinity_line vicinity_pts vicinity_pts_class1-12 vicinity_pts_elev_dist vicinity_pts_elev_dist_dir

SPreAD-GIS User’s Guide, v. 1.2 26
vshed_all_polygon vshed_src vshed_src_rc vshed_vicinity_polygon vshed_vicinity_polygon_buff_50ft C:\SPreAD_model\intermediate\amb\ (Module 6 – Noise Propagation Results) amb800 – constant raster of ambient sound level at 800 Hz amb_dba – constant raster of summary A-weighted sound level (dBA) C:\SPreAD_model\results\ (Module 6 – Noise Propagation Results) 800_excess – noise levels exceeding ambient sound conditions at 800 Hz 800_prop – final noise propagation patterns at 800z dba_excess – A-weighted noise levels exceeding ambient sound conditions dba_prop – final noise propagation patterns for A-weighted sound levels C:\SPreAD_model\results\prelim\ 800_dba_1 800_dba_2 800_dba_3 800_excess_1 800_excess_2 800_result_1 800_result_2 dba_excess_1 dba_excess_2 dba_result_1 dba_result_2

SPreAD-GIS User’s Guide, v. 1.2 27
Sample Exercise
Preparing ArcMap project for SPreAD-GIS analysis: 1) Open ArcCatalog. Copy all files in the ‘SPreAD-GIS v.1.2\sample_exercise\
sample_data’ folder to C:\SPreAD_model\source_data. These files should include: source_point, model_extent, veg, and dem_ft.
2) Open ArcMap
3) Add all data from the C:\SPreAD_model\source_data to the project.
4) Add toolbox:
a. Right click in ArcToolbox and Select Add Toolbox…
b. Navigate to C:\SPreAD_model\toolbox and select SPreAD-GIS_v1.2
5) Define Scratch Workspace:
a. Right Click in ArcToolbox and select Environments…
b. Expand General Settings
c. Define Scratch workspace as a folder that has sufficient space for intermediary data.
Running the SPreAD-GIS model: 6) Expand SPreAD-GIS_v1.2. Double-click 1. Spherical Spreading Loss
a. Fill in parameters as follows (as seen in Figure 1):
• Sound Source: source_point.shp
• Model Extent: model_extent.shp
• Type of Engine: Motorcycle
• Measurement Distance (ft): 50
• Input Custom Source Sound Level Data: No
• Sound Level of Source (dBA): 83
b. Press OK

SPreAD-GIS User’s Guide, v. 1.2 28
Figure 1

SPreAD-GIS User’s Guide, v. 1.2 29
7) Double click 2. Atmsopheric Absorption
a. Fill in parameters as follows (as seen in Figure 2):
• Elevation Dataset: dem_ft
• Temperature: 81
• Humidity: 31
b. Press OK
Figure 2
8) Double Click 3. Foliage & Ground Cover Loss
a. Fill in the parameter as follows (as seen in Figure 3):
• Land Cover Dataset: veg
b. Press OK
Figure 3

SPreAD-GIS User’s Guide, v. 1.2 30
9) Double Click 4. Upwind & Downwind Loss
a. Fill in parameters as follows (as seen in Figure 4):
• Prevailing Wind Direction (degrees): 0
• Wind Speed (mph): 6
• Seasonal Conditions: Clear, calm summer day
b. Press OK
Figure 4
10) Double Click 5. Terrain Effects (Figure 5)
a. Press OK
Figure 5

SPreAD-GIS User’s Guide, v. 1.2 31
11) Double Click 6. Noise Propagation Results
a. Fill in parameters as follows (as seen in Figure 6):
• Input Custom Ambient Sound Level Data: No
• Ecosystem Type: Hardwood forest, grassland or shurbland
• Measured Ambient Sound Level (dBA): 23
b. Press OK
Figure 6

SPreAD-GIS User’s Guide, v. 1.2 32
Viewing model results: 12) Add data from the C:\SPreAD_model\results.
a. There are two types of results for each of the eight frequency bands, as well as for A-weighted sound levels: baseline noise propagation values (e.g., 400_prop), and excess noise above ambient conditions (e.g., 400_excess).
13) To compare your results to previously executed sample results, open the files in the ‘SPreAD-GIS v1.2\sample_exercise\sample_results’ folder.