Spray cooling with HFC-134a and HFO-1234yf for thermal .../67531/metadc822762/m2/1/high... ·...
72
SPRAY COOLING WITH HFC-134A AND HFO-1234YF FOR THERMAL MANAGEMENT OF AUTOMOTIVE POWER ELECTRONICS A Thesis report Submitted in the partial fulfillment of the degree of Master of Science by SATVIK JANARDHAN YADDANAPUDI Thesis Committee Dr. Huseyin Bostanci, Major Professor Dr. Seifollah Nasrazadani, Member Dr. Cheng Yu, Member Department Of Engineering Technology College of Engineering University Of North Texas December 2015
Transcript of Spray cooling with HFC-134a and HFO-1234yf for thermal .../67531/metadc822762/m2/1/high... ·...

SPRAY COOLING WITH HFC-134A AND HFO-1234YF FOR THERMAL MANAGEMENT OF AUTOMOTIVE POWER ELECTRONICS
A Thesis report
Submitted in the partial fulfillment of the degree of Master of Science
by
SATVIK JANARDHAN YADDANAPUDI
Thesis Committee
Dr. Huseyin Bostanci, Major Professor
Dr. Seifollah Nasrazadani, Member
Dr. Cheng Yu, Member
Department Of Engineering Technology
College of Engineering
University Of North Texas
December 2015

Yaddanapudi, Satvik Janardhan. Spray cooling with HFC-134a and HFO-1234yf for thermal
management of automotive power electronics. Master of Science (Engineering Systems-
Mechanical Systems), December 2015, 63 pp., 3 tables, 35 figures, 43 numbered references.
This study aims to experimentally investigate the spray cooling characteristics for active
two-phase cooling of automotive power electronics. Tests are conducted on a small-scale, closed
loop spray cooling system featuring a pressure atomized spray nozzle. Two types of refrigerants,
HFC-134a (R-134a) and HFO-1234yf, are selected as the working fluids. The test section (heater),
made out of oxygen-free copper, has a 1-cm2 plain, smooth surface prepared following a
consistent procedure, and would serve as a baseline case. Matching size thick film resistors,
attached onto the copper heaters, generate heat and simulate high heat flux power electronics
devices. The tests are conducted by controlling the heat flux in increasing steps, and recording
the corresponding steady-state temperatures to obtain cooling curves. The working fluid is kept
at room temperature level (22oC). Performance comparisons are made based on heat transfer
coefficient (HTC) and critical heat flux (CHF) values. Effects of spray characteristics and liquid flow
rates on the cooling performance are investigated with the selected coolants. Three types of
commercially available nozzles that generate full-cone sprays with fine droplets are utilized in
the tests. Effect of liquid flow rate is evaluated varying flow rates at 2, 3, 4 ml/s. The experimental
results obtained from this study provide a framework for spray cooling performance with the
current and next-generation refrigerants aimed for advanced thermal management of
automotive power electronics.

ii
Copy right
by
SATVIK. J. YADDANAPUDI

iii
ACKNOWLEDGMENTS
First and foremost, I would like to acknowledge the guidance and support of my
major professor Dr. Huseyin Bostanci. Without his valuable suggestions throughout, this thesis
would not have been possible. He always provided the freedom to work on my own and that
helped me to hone my skills to work independently. Throughout this journey of my master’s he
is very patient and always encouraging. I am really thankful to him for his endless support and
advice during the course of this research. Without his patience, understanding and help, I would
not have been able to successfully complete this work.
I would like to thank Dr. S. Nasrazadani, committee member for his suggestions
and his recommendations that have brought improvement to my thesis work. From the
beginning he is very helpful in choosing the right courses for my development of master’s degree
and motivating me to take up the thesis.
I would also like to thank Dr. Cheng Yu for his assistance as a committee
member and for providing useful suggestions.
I would also like to thank my lab mates Nihal Joshua for his assistance
throughout my research and also my fellow graduate students.

iv
Table of Contents
NOMENCLATURE ..................................................................................................................................... v
LIST OF TABLES ........................................................................................................................................vi
LIST OF FIGURES .....................................................................................................................................vii
CHAPTER I - INTRODUCTION .................................................................................................................. ..1
CHAPTER II – LITERATURE REVIEW ......................................................................................................... ..7
CHAPTER III – EXPERIMENTAL SETUP AND PROCEDURE ......................................................................... 17
CHAPTER IV – RESULTS AND DISCUSSIONS ............................................................................................. 28
CHAPTER V – CONCLUSION AND RECOMENDATIONS ............................................................................. 56
REFERENCES ..........................................................................................................................................58

v
NOMENCLATURE
A Area of heater surface, cm2
h heat transfer coefficient, W/m2oC
I Current, A
K thermal conductivity, W/moc
q” heat flux, W/cm2
Tavg average temperature, oc
Tsat saturation temperature, oc
Tsurf surface temperature, oc
TC thermocouple
V voltage, V
X TC to spray surface distance in heater wall, m
∆Tsat surface superheat, oc
∆Tsub degree of subcooling (Tsat - Tin)
Q total volumetric flow rate of spray
𝛒f liquid density
Cp Specific heat at constant pressure
hfg heat transfer coefficient of the refrigerant
η Efficiency

vi
LIST OF TABLES
Table1: Comparison for common cooling methods ................................................................................ 12
Table 2: Refrigerants comparison at saturation pressure ....................................................................... 31
Table 3: Environmental Properties ......................................................................................................... 32

vii
LIST OF FIGURES
Figure 1: Schematic illustration of spray cooling .................................................................................... 13
Figure 2: Schematic diagram of the spray chamber ................................................................................ 28
Figure 3: Schematic diagram of the experimental setup......................................................................... 29
Figure 4: Schematic diagram of the heater surface ................................................................................ 32
Figure 5: Front panel of LabVIEW program ............................................................................................ 35
Figure 6: Block diagram of LabVIEW program ........................................................................................ 35
Figure 7: Heat transfer performance of HFC-134a with TG0.3 nozzle at flow rates of 2, 3 ml/s ............... 38
Figure 8: Repeatability of HFC-134a with TG0.3 nozzle at flow rate of 2ml/s .......................................... 39
Figure 9: Heat transfer performance of HFC-134a with TG0.5 nozzle at flow rates 2, 3, 4 ml/s ............... 40
Figure 10: Repeatability of HFC-134a with TG0.5 nozzle at flow rate 2ml/s ............................................ 41
Figure 11: Heat Transfer performance of HFC-134a with TG0.7 nozzle at flow rates 2, 3, 4 ml/s ............ 42
Figure 12: Repeatability of HFC-134a with TG0.7 nozzle at flow rate of 2 ml/s ....................................... 42
Figure 13: Heat Transfer performance of HFC-134a with nozzles TG0.3, 0.5, and 0.7 at flow rate of 2 ml
/s ........................................................................................................................................................... 44
Figure 14: Heat transfer performance of HFC-134a with nozzles TG0.3, 0.5 and 0.7 at flow rate of 3 ml/s
.............................................................................................................................................................. 44
Figure 15: Heat transfer performance of HFC-134a with nozzles TG0.5 and 0.7 at flow rate 4ml/s ......... 46
Figure 16: HTC of HFC-134a with nozzle TG0.3 at flow rates 2, 3, 4ml/s. ................................................ 46
Figure 17: HTC of HFC-134a with nozzle TG0.5at flow rates 2, 3, 4ml/s .................................................. 48
Figure 18: HTC of HFC-134a with nozzle TG0.7 at flow rates 2, 3, 4ml/s ................................................. 48
Figure 19: CHF values as a function of liquid flow rate of HFC-134a for nozzles TG0.3, 0.5 and 0.7. ........ 49
Figure 20: Heat transfer performance of HFO-1234yf with TG0.3 nozzle at flow rates of 2, 3ml/s .......... 50
Figure 21: Repeatability of HFO-1234yf for nozzle TG0.3 at flow rate 2ml/s ........................................... 51
Figure 22: Heat Transfer performance of HFO-1234yf with TG0.5 nozzle at flow rates 2, 3, 4ml/s .......... 52
Figure 23: Repeatability of HFO-1234yf for TG0.5 nozzle at flow rate of 2ml/s. ...................................... 52
Figure 24: Repeatability of HFO-1234yf for nozzle TG0.5 at flow rate of 3ml/s. ...................................... 53
Figure 25: Heat Transfer performance of HFO-1234yf with TG00.7 nozzle at flow rates of 2, 3, and 4 ml/s
.............................................................................................................................................................. 54
Figure 26: Heat transfer performance of HFO-1234yf for nozzle TG0.3, 0.5, and 0.7 at flow rate of 2ml/s.
.............................................................................................................................................................. 55
Figure 27: Heat transfer performance of HFO-1234yf for nozzle TG0.3, 0.5, and 0.7 at flow rate of 3ml/s.
.............................................................................................................................................................. 56
Figure 28: Heat transfer performance of HFO-1234yf for nozzle TG0.5 and 0.7 for flow rate of 4ml/s. ... 57
Figure 29: HTC of HFO-1234yf with nozzle TG0.3 at flow rates of 2, 3ml/s. ............................................ 58
Figure 30: HTC of HFO-1234yf with nozzle TG0.5 at flow rates of 2, 3, and 4ml/s. .................................. 59
Figure 31: HTC of HFO-1234yf with nozzle TG0.7 at flow rates of 2, 3, and 4ml/s. .................................. 60
Figure 32: CHF values as a function of liquid flow rate of HFO-1234yf for nozzle type TG0.3, 0.5 and 0.7.
.............................................................................................................................................................. 60
Figure 33: HTC of HFC-134a and HFO-1234yf with nozzles TG0.3, 0.5, and 0.7 at flow rates of 3ml /s. ... 61
Figure 34: CHF value as a function of liquid flow rate for nozzle types of TG0.3, 0.5, and 0.7 for HFC-134a
and HFO-1234yf. ................................................................................................................................... 62

viii
Figure 35: Efficiency of spray heat transfer for HFC-134a and HFO-1234yf. ............................................ 63

CHAPTER I
INTRODUCTION
Power electronics such as Insulated gate bipolar transistors (IGBT’s) and Diodes dissipate
large amount of heat due to increase of their clock speeds and reduction of size to obtain more
power and compactness. These devices continue to evolve with less volume and more power as
the technology advances. Gordon Moore, who was co-founder of the Intel stated that, “number
of transistors on a chip will double approximately every 2 years”. This was given as Moore’s law
and we can observe this statement in every power electronics technology. Because of their clock
speeds and power dissipation, it is crucial to maintain these electronics at desired temperature
range to eliminate stresses and to increase reliability of the device. Miniaturization of the
electronic devices has created a space for thermal management to play a vital role in designing
of the electronic equipment. In some areas, thermal management directly improve overall size,
weight and cost of the system.
The present day technology has been revolutionized in such a way that gas powered
vehicles are transitioning to electric drive vehicles. Power electronics in the hybrid vehicles
function as an interface between the energy sources such as batteries and the traction drive
motor, and therefore considered as the vital component of the vehicle. In order to ensure the
efficient and reliable operation of the power electronics, thermal management plays a key role.
The thermal management of the power electronics in the hybrid vehicles aims the removal of the
high heat fluxes (>200 W/cm2) from the electronics (IGBTs, diodes) and maintaining them in their
allowable limits (<150oC). In the meantime, the ideal thermal management solution should be
1

low-cost, compact, lightweight and energy efficient. In a broader sense, improving the thermal
management of power electronics would also help the penetration of hybrid and electric vehicles
into the market. Thermal management technologies are mainly classified into Passive and Active
thermal management methodology.
Passive Thermal Management - Passive cooling thermal solutions takes the
leverage of using thermodynamic properties such as conduction, convection and
radiation to transfer the heat to ambient air. These technology don’t consume any
energy and hence are cheapest and easiest thermal solutions. Some examples of
passive thermal management are Heat sinks, Thermal interface materials (TIM’s),
Heat spreaders, Heat pipes.
Active Thermal Management - In this active thermal solution external energy will
be introduced to attain the heat transfer process. In fact they are most complex
and expensive systems with better performance. Some of the active thermal
management techniques are forced air (use of external fans), thermoelectric
coolers, and spray cooling.
2

Table1: Comparison for common cooling methods
In general, there are several cooling techniques in order to remove heat from the required
element and maintain them under sustained conditions. The very first method of cooling
technique is by air cooling and is used for conventional purposes. These air cooling methods are
confined to some limited applications. However, for demanding applications, advanced liquid
cooling methods, involving phase change mechanisms, are evolved based on extensive research.
The very first method of the liquid cooling technique was immersion cooling, in this process the
heating element is placed in the pool of the working fluid or dielectric in order to remove the
heat from the heating element by changing the phase of the liquid from liquid to vapor. But the
immersion cooling technique cannot be served in the areas where larger amount of the heat
fluxes to be removed.
In order to remove the high heat fluxes, an advanced cooling technique, known as spray cooling
has been developed. In this technique liquid is forced through a small orifice of the nozzle at
which the liquid stream is atomized into fine droplets and is sprayed on to the heating element
Natural Convection Forced Convection Liquid Cooling
(water)
Immersion
Cooling Spray Cooling
h = 5-30 W/m2K h = 20-400 W/m2K
h = 100 -1600 W/m2K
h = 800 – 10000
W/m2K
h = 200000-400000
W/m2K
CHF up to 15 W/cm2
CHF up to 35 W/cm2
CHF up to 90 W/cm2
CHF up to 150 W/cm2
CHF up to 1200 W/cm2
Free Convection Forced Convection Forced Convection Free Convection Forced Convection
3

in order to remove the high heat fluxes and to maintain the device temperature at the required
temperature. These atomized droplets involve in phase change immediately after contacting the
heated surface. With the time being, bubbles nucleate on the heated surface inside the thin
liquid film. The droplets that are continually sprayed interact with the growing bubbles with in
the film, results in high heat removal through conduction, convection and phase change. The
spray cooling process is schematically shown below in the Figure1.
Figure 1: Schematic illustration of spray cooling
By this spray cooling technique a large surface area-to-volume ratio can be achieved.
Some of the advantages of the spray cooling technique are [1]
1) Removes large amount of thermal energy due to latent heat of vaporization
4

2) It helps in creating uniform temperature and reduce magnetic field fluctuations
3) It can reduce electrical noise
4) Ability to scale-up for large surfaces
5) Low droplet impact velocity and no temperature overshoot
The main task lies in the selection of appropriate coolant for the spray cooling method for
the particular application. Many spray cooling tests were conducted with different dielectric
liquids, such as Ammonia, HFE-7100, HFE-7200 and HFC-134a has been used. For the cooling of
the automotive power electronics many studies has selected the coolant HFC-134a which belongs
to the family of the hydrofluorocarbons. . HFC-134a is the present generation refrigerant
presently using in all the automotive air conditioning systems. This liquid is used because of its
zero ozone depletion and less global warming effects. HFC-134a are introduced in the place of
Hydrofluorocarbons (HCFC’s) such as R123, R124 and R141b. As the technology advances the U.S
and European governments are requiring the use of a refrigerant with a global warming potential
(GWP) of less than 150. In the replacement for the present generation refrigerant because of its
carbon emissions, a new refrigerant has been developed and is known as HFO-1234yf which is
also called as Tetrafluoropropene. When compared the GWP of HFO-1234yf is much less than
HFC-134a and is 4.
This study aims to experimentally investigate the spray cooling characteristics of
HFC-134a and HFO-1234yf refrigerants. The results are expected to provide an initial
performance comparison with the current (HFC-134a) and next-generation (HFO-1234yf) mobile
air conditioning refrigerants that would be implemented for active two-phase cooling of
5

automotive power electronics found in hybrid and electric drive vehicles. Experimental
parameters involve three types of commercial pressure-atomizing nozzles and varying flow rates
for each refrigerant to determine their heat transfer performance in terms of heat transfer
coefficient (HTC) and critical heat flux (CHF).
6

CHAPTER II
Literature Review
The need for high heat flux cooling techniques is driven very much by the microelectronics
and semiconductor industry. With the continuing technology, the semiconductor industry allow
the device feature size to shrink and the transistor density and switching speed to double every
one and half to two years. Correspondingly, the heat dissipation from the chip increase in
proportion if there is no change in the semiconductor technology. The operating efficiency and
the stability of these power electronics depends on how effectively the heat generated can be
removed from the system. During the decades there are several types of the cooling techniques
have been developed and the heat removal rate for those techniques are discussed in the table
above.
The choice of an appropriate cooling technique is however depend on the specific
application and the critical system factors which must be satisfied, such as maximum permissible
heat flux, total heat load , tight temperature tolerances, reliability considerations or overall
power consumption. Studies show that not only the cooling requirements of the chip have to be
met but also their junction temperature needs to be maintained at certain range. Excessive
temperatures could melt joints, cause oxidation, induce stress and also cause failure frequency.
Thus perfect cooling technique is to be preferred in order to sustain the chip with more reliability.
As shown in the above table, for heat fluxes up to 15 W/cm2 forced cooling is adequate. But the
amount of the heat fluxes that are to be removed from the hybrid vehicle electronics is >200
7

W/cm2. Therefore, in order to remove these large amount of heat flux spray cooling technique is
much more adequate.
The main technical challenge for the thermal management of the hybrid vehicle
electronics is to develop an efficient method for removing several kilowatts of heat in a confined
space under harsh ambient conditions and to maintain the chip temperature below <150oC.
There are many previous studies had conducted on the spray cooling technology. A study
conducted by Toda (1972) [2], had stated that subcooling of the liquid does not affect much on
the single phase and nucleate boiling heat transfer and shows some dominant effect on the CHF.
A comparison between the spray cooling and pool boiling by Monde (1980) [3] explained that, in
the terms of nucleate boiling gradient spray cooling values are nearly half when compared to the
pool boiling. He also concluded that by increasing the spray volume flux, cooling performance
can be increased. A study by Mudawar et al. [4] in the year 1989, found that spray volume flux
had the most effect on the critical heat flux when compared to other hydrodynamic properties
of spray.
In the year 2004, many researchers have misrepresented the term spray cooling by “spray
evaporative cooling”. It was pointed out by Pautsch [5], and he explained that many system
design that uses spray cooling does not undergoes evaporative state of liquid for heat removal.
He then also proposed a name called “spray cooling with phase change” for the system that
utilizes spray cooling that has phase change. He also suggested that the values of CHF are much
higher for the system that has phase change than designs with lower CHF values.
8

The main parameters for the spray are spray nozzle, volume flux, subcooling and
properties of the liquid. These are studied by Mudawar et al [6]. in the year 1996 to understand
the concept of nucleate boiling and critical heat flux for the full cone nozzle sprays. They
suggested that CHF is mainly increased by the increase of the flow rate and also because of the
subcooling of the liquid. They also suggested that surface tension mainly plays a vital role in to
achieve greater CHF (small droplets with greater surface tension achieves greater CHF). They also
explained that, for a full cone spray nozzle the droplet diameter which in term is defined as Sauter
mean diameter (d32) is very important parameter to understand the spray characteristics. The
Sauter mean diameter is defined as droplet diameter that has the same area of the volume
surface as the entire spray. They also suggested that the Sauter diameter is dependent on the
nozzle parameters such as orifice diameter, orifice flow conditions with calculated weber and
Reynolds number before the breakup of the liquid into droplets.
The very first experiment with the subcooled liquid for the spray cooling was investigated
by Chen et al. [7] in the year 2002 to study the effect of the spray characteristics. Form their
research they suggested three spray parameters which are independent and are mean droplet
velocity (V), Sauter mean droplet diameter (d32) and mean spray droplet flux (N). They suggested
that critical heat flux varies with proportional to V1/4 and N1/6 and it is dependent on d32. The heat
transfer coefficient and the critical heat flux increases with increase in V. CHF and Heat transfer
coefficient also increases with increase in N, while the other spray parameters were kept within
the close ranges. Their results showed that dilute spray with large droplet velocity is more
effective than a dense spray with low velocity to increase the CHF for a given N value.
9

For the spray cooling, the very first liquid using to spray was water by Toda [8] in the year
1972. He found that there was an increase in the CHF approximately by 50% when he increased
the mean droplet diameter from 88 to 120 microns. Pais et al [9]. in the year 1992 suggested
that CHF can be achieved greatly by decreasing the droplet diameter. Another research by
Sehmbey et al. [10] suggested that because of the smaller flow rates the CHF attained was very
low and with the larger flow rate there are great values of CHF. Bostanci et al. [11] in the year
2010 has stated that increase of the flow rate beyond certain level will have lesser impact on the
attaining the greater CHF.
A research by Peterson [12] in the year 1970 has found that a heat flux of 15MW\m2 can
be removed using spray cooling technique. Bonacina et al [13] (1979) studied that, by the spray
cooling the surface temperature of 130oC can be maintained in order to remove 2.2MW/m2 of
the heat from the surface. Again in the year 1975, Bonacina et al. [14] also found that the highly
wetted surface can help to achieve in the high heat transfer. This was also explained by Kim et al.
[15] in the year 1997 that the large film thickness helps to produce lower heat transfer rates.
A research conducted by Yang et al. [16] in the year 2006 observed that, heat fluxes of
10MW/m2 can be achieved through the gas assisted spray cooling with water having the phase
change from a low wall surface heat. Mudawar et al [17] in the year 1996 experimented with FC-
72 as working fluid which is a dielectric liquid and found that it can remove heat flux nearly of 1
MW/m2.
Pautsch et al [18] in the year 2006 found one of the parameter that effect the spray
cooling performance was thickness of the liquid film layer that exits on the heater surface. In
10

general, this thickness will be the size of 0 to 90 microns. They also explained the concept that
once the droplet leaves the nozzle and hit the heated surface, they continuously swept of by the
subsequent droplets in that continuous flow and as a result the surface was continually wetted
hence helps in the formation of a thin film layer on the heated surface. The main mechanism
explained in this theory was bubble nucleation, gas bubbles, conduction and convection. They
also concluded that the explained mechanisms help in the heat removal process and also helps
in the formation of the thin layer on the surface.
This thin film concept was mainly developed by a group of researchers Pais et al [19] in
the year 1992. They found that this thin film layer on the heated surface helps in the conduction
of heat and also explained that high heat transfers can be achieved by the thinner film and also
due to the thermal gradient across this thin film.
In the spray cooling process, the liquid that leaves the nozzle is divided in to fine droplets
and these droplets are forced to hit the heater surface and results in the formation of the thin
film because of their wittedness. The next coming droplets which poses some momentum helps
in the film to moves and evolve along the surface. These new droplets have much less
temperature than the temperature of the film at the heater surface. These droplets helps in the
continuous formation of the thin film on the heater surface and helps in the removal of heat
transfer. This entire process was explained by Toda in the year 1972.
A professor named Kim [20] in the year 2007, made an extensive research in the area of
spray cooling and found that heat transfer mechanism by the spray cooling are not properly
understood because they are relied on the parameters such as unique droplet size distribution,
11

droplet number density and droplet velocity. He also reported other unique parameters which
effect the heat transfer process by spray cooling such as roughness of the surface, angle of
impact, content of gas in the system, thickness of the film formed, type of the nozzle used and
the orientation of the heated surface. In this report he also explained that because of the droplet
impingement they spread on the heater surface to form a liquid film which helps in the removal
of large amounts of heat or energy. He also stated that with the increase of the flow rate there
will be increase in the heat transfer process because of the velocity of the liquid on the heated
surface and the thickness of the thermal boundary layer. He specified that that the mechanisms
which results in the occurrence of the critical heat flux during the spray cooling are currently
unknown. He also suggested two mechanisms and they are homogenous nucleation within the
film and other one was removal of the thing liquid film because of the nucleation with in the film.
He also concluded that in order to know more about the spray cooling process many applications
and new experimental techniques have to be developed in this area.
In the year 2006, Pautsch et al. [21] experimented the liquid film using the low flowrate
for the single nozzle and also for high liquid flow rate using the multiple nozzles (four nozzles).
The working fluid used by them was a refrigerant known as FC-72. The thickness of the film from
these experiments were measured by the basics of the geometric optics. They arranged a small
glass which in return projects a light rings on to the heated surface and then these rings were
photographed. These rings are used for the measurement of the radius and from its radius the
thickness of the film was calculated. The results showed that liquid film formed by the multiple
nozzles was thick and shows the poorest heat transfer. It also observed that the thickness of the
liquid film for the single nozzle has been changed because of the heat load.
12

Previous, before the contribution to the measurement of the liquid film thickness by the
single and multiple nozzle sprays. Pautsch et al. [22] in the year 2005 they also proposed that
spray cooling with single nozzle helps two phase heat transfer process to increase 20 – 35% than
using the multiple nozzle, where it only helps in attainment of 15-25%. Their further studies
indicate that the heat transfer process is much efficient in the two phase than compared to the
single phase.
Many studies have been developed to explain the liquid film thickness by the spray
cooling and there was no particular theoretical method was proposed until the year 2007.
Kalantari [23] conducted extreme research on the liquid film thickness formed with interaction
of the heated surface during the spray and introduced a theoretical model based on the
predictions such as average film thickness, flux density, Reynolds number, average drop diameter
and the impacting droplets.
Secondary nucleation, which is one of the main mechanism involved in the heat transfer
process was initially explained by Tang et al [24] in the year 1996 and the research was further
elaborated by Rini et al [25] in the year 2002.
The importance of the spray cooling over the jet impingement was professionally
explained by Oliphant et al [26] in the year 1998. They mainly investigated in the areas of spray
cooling and jet impingement cooling at the non-boiling regime. They showed that the heat
transfer mainly depends on the droplet velocity and the spray mass flux. Their experiments
showed that the surface temperature on impingement cooling is maintained below the
saturation temperature of the spray liquid. In the non-boiling regime their experiments showed
13

that because of the combination of the both evaporative cooling and unsteady thermal boundary
layer resulted in the increase of the heat transfer for spray cooling when compared to the jet
impingement cooling. They explained that spray cooling can use the minimal fluid than the jet
impingement fluid and can provide same amount of heat transfer. They concluded that because
of the large area covered by spray cooling because of the droplets atomized by the spray nozzle
can helps in greater heat transfer in a much promising way.
In general, spray cooling was mainly used to remove high heat fluxes from the electronic
devices, in the year 2006, Rybicki et al. [27] simulated a square heater for the high heat flux
generating device to study the spray parameters. The working fluid used for this experiment was
PF-5052. They tested the cooling performance by using three full cone nozzles with orientation
facing upward and also for the different subcooling temperatures. From their experiments, it was
demonstrated that to study the performance of the spray cooling the main hydrodynamic
parameters are Sauter mean diameter and the volume flux. They also concluded that the
orientation of the nozzle doesn’t play much role in increasing the performance of heat transfer.
A research performed by Karwa et al. [28] in the year 2007 by spray cooling with the low
wall superheats reported that the heat transfer takes place mainly using the single phase
convection mechanism. When the saturation temperature of the fluid is equal to the heated
surface temperature then there will be higher evaporation rates and there will be a formation of
the thin film on the surface of the heating element. They also concluded that impingement of the
droplets on the thick film provides enhanced mixing and also increases the film turbulence which
results in the increase rate of heat transfer. Lin et al. [29] in the year 2003, conducted an
experiment to observe the spray cooling performance in a closed loop system and concluded
14

when the mass flux is higher, it results in the reduction of the evaporation rate because of the
formation of the thicker liquid film.
For the any spray cooling to observe the performance of the system, the distance
between the surface (heating element) and the nozzle play an important role. This was clearly
explained by Zhao et al. [30] in the year 2010. The conditions used for this research was
isothermal surface and used only a single nozzle with water as the working fluid. He ran some set
experiments with spacing between the heater and the nozzle having the distance of 3 to 7 mm
and they kept the heater surface limited to 100oC. Their experiments showed that with an
increase in the distance between the nozzle and the surface the temperature decreases first and
then increases beyond certain position. They also explained that as increasing in the spray height
there was increase in the average surface temperatures. They also suggested that system heat
transfer performance is also a function of the distance between the nozzle and spray. The reason
for the increase in the surface temperature when the nozzle is away from the surface because
there will be non-uniform distribution of the spray on to the heated surface and formation of the
thin film which helps in heat transfer and this was explained by Hseih et al. [31] in the year 2004.
Another study by Campbell et al. [32] and Ayers et al. [33] showed that thermal
management of power electronics is vital to the operation of hybrid electronic vehicles. They also
suggested that R134a has no damaging effect on the normal operation of the submerged IGBT.
The results proved that flow boiling of R134a can give the adequate cooling capacity and keep
junction temperature below 150oC.
15

The increasing interest in this field has brought up another research conducted by
Mudawar et al. [34]. Their results with HFE-7100 spray cooling showed adequate performance
level, and viability of this method in meeting thermal management requirements for hybrid
vehicle electronics. Mudawar et al. [35] also considered R134a as an alternative coolant, and
provided some predictive performance metrics.
In year 2012, Bostanci et al. [36] investigated spray cooling using high temperature
antifreeze coolant, and indicated that thermal management of power inverter modules with
spray cooling technology was an attractive option for hybrid and electric cars towards developing
a cost competitive electric drive system. Augusto et al. [37] in 2013 conducted a research for
evaluation of spray cooling of R134a on a plain and enhanced surfaces and concluded that critical
heat flux for the plain surfaces are much more higher than the enhanced surfaces due to decrease
in the film velocity and an increase in the film thickness.
16

CHAPTER III
Experimental Setup and Procedure
This chapter explains the experimental setup and the steps of procedure used in the
current research. This section discuss in more detail about the test setup, working fluid, heater
fabrication and test conditions and procedures. This chapter concludes with the uncertainty
analysis of the measurements.
3.1 Experimental Setup
The major components of the test equipment includes a spray chamber, a reservoir
chamber for the storage of the refrigerant, test section, a condenser, temperature and pressure
sensors, a DC power supply, and a computer controlled data acquisition system (DAQ). The
reservoir chamber is designed to withstand a pressure of 300psi with material stainless steel 316
to provide greater strength and reliability. The wall thickness of the reservoir was 6.35mm where
it has the outer diameter as 82.55mm and the having the internal diameter as 76.2mm with
height of 163mm. This shell was tightly enclosed by the top and bottom peek lids which are tightly
held closely by 6 sets of stainless steel bolts of 6.35mm, nuts and washers. Two O-rings of the
respective size are placed in between the lids and the shell in order to eliminate any leaks of the
liquid or vapor through the reservoir during the storage and also while operating the system. The
bottom lid of the reservoir section consist of the two installed cartridge heaters, which are used
17

to heat the liquid pool to simulate the desired test conditions using a temperature controller if
necessary. The bottom lid also accommodates an outlet tubing which is in turn connected to gear
pump for the circulation of the liquid. The top lid consists of an installed thermocouples, to
continually monitor the temperature of the pool and the installed cartridges in the reservoir. The
top lid also accommodates a pressure transducer which is used to monitor the pressure of the
reservoir during the test conditions and also when the system is at ideal stage. The refrigerant
that was used to cool the heated surface is then collected back into the reservoir through the
condenser from the top lid of the reservoir. The reservoir section is illustrated in the following
Figure. The liquid refrigerant is circulated through the system using a small gear pump which has
the potential of up to taking 12 volts. It helps in increasing in the pressure of the liquid based on
the nozzle and flow rate to obtain fine atomization of the liquid. A filter with was arranged next
to the pump contains a filter of 80 micron size to remove any particles or dust that enters the
spray chamber and effect the performance of the system. Then there was a flowmeter which was
helps in maintaining certain flow rate based on the density of type of the refrigerant. Then the
liquid enters from flowmeter to spray chamber. The spray chamber is detailed as follows.
In general, the spray chamber consists of different sections such as Liquid Inlet, Exhaust
Outlet, spacer, Strainer and Nozzle.
Liquid Inlet: The subcooled liquid which was circulated by the pump enters the liquid
manifold. This liquid manifold consists of a strainer which is used to purify the refrigerant that
enters the nozzle. The refrigeration pressure and temperature in this inlet manifold are
monitored continuously.
18

Exhaust Outlet: After leaving the inlet manifold, the liquid enters the exhaust manifold.
This exhaust manifold contains a specific type of nozzle supplied by spray system co. these nozzle
types are TG0.3, TG0.5, TG0.7 having the diameter of the orifices as 0.51mm, 0.61mm and
0.76mm. These nozzles provide the full cone spray on the heated surface. The refrigerant will be
in the two-phase in the exhaust manifold and the pressure, temperatures in the exhaust manifold
are also monitored continuously with the help of the fully developed LabVIEW software.
Spacer: The spacer is used to separate the heater from the exhaust manifold. The spacer
consists of a four holes to which the heater will be attached using the 2/56 screws. The nozzle
and the heater were separated by a distance of 10mm. The detailed Figure of the spray chamber
can be observed from the below diagram.
The liquid or the vapor that exists from the exhaust outlet of the spray chamber enters the plate
heat exchanger in which the heat was rejected to the ambient air with help of the chiller. The
chiller temperature was maintained at a level that the liquid enters the reservoir should be at
Figure 2: Schematic diagram of the spray chamber
19

room temperature. The antifreeze used in the chiller was the mixture of ethylene glycol and
water with the ratio of 1000: 400 ml. In the plate heat exchanger the vapor was condensed and
the liquid was directed into the reservoir to again circulate in the system. The entire schematic
sketch of the setup is showed as below.
Figure 3: Schematic diagram of the experimental setup
20

3.2 Working Fluid
Spray cooling is an attractive option because of its ability to remove large amounts of
heat. Since, the fluid would be in the direct contact with the electronics it must be di-electric,
stable, and non-toxic and have a low boiling point. Thermal requirements helps to represent only
one aspect of the task in selecting an appropriate coolant. The other crucial requirements are
inertness, material compatibility and environmental concerns. In general, there are two types of
coolants such as liquid coolant and refrigerants. Liquid fluids (HFE-7100) can be describes as the
fluids that maintain the liquid state even at the atmospheric pressure and the refrigerants (HFC-
134a) possess vapor state even at atmospheric pressure.
Numerous studies investigated different liquids, refrigerants and addressed its heat
transfer performance, CHF limits, and enhanced methods with different heating surfaces for
various applications [38-40]. HFC-134a is the present generation refrigerant presently using in all
the automotive air conditioning systems. This refrigerant is used because of its zero ozone
depletion and less global warming effects. HFC-134a is introduced in the place of
Hydrofluorocarbons (HCFC’s) such as R-123, R-124 and R-141b. As the technology advances the
U.S and European governments are requiring the use of a refrigerant with a global warming
potential (GWP) of less than 150. In the replacement for the present generation refrigerant
because of its carbon emissions, a new refrigerant has been developed and is known as HFO-
1234yf which is also called as Tetrafluoropropene. When compared the GWP of HFO-1234yf is
much less than HFC-134a and is 4.
21
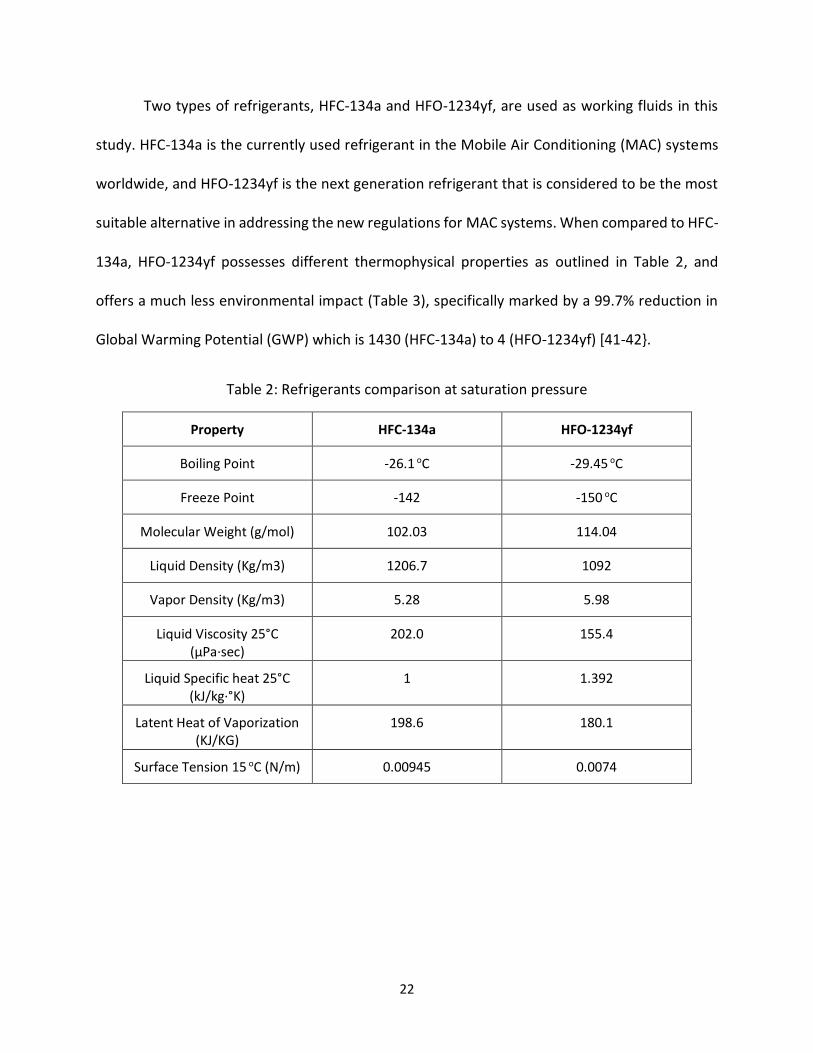
Two types of refrigerants, HFC-134a and HFO-1234yf, are used as working fluids in this
study. HFC-134a is the currently used refrigerant in the Mobile Air Conditioning (MAC) systems
worldwide, and HFO-1234yf is the next generation refrigerant that is considered to be the most
suitable alternative in addressing the new regulations for MAC systems. When compared to HFC-
134a, HFO-1234yf possesses different thermophysical properties as outlined in Table 2, and
offers a much less environmental impact (Table 3), specifically marked by a 99.7% reduction in
Global Warming Potential (GWP) which is 1430 (HFC-134a) to 4 (HFO-1234yf) [41-42}.
Table 2: Refrigerants comparison at saturation pressure
Property HFC-134a HFO-1234yf
Boiling Point -26.1 oC -29.45 oC
Freeze Point -142 -150 oC
Molecular Weight (g/mol) 102.03 114.04
Liquid Density (Kg/m3) 1206.7 1092
Vapor Density (Kg/m3) 5.28 5.98
Liquid Viscosity 25°C (μPa·sec)
202.0 155.4
Liquid Specific heat 25°C (kJ/kg·°K)
1 1.392
Latent Heat of Vaporization (KJ/KG)
198.6 180.1
Surface Tension 15 oC (N/m) 0.00945 0.0074
22

Table 3: Environmental Properties
3.3 Test Section
In this test section, a copper piece of area 1-cm2 which is oxygen free is used as a heater
(which simulates the high heat flux generating power electronic device). The copper piece that
was exposed to the spray was 10mm × 10mm. On the other side of the copper piece a matching
size thick film resistor (which usually reads 10Ω) is soldered. Two lead wires also will be soldered
onto this resistor to generate heat when the voltage is applied across the heater (Figure 4).
Property HFC-134a HFO-1234yf
ODP 0 0
GWP 1300 4
Figure 4: Schematic diagram of the heater surface
23

The heat flux is determined from the total power supplied into the thick film resistor per
unit resistor base area as shown below.
q" =𝐕 . 𝐈
𝐀
The temperature of the heater will be monitored with the help of the two T-type thermocouple
of gauge 36 are embedded halfway in the heater wall and spaced across the 1-cm2 area as
illustrated in the Figure above. The temperature spread from the two TCs did not exceed ±0.3oC
at 100 W/cm2, and ±0.5oC at 200 W/cm2 indicating uniform cooling across the surface. Spray
surface temperature was calculated by extrapolating average of two TC readings through the
known distance to the surface (consistently taken as half of heater wall thickness (1 mm)) and
assuming steady 1-D conduction through the heater wall as
𝑇𝑠𝑢𝑟𝑓 = 𝑇𝐶𝑎𝑣𝑔 − (𝑞" . 𝑥
𝐾).
The heater tested for this research was plain smooth copper surface. The plain, smooth spray
surfaces were prepared following a consistent procedure. First, 1200-grit sandpaper is used to
remove scratches and oxide layer from the copper piece. Then aluminum oxide (Al2O3) solution
with 5µm particle size is added on the polishing pad spinning at high speed. The copper piece is
held at rotating pad with dripping water for 30 s. This polishing process is repeated with Al2O3
solution having 1 and 0.05 µm particle size while rotating the sample position 90o at each step.
Then the heater surface is rinsed thoroughly with water and dried. This heater surface is
considered as reference spray surface for the performance evaluation.
24

3.4 Test conditions and procedures
Initially, the heater was installed onto the spray chamber with 2-56 size screws. Using a vacuum
pump, a vacuum level of as low as 720 µm was attained to ensure the system was sealed well,
and air was evacuated. Then the refrigerant was charged into the closed loop system at an
appropriate level. For the change of the heater, the nozzle chamber was isolated with ball valves,
and after the heater change a similar evacuation process was done for the isolated section and
refrigerant was added if necessary.
All the tests were conducted at ~22oC (room temperature) and 72 psig (for HFC-134a) or
75 psig (for HFO-1234yf) saturation conditions. Cooling curves, in the form of surface superheat
(Tsat = Tsurf - Tsat) vs. heat flux (q″), were generated for each test by increasing the heat flux
gradually in steps of 2-10 W/cm2 up to CHF. The resulting heater temperatures were recorded
every 1.0 s over 5 min durations at each heat flux level. The heater temperatures usually reached
steady state in about 90 s. If CHF is observed with a sudden temperature rise, the heat flux
immediately lowered to the safe level (100 W/cm2) and then gradually decreased back to 0
W/cm2. A LabVIEW program in connection with the DAQ unit displays and records all the
temperature, pressure and heat flux data. The following Figure 5,6 shows the front panel (user
interface) and the block diagram of the fully developed LabVIEW program.
25

Figure 5: Front panel of LabVIEW program
Figure 6: Block diagram of LabVIEW program
26
3.5 EXPERIMENTAL UNCERTAINITIES
Experimental uncertainties were estimated mainly for heat flux and temperature
measurements that are critical in performance evaluation. Uncertainties were estimated mainly
for heat flux and temperature measurements that are critical in performance evaluation. Error
involved in heat flux measurement (considering variations in voltage, current, and area) was
±2.0% at 150 W/cm2. Error in temperature measurements from the embedded TCs in the heater
wall was calibrated to be ±0.2 oC. Spray surface temperature had an uncertainty of approximately
±0.3 oC involving uncertainty in temperature extrapolation from the TC hole to the heater surface
at 150 W/cm2. Heat transfer coefficients included up to ±3.1% uncertainty at 150 W/cm2
considering all nozzle types and flow rates used.
27

CHAPTER IV
RESULTS AND DISCUSSIONS
This chapter provides the experimental results, and discusses the spray cooling
performance based on the Heat Transfer Coefficient (HTC) and Critical Heat Flux (CHF). The spray
characteristics and liquid flow rates on the cooling performance are investigated with selected
coolants (HFC-134a and HFO-1234yf). The experimental results obtained from this study provide
a frame work for spray cooling performance with the present and next generation refrigerants
aimed for advanced thermal management of automotive power electronics.
4.1 RESULTS FOR HFC-134a
Smooth plain copper was tested with HFC-134a refrigerant using the all three
commercial nozzle with different flow rates were tested. Initially the tests were performed using
a TG0.3 nozzle as shown in Figure 7, With maintaining 2 ml/s flowrate the CHF value attained
was 210 W/cm2 at about 29.55◦C surface superheat. The CHF value attained with 3ml/s for the
same nozzle type was 238 W/cm2 which is a higher CHF than previous flow rate and maintaining
the temperature of surface at 37.84◦C surface superheat. Due to the high pumping power
consumed by the nozzle to attain 4ml/s, the test for 4ml/s with TG0.3 nozzle was eliminated. The
heat transfer and the CHF monotonically increase with the spray flow rate for a given nozzle.
From the Figure 7, there was drastically an increase of 13.3% critical heat flux.
28

To make sure that our results are more repeatable, we conducted a repeatability for the
nozzle TG0.3 at 2ml/s. From Figure 8, the CHF obtained for both the tests was 210W/cm2
maintaining the surface temperature at 29.55oC and for second test 30.41oC.
Figure 7: Heat transfer performance of HFC-134a with TG0.3 nozzle at flow rates of 2, 3 ml/s
29

Figure 8: Repeatability of HFC-134a with TG0.3 nozzle at flow rate of 2ml/s
After evaluating the performance of HFC-134a with the TG0.3 nozzle at flow rates of 2, 3ml/s,
another nozzle that offers the full cone spray was installed to evaluate the performance of HFC-
134a. By performing the tests with newly installed nozzle type TG0.5 the results were plotted as
shown in the Figure 9. A test conducted with TG0.5 nozzle at the flow rate of 2ml/s resulted in
attaining the CHF of 217W/cm2 while maintaining the surface temperature at 27.66oC. With the
increases flow rate, a test was conducted at 3 ml/s for the same nozzle type and the heater used
the same and the CHF attained for this flow rate and nozzle type was 244 W/cm2 and the surface
temperature observed was 36.01. This indicates that there was development 12.4% increase of
CHF with increased flow rate. The same heater was used to determine the evaluation of TG0.5
30

nozzle with flow rate of 4ml/s HFC-134a and it the CHF observed was 258W/cm2 and maintaining
the surface superheat at 35.69oC.
A test with TG0.5 for the flow rate 2 ml/s was repeated (Figure 10) to gain the
repeatability of the results. The first test showed the CHF attained was at 217W/cm2 with the
surface temperature of 27.66oC and the second test with the same heater showed the promising
results following the same pattern as the first cooling curve by attaining the CHF at 215 W/cm2
and maintaining the surface temperature at 24.85oC. The difference in the CHF for the two
repeatable tests was observed as decrease of 0.99%.
Figure 9: Heat transfer performance of HFC-134a with TG0.5 nozzle at flow rates 2, 3, 4 ml/s
31

Figure 10: Repeatability of HFC-134a with TG0.5 nozzle at flow rate 2ml/s
The heater was now prepared to test the full cone nozzle TG0.7 with the refrigerant HFC-
1234yf. The initial test was conducted with nozzle TG0.7 with the flow rate of 2 ml/s and the
observations are that the CHF was attained at 200 W/cm2 with surface temperature maintaining
at 22.89oC. For the flow rate 3 ml/s and the nozzle TG0.7, the CHF attained was 210 W/cm2 and
the surface temperature observed was 35.42oC. For the similar conditions at 4 ml/s and for the
same nozzle, the CHF observed was 230 W/cm2, maintain the surface temperature at 34.05oC.
The results for the TG0.7 nozzle with different flow rates are presented in the form of spray
performance curves in the Figure 11. From switching from 2 ml/s flowrate to 3 ml/s flowrate
there was an increase in the CHF was 10% and from 2ml/s to 4ml/s there was increase in the CHF
of 30% while the decrease in the surface temperature was 1.37oC. A repeatability test was also
conducted to gain the reproducibility and the results were plotted as shown in the Figure 12.
32

Figure 11: Heat Transfer performance of HFC-134a with TG0.7 nozzle at flow rates 2, 3, 4 ml/s
Figure 12: Repeatability of HFC-134a with TG0.7 nozzle at flow rate of 2 ml/s
33

The comparison between the performance of different nozzles such as TG0.3, 0.5 and 0.7 for the
flow rate 2 ml/s are plotted as shown in the Figure 13. For the TG0.3 nozzle the CHF was obtained
at 210 W/cm2 with surface superheat of 29.55oC, for the TG0.5 for the same test conditions the
observed CHF was 217 W/cm2 maintaining the surface temperature of 27.66oC. For, the same
flow rate the TG0.7 gave an output CHF of 196 W/cm2 while maintaining the surface temperature
at 22.84oC. For the same flow rate the with increase of the nozzle parameter (when the nozzle
increases the spray droplet velocity and respective parameters changes) we can see there was
an increase of the CHF for TG0.5 nozzle was 3.33% and decrease in the surface temperature was
1.89oC. Similarly, for the TG0.7 nozzle there was reduction of 7.14% and there was decrease in
the surface temperature by 6.71oC.
The comparison for the flowrate of 3 ml/s for different nozzle types were plotted as the
cooling curves in the Figure 14. For the 3ml/s the TG0.3 nozzle showed the CHF at 238 W/cm2
having the surface temperature of 37.84oC. When used the same heater the TG0.5 nozzle at the
same flow rate showed an improvement in the CHF at 244 W/cm2 while maintaining the surface
temperature at 36.01oC. TG0.7 nozzle showed the CHF at 210 W/cm2 having the surface
temperature of 35.42oC for the same flow rate throughout the experiment. For the flow rate of
3ml/s for the TG0.5 nozzle there was increase in the CHF by 2.52% and decrease in the surface
temperature by 1.83oC when compare to TG0.3. Similarly, for the TG0.7 nozzle there was a
decrease in the CHF value by 13.3% and decrease in the surface temperature by 2.42oC.
34

Figure 13: Heat Transfer performance of HFC-134a with nozzles TG0.3, 0.5, and 0.7 at flow rate of 2 ml /s
Figure 14: Heat transfer performance of HFC-134a with nozzles TG0.3, 0.5 and 0.7 at flow rate of 3 ml/s
35

The comparison of the Nozzles TG0.5 and TG0.7 are compared for the flow rate of 4ml/s
and the results are plotted as shown in the Figure 15. For the nozzle TG0.5 for the 4ml/s, the CHF
observed was 257 W/cm2 maintaining the surface super heat of 35.51oC. When looking at the
TG0.7 nozzle for the flow rate of 4ml/s the CHF obtained was at 230 W/cm2, where the surface
temperature observed as 34.05oC. The Nozzle TG0.7 for the same flow rate showed an increase
in the CHF by 11.7% whereas there was decrease in the surface temperature by 1.46oC. The flow
rate 4ml/s for the nozzle TG0.3 was eliminated because of the power consumed by the pump
was too high and cannot be assumed as good condition for the spray cooling setup developed for
the given conditions.
Figure 16, represents the Heat transfer coefficient data for refrigerant type of HFC-134a
for the Nozzle type TG0.3 with the flow rates of 2, 3, 4ml/s. For the TG0.3 nozzle, the highest HTC
values were observed at mid heat flux ranges because of the two phase heat transfer is more
dominant at those ranges. For, the TG0.3 at 2m/s the high heat flux that was obtained was 90.5
Kw/m2oc at heat flux range of 150 W/cm2. For the TG0.5 nozzle the highest HTC obtained was
95.6 Kw/m2oc for the heat flux of 100 W/cm2. The HTC obtained with the TG0.7 nozzle was highest
at 122.5 Kw/m2oc at the heat flux range of 110 W/cm2. When compared for the TG0.5 nozzle
there was an increase of 5.63% with respect to TG0.3 nozzle and there was increase of 28.1% for
the nozzle TG0.7.
36

Figure 15: Heat transfer performance of HFC-134a with nozzles TG0.5 and 0.7 at flow rate 4ml/s
Figure 16: HTC of HFC-134a with nozzle TG0.3 at flow rates 2, 3, 4ml/s.
37

Figure 17, is the HTC data for the refrigerant HFC-134a for the nozzle TG0.5 at the flow
rates of 2, 3, 4ml/s. For the nozzle TG0.5 at flow rate of 2mls the HTC is obtained at the maximum
heat flux of 217 W/cm2 and was 84.1 Kw/m2oC. For the same nozzle and for the flow rate of 3
ml/s the HTC obtained at the maximum heat flux of 244 W/cm2, with the heat transfer coefficient
value as 67.8 Kw/m2oC. With the flow rate of 4 ml/s, the heat HTC value was 72.3 Kw/m2oc at the
maximum heat flux of 258 W/cm2. With the nozzle type TG0.5 for the given 3 ml/s flow rate there
was a decrease of heat transfer coefficient value by 24.04% when compared with the flow rate
of 2ml/s and for the same nozzle with flow rate of 4 ml/s there was decrease by 16.3%.
HTC for the nozzle type TG0.7 for the flow rate 2, 3, 4 ml/s are plotted as a function of the
heat flux in the Figure 18. For the nozzle TG0.7 at the flow rate of 2 ml/s the heat transfer
coefficient at the maximum heat 200 W/cm2 was obtained as 87.4 Kw/m2oC. For the flow rate 3
ml/s the HTC for the maximum heat flux of 210 W/cm2 was obtained as 59.3 Kw/m2oC and for
the flow rate 4 ml/s at the heat flux of 230 W/cm2, the HTC value was 67.6 Kw/m2oC. For the
TG0.5 nozzle at the flow rate of 3ml/s there was decrease in the HTC by 47.3% at their respective
maximum heat fluxes. For the flow rate of 4ml/s when compared to flow rate of 2 ml/s there was
decrease in the HTC value by 29.2%.
38

Figure 17: HTC of HFC-134a with nozzle TG0.5at flow rates 2, 3, 4ml/s
Figure 18: HTC of HFC-134a with nozzle TG0.7 at flow rates 2, 3, 4ml/s
39

With the refrigerant HFC-134a, three nozzles were tested with different flow rates. The
resulted CHF values were plotted in the Figure 19 as function of the flow rate (ml/s).
Figure 19: CHF values as a function of liquid flow rate of HFC-134a for nozzles TG0.3, 0.5 and 0.7.
40

4.2 Results for HFO-1234yf refrigerant
Heat transfer performance of the refrigerant HFO-1234yf for the nozzle TG0.3 at the
flow rates of 3, 4 ml/s are plotted as shown in the Figure 20. With the nozzle TG0.3, the CHF
value that was attained for the 2ml/s was 150 W/cm2 by having the surface temperature at
73.07 oC. For the same nozzle with the flow rate of 4ml/s the CHF value observed was 160
W/cm2 with the surface temperature at 76.12 oC. In comparison, the CHF value for the nozzle
TG0.3 at flow rate 3ml/s has a CHF value increased by 6.66% and the surface temperature was
also increased by 4.17%. To ensure the repeatability of the results, the same heater was tested
and the results were plotted as shown in the Figure 21.
Figure 20: Heat transfer performance of HFO-1234yf with TG0.3 nozzle at flow rates of 2, 3ml/s
41

Figure 21: Repeatability of HFO-1234yf for nozzle TG0.3 at flow rate 2ml/s
Another experiment conducted with the nozzle TG0.5 for the flow rates of 2, 3, 4, 5ml/s
are plotted with respect to the heat flux vs surface superheat in the Figure 22. For the flow rate
of 2ml/s, the CHF value obtained was 140 W/cm2 with surface super heat of 76.38 oC. For the
same nozzle with the flow rate of 3ml/s the CHF value obtained was 160 W/cm2 with surface
temperature of 69.34oC. By the increasing the flow rate to 4ml/s the CHF value observed was
170W/cm2 with the surface temperature observed at 60.62oC. As we observed the maximum the
flow rate the maximum was the CHF observed, we increased the flow rate to 5ml/s and the CHF
observed was 180 W/cm2 with the surface superheat of 53.63oC. From the respective Figure it
was clearly indicated that greater the flow rate, the higher the value of CHF. Again to verify the
reproducibility of the system two tests with nozzle TG0.5 were performed with the flow rates 2,
3ml/s and their results were plotted in the Figure 23 and Figure 24.
42

Figure 22: Heat Transfer performance of HFO-1234yf with TG0.5 nozzle at flow rates 2, 3, 4ml/s
Figure 23: Repeatability of HFO-1234yf for TG0.5 nozzle at flow rate of 2ml/s.
43

Figure 24: Repeatability of HFO-1234yf for nozzle TG0.5 at flow rate of 3ml/s.
Figure 25, represents the spray cooling performance of the refrigerant HFO-1234yf for
the nozzle TG0.7 at the flow rate of 2, 3, 4ml/s. For the flow rate at 2ml/s the CHF value observed
was 145 W/cm2 with the surface superheat of 85.16oC. For the same nozzle with the flow rate of
3mml/s the CHF values are 150W/cm2 by having the surface temperatures at 63.92oC. We again
tested the same heater for the greater flow rate of 4ml/s and the maximum CHF value attained
was 160W/cm2 with the surface superheat of 61.32oC. since, we observed that the as increase in
the flow rate resulted in the higher heat flux, we tested the setup with the same nozzle by
increasing the flow rate to 5ml/s and the CHF values that were attained was 175W/cm2 by having
the surface temperatures at 58.16oC. Clearly at this point the nozzle TG0.7 performs better with
44

greater flow rate of 5ml/s. But when compared the same with the HFC-134a, the surface
temperatures are much higher and the CHF values are low at the given flow rate.
Figure 25: Heat Transfer performance of HFO-1234yf with TG00.7 nozzle at flow rates of 2, 3, and 4 ml/s
HFO-1234yf refrigerant values for different nozzles for the flow rate of 2ml/s was plotted
in the Figure 26. For the flow rate 2ml/s, the nozzle TG0.3 showed the CHF value at 152 W/cm2
at the surface temperature of 72.87oC. The CHF values that were observed for the TG0.5 nozzle
for the given flow rate was 140W/cm2 by maintaining the surface temperature at 76.38oC. The
same flow rate was used for the TG0.7 nozzle and the CHF values observed was 145W/cm2 at the
45

surface temperature of 85.16oC. When compared the three nozzles at the flow rate of 2ml/s, the
nozzle TG0.3 provided the better CHF and also with the low surface superheat values.
Figure 26: Heat transfer performance of HFO-1234yf for nozzle TG0.3, 0.5, and 0.7 at flow rate of 2ml/s.
A set experiments were conducted to evaluate the spray cooling performance of the three
different nozzle at the flow rate of 3ml/s was plotted with the related data in the Figure 27. The
CHF values that were obtained for the nozzle TG0.3 for the flow rate 3ml/s was 160W/cm2 and
with the surface temperature of 76.12oc. The CHF values observed for the nozzle TG0.5 at the
same flow rate was 160W/cm2 by maintaining the surface temperatures at 69.34oC. The nozzle
TG0.7 was also tested with the flow rate of 3ml/s and the resulted CHF was 150W/cm2 and the
46

surface temperatures observed was 63.92oC. For the 3ml/s, the nozzle TG0.5 provided better
results in the area of CHF and the low surface temperatures.
Figure 27: Heat transfer performance of HFO-1234yf for nozzle TG0.3, 0.5, and 0.7 at flow rate of 3ml/s.
The comparison for the flowrate of 4ml/s between the nozzle TG0.5 and TG0.7 are plotted
in the form of cooling curves in the Figure 28. The flow rate of 4 ml/s for the TG0.3 was eliminated
because of the high pumping power and the smaller orifice of the nozzle cannot accommodate
that much of the pressure difference. The nozzle TG0.5 for the flow rate of 4ml/s produced the
CHF value at 170W/cm2 with the surface temperature observed was 60.62oC. For the same flow
rate of 4ml/s, the nozzle TG0.7 with the bigger orifice showed the CHF value at 160W/cm2 with
the resulting surface temperature at 61.32oC. Though the TG0.7 has the bigger orifice it provided
47

less CHF and surface temperature values than the TG0.5 nozzle and also provided better
performance throughout the tests.
Figure 28: Heat transfer performance of HFO-1234yf for nozzle TG0.5 and 0.7 for flow rate of 4ml/s.
The heat transfer coefficient values for the HFO-1234yf for the flow rate 2, 3ml/s for the
nozzle TG0.3 are plotted in the Figure 29. The maximum HTC value for the nozzle TG0.3 with flow
rate of 2ml/s was 38.2 Kw/m2 0C at the heat flux value of 70 W/cm2. The HTC values for the flow
rate 3ml/s for the same nozzle provided the maximum value of 44.6 Kw/m2 0C at the heat flux
value of 70 W/cm2. From the comparison we can say that the nozzle TG0.3 with the flow rate of
3ml/s provided the better HTC values for the refrigerant HFO-1234yf. At the CHF, the HTC value
observed for the TG0.3 nozzle for the flow rate of 2ml/s was 20.9 Kw/m2 0C and for the flow rate
of 3ml/s for the same nozzle at CHF the HTC observed was 21 Kw/m2 0C.
48

Figure 29: HTC of HFO-1234yf with nozzle TG0.3 at flow rates of 2, 3ml/s.
The nozzle TG0.5 was tested with four different flow rates such as 2, 3, 4, 5ml/s and the
resulted data was plotted in the Figure 30. The maximum HTC value attained for the flow rate
2ml/s for the nozzle TG0.5 was 35.2 Kw/m2 0C at the CHF of 60W/cm2. For the flow rate of 3ml/s
the same TG0.5 nozzle produced the maximum HTC of 39.6 Kw/m2 0C at the CHF value of 70
W/cm2. The maxim HTC observed for the flow rate of 4ml/s was 49.8 Kw/m2 0C at the CHF value
of 90 W/cm2. Again, an experiment with the higher flow rate of 5ml/s for the TG0.5 nozzle
attained the maximum HTC value of 59.23 Kw/m2 0C at 80 W/cm2. From the overall comparison,
the nozzle TG0.5 performed well and the flow rate of 5ml/s attained the highest value of HTC.
49

Figure 30: HTC of HFO-1234yf with nozzle TG0.5 at flow rates of 2, 3, and 4ml/s.
The nozzle TG0.7 also produces better HTC results when tested with different flow rates
such as 2, 3, 4, 5ml/s. The results were showed in the Figure 31. The maximum HTC for the nozzle
TG0.7 with flow rate 2ml/s was observed at 60 W/cm2 having 36.5 Kw/m2 0C. For the different
flow rate of 3ml/s, the maximum value observed was 43.5 Kw/m2 0C at the CHF value of 70
W/cm2. By increasing the flow rate to 4ml/s the resultant maximum value of HTC observed was
52.1 Kw/m2 0C at 90 W/cm2. When the nozzle was tested with the better flow rate of 5ml/s the
value of HTC maximum observed was 60.88 Kw/m2 0C at the heat flux of 80 W/cm2. From the
detailed plot shown in the below Figure we can say that the greater the flow rate, the maximum
was the HTC value can attained. For the nozzle TG0.7, the flow rate of 5ml/s helped in attaining
the greater HTC values and also increase in the CHF value.
50

Figure 31: HTC of HFO-1234yf with nozzle TG0.7 at flow rates of 2, 3, and 4ml/s.
Figure 32: CHF values as a function of liquid flow rate of HFO-1234yf for nozzle type TG0.3, 0.5 and 0.7.
51

HFO-1234yf refrigerant was tested with three different type of nozzles such as TG0.3, 05
and 0.7 with respect to the different flow rates such as 2, 3, 4, 5ml/s and the resulted CHF values
are plotted as shown in the Figure 32. The values were plotted with the resultant CHF values as
a function of flow rate.
4.2 Comparison between the HFC-134 and HFO-1234yf
Figure 33: HTC of HFC-134a and HFO-1234yf with nozzles TG0.3, 0.5, and 0.7 at flow rates of 3ml /s.
Figure 33, presents HTC values as a function of heat flux from both refrigerants
considering the best performed test conditions for each nozzle type such as TG0.3, TG0.5, and
52

TG0.7 at various flow rates such as 2, 3, 4, 5ml/s. As a common trend, HTC values peak at mid-
heat-flux range as two-phase heat transfer mechanisms become more pronounced, and then
deteriorate at high-heat-flux range towards CHF. For R134a, HTC reaches ~140 Kw/m2oC at 100
W/cm2 heat flux. For HFO-1234yf, HTC values are much lower, with a maximum of ~60,000
W/m2oC at 80 W/cm2 heat-flux.
Figure 34: CHF value as a function of liquid flow rate for nozzle types of TG0.3, 0.5, and 0.7 for HFC-134a and HFO-1234yf.
Effect of flow rate on CHF levels, for all three nozzle types, is summarized in Figure 34.
The data clearly indicate that higher flow rate helps obtaining a higher CHF value, and TG0.3 and
TG0.5 nozzles perform comparably throughout. Such CHF improvement (up to 18% for TG0.5)
comes at the expense of higher pumping power.
53

We also look into the efficiency of the spray cooling process by considering different
parameters. The efficiency of the spray heat transfer is defined as the ratio of the heat
transferred by the spray from the surface to the total heat that could be potentially carried by
the liquid at the given flow rate and the subcooling level if the liquid fully evaporates. The
experimental spray heat transfer efficiency (η) is calculated using the following equation [43].
η = qCHF
" A
Qρf(Cp ∆Tsub + hfg)
Figure 35: Efficiency of spray heat transfer for HFC-134a and HFO-1234yf.
For HFC-134a, the efficiency ranges from 44.74% to 24.45% for different nozzle types and
at different flow rates. Whereas HFO-1234yf efficiency ranges from 38.53% to 18.25%. Figure 35,
54

provides the data of efficiencies for both HFC-134a and HFO-1234yf for the given flow rate and
nozzle type. It is evident that the efficiency of the HFO-1234yf is comparatively low when
compared to HFC-134a and this is mainly because of the less heat removal capacity.
55
CHAPTER V
Conclusion and Recommendations
5.1 Concluding Remarks
This study investigated the spray cooling characteristics of R-134a and HFO-1234yf
refrigerants and provided experimental data on their initial performance comparison. Three
types of pressure-atomized spray nozzles (TG0.3, TG0.5, TG0.7) were used at varying liquid flow
rates (2, 3, 4 cc/s), and a plain, smooth spray surface represented as a reference case. Based on
the results, the following main conclusions can be drawn:
Within the considered flow rate range, higher flow rates resulted in higher HTC
and CHF values.
TG0.5 nozzle, with a medium orifice size (0.61 mm) performed the best.
HFC-134a consistently provided better spray cooling performance compared to
HFO-1234yf. HTC values were as high as ~100,000 and ~68,000 W/m2oC for HFC-
134a and HFO-1234yf, respectively. CHF values were up to 255 and 175 W/cm2 for
HFC-134a and HFO-1234yf, respectively. This significant difference in heat transfer
performance is believed to be mainly driven by the thermophysical properties that
affect both the spray characteristics and heat acquisition ability.
56

5.2 Recommendations for Future Research
The following topics can be recommended as future research directions that will compliment
and expand the current study:
Evaluation of the spray cooling performance of HFC-134a and HFO-1234yf at
elevated saturation temperatures that would simulate realistic hot environment
conditions.
Utilizing available correlations to determine the critical spray parameters and
CHF levels, and developing modified correlations to better predict performance
of spray cooling with HFC and HFO type refrigerants.
Investigation of spray cooling performance of HFC-134a and HFO-1234yf with
the enhanced micro-scale heat transfer surfaces to improve HTC and CHF.
57

REFERENCES
[1] Desikan. B., Hassani. V.; “Spray cooling: An assessment for use with automotive power
electronics applications”, National Renewable Energy laboratory, prepared for power electronic
task FY05-7000.
[2] Toda, S., “A study of mist cooling, 1st report: investigation of mist cooling”, Heat Transfer,
Japanese Research, Vol. 1, pp. 39–50, 1972.
[3] Monde, M., “Critical heat flux in saturated forced convection boiling with an impinging
droplet”, Trans. JSME, Vol. 46, pp. 1146–1155, 1980.
[4] Mudawar, I., Valentine, W.S., “Determination of the local quench curve for spray cooled
metallic surfaces”, J. Heat Treating, Vol. 7, pp. 107–121, 1989.
[5] Pautsch, A.G., “Heat transfer and film thickness characteristics of spray cooling with phase
change”, Master’s Thesis, Dept. of Mechanical Engineering, University of Wisconsin-Madison,
2004.
[6] Mudawar, I. and Estes, K.A., “Optimizing and predicting CHF in spray Cooling of a square
Surface”, J. Heat Transfer, Vol. 118, no. 3, pp. 672–679, 1996.
[7] Chen, R-H., Chow, L.C., Navedo, J.E., “Effects of spray characteristics on critical heat flux in
subcooled water spray cooling”, Int. J. Heat and Mass Transfer, Vol. 45, pp. 4033–4043, 2002.
[8] Toda, S., “A study of mist cooling, 1st report: investigation of mist cooling”, Heat Transfer,
Japanese Research, Vol. 1, pp. 39–50, 1972.
58

[9] Pais, M.R., Chow, L.C., Mahefkey, E.T., “Surface roughness and its effect on the heat transfer
mechanism in spray cooling”, J. Heat Transfer, Vol. 114, pp. 211–219, 1992.
[10] Sehmbey, M. S., Chow, L. C., Hahn, O. J., M. R. Pais, “Spray cooling of power electronics at
cryogenic temperatures”, AIAA Journal of Thermophysics Heat Transfer, Vol. 9, pp. 123-128,
1995.
[11] Bostanci, H., “High heat flux spray cooling with ammonia on enhanced surfaces”, PhD Thesis,
Dept. of Mechanical Engineering, University of Central Florida, 2010.
[12] Peterson, C.O., “An experimental study of the dynamic behavior and heat transfer
characteristic of water impinging upon a heated surface”, Int. J. Heat Mass Transfer, Vol. 13, pp.
369-381, 1970.
[13] Bonacina, C., Del Giudice, S., Comini, G., “Dropwise evaporation”, ASME Journal of Heat
Transfer, Vol. 101, pp. 441-446, 1979.
[14] Bonacina, C., Comini, G., Del Giudice, S., “Evaporation of atomized liquids on hot surfaces”,
Letters in Heat and Mass Transfer, Vol. 2(5), pp. 401-406, 1975.
[15] Kim, Y.C., Nishio, S., Ohkubo, H., “Heat transfer in a high temperature region of spray cooling
interacting with liquid film flow”, Heat Transfer, Japanese Research, Vol. 26 (4), 1997.
[16] Yang, J., Chow, L.C., Pais, M.R., “Nucleate boiling heat transfer in spray cooling”, J. Heat
Transfer, Vol. 118 , pp. 668– 671, 1996.
[17] Mudawar, I. and Estes, K.A., “Optimizing and predicting CHF in spray Cooling of a square
Surface”, J. Heat Transfer, Vol. 118, no. 3, pp. 672–679, 1996.
59

[18] Pautsch, A.G., Shedd, T.A., “Adiabatic and diabatic measurements of the liquid film thickness
during spray cooling with FC-72”, Int. J. Heat Mass Transfer, Vol. 49, pp. 2610–2618, 2006.
[19] Pais, M.R., Chow, L.C., Mahefkey, E.T., “Surface roughness and its effect on the heat transfer
mechanism in spray cooling”, J. Heat Transfer, Vol. 114, pp. 211–219, 1992.
[20] Kim, J., “Spray cooling heat transfer: the state of the art”, Int. J. Heat and Fluid Flow, Volume
28(4), pp. 753-767, 2007.
[21] Pautsch, A.G., Shedd, T.A., “Adiabatic and diabatic measurements of the liquid film thickness
during spray cooling with FC-72”, Int. J. Heat Mass Transfer, Vol. 49, pp. 2610–2618, 2006.
[22] Pautsch, A.G., Shedd, T.A., “Spray impingement cooling with single- and multiple nozzle
arrays, Part I: Heat transfer data using FC-72”, Int. J. Heat Mass Transfer, Vol. 48, 3167-3175,
2005.
[23] Kalantari, D., “Characterization of liquid spray impact onto walls and films”, PhD Thesis,
Technischen Universitat Darmstadt, Darmstadt, Germany, 2007.
[24] Yang, J., Chow, L.C., Pais, M.R., “Nucleate boiling heat transfer in spray cooling”, J. Heat
Transfer, Vol. 118 , pp. 668– 671, 1996.
[25] Rini, D.P., Chen, R.H., Chow, L.C., “Bubble behavior and nucleate boiling heat transfer in
saturated FC-72 spray cooling”, J. Heat Transfer, Vol. 124, pp. 63–72, 2002.
[26] Oliphant, K., Webb, B.W., McQuay, M.Q., “An experimental comparison of liquid jet array
and spray impingement cooling in the non-boiling regime”, Experimental Thermal and Fluid
Science, Vol. 18, pp. 1-10, 1998.
60

[27] Rybicki, J. R., Mudawar, I., “Single-phase and two-phase cooling characteristics of upward-
facing and downward-facing sprays”, Int. J. Heat Mass Transfer, Vol. 49, pp. 5–16, 2006.
[28] Karwa, N., Kale, S.R., Subbarao, P.M.V., “Experimental study of non-boiling heat transfer
from a horizontal surface by water sprays”, Experimental Thermal and Fluid Science, Vol. 32, pp.
571–579, 2007.
[29] Lin, L., Ponnappan, R., “Heat transfer characteristics of spray cooling in a closed loop”, Int. J.
Heat Mass Transfer, Vol. 46, pp. 3737–3746, 2003.
[30] Cheng, W., Liu, Q., Zhao, R., Fan, H., “Experimental investigation of parameters effect on
heat transfer of spray cooling”, Journal of Heat Mass Transfer, Vol. 46, pp. 911–921, 2010.
[31] Hsieh, S-S., Fan, T-C., Tsai, H-H., “Spray cooling characteristics of water and R-134a., Part I,
nucleate boiling”, Int. J. Heat Mass Transfer, Vol. 47, pp. 5703-5712, 2004.
[32] Campbell, J.B., Tolbert, L.M., Ayers, C.W., Ozpineci, B., Lowe, K.T., “Two-phase Cooling
Method using the R134a refrigerant to cool Power Electronic Devices,” IEEE Transaction on
Components and Packaging Technologies, vol.43 (3), pp. 648-656, 2007.
[33] Ayers, C. W, Hsu. J. S. “Fundamentals of Floating Loop Concept Based on R134a Refrigerant
Cooling of High Heat Flux Electronics,” Oakridge National Laboratory, 22nd IEEE Semi-Thermal
Symposium, 2006.
[34] Mudawar. I., Desikan B., Kenneth K., and Sreekanth N., “Two Phase Spray Cooling of Hybrid
Vehicle Electronics.” IEEE Transactions and Packaging Technologies, vol 32, No 2, pp.501-511,
2009.
61

[35] Mudawar, I. and Estes, K.A., “Optimizing and predicting CHF in spray Cooling of a square
Surface”, J. Heat Transfer, Vol. 118, no. 3, pp. 672–679, 1996.
[36] Bostanci H., David van Ee, Benjamin a. Saarloos, Daniel P. Rini, and Louis C. Chow. “Thermal
Management of Power Inverter Modules at High Fluxes via Two Phase Spray Cooling,” IEEE
Transactions, Packaging and Manufacturing Technology, vol.2, no.9, pp.2156-3950, 2012.
[37] Augusto G. U., Jader R.B., “Experimental Evaluation of Spray Cooling of R134a on Plain and
Enhanced Surfaces,” International Journal of Refrigeration 36, pp.527-533, 2013.
[38] Ayers, C. W, Hsu. J. S. “Fundamentals of Floating Loop Concept Based on R134a Refrigerant
Cooling of High Heat Flux Electronics,” Oakridge National Laboratory, 22nd IEEE Semi-Thermal
Symposium, 2006.
[39] Augusto G. U., Jader R.B., “Experimental Evaluation of Spray Cooling of R134a on Plain and
Enhanced Surfaces,” International Journal of Refrigeration, Vol. 36, pp. 527-533, 2013.
[40] R. H Chen. L.C. Chow and J. E. Navedo, “ Effects of spray characteristics on Critical Heat Flux
in subcooled water spray Cooling”, Int. J. Heat Mass Transfer, Vol.38, PP. 1201 - 1216, 1995.
[41] Moreno G., Narumanchi S., and King C., “Pool Boiling Heat Transfer Characteristics of HFO-
1234yf on Plain and Microporous-Enhanced Surfaces,” ASME Journal of Heat Transfer, vol. 135
(11), pp. 111014- 1 to 111014-10, 2013.
[42] Del Col D., Torresin D., and Cavallini A., “Heat transfer and pressure drop during
condensation of the low GWP Refrigerant R1234yf,” International Journal of Refrigeration, vol.
33, pp. 1307-1318, 2010.
62

[43] Suraj J. T., Sreekant N., Yang R., “Effect of flow rate and subcooling on spray heat transfer
on microporous copper surfaces”, Int. J. Heat Mass Transfer, Vol 69, pp. 493 – 505, 2014.
63