SPP Priority Projects Phase II Reliability...
16
SPP Priority Projects Phase II Reliability Report PUBLISHED: 12/04/2009 LATEST REVISION: 1/5/2010 Copyright © 2009 by Southwest Power Pool, Inc. All rights reserved.
Transcript of SPP Priority Projects Phase II Reliability...

SPP Priority Projects Phase II
Reliability Report
PUBLISHED: 12/04/2009 LATEST REVISION: 1/5/2010
Copyright © 2009 by Southwest Power Pool, Inc. All rights reserved.

SPP Priority Projects Phase II Report
1
Table of Contents
Reliability Analysis ................................................................................................................................................ 2
Study Scope ........................................................................................................................................................ 4 Stakeholder Process ........................................................................................................................................... 4 Primary Analysis ................................................................................................................................................. 5 Results and Conclusions .................................................................................................................................... 8
FCITC Analysis .................................................................................................................................................... 10
Reactive Requirements ....................................................................................................................................... 12
Study Scope ...................................................................................................................................................... 12 Key Study Assumptions .................................................................................................................................... 13 Results and Conclusions .................................................................................................................................. 14
Revision History
Version Date Description 1 12/04/09 Document Creation; Submitted to TWG
2 12/21/09 Added Reactive Requirements and revised STEP date of Huntsville – St. John 115kV line
3 1/5/10 Revised based on TWG comments

SPP Priority Projects Phase II Report
2
Reliability Analysis
In the Phase I evaluation, eleven potential Priority Projects and three additional Priority Projects groupings were evaluated for impacts on the reliability plan on the SPP system. As part of Phase II evaluation, the list of Priority Projects was refined to two groups of projects that are electrically similar. SPP conducted a study to evaluate the impact of the Priority Projects on the reliability plan of the SPP transmission system. The following section summarizes the findings of this study. An analysis was conducted on two groups of proposed projects to determine the impact of these projects on the SPP reliability plan and on first tier third parties to SPP. This analysis was conducted in the same manner and with the same methodologies used in SPP’s 2009 STEP 10 year reliability analysis. This study is not intended to justify any Priority Project based on deferred project cost alone; it is only intended to show the effects of the Priority Projects on the SPP reliability plan. At this time the in-service dates for the Priority Projects are not definite. For this study the projects are included in the 2014 models. If a project identified for deferment has a STEP date before 2014 it may or may not actually be deferred. It may be possible to mitigate these issues for the short period of time before the Priority Project is in service. Therefore, these projects and their costs are provided for assessment purposes only. The two groups of proposed projects are composed of the following projects: Group 1: 1. Spearville – Comanche – Medicine Lodge – Wichita 765 kV Operated at 345 kV 2. Comanche – Woodward District EHV 765 kV Operated at 345 kV 3. Hitchland – Woodward District EHV Double Circuit 345 kV 4. Valliant – NW Texarkana 345 kV 5. Cooper – Maryville – Sibley 345 kV 6. Riverside Station – Tulsa Power Station 138 kV Reactor Group 2: 1. Spearville – Comanche – Medicine Lodge – Wichita Double Circuit 345 kV 2. Comanche – Woodward District EHV Double Circuit 345 kV 3. Hitchland – Woodward District EHV Double Circuit 345 kV 4. Valliant – NW Texarkana 345 kV 5. Cooper – Maryville – Sibley 345 kV 6. Riverside Station – Tulsa Power Station 138 kV Reactor

SPP Priority Projects Phase II Report
3
Group 1 Map
Group 2 Map
SPP Priority Projects Phase II Report
4
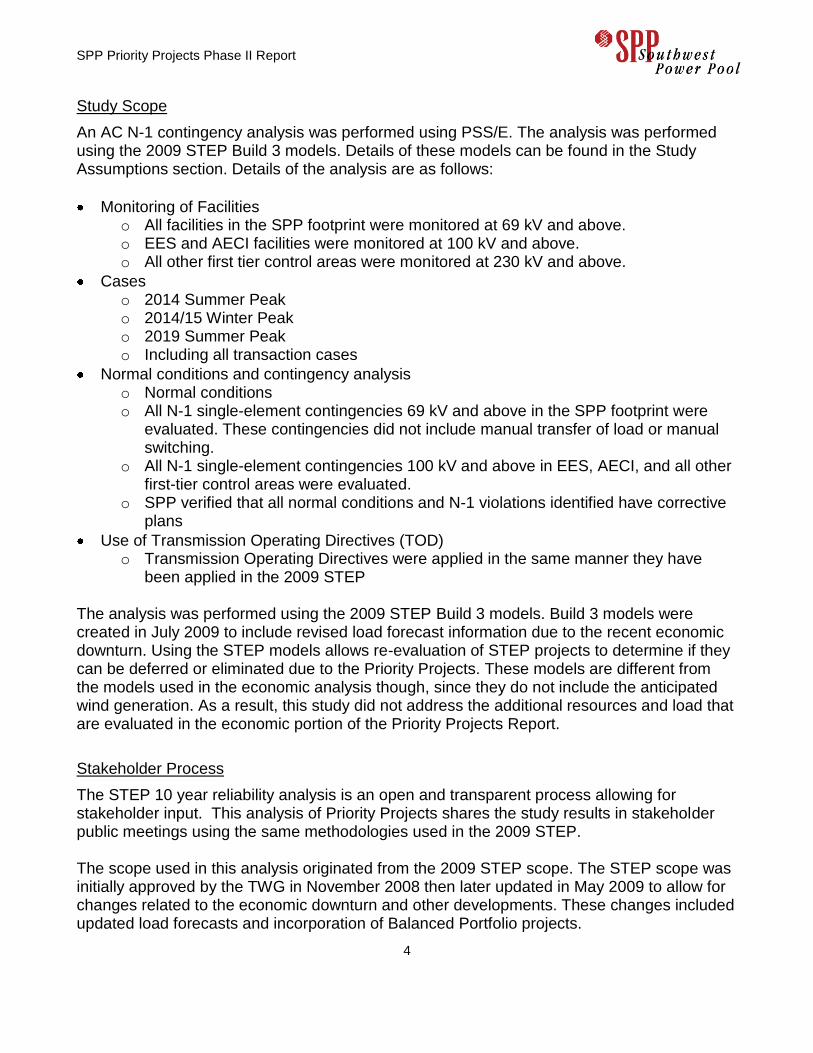
Study Scope
An AC N-1 contingency analysis was performed using PSS/E. The analysis was performed using the 2009 STEP Build 3 models. Details of these models can be found in the Study Assumptions section. Details of the analysis are as follows:
Monitoring of Facilities o All facilities in the SPP footprint were monitored at 69 kV and above. o EES and AECI facilities were monitored at 100 kV and above. o All other first tier control areas were monitored at 230 kV and above.
Cases o 2014 Summer Peak o 2014/15 Winter Peak o 2019 Summer Peak o Including all transaction cases
Normal conditions and contingency analysis o Normal conditions o All N-1 single-element contingencies 69 kV and above in the SPP footprint were
evaluated. These contingencies did not include manual transfer of load or manual switching.
o All N-1 single-element contingencies 100 kV and above in EES, AECI, and all other first-tier control areas were evaluated.
o SPP verified that all normal conditions and N-1 violations identified have corrective plans
Use of Transmission Operating Directives (TOD) o Transmission Operating Directives were applied in the same manner they have
been applied in the 2009 STEP The analysis was performed using the 2009 STEP Build 3 models. Build 3 models were created in July 2009 to include revised load forecast information due to the recent economic downturn. Using the STEP models allows re-evaluation of STEP projects to determine if they can be deferred or eliminated due to the Priority Projects. These models are different from the models used in the economic analysis though, since they do not include the anticipated wind generation. As a result, this study did not address the additional resources and load that are evaluated in the economic portion of the Priority Projects Report.
Stakeholder Process
The STEP 10 year reliability analysis is an open and transparent process allowing for stakeholder input. This analysis of Priority Projects shares the study results in stakeholder public meetings using the same methodologies used in the 2009 STEP. The scope used in this analysis originated from the 2009 STEP scope. The STEP scope was initially approved by the TWG in November 2008 then later updated in May 2009 to allow for changes related to the economic downturn and other developments. These changes included updated load forecasts and incorporation of Balanced Portfolio projects.

SPP Priority Projects Phase II Report
5
The contingency analysis results for the Priority Projects are evaluated using input provided by stakeholders for the 2009 STEP. This allows projects to be evaluated in the same manner as the STEP. Projects are deferred based on the same justification as their original need. Similarly, mitigations are handled in the same manner as the STEP.
Primary Analysis
The analysis was conducted for two groups of Priority Projects. The Priority Project groups can either cause new reliability issues or they can relieve issues that have been identified in either the 2009 or earlier STEP analyses. Therefore, the results are in terms of additions or deferments of reliability projects and the revenue requirements associated with those projects. Results are broken into (1) advanced projects—projects that would be moved up in the reliability timeline due to the Priority Project; (2) new SPP projects—projects which are now needed that were not identified in the original 10 year reliability planning horizon, but may have been needed beyond that horizon; (3) new third party projects—projects needed on neighboring systems due to the Priority Projects; and (4) deferred projects—projects which are either deferred beyond the planning horizon or mitigated entirely due to the Priority Projects. For projects which are deferred past the planning horizon, linear extrapolation of loading was used to estimate how far the project might be deferred. Then, for projects which are not either completely new or completely deferred, the value shown is the Net Present Value of Annual Transmission Revenue Requirements. This Net Present Value is limited to a 40 year project life. The following tables and maps illustrate the reliability projects changed by the Priority Project groups. New or advanced projects are shown in red while deferred projects are shown in green.

SPP Priority Projects Phase II Report
6
Impact on Reliability Plan Red = New or Advanced
Green = Deferred
Project Name Area E&C Cost
Date
Needed
STEP
Date
Advanced
ATRR Cost
New SPP
ATRR Cost
New Third
Party ATRR
Cost
Deferred ATRR
Cost
ADD SECOND HITCHLAND 345/230KV TRANSFORMER SPS $6,993,438 19SP None $13,954,681
REPLACE MEDICINE LODGE 138/115KV TRANSFORMER CKT 1 MKEC $3,825,000 14SP 19SP $2,613,216ADD SECOND OVERTON 345/161kV TRANSFORMER* AMMO $6,750,000 19SP None $11,624,617
RECONDUCTOR ELDORADO - ELDORADO JCT 69KV CKT 1 WFEC $3,881,250 23SP 16SP $1,839,437
REPLACE WAVETRAP ON HARPER - MILAN TAP 138KV CKT 1 MKEC $225,000 None 19SP $365,103
REBUILD ASHDOWN WEST - CRAIG JUNCTION 138KV CKT 1** AEPW $1,378,125 None 14SP
RECONDUCTOR EL RENO - EL RENO SW 69KV CKT 1** WFEC $1,950,000 17SP 12SP
REBUILD HUNTSVILLE - HUTCHINSON ENERGY CENTER 115KV CKT 1** WR/MIDW $12,487,500 None 13SP
REBUILD HUNTSVILLE - ST_JOHN 115KV CKT 1** MIDW $7,965,000 None 14SP
REBUILD ST JOHN - PRATT 115KV CKT 1** MKEC $9,239,000 None 13SP
$2,613,216 $13,954,681 $11,624,617 $2,204,540
-$25,987,975
*Loading of the Overton transformer only increases from 99.8% to 100.6% when adding the upgrade
**Costs for this project are not included because the project may be needed before Priority Projects are in service
Group 1Hitchland – Woodward District EHV Double 345 kV
Spearville – Comanche – Medicine Lodge – Wichita 765 kV Operated at 345 kV
Comanche – Woodward District EHV 765 kV Operated at 345 kV
Cooper – Maryville – Sibley 345 kV
Valliant – NW Texarkana 345 kV
Riverside Station – Tulsa Power Station 138 kV (Add Reactor)
Totals
Net

SPP Priority Projects Phase II Report
7
Project Name Area E&C Cost
Date
Needed
STEP
Date
Advanced
ATRR Cost
New SPP
ATRR Cost
New Third
Party ATRR
Cost
Deferred ATRR
Cost
ADD SECOND HITCHLAND 345/230KV TRANSFORMER SPS $6,993,438 19SP None $13,954,681
REPLACE MEDICINE LODGE 138/115KV TRANSFORMER CKT 1 MKEC $3,825,000 14SP 19SP $2,613,216ADD SECOND OVERTON 345/161kV TRANSFORMER* AMMO $6,750,000 19SP None $11,624,617
RECONDUCTOR ELDORADO - ELDORADO JCT 69KV CKT 1 WFEC $3,881,250 23SP 16SP $1,839,437
REPLACE WAVETRAP ON HARPER - MILAN TAP 138KV CKT 1 MKEC $225,000 None 19SP $365,103
REBUILD ASHDOWN WEST - CRAIG JUNCTION 138KV CKT 1** AEPW $1,378,125 None 14SP
RECONDUCTOR EL RENO - EL RENO SW 69KV CKT 1** WFEC $1,950,000 17SP 12SP
REBUILD HUNTSVILLE - HUTCHINSON ENERGY CENTER 115KV CKT 1** WR/MIDW $12,487,500 None 13SP
REBUILD HUNTSVILLE - ST_JOHN 115KV CKT 1** MIDW $7,965,000 None 14SP
REBUILD ST JOHN - PRATT 115KV CKT 1** MKEC $9,239,000 None 13SP
$2,613,216 $13,954,681 $11,624,617 $2,204,540
-$25,987,975
*Loading of the Overton transformer only increases from 99.8% to 100.6% when adding the upgrade
**Costs for this project are not included because the project may be needed before Priority Projects are in service
Group 2Hitchland – Woodward District EHV Double 345 kV
Spearville – Comanche – Medicine Lodge – Wichita Double 345 kV
Comanche – Woodward District EHV Double 345 kV
Cooper – Maryville – Sibley 345 kV
Valliant – NW Texarkana 345 kV
Riverside Station – Tulsa Power Station 138 kV (Add Reactor)
Totals
Net
SPP Priority Projects Phase II Report
8
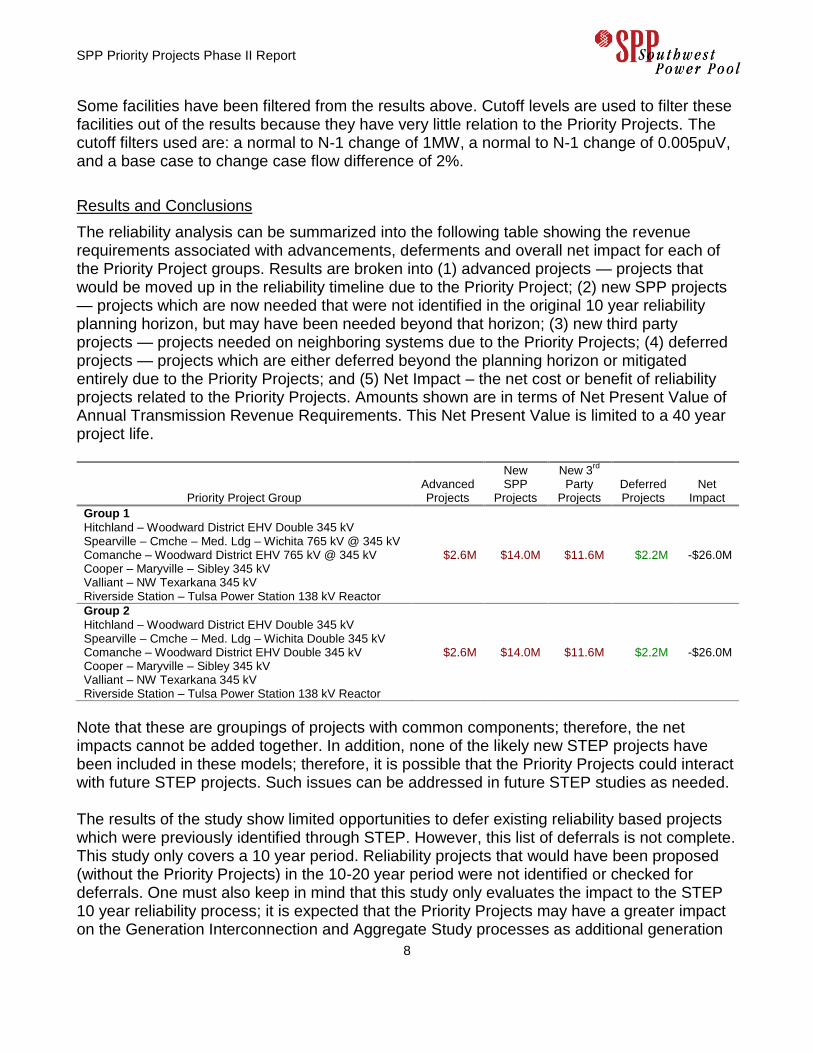
Some facilities have been filtered from the results above. Cutoff levels are used to filter these facilities out of the results because they have very little relation to the Priority Projects. The cutoff filters used are: a normal to N-1 change of 1MW, a normal to N-1 change of 0.005puV, and a base case to change case flow difference of 2%.
Results and Conclusions
The reliability analysis can be summarized into the following table showing the revenue requirements associated with advancements, deferments and overall net impact for each of the Priority Project groups. Results are broken into (1) advanced projects — projects that would be moved up in the reliability timeline due to the Priority Project; (2) new SPP projects — projects which are now needed that were not identified in the original 10 year reliability planning horizon, but may have been needed beyond that horizon; (3) new third party projects — projects needed on neighboring systems due to the Priority Projects; (4) deferred projects — projects which are either deferred beyond the planning horizon or mitigated entirely due to the Priority Projects; and (5) Net Impact – the net cost or benefit of reliability projects related to the Priority Projects. Amounts shown are in terms of Net Present Value of Annual Transmission Revenue Requirements. This Net Present Value is limited to a 40 year project life.
Priority Project Group Advanced Projects
New SPP
Projects
New 3rd
Party
Projects Deferred Projects
Net Impact
Group 1 Hitchland – Woodward District EHV Double 345 kV Spearville – Cmche – Med. Ldg – Wichita 765 kV @ 345 kV Comanche – Woodward District EHV 765 kV @ 345 kV Cooper – Maryville – Sibley 345 kV Valliant – NW Texarkana 345 kV Riverside Station – Tulsa Power Station 138 kV Reactor
$2.6M $14.0M $11.6M $2.2M -$26.0M
Group 2
Hitchland – Woodward District EHV Double 345 kV Spearville – Cmche – Med. Ldg – Wichita Double 345 kV Comanche – Woodward District EHV Double 345 kV Cooper – Maryville – Sibley 345 kV Valliant – NW Texarkana 345 kV Riverside Station – Tulsa Power Station 138 kV Reactor
$2.6M $14.0M $11.6M $2.2M -$26.0M
Note that these are groupings of projects with common components; therefore, the net impacts cannot be added together. In addition, none of the likely new STEP projects have been included in these models; therefore, it is possible that the Priority Projects could interact with future STEP projects. Such issues can be addressed in future STEP studies as needed. The results of the study show limited opportunities to defer existing reliability based projects which were previously identified through STEP. However, this list of deferrals is not complete. This study only covers a 10 year period. Reliability projects that would have been proposed (without the Priority Projects) in the 10-20 year period were not identified or checked for deferrals. One must also keep in mind that this study only evaluates the impact to the STEP 10 year reliability process; it is expected that the Priority Projects may have a greater impact on the Generation Interconnection and Aggregate Study processes as additional generation

SPP Priority Projects Phase II Report
9
resources and transmission service are added to the system. Ultimately, the intent of this study is not to justify any Priority Project based on deferred project cost alone; it is only intended to show the effects of the Priority Projects on the SPP reliability plan and to incorporate known costs or benefits into the overall Priority Project costs.

SPP Priority Projects Phase II Report
10
FCITC Analysis
As part of Phase II evaluation of Priority Projects, SPP conducted an FCITC analysis to determine impacts of the Priority Projects on the SPP transmission system. Using a DC transfer analysis, FCITC values were first calculated on each base SPP model without the Priority Projects then calculated on upgraded models containing Priority Project Group 1 upgrades then calculated on a third set of models containing Priority Project Group 2 upgrades. The models used were:
2014 Summer, Scenario 0 2014 Winter, Scenario 0 2019 Summer, Scenario 0
The cases include approved expansion plan upgrades from the 2008 STEP and Balanced Portfolio. Below are the MUST settings and procedures for the FCITC analysis: MUST Solution Settings
CONSTRAINTS/CONTINGENCY INPUT OPTIONS o AC Mismatch Tolerance – 2 MW o Base Case Rating – Rate A o Base Case % of Rating – 100% o Contingency Case Rating – Rate B o Contingency Case % of Rating – 100% o Base Case Load Flow – PSS/E o Convert branch ratings to estimated MW ratings – No o Contingency ID Reporting – Labels + Events o Maximum number of contingencies to process – 50000
MUST CALCULATION OPTIONS o Phase Shifters Model for DC Linear Analysis – Constant Flow for Base Case and
Contingencies o Report Base Case Violations with FCITC – Yes o Maximum number of violations to report in FCITC table – 50000 o Distribution Factor (OTDF and PTDF) Cutoff – 0.03 o Maximum times to report the same elements – 1 {eliminate voluminous repeats} o Apply Distribution Factor to Contingency Analysis – Yes o Apply Distribution Factor to FCITC Reports – Yes o Minimum Contingency Case flow change – 1 MW o Minimum Contingency Case Distribution Factor change – 0.0 o Minimum Distribution Factor for Transfer Sensitivity Analysis – 0.0
Voltage Monitoring MUST does not do voltage monitoring for transfer analysis. All transfers are done using DC
load flow and then AC verified.
Contingency Outage of all single branches and ties in the SPP (Area 502-546, 640-650) and NON-SPP
(EES,AECI) above 100 kV

SPP Priority Projects Phase II Report
11
Multi-terminal/Special Contingency Outage
Exclude Exclude outage of all invalid single outages
Operating guides implementation
Monitor Monitor branches and ties in SPP above 100 kV
Transfer Directions/Transfer Level 600 MW transfer from all PORs to PODs (PORs/PODs consist of all zones in SPP’s OASIS,
excluding IPPs)
The Excel document embedded below summarizes the findings of this study. There were a few instances when the addition of the Priority Projects caused the FCITC values to change from positive to negative; this is denoted by a ―True‖ statement in the first column of each workbook. However, the FCITC results found in this study may not be the same as the Available Transfer Capability on the SPP system. All of the positive to negative changes in FCITC occur on facilities that were overloaded prior to the upgrades.
Priority Projects FCITC_20091201.xls

SPP Priority Projects Phase II Report
12
Reactive Requirements
The consideration of long distance EHV transmission upgrades (i.e. > 50 miles) may require additional reactive compensation to maintain voltage during normal operating conditions and reduce voltage rise during line switching. During light load conditions the high voltage issue may exacerbate as there are less transmission line inductive power losses to offset capacitive line charging. The additional line charging increases voltage on the Bulk Electric System. In order to address this issue, shunt line reactors are typically used to counter or off set excessive line charging during light load conditions. This high level screening study provides a calculated value for line shunt reactors required to support the addition of EHV transmission in Priority Project groups 1 and 2 under normal (no outage) and selected single contingency events. The study method determines Reactive power (Q) requirements for different line voltages (V) to determine the magnitude of reactive compensation to maintain system voltages within acceptable limits. This analysis technique is commonly called ―QV Analysis‖. A QV, reactive compensation verses voltage analysis was conducted on each proposed grouping of Priority Projects to determine the impact of these projects on the SPP interconnection points and the amount of shunt compensation each segment of the project would require to maintain acceptable transmission voltages.
Study Scope
The study base case representing 2014 light load condition was prepared using PSS/E. The steps to build each model are in Table 1. Table 1: Model building steps
1. Add Balanced Portfolio Projects to the base case 2. Add Priority Project group 3. Add line breakers as needed 4. Solve model

SPP Priority Projects Phase II Report
13
PowerWorld Corporation Simulator was used to perform an AC QV analysis. The total amount of line reactance to keep the system voltages around 1.01 p.u.1 was determined for each project group line segment. The base case was analyzed. Each line segment of a project was also tested for voltage rise at the open end while the other end remained closed into the network.
Key Study Assumptions
1. This study does not include the effects of subsynchronous resonance (SSR). SSR is an electric power system condition where the electric network exchanges energy with a turbine generator at one or more of the natural frequencies of the combined system below the synchronous frequency of the system2.
2. A light load condition is the worst case scenario for high voltage. 3. The July 2009 created STEP 2010 Spring Peak model was used as a starting point
and modified to represent a 2014 light load case. 4. Balanced Portfolio Projects are added to the base case. 5. Priority Project groups 1 and 2 are analyzed to determine the amount of line shunts
per line segment. 6. Line reactors are sized by opening one end of line segment to determine reactive
support to keep line end voltage around 1.01 p.u. 7. Actual line reactors may be a combination of smaller units or Flexible AC Transmission
System (FACTS) devices to cover multiple system load conditions and operating points.
1 EHV lines (>300 kV) are typically operated between 0.98 and 1.04 p.u. For the study purpose, an average 1.01
pu operating voltage was chosen. 2 Subsynchronous Resonance in Power Systems, Paul M. Anderson, B. L. Agrawal, J. e. Van Ness, IEEE
Press, 1990

SPP Priority Projects Phase II Report
14
8. The study has not included additional shunts required to maintain safe voltage levels on locations other than the priority project group line segments.
9. The study is not a short circuit analysis and does not include the effects of reactors on line switching.
10. The study does not consider the effect of unapproved 2009 STEP projects.
Results and Conclusions
Project group line reactors are listed in Table 2. The average line reactor compensation for 345 kV is 1.17 Mvar/mile and 1.28 Mvar/mile in Groups 1 and 2 respectively. The average line reactor compensation for 765 kV operated at 345 kV is 1.77 Mvar/mile in Group 1. Total estimated cost for the line reactor compensation is in the range of $20-$30 million. A preliminary cost estimate for 100 Mvar reactors is in the range of $2 million to $3 million for 345 kV. A detailed facility study will allow us to determine the location, size, and cost estimate of the final reactive requirements. Future studies should include a more detailed system voltage scan under N-1 analysis with the selected line reactors included in each project.

SPP Priority Projects Phase II Report
15
Table 2 lists the approximate amount of line reactance needed to limit system voltage to around 1.01 p.u. This table also lists the line Mvar compensation required for each section of the Priority Project along with an average compensation determined per mile for 345 kV. Table 2: Project Group Line Reactors
Project Circuit
From Bus
Shunt (Mvar)
To Bus Shunt (Mvar)
Total Circuit Shunt (Mvar)
Line Miles Line kV
Gro
up
1
Hitchland-Woodward 1 -71 -71 -142 123.2 345
Hitchland-Woodward 2 -71 -71 -142 123.2 345
Spearville-Comanche -40 -40 -80 71.5 765 at 345
Comanche-Med Lodge -39 -39 -78 42.9 765 at 345
Med Lodge-Wichita -30 -30 -60 73.7 765 at 345
Comanche-Woodward -105 -105 -210 53.9 765 at 345
Cooper-Maryville -34 -34 -68 44.9 345
Maryville-Sibley -55 -55 -110 102.1 345
Valliant-NW Texarkana 0 0 0 66.0 345
Total Shunt (Mvar) -890
Total Shunt (Mvar)/mile (avg.) for 345 kV -1.01
Total Shunt (Mvar)/mile (avg.) for 765 kV operated at 345 kV -1.77
Gro
up
2
Hitchland-Woodward 1 -70 -70 -140 123.2 345
Hitchland-Woodward 2 -70 -70 -140 123.2 345
Spearville-Comanche 1 -27 -27 -54 71.5 345
Spearville-Comanche 2 -27 -27 -54 71.5 345
Comanche-Med Lodge 1 -21 -21 -42 42.9 345
Comanche-Med Lodge 2 -21 -21 -42 42.9 345
Med Lodge-Wichita 1 -26 -26 -52 73.7 345
Med Lodge-Wichita 2 -26 -26 -52 73.7 345
Comanche-Woodward 1 -92 -92 -184 53.9 345
Comanche-Woodward 2 -92 -92 -184 53.9 345
Cooper-Maryville -34 -34 -68 44.9 345
Maryville-Sibley -55 -55 -110 102.1 345
Valliant-NW Texarkana 0 0 0 66.0 345
Total Shunt (Mvar) -1122
Total Shunt (Mvar)/mile (avg.) for 345 kV -1.19