Sports Retail Study 2018 Findings from a German … · port etai t 2018 Findings from a German...
36
Sports Retail Study 2018 Findings from a German consumer survey
Transcript of Sports Retail Study 2018 Findings from a German … · port etai t 2018 Findings from a German...

Sports Retail Study 2018Findings from a German consumer survey

Important notice This study has been prepared by Deloitte GmbH Wirtschaftsprüfungsgesellschaft (“Deloitte”) for general information purposes. No party may rely on this study for any purpose whatsoever, and Deloitte takes no responsibility for any action taken, or not taken, in connection with this study. Deloitte GmbH and/or other entities which are members of Deloitte Touche Tohmatsu Limited may have provided, may be providing or may in the future provide services to businesses named in this paper, their owners, other interested parties and parties related to any of them.

Sports Retail Study 2018 | Findings from a German consumer survey
03
Executive Summary 04
Expert interview 08
Survey design and sample 10
Findings on sports behaviour 13
Findings on sports expenditure 19

04
Executive Summary
In January 2018, Deloitte conducted a representative survey of German sports consumers. A total of 1,677 people at least 16 years of age participated in the survey. Only those respondents who reported be-ing active in at least one type of sport were considered for further analyses, resulting in a final sample size “active Germans” of 1,250.
Fig. 1 – Most popular sports
Fig. 2 – Sports expenditure categories
Fig. 3 – Preferred shopping channel
Stationaryshoppers
Onlineshoppers
60.3%
39.7%
1 Fitness 33.9%
2 33.6%Swimming
5 16.4%Football
4 29.2%Running
3 32.3%Walking/Hiking
€ 60All other sports-related expenditure
1 Sports-related travel € 236
2 € 166Membership fees
5€ 57Entrance fees 6
4 € 86Sports equipment
3 € 120Sports apparel
Over one third of all active Germans par-ticipate in fitness sports, closely followed by swimming, walking/hiking and running. Active Germans spend an average of 6.4h/week on sports, over all of their activities.
Active Germans spend, on average, about € 725 annually on sports and almost 30% expect to spend even more next year.The most is spent on sports-related travel activities (e.g. camping, hiking or surfing), followed by membership fees for sports and fitness clubs, as well as sports apparel.
Over 40% of active Germans purchase sporting goods (sports apparel and sports equipment) at least twice a year.
Among active Germans, 16% can be de-scribed as “Digital users” as they reported regularly using at least one digital sports offering, e.g. a fitness app, an online sports community or a digital fitness offering. The vast majority of Digital users treat their digital services as complementary to a membership in a traditional sports and/or fitness club. Therefore, digital offerings can currently be considered more of an acces-sory than a core service for sports activity.
Over half of all active Germans seek infor-mation on new brands, products or servic-es of a particular sport on the internet.
However, only about one third use digital sources such as price comparison websites or online buyer reviews for purchase-rele-vant information, i.e. affective price or place of purchase. Considering the latter, the preferred information sources are person-al, e.g. consultation in the store or referrals and reports from friends and family.
The majority of active Germans still prefers to shop in stationary retail stores (“Station-ary shoppers”) where personal consulta-tion is provided and fit and functionality can be tested on site. Conversely, almost 40% of active Germans buy sports-related goods primarily online (“Online shoppers”).
A good sign for stationary retailers: only 8.6% of active Germans consult a retail store and subsequently buy online.

Sports Retail Study 2018 | Findings from a German consumer survey
05
Stationaryshoppers
Onlineshoppers
60.3%
39.7%
Across all expenditure categories, Stationary shoppers show higher average annual expenditure than Online shoppers. It is in-ferred that a visit in a stationary store does indeed trigger a higher level of consump-tion, e.g. by providing personal consultation and fitting and tryout options.
In addition, Stationary shoppers do not only buy sporting goods more frequently than Online shoppers, they are also more likely to expect an increase in their sports-related spending next year.
The vast majority of Stationary shoppers rated fitting and testing options as the most important criteria when buying sporting goods. Further, the high relative importance of “easy returning options” and a “wide prod-uct range” express the customers’ desire for a convenient shopping experience.
In summary, it is apparent that sports con-sumers do not enter a retail store to “just” make a purchase, but they seek an in-store shopping and sports experience augmented by qualified personal consultation.
With “ordering and shipment processes” and “easy returning options”, convenience factors are considered to be highly impor-tant by Online shoppers as well. In addition, the fact that price and price transparency are more important online than offline indi-cates a price sensitivity of Online shoppers.
Given the competition between stationary retailers and online stores, it is important to understand which factors determine the customers’ loyalty to their preferred buying channel. Interestingly, for both buying groups, price is the most promising measure to influence customers to switch between stationary retail and online stores.
For online stores, further improving shop-ping experience in the areas of returning options and ordering and shipment pro-cesses could pull customer from stationary stores onto their websites.
Fig. 4 – Expenditure by preferred shopping channel
Fig. 5 – Switching reasons for Stationary shoppers
Fig. 6 – Switching reasons for Online shoppers
Stationaryshoppers
Onlineshoppers
€ 787
€ 632
1 Price 55.6%
2 46.8%Easy & free of charge returns
3 42.0%Walking/Hiking
Easy ordering and shipment
Onlineshoppers
Stationaryshoppers
1 Price 55.9%
2 43.6%Fitting and try-out options
3 41.3%Walking/Hiking
Special offers
Onlineshoppers
Stationaryshoppers
Stationary retailers, on the other hand, should further invest in their core compe-tencies, e.g. fitting and tryout options as well as quality of consultation, to attract Online shoppers. The respondents revealed that amazon.de is the single most preferred source of buy-ing sports-related goods and services.
Interestingly stationary customers show some preference for their preferred retail-er’s online presence, e.g. Intersport retail customers choose intersport.de as a buy-ing channel more often than they choose sportscheck.de or karstadtsport.de, demonstrating the benefits of the retailers’ multi-channel marketing strategies. How-ever, there is potential for improvement as amazon.de is still the primary online choice of all sports retail customers.

06

Sports Retail Study 2018 | Findings from a German consumer survey
07
Selected ServicesWithin our international network we offer a wide range of services, including:
• M&A advisory
• Transaction services including commercial, financial and tax due diligence
• Business plan modelling and review
• Location and market analysis
• Economic impact studies
• Benchmarking and strategy advice
• Compliance and forensic services
• Audit and tax advisory services
Selected StudiesIn order to continue to increase the level of transparency in the sports and leisure industry, Deloitte publishes market reports on a regular basis.
Football Money League(21st edition)
Analysis of the German eSports-Market (2017)(2nd edition)
European Health & Fitness Market Report(5th edition)
Annual Review of Football Finance(27th edition)
The German Health & Fitness Market(15th edition)
Deloitte Sports Business Group
Over 20 years Deloitte has been actively participating in the Sports and the Fitness Industry
ContactDeloitteSports Business GroupSchwannstraße 640476 DüsseldorfTel: +49 (0)211 8772 2666 [email protected]

08
Expert interview with Kim Roether
Kim Roether CEO INTERSPORT Deutschland
Mr. Roether, please briefly describe your responsibilities at INTERSPORT Deutschland.
The INTERSPORT headquarter supports its members in all matters that are important for a sports retailer: from finding a location, shop fitting or assortment design to mar-keting, IT and personnel development. In my position as Chairman of the Board, I am committed to advancing the brick and mor-tar business through pioneering concepts.
According to the results of our study Germans spend a lot of time and money participating in sports, indicating a favourable market environment for sports retailers. Nevertheless, retailers struggle under the intensified pressure of sports manufactures (e.g. adidas or nike) and non-sports online retailers (e.g. amazon). What is your perception of the current market for sports goods and how do you position your offerings in this market?
INTERSPORT positions itself on the market as an omnichannel multi-category specialist.
This means that our retailers offer at least four sports categories in their shops and have specialist knowledge in these areas. In doing so we focus on customers who are passionate about doing sports but being not directly a sports professional – the so-called "everyday athlete". With an emotional approach, new technologies that create real value and excellent service, we want to in-spire our customers at the point of sale with amazing shopping experiences. Through these elements, retailers can establish a unique selling position in the market, which is becoming increasingly competitive.
According to our survey results, fitness is the number one sport engaged in by Germans. Does this result match your experience and how can sports retailers benefit from the ongoing fitness trend in Germany?
In 2017, we recorded an increase in sales of 18% in the Fitness/Training category. This development reflects the unbroken fitness trend in Germany. Two years ago, we responded to this trend and created with our event "FitGesund" a platform on which our customers can try out a wide variety of fitness sports and products. An attractive supporting program about nutrition and health enriches the event. With „FitGesund“ our retailers have the opportunity to offer their regular customers something special. Fitness is no longer just a sport, it's also a way of life. What began two years ago as a showcase under the term "athleisure", has now firmly established itself as a true lifestyle. Functional styles are mixed with sportswear and fashion and are an integral part of the streetscape. Individuality and self-realization are absolutely in focus for customers. Accordingly, a well-assorted sports retailer should not only design its athleisure range in a functional way, but above all in a trendy fashion in order to meet the demands of the target group. As a result of this development the category fitness/multisport has become the largest

Sports Retail Study 2018 | Findings from a German consumer survey
09
category in the INTERSPORT group right behind the outdoor category.
The amount of digital sports offerings is steadily increasing. Examples are fitness apps, online fitness studios or digital sports communities. Is it neces-sary for sports retailers to react to this trend and if so, how?
Retailers should definitely watch this trend and actively participate in such commu-nities. Digitization will also increase in the fitness sector in the future. If a retailer wants to offer fitness watches or apps, he should make this topic his specialty and thus stock up on the necessary range of prod-ucts. However, even if customers train in a digital gym for example, they need the right equipment. They get the equipment and the proper training advice at our INTERSPORT-stores.
Among consumers who primarily buy their sports goods in retail stores, we found that fitting and testing options are the most important buying criteria. Can you describe how you (plan to) in-tegrate such fitting and testing spaces into your store concepts?
Only the right POS-tools make shopping a real experience. Customers want to try out products and are more easily convinced during a live test. At the same time, these tools enable salespersons to present their expertise and know-how during sales con-versations. For many years, we have been offering the INTERSPORT SCHUH COACH, a tool that allows the customer’s feet to be digitally measured. So a running, hiking or ski boot can be selected directly according to the individual needs of the customer. In cold chambers, winter clothing can be tested under realistic conditions. In a kicker cage, the new football can be put to the acid test. When placing such „experience centers“ in the store, it is important to inte-grate them into the harmonious overall pic-
ture. Customers should find these actions points where the entire product category is located in the store.
We found that a low price is the best action to influence consumers who primarily buy their sports goods online to switch to buying in a retail store. As a sports retailer, how could you react to such price sensitive customers considering your own margins and the interests of your suppliers?
At our INTERSPORT-stores, customers receive what they will never get online: au-thentic and professional advice. Our sales-people are enthusiastic athletes themselves. They pass on to customers, which motivates themselves the most – the love of sport. Certainly consulting in the store is associat-ed with a higher price than online. We have to succeed in convincing customers of the benefit so that they know why the visit to the shop is worthwhile. We need to put this competence much more in the foreground.
According to the results of our study INTERSPORT Deutschland retail store customers slightly prefer the online offerings of intersport.de (e.g. over offerings of karstadtsport.de or sportscheck.de). The general retailer amazon.de, however, is the primary choice for buying sports goods online. What measures are you considering to further commit a customer to the brand “INTERSPORT”, regardless of the distribution channel?
INTERSPORT is a well-known brand in Germany. Around 90% of Germans know INTERSPORT. However, we have to improve in making INTERSPORT a more desirous brand. We want to reach our customers in an emotional, authentic and modern way across all channels. We recently introduced our new corporate design. Where the IN-TERSPORT brand shines, INTERSPORT must be in it. With a consistent look and very
good service, whether online or stationary, INTERSPORT can become an even stronger brand. I am convinced of that.
Looking into the future, how do you think sports consumption behaviour will change in the years to come and how is INTERSPORT Deutschland pre-paring to react to these changes?
Because of digitization, products and servic-es as well as communication with customers are becoming increasingly individual. Based on data it enables us to better respond to individual customer and service needs. That means an advantage for the customer, but also for us as a company. We get to know our customers better and can respond to trends faster and more effectively. For this required speed, a rethinking of existing and established processes is necessary. The INTERSPORT group is therefore on the way to becoming a modern retail organization. For our retailers we want to be the best service provider in all areas so that they can concentrate on their core competence: customer service and advice.
Thank you very much for the interview.

10
In January 2018, Deloitte conducted a survey of German sports consumers, representa-tive given census information for the demo-graphic representations of age, gender, and region. A total of 1,677 people at least 16 years of age participated in the survey. Only those respondents who reported being active in at least one type of sport were con-sidered for further analyses, resulting in a final sample size “active Germans” of 1,250. This final sample consists of 54% males and 46% females, with an average age of 48.4 years.
Survey design and sample
A representative sample of 1,250 active people was surveyed on their sports behaviour and sports consumption patterns
1,677 Total Respondents
427
Male53.8%
Female46.2%
16–3426.4%
35–4414.5%
45–5417.8%
55+41.3%
Non-Active1,250Active
Fig. 7 – Sample of active Germans

Sports Retail Study 2018 | Findings from a German consumer survey
11
The active Germans sample can be described as highly educated. 28% of the sample holds a university degree, which is higher than the share in the general public (about 20% according to the German Sta-tistical Federal Agency). 24% of the sample holds an Academic Secondary Diploma.
8% of the sample reported a monthly net household income below € 1,000, which is
*6.9% of the sample did not report a monthly income and was therefore excluded for any further income analyses.
The active Germans sample can be further described based on key socio-economic characteristics
9.3%
36.7%
24.4%
28.0%
1.6%
8.1%
20.3%
27.4%
37.3%
Fig. 9 – Highest educationFig. 8 – Distribution across German federal states
Fig. 10 – Monthly net household income*
Lower Secondary Diploma (Hauptschule)
Middle Secondary Diploma (Realschule)
Academic Secondary Diploma (Abitur)
University Degree Other
Up to € 1.000 € 1,001 to € 2,000 € 2,001 to € 3,000 Above € 3,000
State % share
Hamburg 1.5%
Bremen 0.6%
Schleswig-Holstein 9.6%
Niedersachsen 4.2%
Baden-Württemberg 12.5%
Hessen 8.1%
Rheinland-Pfalz 4.9%
Saarland 1.2%
Bayern 15.5%
Berlin 4.2%
Brandenburg 2.4%
Mecklenburg-Vorpommern 1.3%
Sachsen-Anhalt 3.4%
Nordrhein-Westfalen 22.6%
Sachsen 2.1%
Thüringen 5.9%
consistent with the data of the German Sta-tistical Federal Agency (according to which 7.5% of the population has a monthly net household income below € 900). 37% of the sample reported an income above € 3,000.
Finally, the geographic distribution of the sample over the federal states in Germany closely matches official census data.

12

Sports Retail Study 2018 | Findings from a German consumer survey
13
Findings on sports behaviour
Fitness is the most popular choice among sports participated in Germany, followed by swimming and walking/hiking
Over one third of all active Germans par-ticipate in fitness, closely followed by swim-ming, walking/hiking, running and football. In comparison, the top five sports according to the membership statistics of the German Olympic Sports Confederation (Deutscher Olympischer Sportbund, DOSB) are football, gymnastics, tennis, sports shooting, and alpine sports (comprising walking/hiking amongst others). Fitness is not an activity tracked by the DOSB. The data are not fully comparable, however, as the DOSB only counts sports club members in Germany and considers people of all age groups, including children below 16 years of age.
Fig. 11 – Most popular sports (more than one answer possible)
1 Fitness 33.9%
2 33.6%Swimming
5 16.4%Football
6 10.6%Tennis
7 10.2%Yoga
8 9.6%Mountain biking
9 8.7%Nordic walking
10 7.5%Badminton
11 7.1%Table tennis
12 7.0%Alpine skiing
4 29.2%Running
3 32.3%Walking/Hiking

14
Across all activities, active Germans spend an average of 6.4h/week on sports
The results show that males tend to spend about 50 minutes per week more on sports than females. Also, the youngest respond-ents (16 to 34 years of age) spend about two hours per week more on sports than the oldest (over 55 years).
Respondents with a mid-level household income (between € 2,001 and € 3,000) spend the most time on sports. Overall, however, there is no clear correlation be-tween income and time spent on sports.
Fig. 12 – Time spent on sports by gender
Fig. 13 – Time spent on sports by age
Fig. 14 – Time spent on sports by level of income
Finanzierungs-schwierigkeiten
hoch verschuldeterEurostaaten
Abflauen des Immobilien-
booms
8
7
6
5
4
3
2
1
0
Hou
rs p
er w
eek
6.06.8
Female Male
Finanzierungs-schwierigkeiten
hoch verschuldeterEurostaaten
Abflauen des Immobilien-
booms
16-34
8
7
6
5
4
3
2
1
0
Hou
rs p
er w
eek
7.4 7.3
6.35.5
35-44 45-54 55+
Finanzierungs-schwierigkeiten
hoch verschuldeterEurostaaten
Abflauen des Immobilien-
booms
Up to€ 1,000
8
7
6
5
4
3
2
1
0
Hou
rs p
er w
eek
6.25.8
7.16.5
€ 1,001 to€ 2,000
€ 2,001 to€ 3,000
Above€ 3,000

Sports Retail Study 2018 | Findings from a German consumer survey
15
Most active Germans regularly participate in one type of sport and spend about 4.4 hours per week on that sport. With an increasing number of sports regularly par-ticipated, the time spent on sports across all activities increases.
Among active Germans who participate in fitness, 34% regularly participate in swim-ming, closely followed by running and walk-ing / hiking. 15% also participate in yoga.
Fig. 15 – Parallel sports participation among active Germans
1 Sport
40%
30%
20%
10%
0
12
10
8
6
4
2
0
% o
f act
ive
Ger
man
s
Number of sports regularly participated in
Hou
rs p
er w
eek
31.4%
4.4 5.9
6.97.6
7.1
10.8
23.9%
16.9%
9.6%6.4%
11.8%
2 Sports 3 Sports 4 Sports 5 Sports more than 5 Sports
About 70% of active Germans regularly participate in more than one sports
Fig. 16 – Most popular additional sports among active Germans who participate in fitness, swimming or walking/hiking
Among swimmers, walking / hiking, running and fitness are most participated, followed by football and Nordic walking.
Finally over 40% of active Germans who regularly participate in walking / hiking also participate in swimming, followed again by running and fitness, as well as Nordic walk-ing and mountain biking.
Fitness (33.9% of active Germans)
1 34.0%Swimming
4 18.9%Football
5 15.1%Yoga
3 28.1%Walking/Hiking
2 33.5%Running
Swimming (33.6% of active Germans)
1 39.3%Walking/Hiking
4 15.2%Football
5 14.3%Nordic walking
3 34.3%Fitness
2 37.1%Running
Walking/Hiking (32.3% of active Germans)
1 40.8%Swimming
4 14.6%
5 12.6%
Nordic walking
Mountain bike
3 29.5%Fitness
2 34.4%Running

16
Among active Germans, 16% can be de-scribed as “Digital users” as they reported the regular use of at least one digital sports offering, e.g. a fitness app, an online sports community or a digital fitness offering. Females use digital sports services slightly more often than males. Also, younger demographics comprise the majority of users of digital sports offerings, i.e. over half of all “Digital users” are between 16 and 34 years of age. The vast majority of Digital users treat digital services as a com-plementary sports channel, since they also report memberships in a traditional sports and/or fitness club – only 3.5% of active Germans exclusively uses digital services. The observed multichannel behaviour can also partly be explained by fitness clubs who offer their members access to a digital plat-form as an additional training resource, such as the fitness operator Fitness First with its digital application NewMoove.
Fig. 17 – User rates of digital sports offerings
Fig. 18 – Digital users by gender
Finanzierungs-schwierigkeiten
hoch verschuldeterEurostaaten
Abflauen des Immobilien-
booms
83.8%
12.7%
3.5%100%
90%
80%
70%
60%
50%
40%
30%
20%
10%
0
% o
f act
ive
Ger
man
s
Digital users
Finanzierungs-schwierigkeiten
hoch verschuldeterEurostaaten
Abflauen des Immobilien-
booms
51.7%48.3%
Female Male
60%
50%
40%
30%
20%
10%
0
% o
f Dig
ital u
sers
Fig. 19 – Digital users by age
Finanzierungs-schwierigkeiten
hoch verschuldeterEurostaaten
Abflauen des Immobilien-
booms
50.2%
21.7%15.3% 12.8%
16-34 35-44 45-54 55+
60%
50%
40%
30%
20%
10%
0
% o
f Dig
ital u
sers
Only Digital channels Analogues and Digital channels Only Analogues channels
About 16% of active Germans regularly use digital sports offerings – however, mainly as a complementary sports channel

Sports Retail Study 2018 | Findings from a German consumer survey
17
Of all active Germans, 11% regularly use a fitness app. Fitness apps are growing in pop-ularity as people seek to track their progress (e.g. distance, calories burned, pace) and also track their vital statistics (e.g. heart rate) as well as sleeping patterns.
Further 6% are members of online sports communities and 4% use an online fitness offering. The latter are growing as par-ticipants recognise the value of remotely participating in instructed fitness courses on their own schedules.
Fig. 20 – Digital sports offerings
The current digital sports environment is diverse with many service providers and brands
Fitness apps Online sports communities
Runtastic48.3%*1
2
3 7min22.4%*
Fitbit32.2%*
11.4%of active Germans
facebook 76.6%*1
2
3 Strava10.4% *
sportiversum28.6%*
6.2%of active Germans
Online fitness offerings
Gymondo54.2%*1
2
3 NewMoove27.1%*
YogaEasy29.2%*
3.8%of active Germans
*Percentage value refers to users within each category, e.g. 48.3% of fitness app users use Runtastic. More than one answer possible.

18

Sports Retail Study 2018 | Findings from a German consumer survey
19
Findings on sports expenditureMost sports-related expenditure is on travel activities (e.g. camping, hiking, surfing), followed by membership fees for sports and fitness clubs as well as sports apparel. Almost 30% of active Germans expect an increase in their total sports-related expenditure over the upcoming year. While almost two thirds anticipate no change at all, only 6% are likely to reduce sports-related expenditure.
Regarding the purchase of sporting goods (sports apparel and sports equipment) over 40% of active Germans purchase sporting goods at least twice a year.
Active Germans spend an average of € 725 annually on sports and about 30% expect to spend more next year
€ 60All other sports-related expenditure
1 Sports-related travel € 236
2 € 166Membership fees
5€ 57Entrance fees 6
4 € 86Sports equipment
3 € 120Sports apparel
Fig. 21 – Summary of sports expenditure categories
Fig. 22 – Expected change in total sports-related expenditure next year vs. current year
Fig. 23 – Frequency of sporting goods purchases
Finanzierungs-schwierigkeiten
hoch verschuldeterEurostaaten
Abflauen des Immobilien-
booms
Significantly more
% if
act
ive
Ger
man
s
7.5%
21.8%
64.4%
5.3%1.0%
Rather more
No more or less
Rather less
Significantly less
70%
60%
50%
40%
30%
20%
10%
0
Finanzierungs-schwierigkeiten
hoch verschuldeterEurostaaten
Abflauen des Immobilien-
booms
Very often(over 4 times)
% o
f act
ive
Ger
man
s
9.2%
35.2% 34.8%
17.8%
3.0%
Often(2 to 4 times)
Not often
Only for replacements
Never
40%
30%
20%
10%
0

20
Males have higher sports-related expendi-ture than females. The youngest age group shows among the lowest sports-related ex-penditure, potentially due to lower income. Expenditure is highest for the age group 35 to 44. Sports-related expenditure can be described as income-elastic as expenditure increases with income.
Total sports-related expenditure is correlat-ed with time spent on sports (correlation co-efficient 0.21). For every additional hour per week spent on sports (across all activities), sports-related annual expenditure increases by about € 40.
On average, males spend € 100 more annually on sports than females – expenditure increases with income but declines with age
Fig. 24 – Total sports expenditure by gender
Fig. 25 – Total sports expenditure by age
Fig. 26 – Total sports expenditure by income
Finanzierungs-schwierigkeiten
hoch verschuldeterEurostaaten
Abflauen des Immobilien-
booms
€ 666€ 776
Female Male
1,000
800
600
400
200
0
EUR
Finanzierungs-schwierigkeiten
hoch verschuldeterEurostaaten
Abflauen des Immobilien-
booms
16-34
1,000
800
600
400
200
0
EUR
€ 693
€ 825
€ 695 € 724
35-44 45-54 55+
Finanzierungs-schwierigkeiten
hoch verschuldeterEurostaaten
Abflauen des Immobilien-
booms
1,000
800
600
400
200
0
EUR
€356
€512
€704
€ 969
Up to€ 1,000
€ 1,001 to€ 2,000
€ 2,001 to€ 3,000
Above€ 3,000

Sports Retail Study 2018 | Findings from a German consumer survey
21
Respondents who expect increasing sports-related expenditure next year (about 30% of all active Germans) already have above-average annual sports-related expenditure of about € 1,000.
This subgroup of active Germans is typically of young age, male and spends over 8 hours per week primarily on fitness and endurance sports.
Active Germans expecting to increase total sports-related expenditure are an attractive target group for sports retailers
Total time spent on average (hours/week)*
8.1
Annual average expenditure*
€ 986Fig. 27 – Most popular sports of respondents who expect increased expenditure
Fig. 28 – Respondents who expect increased expenditure by gender
Finanzierungs-schwierigkeiten
hoch verschuldeterEurostaaten
Abflauen des Immobilien-
booms
45.9%
54.1%
Female Male
60%
50%
40%
30%
20%
10%
0
% w
ithin
gro
up
Fig. 29 – Respondents who expect increased expenditure by age
Finanzierungs-schwierigkeiten
hoch verschuldeterEurostaaten
Abflauen des Immobilien-
booms
42.3%
19.1% 16.9%21.6%
16-34 35-44 45-54 55+
60%
50%
40%
30%
20%
10%
0
% w
ithin
gro
up
1 Fitness
2 Running
3 Swimming
41.0%
39.1%
36.3%
*Among respondents who expect increased sports-related expenditure.

22
In the survey, sources of sporting goods information were separated between (1) sources of general information on new brands, products or services of a particular sport (“General information”) and (2) sources of purchase-relevant information, i.e. affecting price or place of purchase (“Pur-chase-relevant information”). Over half of all active Germans seek General information on the internet. However, only about one third use online sources such as price com-parison websites or online buyer reviews for Purchase-relevant information. Considering the latter, the preferred information sources remain on the personal level, e.g. consul-tation in the store or referrals and reports from friends and family.
The internet is a valuable source of information on sporting goods – for purchase-relevant information, however, personal sources are preferred
Fig. 30 – General information sources on new brands, products or services
Fig. 31 – Sources for Purchase-relevant information
1 Internet research
2 Consultation in store
3 Catalogues andmagazines
4 TV/Internetcommercials
5 Newsletter
56.9%
41.8%
34.2%
24.3%
11.9%
1 Consultation in store
2 Personal contacts
3 Online price comparison
4 Online buyer reviews
5 Catalogues and magazines
48.2%
40.7%
31.2%
29.8%
28.5%

Sports Retail Study 2018 | Findings from a German consumer survey
23
The majority of active Germans still prefer to purchase sporting goods in stationary stores (“Stationary shoppers”) where personal consultation is available and fit and functionality can be tested on site. However, a large portion of these Stationary shoppers consult websites before making their in-store purchases. Conversely, 40% of active Germans buy sports-related goods primarily online (“Online shoppers”). The vast majority of these Online shoppers also seek information and consultation online. A good sign for stationary retailers: only 8.6% of active Germans consult a retail store and subsequently buy online.
Over 60% of respondents still prefer stationary retail stores for purchasing sporting goods
Fig. 32 – Preferred shopping channel
25.4%
35.0%
8.6%
31.0%
Stationaryshoppers
60.3%
Onlineshoppers
39.7%
Consultation and purchase in stationary store
Consultation online and purchase in a stationary store
Consultation and purchase online
Consultation in a stationary store and purchase online

24
Male57.6%
Female42.2%
Male48.2%
Female51.8%
Stationaryshoppers
On average, 48.5 years of ageTime spent on sports: 6.6 hours/week
On average 48.1 years of ageTime spent on sports: 6.1 hours/week
Onlineshoppers
Male57.6%
Female42.4%
Male48.2%
Female51.8%
Male57.6%
Female42.2%
Male48.2%
Female51.8%
Stationaryshoppers
On average, 48.5 years of ageTime spent on sports: 6.6 hours/week
On average 48.1 years of ageTime spent on sports: 6.1 hours/week
Onlineshoppers
Male57.6%
Female42.4%
Male48.2%
Female51.8%
Stationary shoppers are slightly more likely to be male and spend more time (i.e. 30 minutes per week) on average participating in sports. No material differences in average age are observed.
Among the Online shoppers, the share of consumers with a low household income, i.e. below € 1,000 per month, is almost three percentage points higher than the corre-sponding share of Stationary shoppers. Conversely, the share of consumers with higher net household incomes (except of € 2,001 to € 3,000) is higher among Stationary shoppers.
Buying sporting goods online is preferred by females and active Germans with lower income
On average, 48.5 years of age
Time spent on sports: 6.6 hours/week
On average 48.2 years of age
Time spent on sports: 6.1 hours/week
Fig. 34 – Online shoppers
Fig. 33 – Stationary shoppers
Fig. 35 – Preferred shopping channels by income
6.9%9.9%
Up to € 1,000
21.4% 18.8%
€ 1,001 to€ 2,000
27.2% 27.6%
€ 2,001 to € 3,000
39.1%34.5%
Above € 3,000
40%
30%
20%
10%
0
% w
ithin
gro
up
Online shoppers
Stationaryshoppers
6.9%9.9%
Up to € 1,000
21.4% 18.8%
€ 1,001 to€ 2,000
27.2% 27.6%
€ 2,001 to € 3,000
39.1%34.5%
Above € 3,000
40%
30%
20%
10%
0
% w
ithin
gro
up
Online shoppers
Stationaryshoppers
6.9%9.9%
Up to € 1,000
21.4% 18.8%
€ 1,001 to€ 2,000
27.2% 27.6%
€ 2,001 to € 3,000
39.1%34.5%
Above € 3,000
40%
30%
20%
10%
0
% w
ithin
gro
up
Online shoppers
Stationaryshoppers
Stationary shoppers Online shopper

Sports Retail Study 2018 | Findings from a German consumer survey
25
Across all categories, Stationary shoppers show higher average annual expenditure than Online shoppers. Stationary shoppers spend about 12% more on sports apparel and 17% on sports equipment than Online shoppers.
Since sports-related expenditure varies with demographic characteristics such as age and gender and with time spent on sports, causes of higher expenditure cannot be clearly separated. However, given the differ-ence in the categories sports apparel and sports equipment, it appears that the visit in a stationary retail store does indeed trigger a higher level of expenditure.
Stationary shoppers spend about € 150 more annually on sports-related goods and services than Online shoppers
On average, 48.5 years of age
Time spent on sports: 6.6 hours/week
On average 48.2 years of age
Time spent on sports: 6.1 hours/week
Fig. 36 – Expenditure by preferred shopping channel
Fig. 37 – Expenditure categories by shopping types
€ 125 € 112
Sports apparel
€ 91 € 78
Sports equipment
€ 181
€ 142
Membership fees
€ 64€ 48
Entrance fees
€ 261
€ 199
Sports travel
€ 64 € 54
Other sports-related
300
250
200
150
100
50
0
EUR
Online shoppers
Stationaryshoppers
Stationary shoppers Online shopper
Stationaryshoppers
Onlineshoppers
€ 787
€ 632

26
Stationary shoppers tend to purchase sporting goods (sports apparel and sports equipment) more frequently than Online shoppers. Over 10% buy very often (i.e. more than four times a year), compared to about 8% of Online shoppers. Also, while about 18% of Stationary shoppers buy only for replacements or never, the corresponding share for Online shoppers increases to 25%.
About 10% of Stationary shoppers expect a significant increase in their spending on sports-related goods and services in the up-coming year (vs. only 4% of Online shoppers). Further, Online shoppers seem more likely to reduce sports-related expenses; about 9% reported such expectations, compared to only 5% of Stationary shoppers.
Stationary shoppers purchase sporting goods more frequently and more often expect to increase their sports-related expenditure next year
Fig. 38 – Frequency of sporting goods purchases
Fig. 39 – Expected change in expenditure next year vs. current year
9.7%4.2%
Significantly more
21.9% 21.6%
Rather more
63.5% 65.7%
No more or less
4.5% 5.6%
Rather less
0.4% 2.0%
Significantly less
70%
60%
50%
40%
30%
20%
10%
0%
% w
ithin
gro
up
10.1% 7.9%
Very often
34.7% 35.9%
Often
37.4%30.8%
Not often
16.6%19.8%
Only for replacements
1.2%5.6%
Never
40%
30%
20%
10%
0%
% w
ithin
gro
up
Stationary shoppers Online shopper
Stationary shoppers Online shopper

Sports Retail Study 2018 | Findings from a German consumer survey
27
Almost 17% of active Germans make be-tween 0% and 10% of their sporting goods purchases online. They spend an average of € 543 annually on all their sports-related goods and services. On the other hand, 14% of active Germans make between 90% and 100% of their sporting goods purchases online. This subgroup spends an average of € 659 annually on all their sports-related goods and services.
Active Germans who make between 20% and 30% (annual average expenditure of € 936) as well as between 30% and 40% (annual average expenditure of € 1,053) of their sporting goods purchases online, spend the most on sports-related goods and services.
Total sports-related expenditure varies with the share of sporting goods purchases made online
Fig. 40 – Share of sporting goods purchases made online
0%-10%
€ 543
10%-20% 20%-30% 30%-40% 40%-50% 50%-60% 60%-70% 70%-80% 80%-90% 90%-100%
20%
15%
10%
5%
0%
1,200
1,000
800
600
400
200
0
% o
f act
ive
Ger
man
s
Share of purchases made online
Annu
al a
vera
ge e
xpen
ditu
re
8.1% 5.2% 7.3% 8.5% 7.7% 8.6%
€ 659€ 632€ 750
€ 637
€ 936€ 1,053
€ 756
€ 914
€ 707
16.9% 10.6% 13.6% 13.6%

28
The vast majority of Stationary shoppers rated fitting and testing options as the most important criteria when buying sporting goods. Relevance criteria #2 and #3, “easy returning options” and a “wide product range”, express those customers’ desire for a convenient shopping experience. In addition, over three quarters of Stationary shoppers rated quality of consultation as important.
What is perceived as relevant when buying sports-related goods differs between Stationary shoppers and Online shoppers
Fig. 41 – Relevant criteria for Stationary shoppers
Fitting and testing
100%
90%
80%
70%
60%
50%
40%
30%
20%
10%
0%
1.0
2.0
3.0
4.0
5.0
% w
ithin
gro
up
Impo
rtan
ce s
cale
-poi
nts*
57.3%
0.3%
10.5%
Quality of consultation
42.7%
17.1%
Easy returning options
41.9%
15.9%
Product range
35.9%
19.6%
Price
31.8%
24.9%
Special offers(Sale)
30.2%
25.6%
Price transparency
24.5%
28.9%
Ordering/ Shipment
18.3%
Loyality programs
12.5%
2.1% 1.1% 0.5% 0.7% 1.1% 0.4%
13.1% 14.3%3.4% 4.0% 3.3% 2.4% 5.0% 5.4% 5.0%
17.1% 17.4%28.5%
34.1% 37.8%41.5%
37.5% 37.7%41.1%
21.5%21.5%
30.0%34.4%
*Importance was measured on a five point scale, where "1" equals very important.
Very important Rather important Neutral rather not important
not important Average*
Sports Retail Study 2018 | Findings from a German consumer survey
29
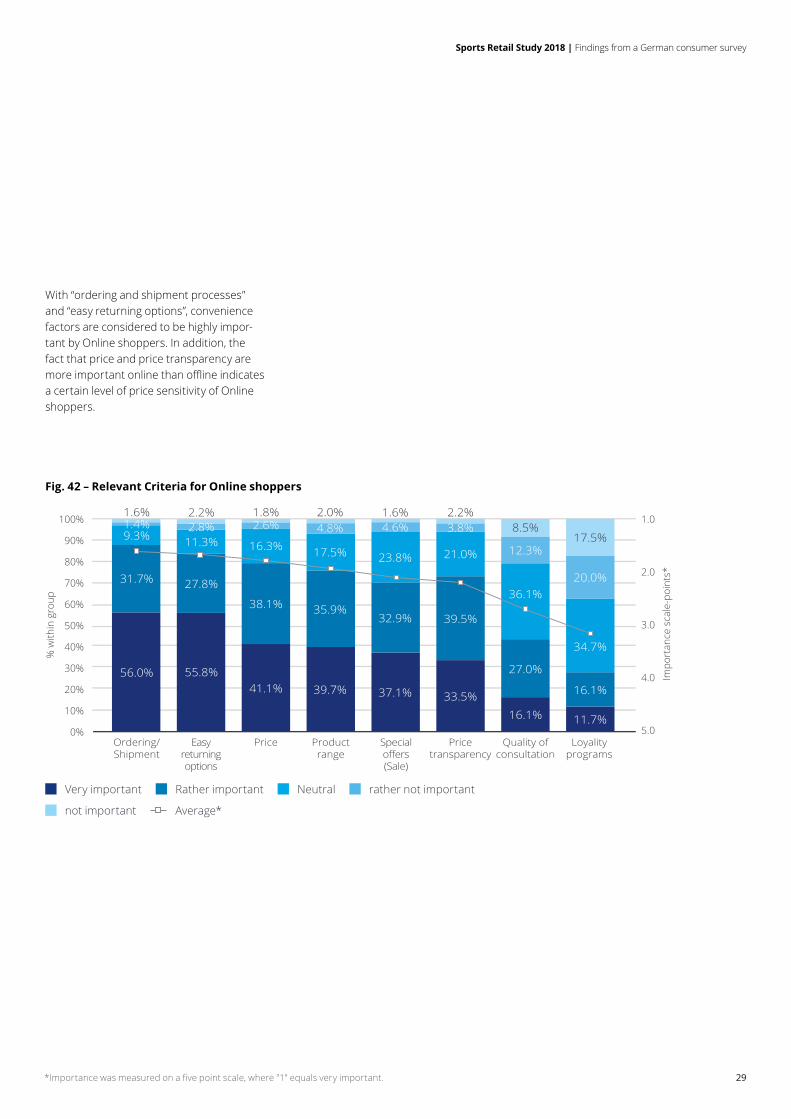
With “ordering and shipment processes” and “easy returning options”, convenience factors are considered to be highly impor-tant by Online shoppers. In addition, the fact that price and price transparency are more important online than offline indicates a certain level of price sensitivity of Online shoppers.
Fig. 42 – Relevant Criteria for Online shoppers
Ordering/ Shipment
100%
90%
80%
70%
60%
50%
40%
30%
20%
10%
0%
1.0
2.0
3.0
4.0
5.0
% w
ithin
gro
up
Impo
rtan
ce s
cale
-poi
nts*
Easy returning options
Price Product range
Special offers(Sale)
Price transparency
Quality of consultation
Loyality programs
56.0%
1.6%
9.3%1.4%
31.7%
55.8%
11.3%
2.2%2.8%
27.8%
41.1%
16.3%
1.8%2.6%
38.1%
39.7%
17.5%
2.0%4.8%
35.9%
37.1%
23.8%
1.6%4.6%
32.9%
33.5%
21.0%
2.2%3.8%
39.5%
16.1%
36.1%
8.5%
12.3%
27.0%
11.7%
17.5%
20.0%
16.1%
34.7%
*Importance was measured on a five point scale, where "1" equals very important.
Very important Rather important Neutral rather not important
not important Average*

30
When asked what additional factors are important when purchasing sporting goods in a stationary store, the vast majority of active Germans considered individual presentations of brands, products or manufacturers accompanied by tryout and testing options to be important. Together with further factors considered important, namely individual fitting options (e.g. for shoes or rackets) and technical analyses, it is apparent that sports consumers do not en-ter a retail store to “just” make a purchase, but they seek an in-store shopping and sports experience augmented by qualified personal consultation.
For stationary retailers, further improving the in-store shopping experience may be highly beneficial
Individual presentation incl. testing
options
100%
90%
80%
70%
60%
50%
40%
30%
20%
10%
0%
1.0
2.0
3.0
4.0
5.0
% o
f act
ive
Ger
man
s
Impo
rtan
ce s
cale
-poi
nts*
34.6%
3.4%
21.3%
5.3%
35.5%
Individual fitting
options
22.6%
7.4%
30.1%
10.3%
29.6%
Technical analyses
16.9%
8.2%
33.5%
11.6%
29.8%
Cooperations with sports
clubs
15.8%
13.4%
32.5%
11.7%
26.7%
Training and nutrition advice
11.6%
15.3%
32.7%
18.6%
21.8%
Fig. 43 – Additional criteria, relevant for stationary retail stores
Very important Rather important Neutral rather not important
not important Average*
*Importance was measured on a five point scale, where "1" equals very important.

Sports Retail Study 2018 | Findings from a German consumer survey
31
Over half of all active Germans rated intro-ductory and explanatory product videos as an important criteria for online sports shops, followed in relevance by online train-ing tips and videos. These results indicate the nature of sporting goods as high involve-ment products, often requiring detailed information and consultation, e.g. regarding size, fit and functionality, regardless of the buying channel.
For sports-related online shops, online product and training videos are perceived as especially importantv
Online product videos
100%
90%
80%
70%
60%
50%
40%
30%
20%
10%
0%
1.0
2.0
3.0
4.0
5.0
% o
f act
ive
Ger
man
s
Impo
rtan
ce s
cale
-poi
nts*
19.9%
7.8%
29.8%
8.4%
34.0%
Online training tipps
and videos
13.5%
11.0%
31.6%
13.9%
30.0%
Information on new
products via newsletter
11.9%
15.1%
32.5%
15.5%
25.0%
Information on events,
results, and athletes via newsletter
8.1%
18.6%
33.8%
19.0%
20.6%
Social media presence
9.0%
24.0%
29.8%
18.2%
19.0%
Fig. 44 – Additional criteria, relevant for online retailers
Very important Rather important Neutral rather not important
not important Average*
*Importance was measured on a five point scale, where "1" equals very important.

32
1 Price 55.6%
2 46.8%Easy & free of charge returns
3 42.0%Easy ordering and shipment
4 33.8%Special offers
5 33.7%Wide product range
Onlineshoppers
Stationaryshoppers
1 Price 55.9%
2 43.6%Fitting and try-out options
3 41.3%Special offers
4 41.1%Wide product range
5 36.5%Quality of consultation
Onlineshoppers
Stationaryshoppers
Given the competition between stationary retailers and online stores, it is important to know what factors determine a customer’s loyalty to their preferred buying channel. Interestingly, for both buying groups, price is the most promising measure to encourage consumers to switch channels. Further indicating the price sensitivity of sports consumers, sales and special offers are also among the top reasons to switch channels.For online stores, further improving a convenient shopping experience in terms of returning options and ordering and ship-ment processes, could pull customers from stationary stores onto their websites. Sta-tionary retailers, on the other hand, should further invest in their core competencies, e.g. fitting and try-out options as well as quality of consultation, to influence Online shoppers to consider switching channels after ensuring price parity.
A low price is the most effective measure to cause consumers to switch between stationary shopping and online shopping
Fig. 45 – Switching reasons for Stationary shoppers
Fig. 46 – Switching reasons for Online shoppers

Sports Retail Study 2018 | Findings from a German consumer survey
33
Sport-specific Manufacturers General sources
1 Intersport (42.1%*) 1 Adidas (37.9%*) 1 department stores (45.4%*)
2 SportScheck (22.0%*) 2 Nike (28.2%*) 2 local retailers (27.2%*)
3 Karstadt Sport (20.6%*) 3 Puma (12.4%*) 3 other (2.2%*)
1 intersport.de (22.8%*) 1 adidas.de (29.5%*) 1 amazon.de (62.6%*)
2 sportscheck.de (17.8%*) 2 nike.de (22.3%*) 2 ebay.de (25.2%*)
3 karstadtsport.de (11.4%*) 3 puma.de (9.5%*) 3 zalando.de (15.1%*)
*Percentage of active Germans indicating to purchase sporting goods from this source. More than one answer possible.
Consumers’ options for buying sporting goods can be considered on two dimensions (1) buying channel, i.e. online or stationary, and (2) sports focus, i.e. sport-specific, man-ufacturers, or general sources. Respond-ents’ most cited source for buying sporting goods is amazon.de. Among the sport-spe-cific options and the original manufacturers, the key industry players in Germany were most preferred by consumers both in the stationary and online segment. The order of preference of online sources matched the order of preference of stationary sources, i.e. Intersport and Adidas are both the first choice in their segments regardless of the buying channel.
Among the many options for sports-related shopping, amazon.de is the most popular choice
Fig. 47 – Options for sport-related shopping
6.9%9.9%
Up to € 1,000
21.4% 18.8%
€ 1,001 to€ 2,000
27.2% 27.6%
€ 2,001 to € 3,000
39.1%34.5%
Above € 3,000
40%
30%
20%
10%
0
% w
ithin
gro
up
Online shoppers
Stationaryshoppers
6.9%9.9%
Up to € 1,000
21.4% 18.8%
€ 1,001 to€ 2,000
27.2% 27.6%
€ 2,001 to € 3,000
39.1%34.5%
Above € 3,000
40%
30%
20%
10%
0
% w
ithin
gro
up
Online shoppers
Stationaryshoppers

34
1 25.5%amazon.de
3 14.6%adidas.de
2 16.8%intersport.de
1 24.1%amazon.de
3 14.4%adidas.de
2 16.3%sportscheck.de
1 25.8%amazon.de
3 12.4%karstadtsport.de
2 13.7%adidas.de
30%
25%
20%
15%
10%
5%
0%
40%
Shar
e of
onl
ine
choi
ces
intersport.de sportscheck.de karstadtsport.de amazon.de ebay.de zalando.de adidas.de nike.de
share of intersport.de among Intersport stationary customers
share of karstadtsport.de among Karstadt Sports stationary customers
share of sportscheck.de among SportScheck stationary customers
Customers of each stationary retailer show some preference for that retailer’s online presence, e.g. the share of intersport.de as a buying channel of Intersport retail custom-ers (17%) is higher than the corresponding shares of sportscheck.de (11%) or karstadtsport.de (10%).
A similar pattern is also observed for SportScheck and Karstadt Sports stationary customers. This demonstrates benefits of retailers’ multi-channel marketing strategies. However, there is still room for improve-ment, as amazon.de is still the most popular choice among all sports retail customers.
Customers of a specific stationary retail store prefer that retailer’s online presence, demonstrating that multi-channel strategies are working
Fig. 48 – Online choices of stationary customers
Fig. 49 – Multi-channel shopping preferences

Sports Retail Study 2018 | Findings from a German consumer survey
35

This communication contains general information only not suitable for addressing the particular circumstances of any individual case and is not intended to be used as a basis for commercial decisions or decisions of any other kind. None of Deloitte GmbH Wirtschaftsprüfungsgesellschaft or Deloitte Touche Tohmatsu Limited, its member firms, or their related entities (collectively, the “Deloitte network”) is, by means of this communication, rendering professional advice or services. No entity in the Deloitte network shall be responsible for any loss whatsoever sustained by any person who relies on this communication.
Deloitte refers to one or more of Deloitte Touche Tohmatsu Limited, a UK private company limited by guarantee (“DTTL”), its network of member firms, and their related entities. DTTL and each of its member firms are legally separate and independent entities. DTTL (also referred to as “Deloitte Global”) does not provide services to clients. Please see www.deloitte.com/de/UeberUns for a more detailed description of DTTL and its member firms.
Deloitte provides audit, risk advisory, tax, financial advisory and consulting services to public and private clients spanning multiple industries; legal advisory services in Germany are provided by Deloitte Legal. With a globally connected network of member firms in more than 150 countries, Deloitte brings world-class capabilities and high-quality service to clients, delivering the insights they need to address their most complex business challenges. Deloitte’s approximately 263,900 professionals are committed to making an impact that matters.
Stand 04/2018
Contacts
Karsten HollaschPartnerTel: +49 (0)69 75695 [email protected]
Dr. Felix MutterManagerTel: +49 (0)211 8772 [email protected]