


Sport Specialization - kshsaa.org
63
Transcript of Sport Specialization - kshsaa.org
Tim McGuine PhD, ATC
University of Wisconsin
School of Medicine and Public Health

COI – Disclosures
Neither I, nor any family member(s), have any
relevant financial relationships to be discussed,
directly or indirectly, referred to or illustrated
within the presentation.
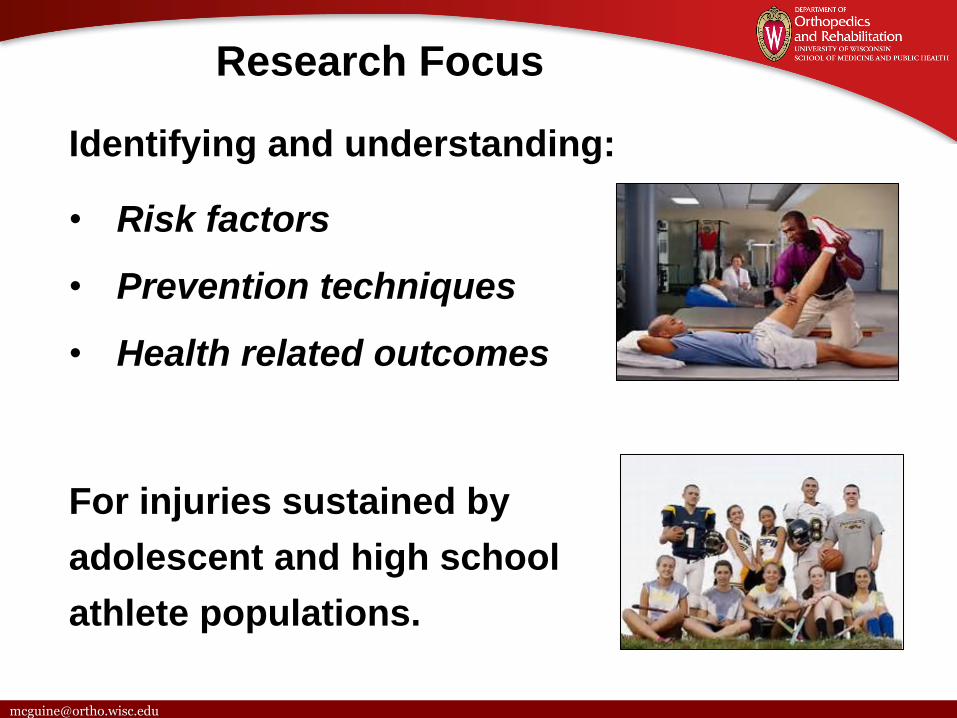
Research Focus
Identifying and understanding:
• Risk factors
• Prevention techniques
• Health related outcomes
For injuries sustained by
adolescent and high school
athlete populations.
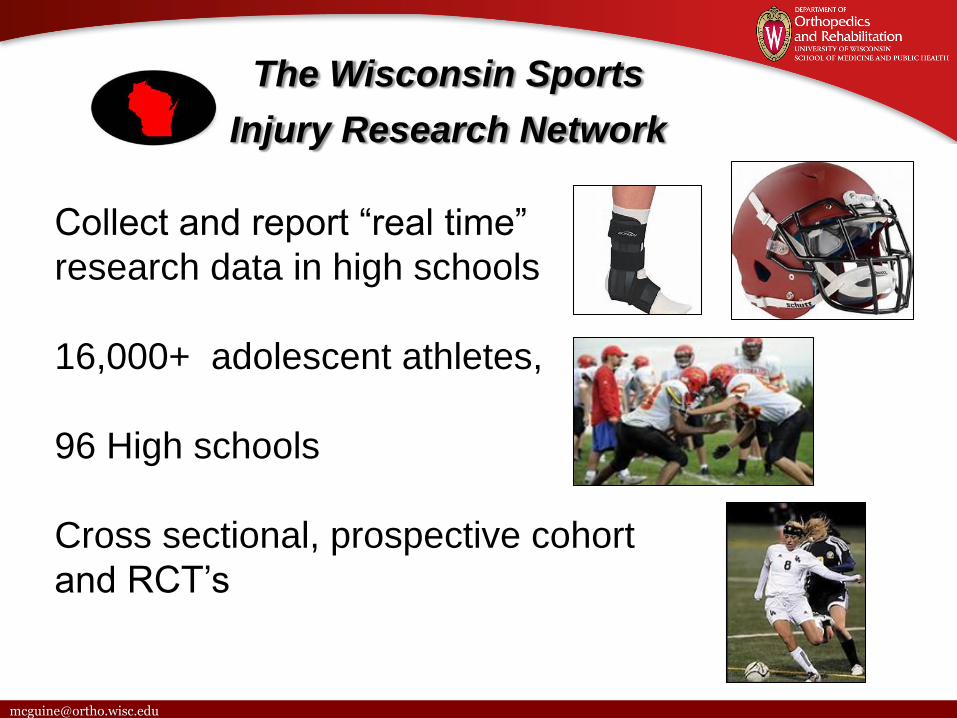
The Wisconsin Sports
Injury Research Network
Collect and report “real time”
research data in high schools
16,000+ adolescent athletes,
96 High schools
Cross sectional, prospective cohort
and RCT’s

Sport Specialization……Background

Dec 20169
Anecdotes
“Our team’s post season has been impacted the last 2 years by club
sport injuries…”
“I played in 84 soccer games my senior year....”
“We can’t get enough girls to play basketball at our school because of
club volleyball….”
“If my son doesn’t play baseball in the fall, they won’t let him play
in the spring….”
‘My 12 yr. old was asked to sign a contract to train with her club soccer
team all winter and not play other sports….”
My daughter just wants to make her varsity team….”
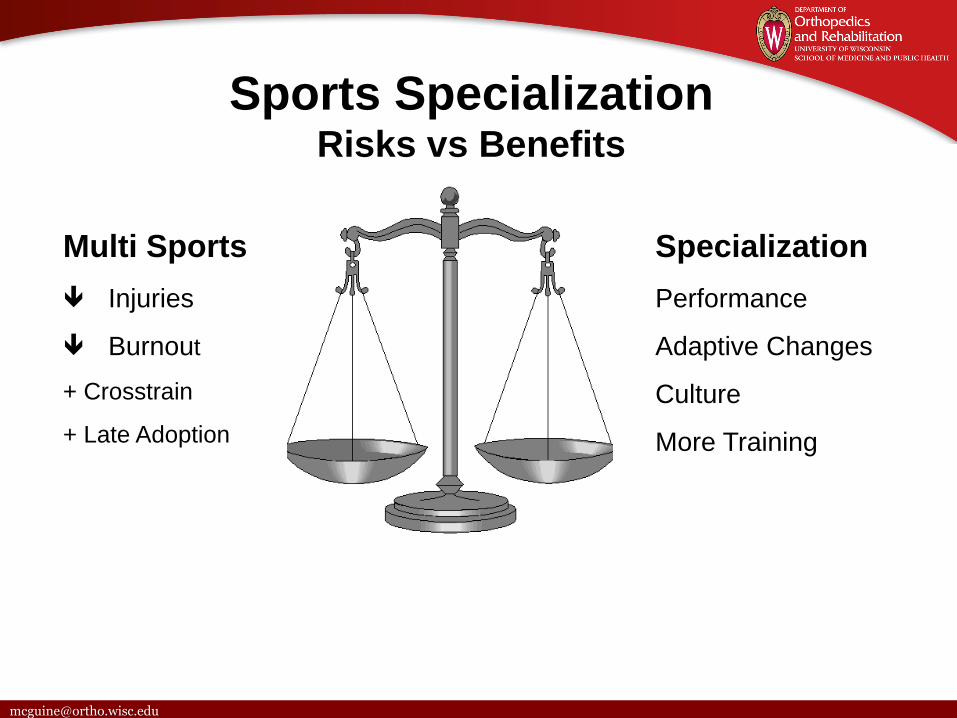
Sports SpecializationRisks vs Benefits
Multi Sports
Injuries
Burnout
+ Crosstrain
+ Late Adoption
Specialization
Performance
Adaptive Changes
Culture
More Training

Dec 201611
Sport Specialization Defined
“year-round intensive training in a single sport at the exclusion of other sports”.
Sport Specialization
=Single Sport Participation

ATTITUDES AND BEHVIORS
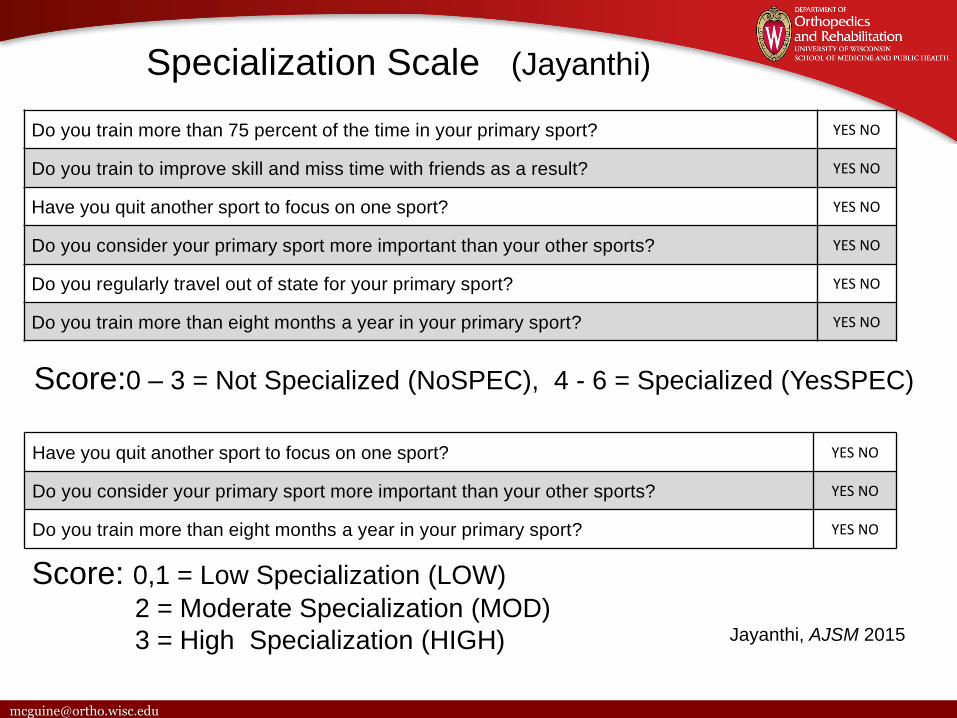
Do you train more than 75 percent of the time in your primary sport? YES NO
Do you train to improve skill and miss time with friends as a result? YES NO
Have you quit another sport to focus on one sport? YES NO
Do you consider your primary sport more important than your other sports? YES NO
Do you regularly travel out of state for your primary sport? YES NO
Do you train more than eight months a year in your primary sport? YES NO
Specialization Scale (Jayanthi)
Score:0 – 3 = Not Specialized (NoSPEC), 4 - 6 = Specialized (YesSPEC)
Have you quit another sport to focus on one sport? YES NO
Do you consider your primary sport more important than your other sports? YES NO
Do you train more than eight months a year in your primary sport? YES NO
Score: 0,1 = Low Specialization (LOW)
2 = Moderate Specialization (MOD)
3 = High Specialization (HIGH) Jayanthi, AJSM 2015

Prevalence of Specialization
Similar youth and high school data
Low25.2%n=507
Moderate37.3%n=749
High37.5%n=754
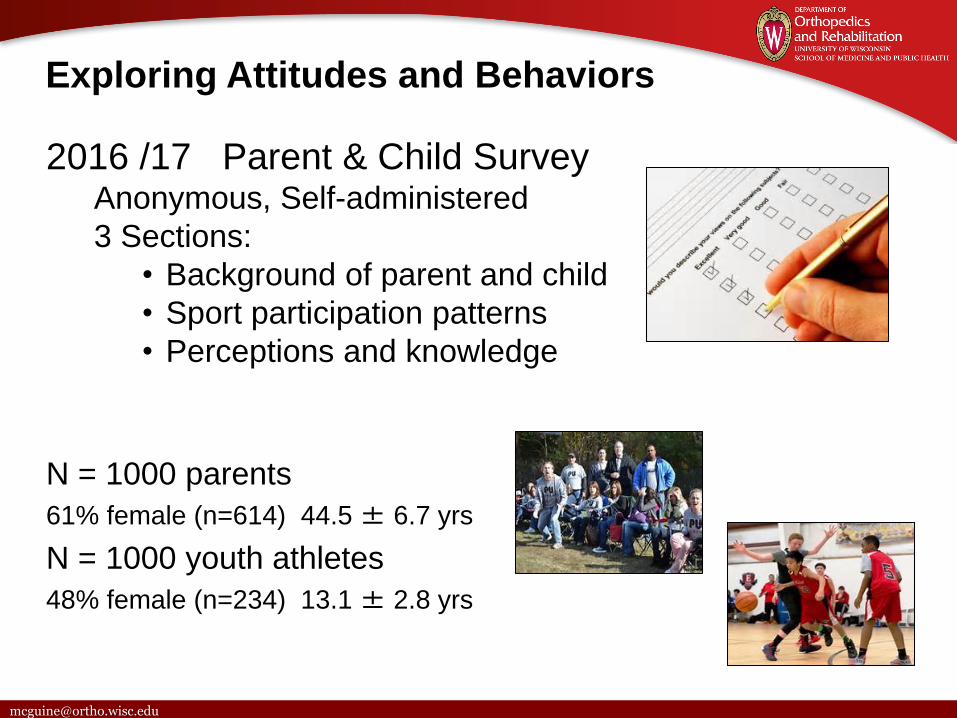
2016 /17 Parent & Child SurveyAnonymous, Self-administered
3 Sections:
• Background of parent and child
• Sport participation patterns
• Perceptions and knowledge
N = 1000 parents
61% female (n=614) 44.5 ± 6.7 yrs
N = 1000 youth athletes
48% female (n=234) 13.1 ± 2.8 yrs
Exploring Attitudes and Behaviors
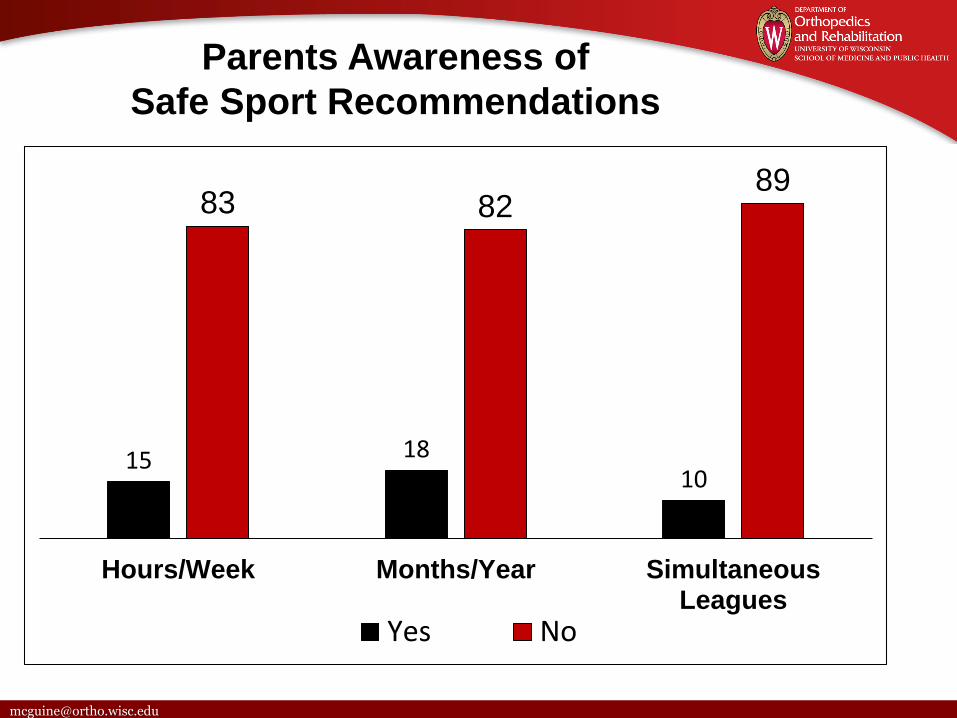
Parents Awareness of
Safe Sport Recommendations
15 1810
83 8289
Hours/Week Months/Year SimultaneousLeagues
Yes No
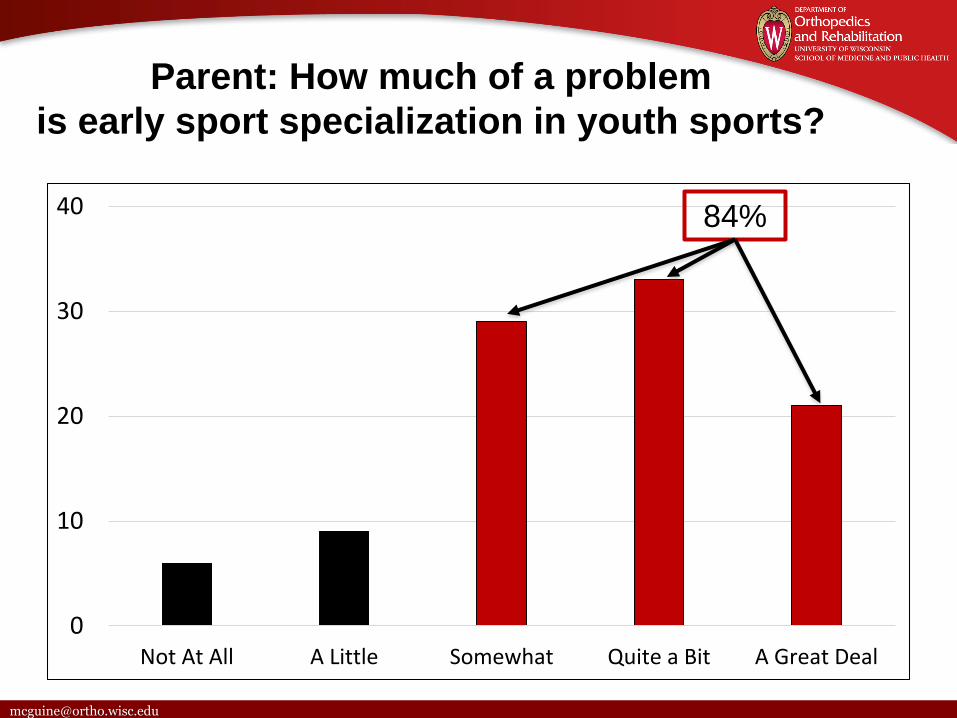
Parent: How much of a problem
is early sport specialization in youth sports?
0
10
20
30
40
Not At All A Little Somewhat Quite a Bit A Great Deal
84%
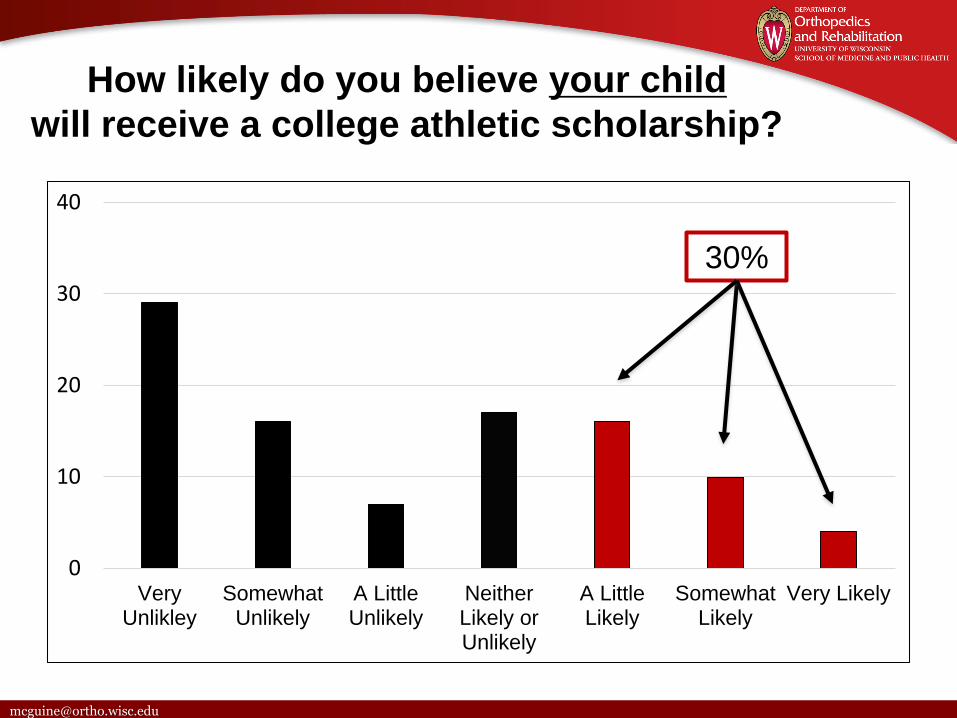
How likely do you believe your child
will receive a college athletic scholarship?
0
10
20
30
40
VeryUnlikley
SomewhatUnlikely
A LittleUnlikely
NeitherLikely orUnlikely
A LittleLikely
SomewhatLikely
Very Likely
30%
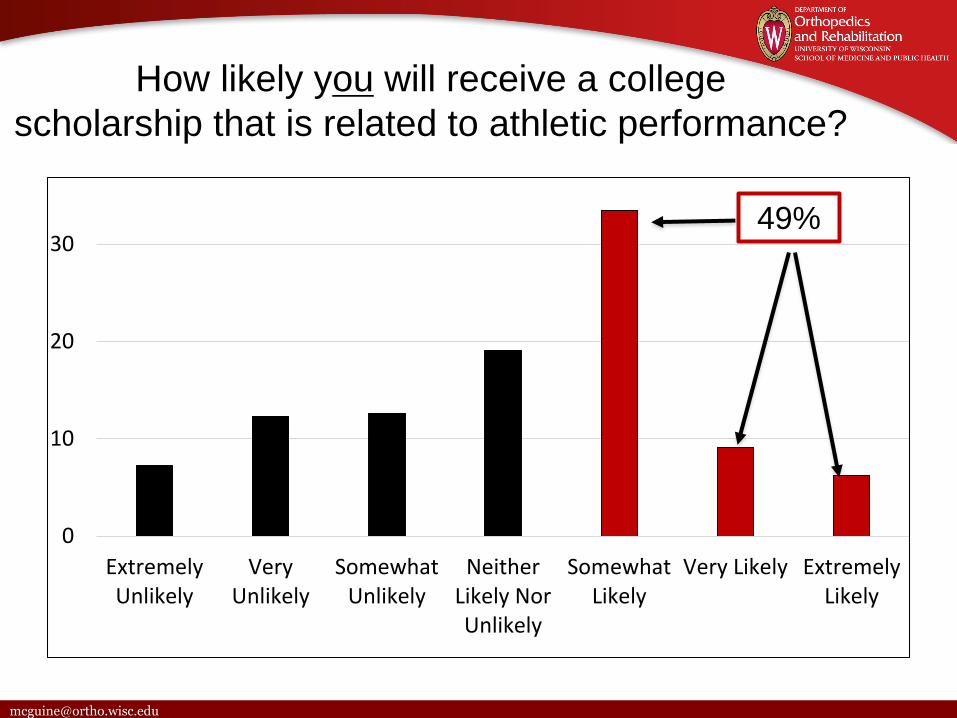
How likely you will receive a college
scholarship that is related to athletic performance?
0
10
20
30
ExtremelyUnlikely
VeryUnlikely
SomewhatUnlikely
NeitherLikely NorUnlikely
SomewhatLikely
Very Likely ExtremelyLikely
49%
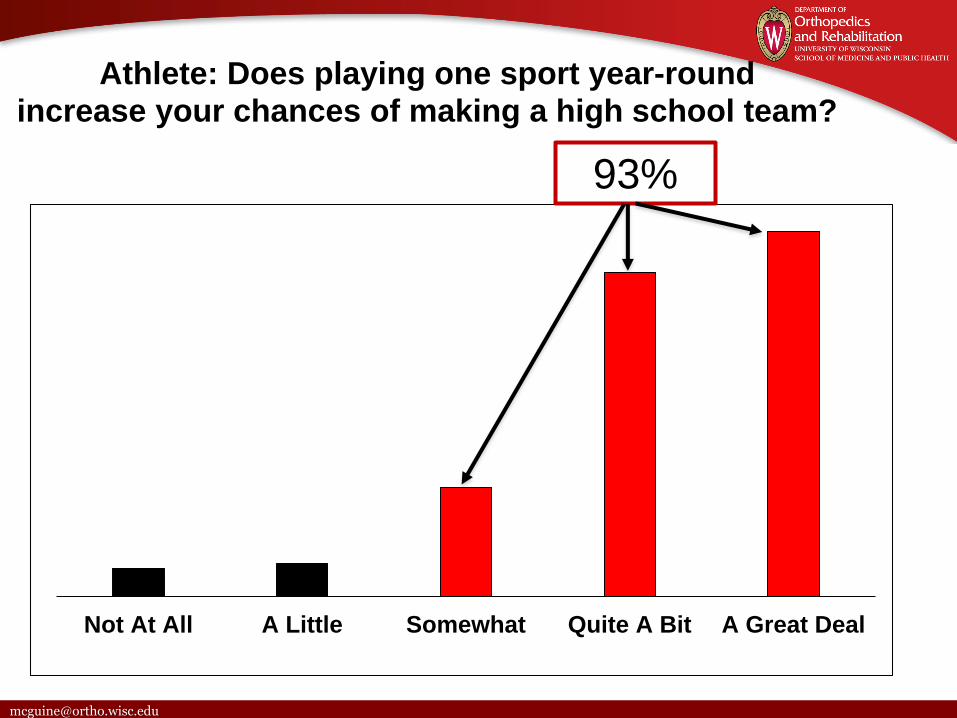
Athlete: Does playing one sport year-round increase your chances of making a high school team?
Not At All A Little Somewhat Quite A Bit A Great Deal
93%
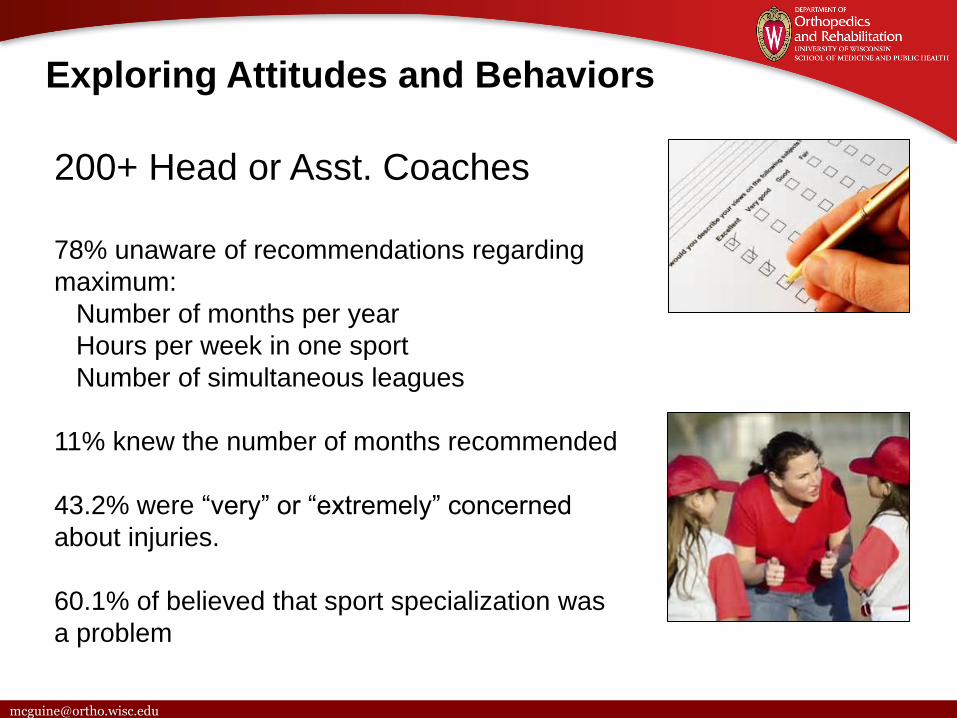
200+ Head or Asst. Coaches
78% unaware of recommendations regarding
maximum:
Number of months per year
Hours per week in one sport
Number of simultaneous leagues
11% knew the number of months recommended
43.2% were “very” or “extremely” concerned
about injuries.
60.1% of believed that sport specialization was
a problem
Exploring Attitudes and Behaviors
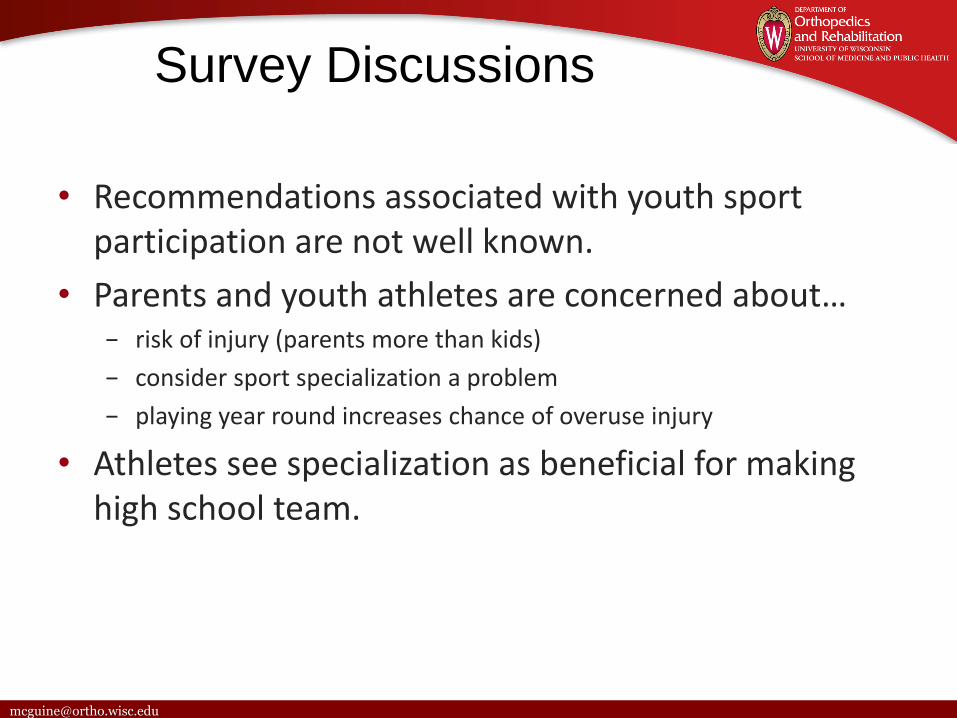
Survey Discussions
• Recommendations associated with youth sport participation are not well known.
• Parents and youth athletes are concerned about…− risk of injury (parents more than kids)
− consider sport specialization a problem
− playing year round increases chance of overuse injury
• Athletes see specialization as beneficial for making high school team.

INJURY RISKS
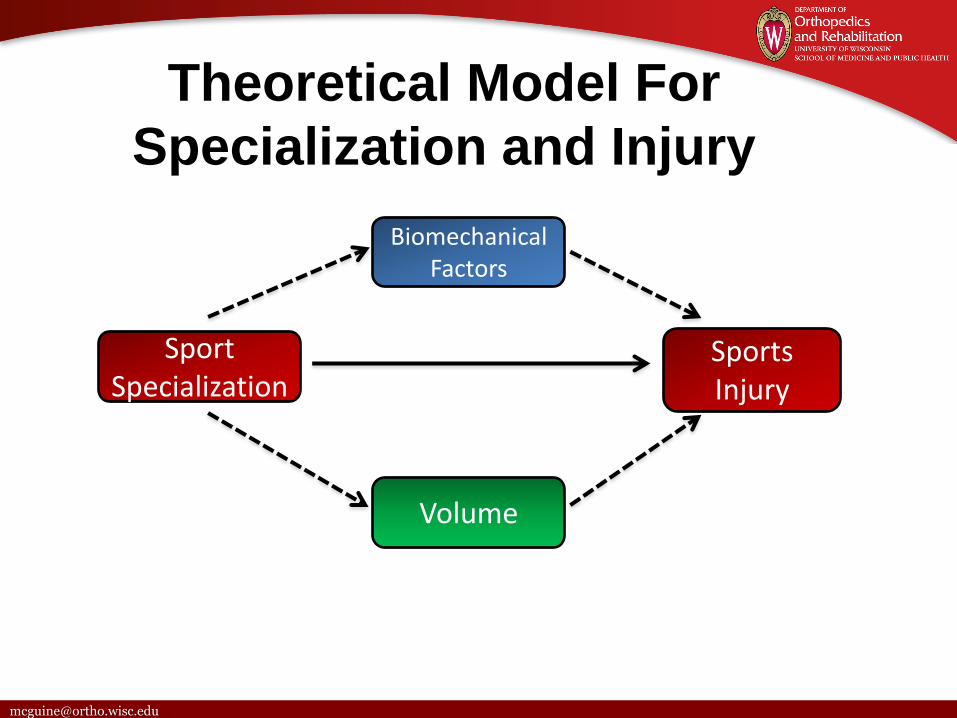
Sport Specialization
Biomechanical Factors
SportsInjury
Volume
Theoretical Model For
Specialization and Injury

Dec 201626
Previous Evidence
Jayanthi NR and Labella C. Sport specialized
training and risk of injury - Am J Sports Med 2015
Hall. Sports Specialization and Anterior Knee Pain
in Females - J Sport Rehab 2015
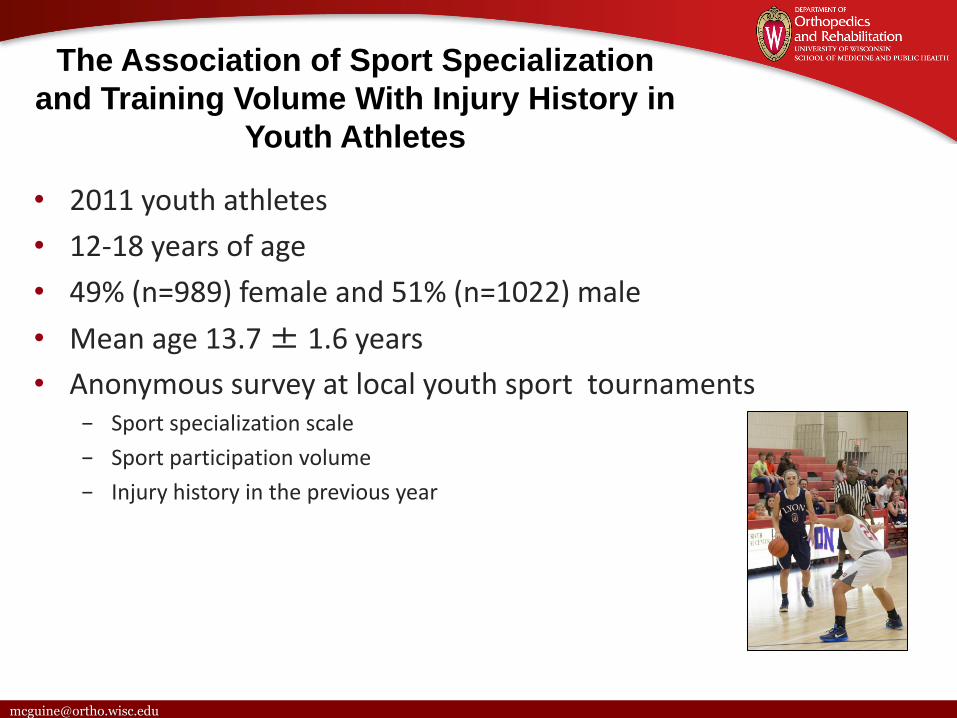
The Association of Sport Specialization
and Training Volume With Injury History in
Youth Athletes
• 2011 youth athletes
• 12-18 years of age
• 49% (n=989) female and 51% (n=1022) male
• Mean age 13.7 ± 1.6 years
• Anonymous survey at local youth sport tournaments− Sport specialization scale
− Sport participation volume
− Injury history in the previous year
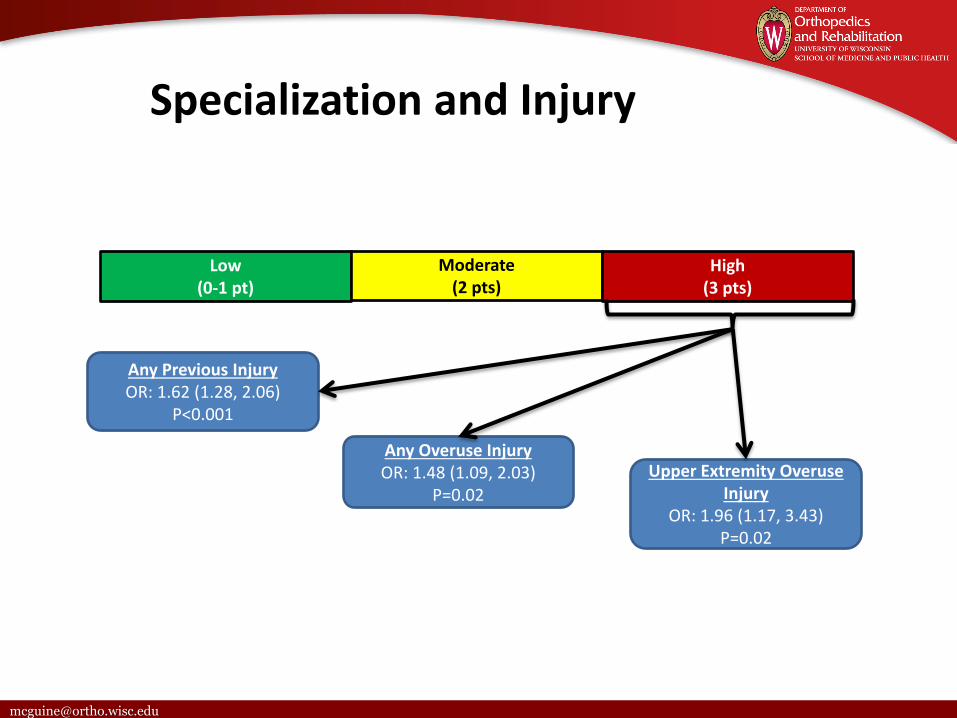
Specialization and Injury
Low (0-1 pt)
Moderate(2 pts)
High(3 pts)
Any Overuse InjuryOR: 1.48 (1.09, 2.03)
P=0.02
Upper Extremity Overuse Injury
OR: 1.96 (1.17, 3.43)P=0.02
Any Previous InjuryOR: 1.62 (1.28, 2.06)
P<0.001

Months Per Year and Injury
*All analyses adjusted for age and gender
1 3 4 5 76 1282 11109
Any Overuse InjuryOR: 1.60 (1.21, 2.14)
P<0.01
Upper Extremity Overuse Injury
OR: 1.68 (1.06, 2.80)P=0.049
Lower Extremity Overuse Injury
OR: 1.66 (1.22, 2.30)P<0.01
ConcussionOR: 1.61 (1.08, 2.47)
P=0.03
Dec 201630
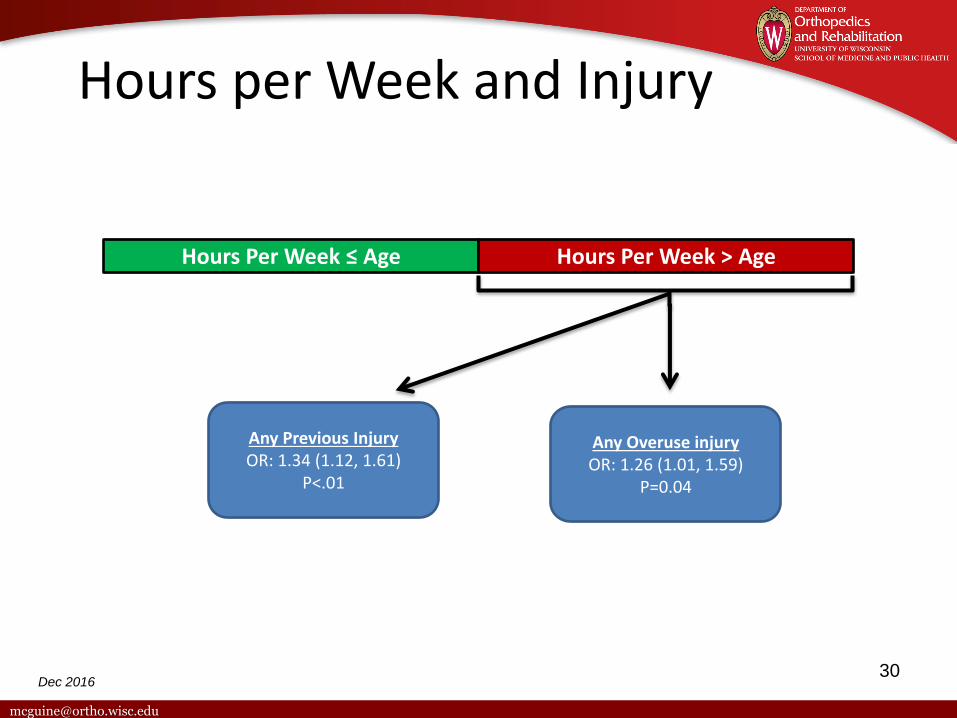
Hours per Week and Injury
Hours Per Week ≤ Age Hours Per Week > Age
Any Overuse injuryOR: 1.26 (1.01, 1.59)
P=0.04
Any Previous InjuryOR: 1.34 (1.12, 1.61)
P<.01

Dec 201631
Previous Injury Research
Limitations: Small studies
Convenience samples
Retrospective designs
Descriptive findings
Limited injury focus
Simple analyses
Alternatives: Prospective design
Population samples
Direct data collection
Broad injury focus
Rigorous data analyses

Dec 201632
Solution….. a New study
Prospective
Diverse school sample
Enroll actual athletes from multiple sports
Collect baseline data and record all exposures
Licensed medical providers (AT’s) collect data
on specific injuries (lower extremity).
Analyses include: Multivariate analyses with Cox Proportional Hazard Modeling

Data collection: 2015/16 academic year
Sites: 29 WI high schools ATs in with WISIRN
Subjects: (male and female, interscholastic athletes in grades 9-12).
Baseline Data: Previous time loss LEI
Club and interscholastic sports
Primary Sport
Competition volume
Specialization Scale (Jayanthi)
Daily Athletic Exposures (AE): All practices and games.
Injury Data: AT’s record onset, injury type, days lost etc.
Analyses: %, days lost due to injury (Med [IQR 25th,75th], Odds Ratios
(OR, [95%CI]) Chi Square, Fishers exact tests, Cox hazards models.
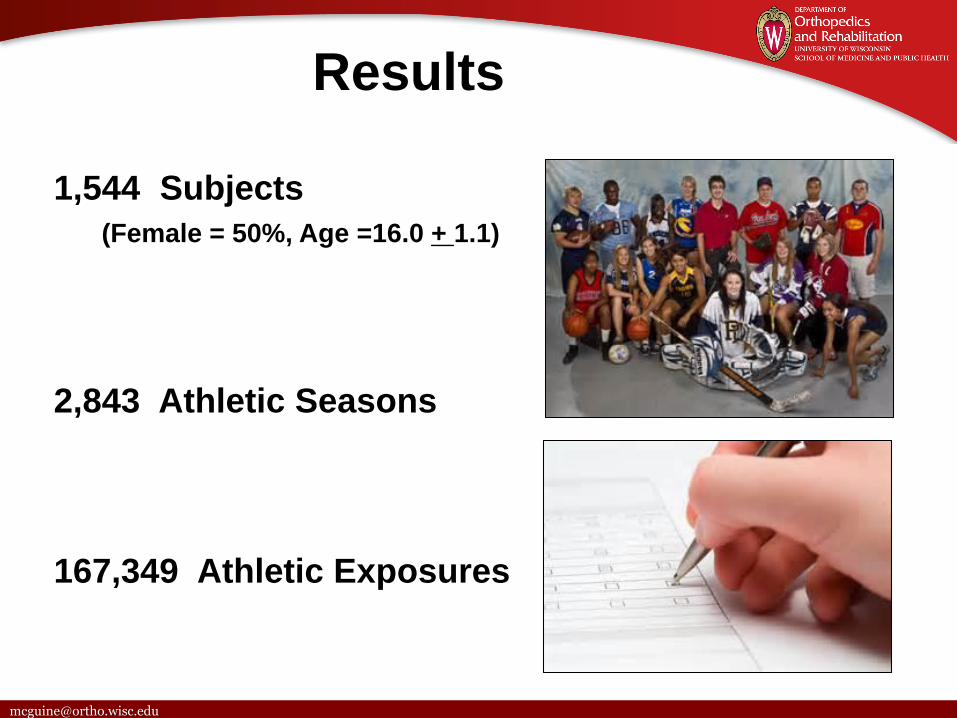
Results
1,544 Subjects
(Female = 50%, Age =16.0 + 1.1)
2,843 Athletic Seasons
167,349 Athletic Exposures

Variables (%) Variables (%)
Sex Previous LEI*
Female 50.5 No 68.3Male 49.5 Yes 31.7
Grade Primary sport league
9 27.1 No 50.310 27.1 Yes 49.211 24.7
12 20.1 Primary sport competitions Low (< 30) 52.8
Primary Sport Moderate (30 - 60) 30.0Basketball 21.4 High (> 60) 17.2Soccer 20.2
Football 17.0
Volleyball 15.9
Baseball / Softball 8.5
Tennis 4.3
Track / XC 4.0
Wrestling 2.3
Other1 11.3
Subject Demographics
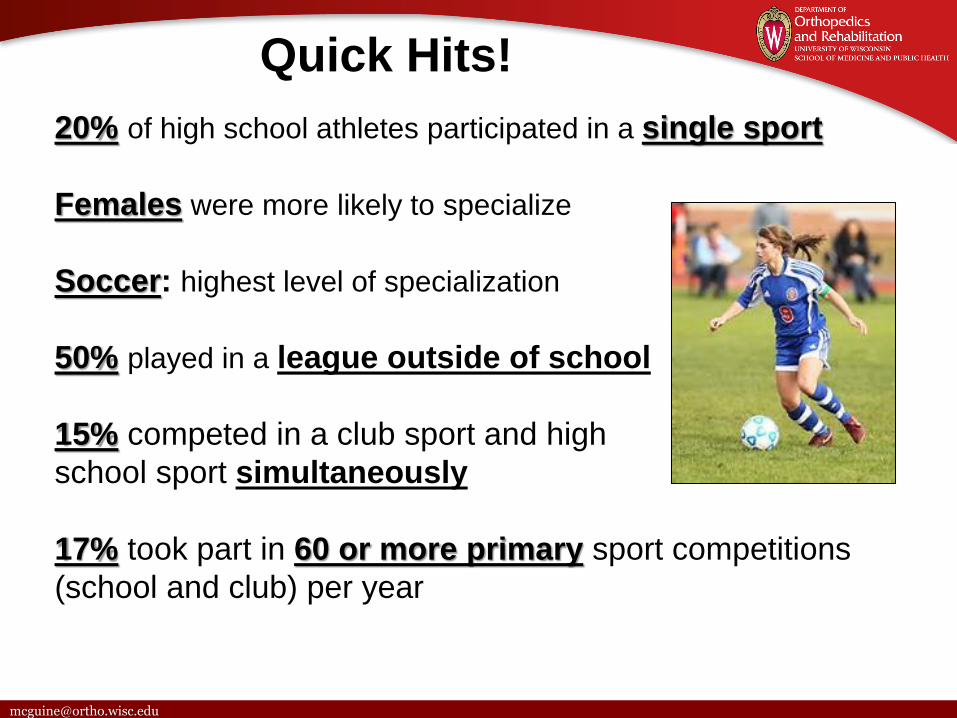
20% of high school athletes participated in a single sport
Females were more likely to specialize
Soccer: highest level of specialization
50% played in a league outside of school
15% competed in a club sport and high
school sport simultaneously
17% took part in 60 or more primary sport competitions
(school and club) per year
Quick Hits!
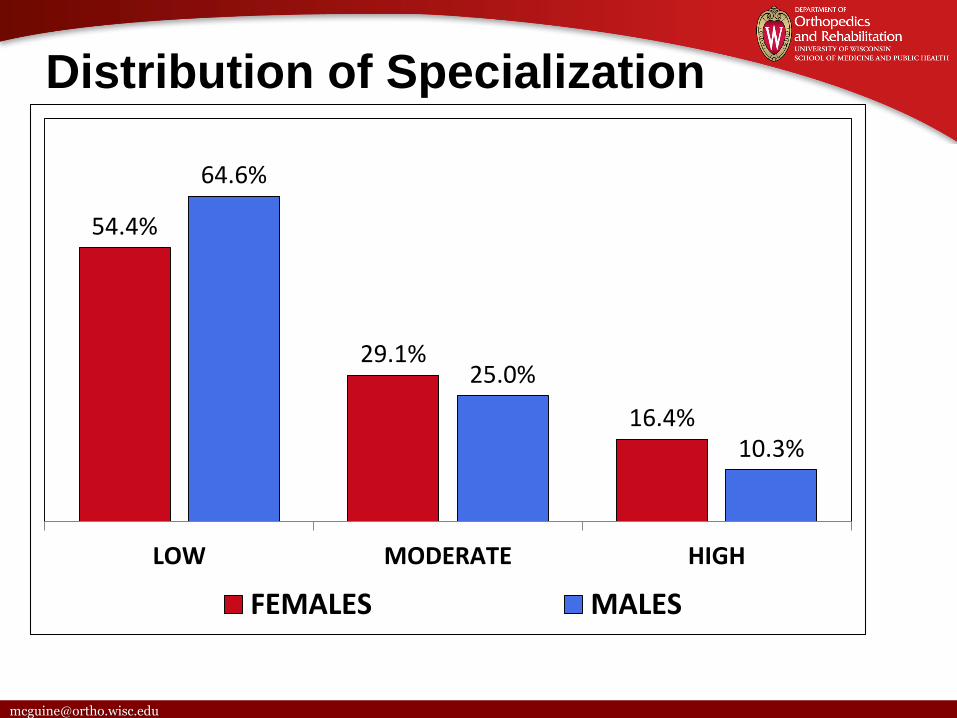
Distribution of Specialization
54.4%
29.1%
16.4%
64.6%
25.0%
10.3%
LOW MODERATE HIGH
FEMALES MALES

Distribution of Specialization
0%
10%
20%
30%
40%
50%
SOCCER VOLLEYBALL BASKETBALL FOOTBALL
MODERATE HIGH
53%47%
44%
18%
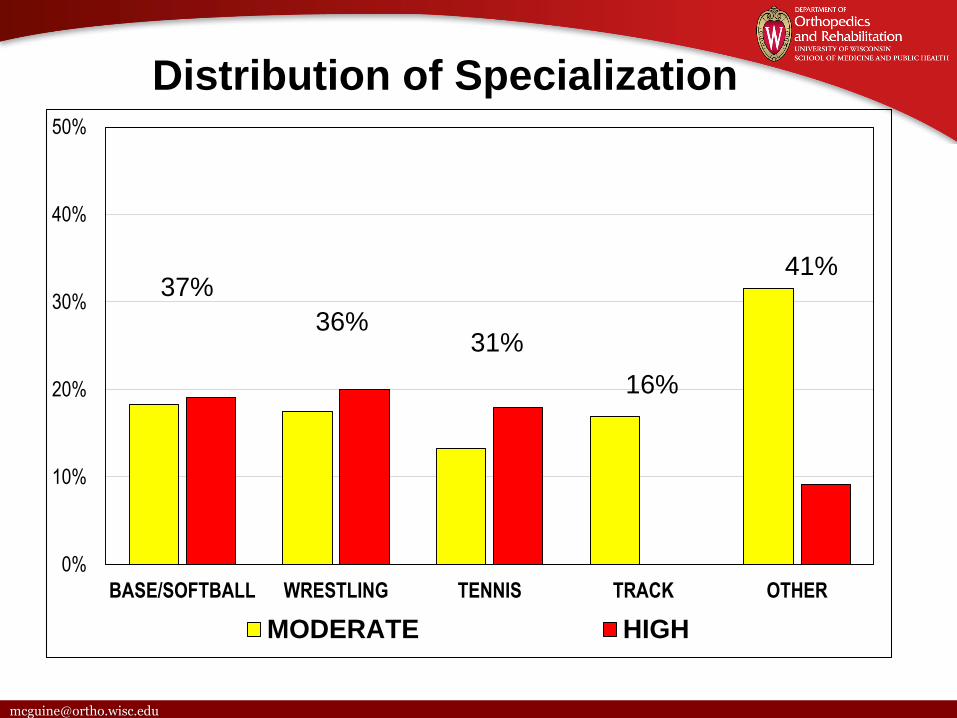
Distribution of Specialization
0%
10%
20%
30%
40%
50%
BASE/SOFTBALL WRESTLING TENNIS TRACK OTHER
MODERATE HIGH
37%
36%31%
16%
41%

A Prospective Study on the Impact of Sport
Specialization on Lower Extremity Injury Rates
in High School Athletes
Am J Sports Med 2017; 45(12): 2706–2712
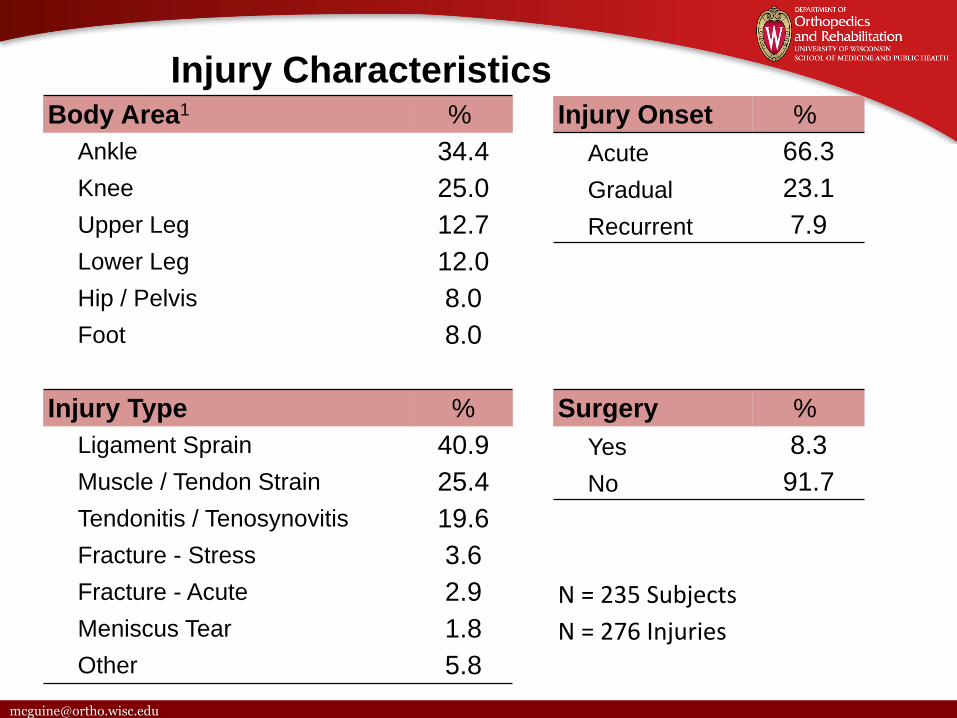
Body Area1 % Injury Onset %
Ankle 34.4 Acute 66.3
Knee 25.0 Gradual 23.1
Upper Leg 12.7 Recurrent 7.9
Lower Leg 12.0
Hip / Pelvis 8.0
Foot 8.0
Injury Type % Surgery %
Ligament Sprain 40.9 Yes 8.3
Muscle / Tendon Strain 25.4 No 91.7
Tendonitis / Tenosynovitis 19.6
Fracture - Stress 3.6
Fracture - Acute 2.9 N = 235 Subjects
Meniscus Tear 1.8 N = 276 Injuries
Other 5.8
Injury Characteristics

Medical provider % School AT 67.6
Primary Care Provider 24.1
ER / ED 8.2
Other 1.1
DiagnosticsX-RAY 30.9
MRI 15.4
CT 1.2
Surgery
YES 8.3
Actions Taken for New LEI

New LEI Incidence (3 pt. scale)
12.2%
18.9%21.3%
LOW MOD HIGH
Multivariate Cox Hazards Ratios
MOD: 1.51 (1.04 - 2.20), p = 0.029 HIGH: 1.85 (1.12 - 3.06) p = 0.017
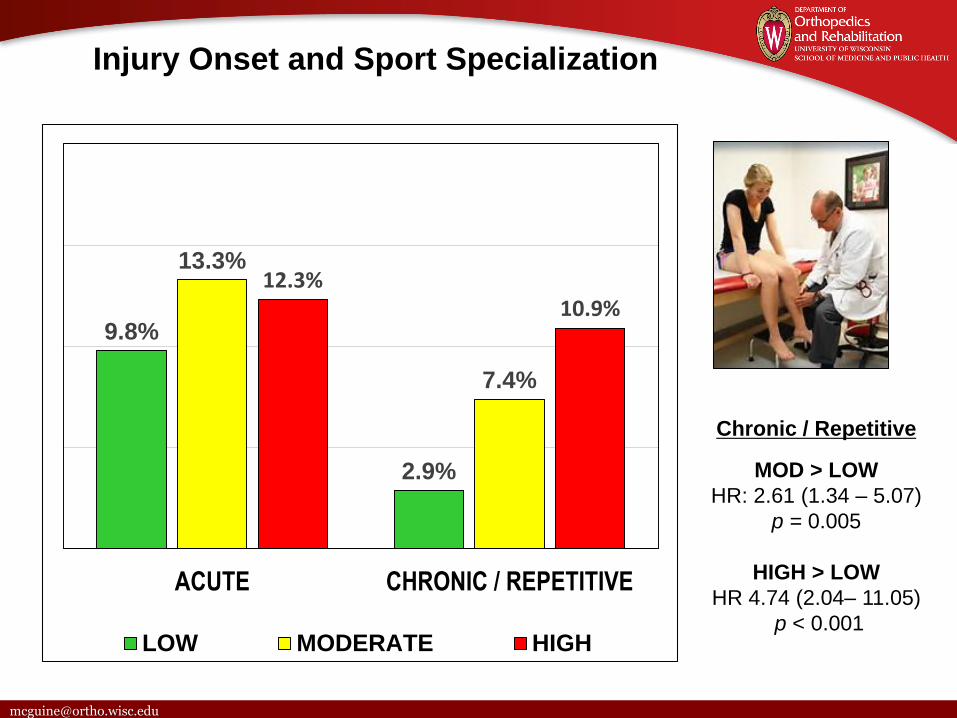
Injury Onset and Sport Specialization
9.8%
2.9%
13.3%
7.4%
12.3%10.9%
ACUTE CHRONIC / REPETITIVE
LOW MODERATE HIGH
Chronic / Repetitive
MOD > LOW
HR: 2.61 (1.34 – 5.07)
p = 0.005
HIGH > LOW
HR 4.74 (2.04– 11.05)
p < 0.001

Question:
Does sport specialization increase the incidence of LEI
equally in both males and female athletes?
New Analyses: A total of N = 902 subjects in paired sports
(Baseball / Softball, Basketball, X–Country,
Soccer, Tennis and Track)
95,444 athletic exposures
HIGH subjects was 2X higher than LOW!
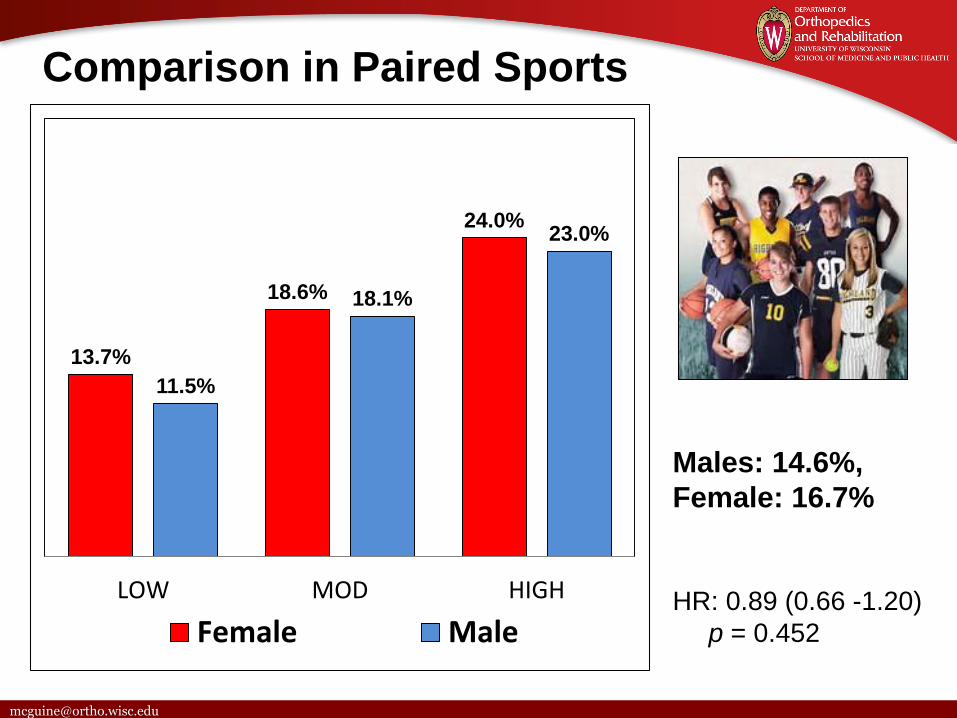
Comparison in Paired Sports
13.7%
18.6%
24.0%
11.5%
18.1%
23.0%
LOW MOD HIGH
Female Male
Males: 14.6%,
Female: 16.7%
HR: 0.89 (0.66 -1.20)
p = 0.452

Ankle Sprain (3 pt. scale)
5.6%
9.4%10.5%
LOW MOD HIGH
Multivariate Cox Hazards Ratios
Mod vs Low: 1.66 (1.01 - 2.73) High vs Low: 2.12 (1.06 - 4.26)

Discussion
The first Study to prospectively document
the association between sport specialization
and risk of LEI
MOD specialized > 50% incidence
of LEI than LOW
HIGH specialized > 85% incidence
of LEI than LOW
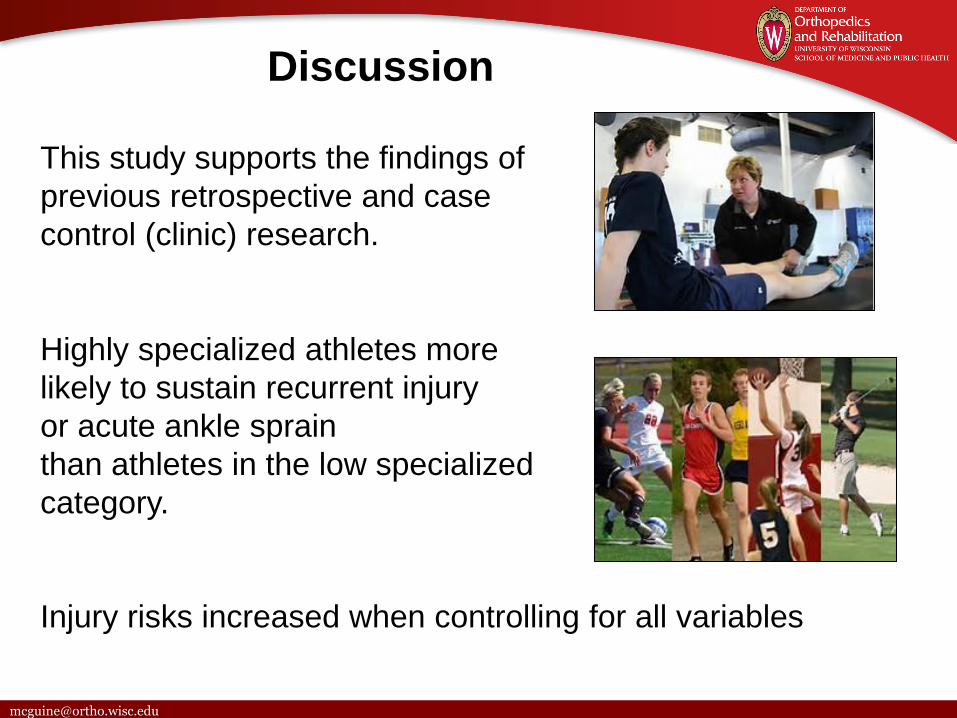
Discussion
This study supports the findings of
previous retrospective and case
control (clinic) research.
Highly specialized athletes more
likely to sustain recurrent injury
or acute ankle sprain
than athletes in the low specialized
category.
Injury risks increased when controlling for all variables
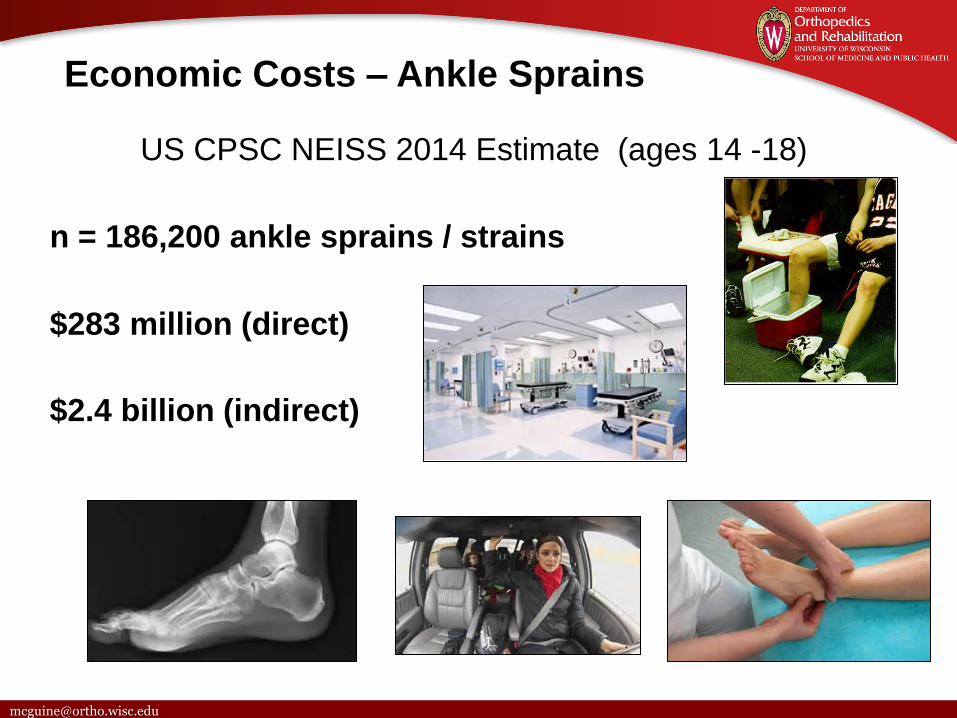
Economic Costs – Ankle Sprains
US CPSC NEISS 2014 Estimate (ages 14 -18)
n = 186,200 ankle sprains / strains
$283 million (direct)
$2.4 billion (indirect)

Limitations
Recall bias
All data collected in a single state
Some sports not represented
Did not measure injuries in club sports

Upper Extremity InjuriesTarget: Baseball, Softball, Swim, Tennis & Volleyball
Sample: US high schools (50 states)
Subjects: N = 5000+
Data Collection: Web based
Longitudinal Studies
Target: 10,000 youth athletes
Sample: Multi-state
Subjects: 8 yr. – 10yr. male and female
Data Collection: 10 Years
Future Epidemiology Research
STUDY IMPLICATIONS
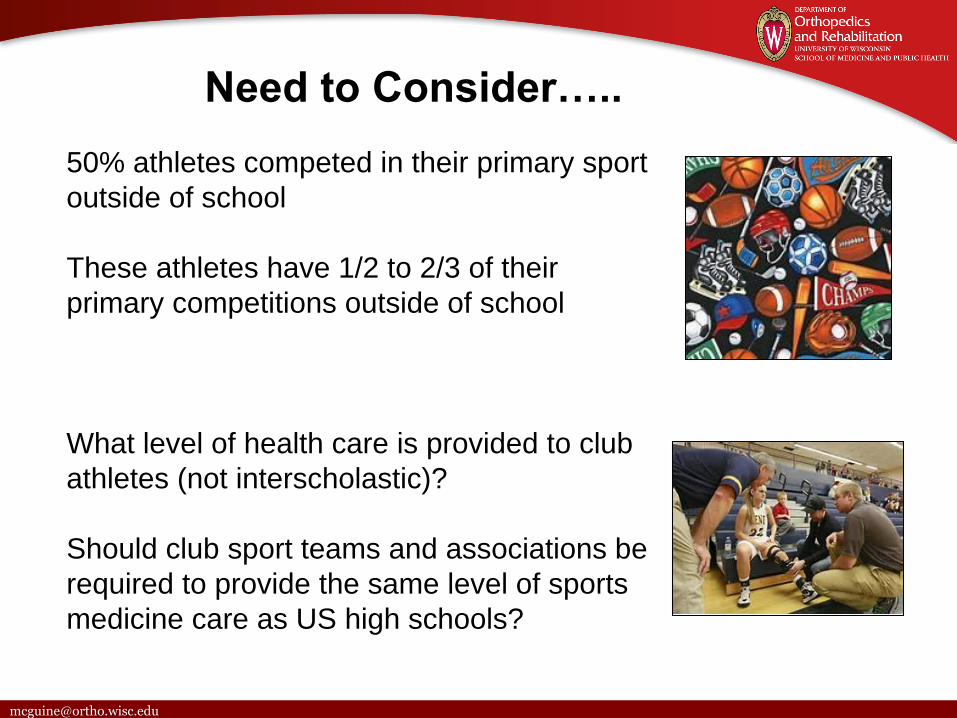
50% athletes competed in their primary sport
outside of school
These athletes have 1/2 to 2/3 of their
primary competitions outside of school
What level of health care is provided to club
athletes (not interscholastic)?
Should club sport teams and associations be
required to provide the same level of sports
medicine care as US high schools?
Need to Consider…..

What about kids who “can’t afford” to
play on a club team?
Are these kids given the message they
shouldn’t participate in high school sports?
Specialization $ Costs
SOULTIONS FOR HIGH SCHOOLS

High School Administrators
Educate your coaches!
Get them on board
Share your concerns and
expectations
Booster clubs, parents and athletes
Volume recommendations (months/year, hours/week)
Caution against playing multiple sports/leagues
simultaneously
Participate in an injury prevention program!
Dec 201659
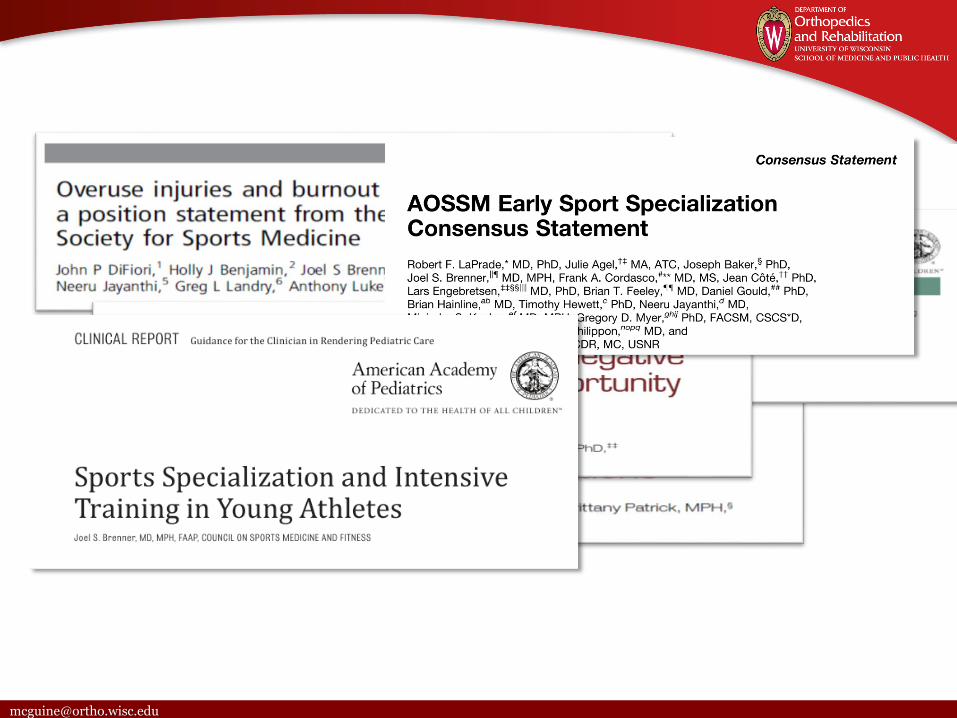
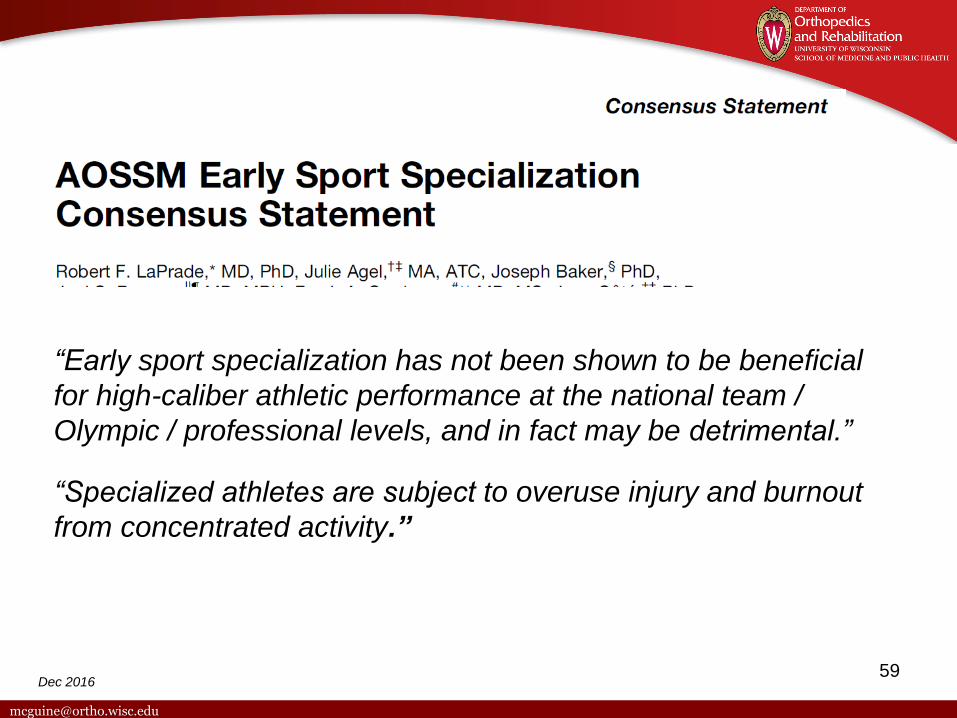
“Early sport specialization has not been shown to be beneficial
for high-caliber athletic performance at the national team /
Olympic / professional levels, and in fact may be detrimental.”
“Specialized athletes are subject to overuse injury and burnout
from concentrated activity.”
in Young Athlete
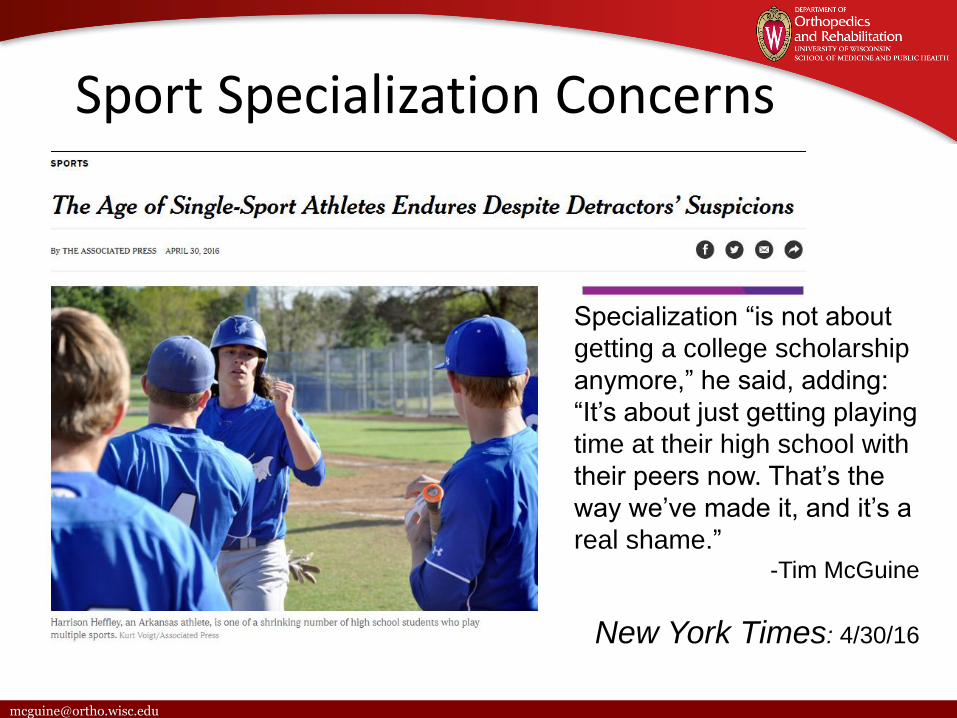
Specialization “is not about
getting a college scholarship
anymore,” he said, adding:
“It’s about just getting playing
time at their high school with
their peers now. That’s the
way we’ve made it, and it’s a
real shame.”-Tim McGuine
New York Times: 4/30/16
Sport Specialization Concerns