Sponsored by: Presented by - cdn.promatshow.comcdn.promatshow.com/seminars/assets-2013/679.pdf ·...
60
Page 1 2013 MHI™ Copyright claimed as to audiovisual works of seminar sessions and sound recordings of seminar sessions. All rights reserved. Sponsored by: Presented by: Dr. Padideh Gützkow Ports & Maritime Logistics Trends
Transcript of Sponsored by: Presented by - cdn.promatshow.comcdn.promatshow.com/seminars/assets-2013/679.pdf ·...

Page 1 2013 MHItrade Copyright claimed as to audiovisual works of seminar sessions and sound
recordings of seminar sessions All rights reserved
Sponsored by Presented by
Dr Padideh Guumltzkow
Ports amp Maritime Logistics Trends
Page 2
Topics on ports and maratime logistics trends
1 Types of marine Ports
2 Processes Technologies and KPIrsquos at ports
3 Stakeholder Models
4 Trends in global container industry
5 Shippers
6 Top world ports
7 Container traffic and utilization
8 Port development
9 World Trade Flows
10 Container Vessels
11 US Ports
12 Share of Routes to US ports
13 Panama Canal
14 Behind the ports The North American Distribution Market
15 Siemens solutions
Page 3
Topic 1
Multiple and single purpose
Layout and equipment depends on port type
Types of marine Ports
Page 4
Type of marine ports
Multiple purpose and single purpose
Location at
Oceans Seas Gulfs Bays Straits Fjords hellip
Marine ports
Location at
Rivers Channels Lakes hellip
Multiple purpose Single purpose Multiple purpose Single purpose
Container
Dry Bulk Coal Iron Corm Sulfad hellip
RoRo amp break bulk Cars forest agro paper
Liquid Bulk LNGampLNP (Oil Gas Biol
Ferries Passenger AIDA Passenger ships)
Quantity 1917 Quantity 1627 Quantity 1336 Quantity 945 Quantity 1181
Source wwwportscom
Service ports Docks Werften
Military Ships
Submarine UBoot
Marinas Privat use
Fishing
httpwwwogjcomindextransportationlnghtml
httpwwwenergycagovlngworldwide_africahtml
httpwwwogjcomindexhtml
httpportscom
httpenwikipediaorgwikiCategoryLists_of_ports
Ports world wide 8297
Africa 421
Antarctic 13
Asia 172
Europe 3028
North America 2293
Oceania 373
South America 453
Page 5
Port lay-out and equipment depends on port type
Different types of terminal handle different cargo
Note Ferries can also be RORO
Container
Dry Bulk Coal Iron Corm Sulfad hellip
RoRo amp break bulk Cars forest agro paper
Liquid Bulk LNGampLNP (Oil Gas Bio)
Ferries Passenger Passenger ships)
Service ports Docks
Military Ships
Submarine
Marinas Private use
Source wwwportscom
httpwwwogjcomindextransportationlnghtml httpwwwenergycagovlngworldwide_africahtml
httpwwwogjcomindexhtml
Page 6
Topic 2
Process in a container terminal
Terminal Fields of Activity
Indicators commonly used by terminal
operators
Processes Technologies and KPIrsquos
Page 7
Process in a container terminal
0
Page 8
Terminal Fields of Activity
Page 9
Indicators commonly used by terminal operators
KPI Unit of
measure Definition
Vessel turnaround time Hour Time the vessels stay in the port
Cargo damage rate Ration of damaged goods to the total handled goods
Accident rate Numberthousand
of ships
The ratio of the number of accidents (broken down by type) to the number of vessels
Closure days Day The total time a port was closed eg because of bad weather or strikes
Total
Vessel waiting time Hour Total time the vessel takes to reach its mooring berth from the time it ldquocallsrdquo
Cargo dwell time Day The average time goods spend in the port storesyards
EDI accuracy TBD The ratio of inaccurate information compared to total information sent by carrier
Actual vs pro forma
moves Number of moves
Comparison of number of moves planned for a vessel in pro forma vs actual number of moves
Crane productivity MovesHour Ratio of the moves completed by a crane to operating time of that particular crane
Berth productivity UnitsHour
MovesHour
The average rate at which the vessel is loadedunloaded
Vessel productivity UnitsHour
MovesHour
Same rate as above but measured as the ratio of the load to the vessel turnaround time
Truck turnaround time Hour The average time a truck spends in the port
Berth occupancy The ratio of the total number of berth to the total number of berth hours available
Crane OEE The ratio of the ideal time the crane would require to complete the moves it carried out to
total available time for that crane
Crane split NA Total moves of the call divided by the largest number of moves in the bay
Housekeeping moves Number of moves Number of housekeeping moves carried out at the yard
Planning
Operations
Page 10
Topic 3
Typical ownership models at ports
Overview on stakeholders at a port
Stakeholder structure
Stakeholder Models
Page 11
Typical ownership models at ports
Mode of
Ownership Land area
Terminal
Infrastructure
Terminal
Superstructure
Quayside
Operations
Landside
Operations Examples
100 state
owned amp
operated
State owned
Owned and
construced by
port authority
State owned Port authority Port authority Haifa (Israel) Durban
(South Africa)
Leased
terminal State owned
Owned and
constructed by
port authority
Privately owned
or rented from
port authority
Terminal operator Terminal operator Oakland Container
Terminal (USA) ECT
(Rotterdam)
Concession
agreement
State owned
Owned and
construced by
port authority
Privately owned Terminal operator Terminal operator Port 2000 le Havre
(France) Santos
Brasil
(Brazil)
BOT
concession State owned
Construction
privately owned
Privately owned Terminal operator Terminal operator Laem Chabang
International Terminal
(Thailand) JNPT
(Indria)
100 privately
owned
Privately
owned
Privately owned Privately owned Terminal operator Terminal operator Teesport (UK)
Liverpool (UK)
Source Drewry 2010
Page 12
Overview on stakeholders at a port
Port Authorities are landlords and own the ground provide
access to the port (streets bridges) supply water power
and safety amp security
Port Authorities address environmental impacts to deal with
projected growth in trade
Port Authority creates rules in regards to fees
Terminal operators are responsible for all means of storage
and handling the terminal (inclusive the gates)
Operators arrange contracts with railroads in regards to on
dock rail
Terminals ask for handling fees
Clients of ports and terminals are freight forwarders rail
operators and carriers
Stakeholder overview
Goal is to collaborate with industry partners to accommodate cargo demand and
continuously improve quality of service with customers and supply chain partners
Page 13
Fairly complex stakeholder structure with Terminal
Operator as key customers and decision makers at ports
Ownership
Landlord port is with 75
share the most common
ownership model
This means
Port authority owns the
port and provides the
basic infrastructure
Terminal operators enter
into a concession
contract and invest on
their behalf
Consequently terminal
operators are the main
customers in ports
Source IC MOL 3G VDD Logistics Hubs
OEM Cranes
Decision
Port Authority
Construction OEM
Distributors Equipment
Financing Master Planning
Technical Planning
Influence Owner
Financing Financing
Owner
Consultant
Operator
Concessioner
Project
Integration
Solution
Provider Crane automation
amp control TOS TEMS
Terminal Operator
Page 14
Topic 4
Trends in ports
Political trends
Economic trends
Social trends
Technological trends
Legal trends
Terminal trends
Trends in global container industry
Page 15
Main observed trends in ports
Containerization and larger vessels Standard container
sizes for increasing volumes of non-bulk cargo Larger
Container Vessels Demand for more terminal capacity
Automation of terminal operations Importance of
Transshipment hubs
Total port management
Need for efficient stacking and terminal
management systems
Hinterland transport Efficient hinterland transport
and intermodal network as competitive factor
Extended Gateway concepts to seaport terminals
Bundling of rail and barge container flows in the port
area and the development of rail and barge shuttles
Horizontal and vertical integration Need for improved
cooperation between stakeholders
Better data exchange between all stakeholders
Optimized end-to-end supply chain
Security and Environment ISPS code to protect terminal
facilities against terrorist penetration 100 X-ray of
containers to US
Container and ship screening
Reduce CO2 emissions
Optimize energy utilization and energy consumption
1
2
3
4
Ports Main observed trends
Source Future of Hubs Team
Page 16
Major Political Trends in Container Market
and their Impact on Market Participants
Strained public budgets
Necessity to attract private
investment (eg via PPPs)
for port development
projects
Increasing privatisation of
port operations
High potential in emerging
markets but limited by
(weak) legal frameworks
Political Trends
Investments in seaport projects with private participation in
developing countries 1990ndash2008 Featured Indicator1990-2009 Value
Number of countries with private participation 59
Projects reaching financial closure 353
Region with largest investment share East Asia and Pacific (38)
Type of PPI with largest share in investment Greenfield project (50)
Type of PPI with largest share in projects Concession (48)
Projects cancelled or under distress 8 representing 2 of total
investment
Source World Bank and PPIAF PPI Project Database
Impact on Authorities
Focus on utilities and infrastructure
investmentmaintenance
Investment decision increasingly
driven by private entities
Changes in procurement decision
making
Changes in product demand
Impact on Suppliers
Impact on Operators
Private investment not only in
equipment but also in infrastructure
Impact on Logistics
Private investment not only in
equipment but also in infrastructure
Page 17
Major Economic Trends and Their Impact on Market
Participants
Resumption of global
economic growth after
economic crisis (BRIC
countries)
Continuation of trade
liberalisation (BRIC
countries emerging
markets)
Increase in containerisation
Trade growth and area
limitations in existing
terminals (Far East Middle
East)
Competitive pressures for
continuous improvement
efficiency and cost structure
Consolidation in
international port sector
Increasing influx of private
capital
Economic Trends Impact on Authorities
Increasing demand for terminal
capacity and sufficient hinterland
access
Investment in new quay and
roadrail infrastructure
Investment in new
equipmentinfrastructure
Demand for automated terminal
operations
Investment in new warehousing
facilities
Improved area utilisation via
automation
Impact on Suppliers
Impact on Operators
Increasing demand for terminal
capacity
Need for efficient stacking and
terminal management systems
Impact on Logistics
Increasing demand for warehousing
capacity
Need for efficient stacking and
warehousing mgmt systems
Page 18
Social Trends amp Their Impact on Market Participants
Social acknowledgement of
importance of port
infrastructure for economic
welfare
Desire to shift port operations
out of inner city locations
Discontent about port related
congestion on public road
infrastructure
But NIMBY phenomena
ldquoNot In My Backyardrdquo
Social Trends Impact on Authorities
Necessity to move
Demand for existing products
Demand for new products new
markets
Impact on Suppliers
Impact on Operators
Necessity to move
Impact on Logistics
Opens new possibilities new service
concepts
Example Khalifa Port UAE
Page 19
Technological Trends and Their Impact on Market
Participants
152
164
170192
69
107
57
5034
05
Capacity by vessel size 2014
10000 - 15000
7500 - 9999
5100 - 7499
4000 - 5099
3000 - 3999
2000 - 2999
1500 - 1999
1000 - 1499
500 - 999
100 - 499
Increasing vessel sizes (up to
18000 TEU on order)
Increasing automatisation of
terminal operations in developed
world
IT based interfaces and
coordination between
stakeholders
Technological Trends Impact on Authorities
Need for efficient hinterland intermodality
Need for improved cooperation between
stakeholders
Demand for increased water depth and
improved quay infrastructure
Demand for hinterland infrastructure that
can cope with extreme peak situations
Demand for bigger vessel handling
equipment
Demand for advanced TOS and
interfaces
Demand for AGV and ASC
Increased system complexity
Demand for advanced interfaces
Impact on Suppliers
Impact on Operators Higher peak loads
New investment requirements
Need for efficient handling systems
Need for improved cooperation with shipping lines
re planning
Impact on Logistics
Higher peak loads
New investment requirements
62
158
185
215
77
128
69
5842 06
Capacity by vessel size 2010
10000 - 15000
7500 - 9999
5100 - 7499
4000 - 5099
3000 - 3999
2000 - 2999
1500 - 1999
1000 - 1499
500 - 999
100 - 499
bdquoAutomation is one of the most practised
means to improve productivity in the modern
economy [] This trend and concept is
continuing in the container-handling industry
especially for the larger sized terminalsldquo
Drewry 2010
Page 20
Legal Trends and Their Impact on Market
Participants
X-Ray Scanning
Equipment Improved Perimeter Protection
ISPS code to protect
terminal facilities against
terrorist penetration
100 X-ray of containers to
US
Increasing quality of
frameworks for privatisation
But NIMBY phenomena
ldquoNot In My Backyardrdquo
Legal Trends Impact on Authorities
Change in operating mode
Demand for cameras fences
scanners etc
Demand for new products
Demand for new technologies
Impact on Suppliers
Impact on Operators
Change in operating mode
Impact on Logistics
Change in operating mode
Page 21
Terminal Gate
Requirements
Opportunities and Constraints for Automation
Hinterland Link
Port Security
Radiation and Detection Systems
Environmental Awareness
Terminal Trends
Page 22
Trends in Future Container Terminals
Stacking Equipment
Increased automation
Full electrification
Horizontal Transport
Increased automation
More flexible such as Lift-AGV
Battery-AGV for fuel savings
Yard Configuration
Container blocks served by
stacking cranes
RMG stacks with end-loaded
container transfer
STS Cranes
Meet specifications of ldquoNew
Panamaxrdquo vessels
(14500+ TEU)
High performance
Environment
Reduction of air pollution
Reduced light amp noise
emissions
Buthellip
Increased amortisation periods
Fixed layouts
Technologies could be like
ZPMC development
FastNet concept by
APM Terminals
Page 23
Topic 5
bull Shippers decision taking criteria
Shippers
Page 24
Shippers decision taking criteria
Criteria How to analyze
Local cargo volume Local incentive policy for local manufacturers and foreign logistics services
providers (with value adding activities)
Terminal handling charge Tariff comparison between ports
Transhipment volume
Comparison between ports of the year-to-year trends of the number of transhipment
containers
Feeder connections Comparison of the number of connections to different ports
Port capacity and berth availability
(congestion in the port)
Comparison of utilization average waiting times vessels during the week and future
expansion plans between ports
Hinterland transport capacity Comparison of rail and barge transit times and frequencies utilization rail of the
involved countries and future expansion plans
Port location At sea or inland central or peripheral
Most important criteria in port choice decisions for shipping lines and the way of analysis
Page 25
Topic 6
Forecast growth in container activity
Top world ports
Page 26
Ranking top world ports ndash
Forecast growth in container activity
9743
10260
8 20
4562
19
4680
18
5068
17
6000
16
6749
15
7008
14
7310
13
7310
12
8581
11
8700
10
10503
9 7
11124
6
11190
5
11955
4
18250
3
21040
2
25002
1
25866
Source Containerization International Source Drewry 2011
World
476prime1
2016
12prime6 35prime7 27prime9
30prime3
12prime9
845prime8 113prime4
2009
5prime1
20prime7
63prime3
14prime1
8prime8
52prime1
31prime1
65prime7 178prime3 79prime4
350prime1
72prime2
39prime8
32prime9
1 Singapore
2 Shanghai
3 Hong Kong
4 Shenzhen
5 Busan
11 Tianjin
12 Kaohsiung
13 Port Klang
14 Antwerp
15 Hamburg Eastern Europe
South Asia
Oceania
Latin America
South East Asia
Far East
West Europe
North America
Africa
6 Guangzhou
7 Dubai
8 Ningbo
9 Qingdao
10 Rotterdam
16 Los Angeles
17 Tanjung Pelepas
18 Long Beach
19 Xiamen
20 New York
New Jersey
Ranking top world Ports
Asian ports rank first top six in 2009
Forecast growth in container activity (mil TEU)
Expected total will be 8458 mil TEU in 2016
2016
2009
Page 27
Topic 7
Forecast
Capacity Utilization today
Container traffic and utilization
Page 28
Forecast Container Traffic Growth
Projected Container Handling Capacity Utilization
619596574551513473
524
2008
+6
201420132012201120102009
Forecast development of world port
handling container traffic (million TEU)
5914213133406679
178
9122530485054
104105
314
Forecast container activity by region (million TEU)
Projected Container Handling Capacity Utilization
63 66 69 71 74
77 80
Source Drewry 2010
Africa Middle
East
Latin
America
North
America
South East
Asia
West
Europe
Far East Eastern
Europe
South
Asia
Oceania
Projected Container Traffic Growth
Page 29
Utilization rates already high today - many terminals
operate close to capacity limits and need efficiency gains
gt90
1353
80-90
1082
70-80
1340
60-70
591
50-60
305
lt50
776
2010-Throughput Million TEU
(Terminals of major operators only)
13 09 13 25 22 21
Implications
Customer need for
technology increasing
terminal performance
Increase berth
productivity (reduced
vessel port stay)
Increase yard
throughput
Throughput and
productivity identified as
a need across
geographies
163 61 68 70 59 66 Number
of terminals
Average
capacity
(in TEU mn)
38 36 41 47 64 64
Large global
operatorsrsquo share
of terminals
2010-Utilization levels
Source Drewry Maritime Research
Page 30
Topic 8
Factors driving demand for infrastructure
investments
Hubs need to find some 830 billion US $
capital expenditure by 2030 for total
infrastructure
Classification of Container Terminal
Development Projects and Investment fields
Port development
Page 31
Factors driving demand for infrastructure investments
at ports
Many ports have realised the need to reduce congestion and minimise delays to earn a profit from rising
imports amp exports
Increased demand for investments in ports and terminals
and supporting infrastructure at ports
Costs due
to delays
Missed berthing
slots
Higher fuel costs
to make up
schedules
Readjusted
scheduldes
Piling of contai-
ners at terminals
due to trans-
portation
bottlenecks
Construction of
larger vessels
Triple E 18000
TEU
Leads to signifi-
cant upgrades
to existing port
infrastructure
Insufficient
access roads
and intermodal
connections
Congestion at
access roads
and intermodal
connections
Source holman fenwick amp willan global investments in ports amp terminals 2011
Page 32
Hubs need to find some 830 billion US $ capital
expenditure by 2030 for total infrastructure
Source holman fenwick amp willan global investments in ports amp terminals 2011
18
834
2
8
1
2
1
Management
amp
Lease
contract
11
3 3
Greenfield
project
78
2
14 2
34
Divestiture
9
3 5
Concession
97
4
26
8
17
Sub Saharan Africa
South Asia Middle East amp North Africa Latin Amerika amp Caribbean Europe amp Central Asia East Asia amp Pacific
Investments in projects by region
US$ millions
3974
5518
4178
8918
2246
13203
US amp million 2006-2009 Source
PPI World Bank Port Investor
Pipal research analysis
375
384
Inter container terminal services
HPH 1209
DPW 1908
APM terminals
2461
PSA Inter- national
2922
CMA CGM
US$ 20 billion
investment
US$ 155 billion
investment
US$ 305 million
investment
US$ 22 billion
investment
Investment from 2000-2009 including airport amp port road rail energy and water investment
There were over the last decade a total port investment of
US$38 billion 195 projects with private port investments (PPI) China (4 billion) India (25 billion)
and Brazil (15 billion) recorded the highest number of PPI investments
Page 33
Classification of Container Terminal Development
Projects and Investment fields
Brownfield
ndashInterferences with general infrastructure project challenges
ndashUpgrading of external and internal infrastructure and terminal equipment
ndashRemoval of abandoned sites
Key focus Commencement date and cost of modification
Terminal Upgrade Conversion
ndash Scope of automation and resulting process changes
ndash Proper phasing of conversion of capacities
ndash Acceptance within existing labour organisation
Key focus Least disruption of existing processes and smooth transition
Greenfield
ndashPolitical framework conditions and sets timelines
ndashInterferences with general infrastructure project challenges
ndashUpgrading of external infrastructure
Key focus Commencement date and stakeholder expectations
Terminal Extension
ndash Greenfield vs brownfield extension
ndash Smooth integration into existing operations
ndash Possibility to combine extension with terminal upgrade
Key focus Capacity increase and smooth integration
Signalling
Control IT
Tracks
Electrification
Rail automation
Signalling
Camera
Road Management systems
Traffic control amp Information
Parking Management
bull Container scanning
bull Nuclear detection
bull OCR sensors
bull OCR for container Number
bull RFiD for container seals
bull Nuclear Detection Sensors
bull Container weight sensors
bull Driver ID verification
bull Container trace detection
Security
Green ports
Simulation (Berth capacity Yard and transport equipment handling Yard storage Terminal gate)
Planning Capacity analysis Comparison of operating alternatives Hinterland connections Terminal layout
Specification of operating systems Logistics process
Value added consulting
Civilworks
bull Quay
bull Yard
bull Horizontal transportation
Equipment
bull TOS
bull CTIS
bull Terminal Star
bull NAVIS
IT
bull Nautical Access
bull Hinterland Access
bull Terminal Infrastructure
bull Buildings
Rail Infrastructure amp Mngm Rail Infrastructure amp Mngm
Investment Fields
Classification of Container Terminal Development Projects
Page 34
Topic 9
Development
World Trade Flows
Page 35
Development of World Trade Flows
2000
US - EU
US - China
EU - China
US$ b 587
US$ b 838
US$ b 450
Total US$ b 1875
2009
US - EU
US - China
EU - China
Total
US$ b 612
US$ b 2269
US$ b 1856
US$ b 4737
+43
+1708
+3124
+1526
Page 36
Topic 10
Fleet Development and order book
segmentation
Panamax vessels as global leader
Container Vessels
Page 37
Container Vessel Fleet Development
amp Order Book Segmentation
12
19
8
8
22
10000+
5
9000-9999
4 8000-
8999
11 7000-
7999 2
6000-
6999 9
5000-
5999
4000-4999
3000-
3999
2500-
2999
lt2499
4
12
7
6000-
6999
4
5000-
5999
4000-
4999
3000-3999
3
2500-2999
3
lt2499
10000+ 41
9000-9999
2
8000-8999
19
7000-
7999
5
Technological Trends
Evolution of Container Vessels
Source HPC Hamburg Port Consulting GmbH
Order Book Segmentation 2011- 2015
( of TEU order capacity)
Increasing vessel sizes (up to 18000 TEU on order)
Increasing automatisation of terminal operations in the developed world
IT based interfaces and coordination between stakeholders
Fleet Segmentation
2011 ( of total TEU capacity)
Page 38
By 2014 post- Panamax vessels are expected to
account for 48 of the global container fleet
Post-Panamax vessels are effective for long
distances and between large ports
Post- Panamax ships have operating costs of
about $ 9 mio per year Most expenses are
related to fuel (46) and port charges (21)
Source Factors impacting North American Freight Distribution
0
2
4
6
8
10
12
14
2010
1400
2007
1000
2006
760
1996
260
1990
150
1980
070
TEUs (Million)
Other
Panamax
Post-Panamax
Page 39
Topic 11
Facts on US ports
Ports of LA LB
Clean Air Action Plan
PierPass Study
Mobile sources are the biggest source
of air toxics
I-710 is the arterial road for the cargo
transport
US Ports
Page 40
Facts on US ports
More than 95 of US cargo imports arrive by
ships (DOT 2009)
Some US ports such as port of LB
Sabannah Oakland Charleston and Seattle
can receive the post panamax vessels
Port of LA and LB count 43 of total TEU
imported in the United States
US port container traffic is expected to
double by 2030 (DOT 2009)
Efficiency of the above mentioned ports is
reduced by congestion caused by inland rail
and road chokepoints
In coming years transportation costs will rise
because of
switching to low sulfur fuels to reduce air
pollution
Improving terminal facilities efficiency
hours of operations
Reducing congestion
Facts and Current bottlenecks at US ports
Page 41
Ports of LA LB belong to top world ports and
further increase of cargo volume is foreseen
Source LA Metro Containerisation International Drewry
The ports are strongest ports in USA with ~14 Mio TEU cargo volume
in 2010
The ports are the entry point for 40 of all imported goods in the US
Cargo Volume in both ports will grow up to 43 Mio TEU in 2035
Port of LA consists of 4300 acres Port of LB 3200 acres
Port of LA has 9 container terminals 26 berths and length of berths
10046 meters
Port of LB has 6 terminals 31 berths and length of berths 7902
Port of LA has 997 employees Port of LB 400 employees
Ports of LA amp Long Beach
Facts and figures 2
Both ports belong among top 20 world ports
TEU-Volume 2010
2330214
2825179
5292025
6263499
7831902
Oakland
Savannah
NY
LB
LA
Page 42
In both ports more than 10000 trucks are
registered and thereof ~80 are active
Overview on port trucks
gt10000 trucks are registered in both ports in 2010
~80 of the registered trucks are active ie ldquoin servicerdquo
~22000 independent owner-operators in 2009 who conduct drayage at ports and intermodal rail yards
Sources Clean Truck program ndash Gate Move Data analysis California Air Resources Board Appendix C
Registered trucks Trucks in service
12200 10871
9760 8629
Long Beach Los Angeles Long Beach Los Angeles
Key data
Significant growth in number of trucks is expected until 2035
2
Page 43
The 2006 initiated Clean Air Action Plan consists of
initiatives to reduce port-related emissions
Source Port of Los AngelesPort of Long Beach
The Clean Air Action
Plan should reduce
port-related emissions
from 2006 to 2011 by
45
The Clean Truck
Program is part of the
Clean Air Action Plan
The Clean Air Action
Plan consists beside
activities for trucks of
more initiatives for
ships trains cargo
handling equipment and
harbor craft
Goal of the Clean Truck Program is the reduction of truck
emissions up to 85 by 2012
To achieve this goal truck driverscompanies get financial support
to renew their truck fleet
The 85 emissions reduction should be reached by banning old
trucks step-by-step This happens ins 3 phases
Clean Truck Program
Banning of all trucks from 1988 and
older
Banning of all trucks from 1989 -
2003 and all not-retrofitted trucks
from 1994 - 2003
Banning of all trucks not meeting the
bdquoFederal Clean Trucks Emissions
Standards 2007ldquo
Phase 1
October 1 2008
Phase 3
January 1 2012
Phase 2
January 1 2010
2
3
1
Clean Air Action Plan
Clean Air Action Plan and Clean Truck Program
Jan 2012 emissions
-85
2
Page 44
The ports already decreased the environmental
impact of port operations from 2005 to 2010
Emissions on ports [in tons pa]
NOx SOx DPM
NOx SOx DPM
Po
rt o
f L
A
Po
rt o
f L
on
g B
ea
ch
Key data
The ports are
responsible for ~20
of all DPM emissions
in Southern California
The goals for 2023 for
DPM and NOx are
nearly achieved
SOx emissions also
reduced significantly
but still challenging
Reductions of PM10
and PM25 as well as
CO and HC are
significant
Goal 2035 not
specified or not
identified yet
Sources Emission inventory LB and LA 2010
617271
888
204
-69
2010 2005
690271
961
221
-72
2010 2005
6722
-50
2010
8216 8180
2005
16396 5317
372
-75
2010
1339
3978
2005
-46
2010
8400 7250
2005
15650
6417
492
-73
2010
1921
5101
2005
7022
Between 2005 and 2010 the emissions of PM10 and PM25 have been reduced by approx
70 in both ports additionally
The emissions of CO and HC have been reduced by approx 50 between 2005 and 2010
in both ports
2
Page 45
The ldquoPierPass Studyrdquo identified weaknesses at the
ports and made several recommendations
Recommendations of PierPass Study
Source PierPASS Inc AbilityTriModal Transportation Services Inc Taking the Pulse of the Ports March 2011
Review breaks Have a high influence on
truck visit time
Review the bdquoall-or-nothingldquo structure of the
TMF (Traffic Mitigation Fee)
Establish terminal-specific performance
standards supported by a continuing
process of monitoring visit time
Expand land-bridge services (eg pre-
removal of import containers to off-dock
yards for pickup) and improved
communication between trucks and
terminals
Recommendations
1 86 of visits take 0 ndash 2 hours 12 take 2 ndash
4 hours and outlier cases take up to 8 hours
2 Trucks wait outside the terminals in the
1600 - 1700 period to avoid Traffic
Mitigation Fee
3 Differences in terminal performance eg
3 terminals account for 10 of all visits
associated with 28 of long visits
2 terminals that move 25 of the cargo
are linked with 2 of long queues
4 Breaks impact truck visit time heavily
adding up to 1h30m to visits (eg night
break)
Findings
2
Page 46
In addition to emissions of local industries mobile
sources are the biggest source of air toxics
Overview on surroundings
Emitting industries1 Residents
Petroleum Refineries 43
Nonferrous Metal Smelting 23
Semiconductor Manuf 17
Metal Working 5
Chemical Manufacturing 2
Biggest companies1
BP West Coast Products
Exide Technologies
Sanyo Solar LLC
Valmont Coatings
Conocophillips LA Refinery
Johnson Laminating amp
Coating Inc
Triumph Processing Inc
Western Tube amp Conduit C
INEOS Polypropylene LLC
Equilon Carson Terminal
Approx 19 municipalities2
and approx 1 million
residents along the road I-710
Within frac14-Meile from the I-
7102
10 schools
6 day-care centers
5 Mobil-Home Parks
Approx 2000 premature
deaths are associated with
diesel emissions in Southern
California1
Source 1US Environmental Protection Agency Toxics Release Inventory I-710 Corridor Reporting Year 2009 2 I-710 Corridor Project Factsheet Fall 2009
Despite local industries the largest sources of air toxics are the mobile sources
(eg cars trucks construction equipment trains)1
3
Page 47
I-710 is the arterial road for the cargo transport to
and from the Ports of LA amp Long Beach
Traffic Volume in sections of the I-710 (2007 based on 2003)
Highway Segment Length of
segment (in
miles)
Total Daily
Vehicle Volume
Total Daily
Truck Volume
Daily Port
Truck
Volume
I-710 GDB to PCH 15 Assumption Like next segment 23900
I-710 PCH to Willow 1 146000 25400 23900
I-710 Willow to I-405 15 161000 27100 23235
I-710 I-405 to SR-91 36 186000 31400 20045
I-710 SR-91 to I-105 27 227000 38300 15315
I-710 I-105 to I-5 72 237000 34600 11685
I-710 I-5 to SR-60 14 199000 24200 1025
I-710 SR-60 to I-10 19 132000 11300 845
The traffic volume is for both directions
Traffic volume on the interstate will grow by 85 in 2035
= Daily Port Truck Trips Volume 2035 ndash in Segment PCH to Willow ndash 44215
Source US Department of Transportation - Federal Highway Administration (FHWA) operations support
ndash port peak pricing program evaluation Multi-County Goods Movement Action Plan (MCGMAP)
Exit to off dock rail stations
Port trucks Total trucks
Overview on I-710 traffic
The I-710 currently is utilized by any kind of truck traffic ndash not only port trucks
NUMBERS TO BE
VERIFIED 3
Page 48
The current LA LB port related traffic flow can be
clustered in three categories including the I-710
Sources Port of Los AngelesPort of Long Beach TEU Statistics 2010 Port of Los Angeles Intermodal
Logistics amp Ports of LAPorts of Long Beach Rail Infrastructure Port of Los Angeles Public Rail
Workshop Oct 22 2009 1 Twenty Foot Equivalent
Summary on traffic flow
ldquoTransload amp
storagerdquo
Off dock
Near dock
On dock
ldquoNon local destinationsrdquo ldquoLocal storefactoryrdquo
Key data
~ 24 of volume transported
via on dock rail
Proportion expected to
increase in the future
Additional near dock rail
terminal planned
1
~19 of volume Near Off
dock assumed to be ldquoI-710rdquo-
relevant
Proportion to be decreased
volume increasing strongly
Assumption 2010 ~20000 -
25000 daily port truck trips
2
~57 of volume on other
roads then I-710
Assumption 2010 ~65000 -
70000 daily port truck trips
(calculated)
3
Rail
Trucks on I-710
Other truck routes
2010
24 (~34 mn TEU1)
2035
30 (~129 mn TEU)
2010
~19 (~27 mn TEU)
2035
~10 (~43 mn TEU)
2010
57 (~8 mn TEU)
2035
60 (~258 mn TEU)
1 3 2
= Trucks
= Rail
I-7
10
Ports of LA amp Long Beach
3
Page 49
Topic 12
Share of North East Asia ndash US East
Coast Route
Share of Routes to US ports
Page 50
Share of North East Asia ndash US East Coast Route
by option
Main cargo destinated for US moves mainly
through the Panama canal Suez canal and the
cape of good hope and the US intermodal
system
Major advantage of US intermodal system is
frequent usage of Post Panamax ships as it
requires 5 ships for a weekly service rotation
compared with eight ships required by the
panama canal route
Routing of freight depends on different criteria
Cost expansion of the canal is expected
to reduce costs
Time cargo that has higher value or is
perishable takes the routing option which
is faster (intermodal system in this case)
Panama canal will have marginal impacts
on time
Reliability Panama canal leads to less
congestion and more reliability
Source Factors impacting North American Freight
222125223100
2007
55
43
2006
56
42
2005
58
40
2004
61
38
2003
64
34
2002
72
24
2001
77
21
2000
83
15
1999
86
11
Suez Canal
Panama Canal
Intermodal
Page 51
Topic 13
Facts and impact of expansion
Panama Canal
Page 52
Facts on Panama Canal and impact of expansion
Canal is 64 km long and handles 5 of global
seaborne trade and 12 of American international
seaborne trade
Authority generates revenues by collecting tolls
Average toll is about $45000 In 2008 $132 billion in
tolls were collected
The average in transit time has increased from 9
hours in 1999 to 1304 hours in 2008
Canal is reaching its maximum capacity and does not
have the infrastructure to handle Post -Panamax
vessels
Expansion of canal was decided in 2008 and will
overcome its capacity challenges by 2014
Main competitor of Panama canal is the US
intermodal system and the Suez canal
The costs of panama canal expansion will cause
significant pressures to increase tolls
The role of west coast ports as gate way to North
American freight distribution will not be compromised
by the expansion
Facts on Panama Canal
Source Courtesy of the panama canal Authority
The canal route is less costly and highly reliable but has a
longer navigation time (216 days) than the US intermodal
system (183 days)
The expansion will increase efficiency to US intermodal
system by decongesting the west coast main port of LALB
Trade can be delivered faster to East coast ports
More integrated approach is needed to reduce bottlenecks in
current system
Page 53
Topic14
Key trends
Behind the ports
The North American Distribution Market
Page 54
Key Trends impacting the North American
Distribution Market
1 Oil Prices
Rising oil prices have resulted in some companies re-
evaluating supply chains and distribution networks in an
attempt to offset cost increases
3 Increase in inventory levels
As a result of higher transportation costs many shippers are
likely to move away from quick and frequent deliveries to
slow and less frequent shipments thus driving up inventory
4 E-commerce
To support online sales many brick and mortar retailers are
expanding their distribution facilities
5 Intermodal transportation
The transport of freight via several modes of transportation
ndash ship rail and truck has increased over the past few years by setting
up multimodal connections and terminals
6 Larger space
Throughout 2010-2011 companies took advantage of
lower vacancy rates and ldquotraded uprdquo to larger warehousing
and distribution facilities
6 Near-shoring
A shift towards regional supply chains or nearshoring is resulting in
manufacturing moving closer to customer-bases
7 Containerized imports
Over the past ten years containerized imports have become one of
the most important drivers of demand for warehousing and distribution
centers in the US
Source Rodrigue Hofstrau
Page 55
Topic 15
Transfer expertise from other
industries to terminal operations
Pregate solutions
Gate automation
Siemens perspective
Siemens solutions
Page 56
Transfer of expertise from industrial automation
airports and cranes to terminal operations
Cranes
World-known expertise in cranes for terminal operations with leading market share (eg globally
installed base of 1203 STS cranes 599 RMGs and 2206 RTGs)
Global presence of crane specialist via regional service organizations
Manufacturing
Industry leader in manufacturing automation and material flow control eg deployed in
automotive manufacturing plants
Airports Air Cargo Postal Automation
Knowledge and technology around fully automated container handling
High Speed Container Loading
Automatic Container supply to the platform level
Example Dubai airport cargo city REMA (Switzerland)
Global presence
Global presence with over 350rsquo000 employees
More than EUR 73 Bn revenues in 2011
Siemens brings broad expertise relevant for terminal operators eg
Enhanced Capabilities in
SW development project realization integration material handling processes
Page 57
Pre-gate solution ndash
Process and value proposition
Potential layout of pre-gate solution
Port
Port
entry
Port
entry
Traffic
management
center (TMC)
Traffic
info to
pre-gate
area
Port
entry
Port
entry
Message
sign
Security
camera
Terminal 2
Terminal 1
Pre-gate area 1
4 2 Truck 1
Pre-gate area 2
4 2 Truck 1
Pre-gate area 3
4 2 Truck 1
5
5
3
1
Free slot
truck 1
Process
Truck arrives at pre-gate
area
Pre-gate area identifies truck
and announces arrival of
truck to terminal
Terminal assigns time slot to
truck (with terminal
operating system)
Pre-gate area announces
time slot and travel time
(based on data from TMC) to
truck
Message signs guide truck
to terminal (based on real-
time traffic data from TMC)
1
2
3
4
5
Value proposition
Reduction of traffic congestion
eg trucks
Active control of truck arrivals
eg slot assignment to
optimize handling in terminal
Advance notification of arrivals
eg of trucks
Source IL deep-dive ports
Page 58
Gate-automation ndash
Modules and value proposition
Automatic and seamless tracking of
documents containers and their state eg for
liability purposes
Cost reduction via automation eg
Reduction of staff via automation and pooling
ie less manual effort
Centralization of recognition and
documentation
Direct linkage to databases
Land registers EuropeanNational libraries
Enterprise mail rooms Trust-Ebox
Cross-Check within image management
Generation of service and performance
reports
Document Reading
Automatic recognition scanning and
interpretation of all written elements on the
documents
Manual data-entry to supplement
Damage check
Automatic scanning of containers through
cameras at gates and berthing places to
check for damages and broken seals
Video Gate
Recognition of truck-ID truck signs (eg
dangerous good signs) and Container IT
(ISO)
Number plate recognition
Automatic number plate recognition at gate
Extensive OCR expertise within Siemens
Leader in postal automation (all sorting centers
in Germany and US)
Highest recognition rates highest reliability
Modules of gate automation Value Proposition
Source IL deep-dive ports
Page 59
Siemens MOL IampC perspective
IT
IL Extended TOS ndash Terminal
Operating System
IL Transport Logistic Platform
IL Total Port Management
General infrastructure
LMV Power supply
LMV Energy distribution
BT Building security (fire
solutions video
surveillance etc)
Value added services
IL Project management and
system integration
IL Service maintenance
IL Planning amp simulations
IL Green solutions
Rail infrastructure amp management
RA Rail electrification
RA Rail automation components (eg
switches communication signaling
operation amp disposition systems)
Security
IlBT Process integrity
(container security etc)
IL BT Screening hardware amp software
BT Yard security (access intrusion hellip)
Equipment
IL Gate automation (incl ANPR container localization)
IL Dock-and-yard management remote yard
management
IL AGV Battery change amp charge stations
DT Crane automation (incl crane drives)
IL Container handling (conveyors direct ship to rail)
Road infrastructure amp management
CTE Traffic control (incl signaling)
CTE Traffic management
IL Pregate solution (incl truck identification)
CTE e-Highway
Page 60 2013 MHItrade Copyright claimed as to audiovisual works of seminar sessions and sound
recordings of seminar sessions All rights reserved
Speaker padidehguetzkowsiemenscom
Home Page wwwsiemenscom
Visit ProMat 2013 Booth
For More Information
NOTE Items that can be included are your speakerrsquos email
addresshome page the Exhibiting Member Companyrsquos name home
page and ProMat 2013 Booth Number
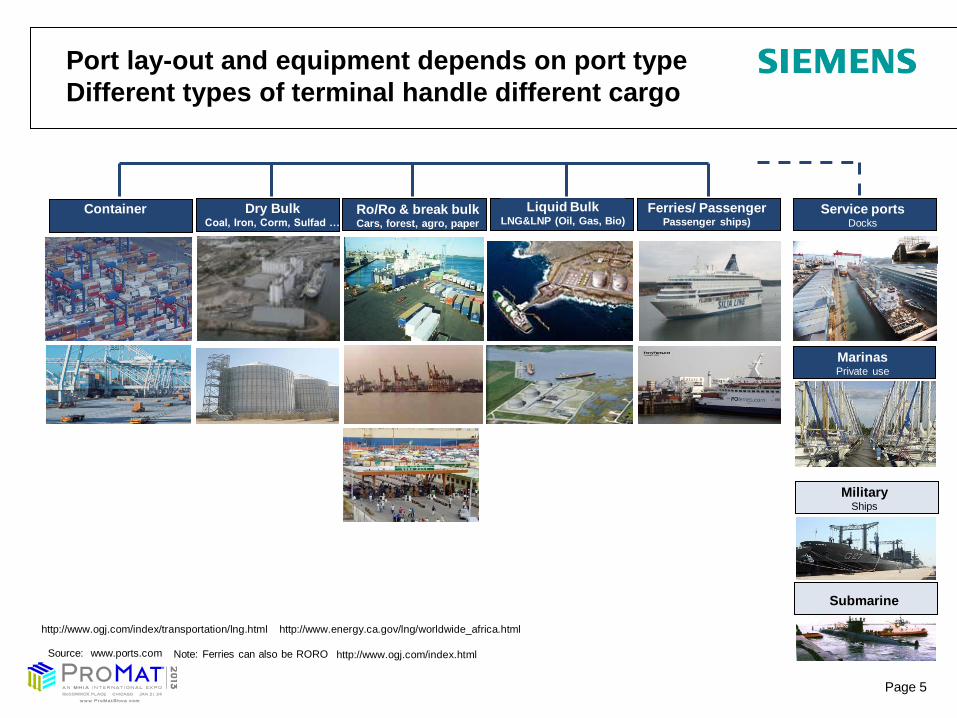
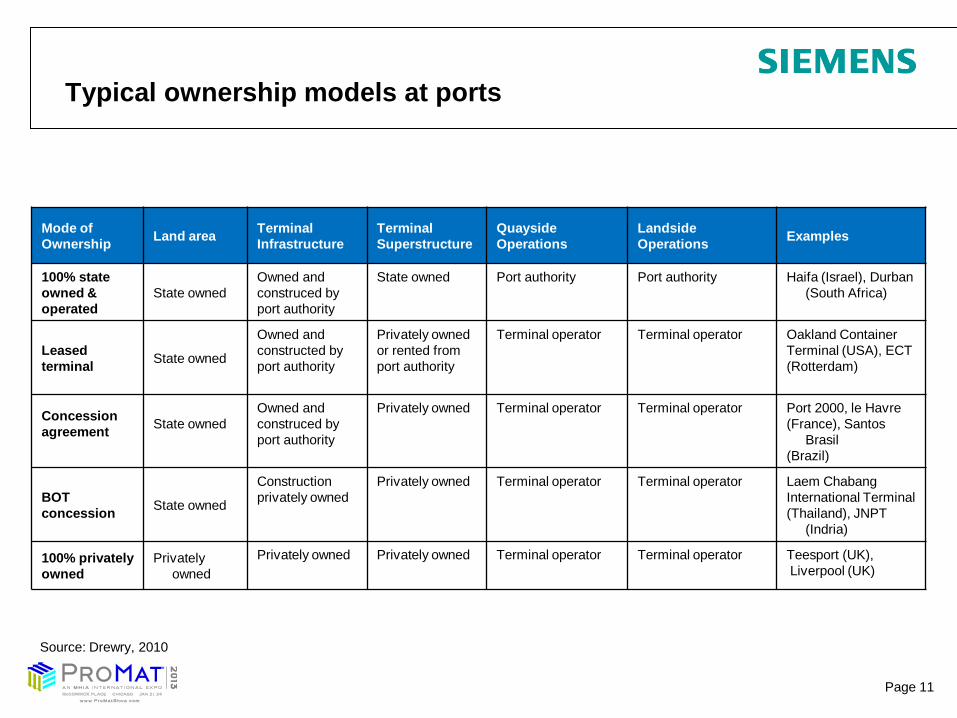
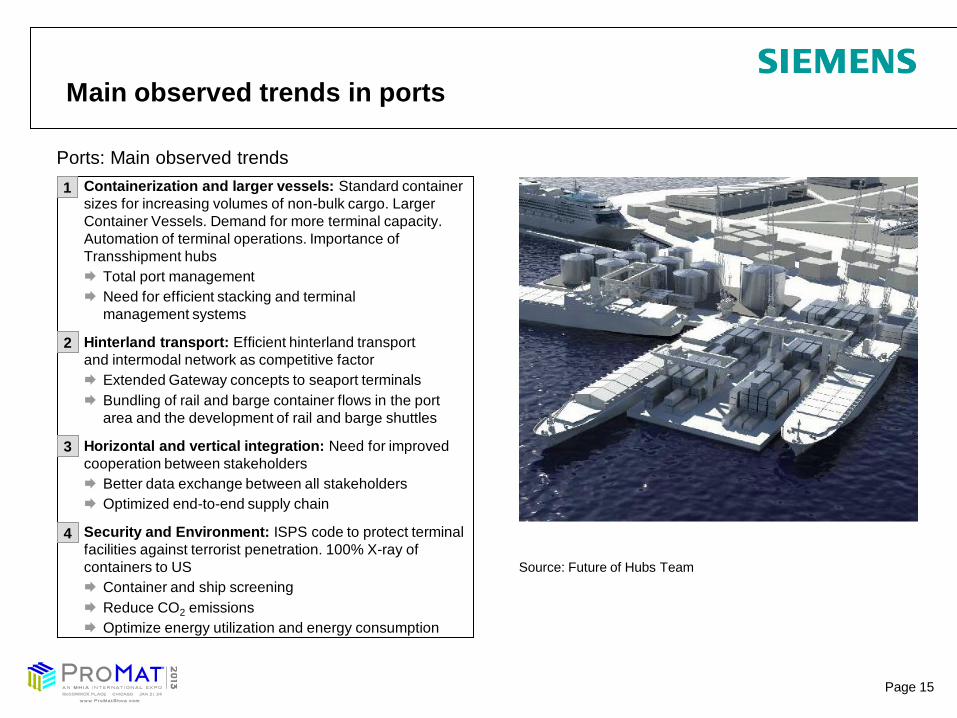
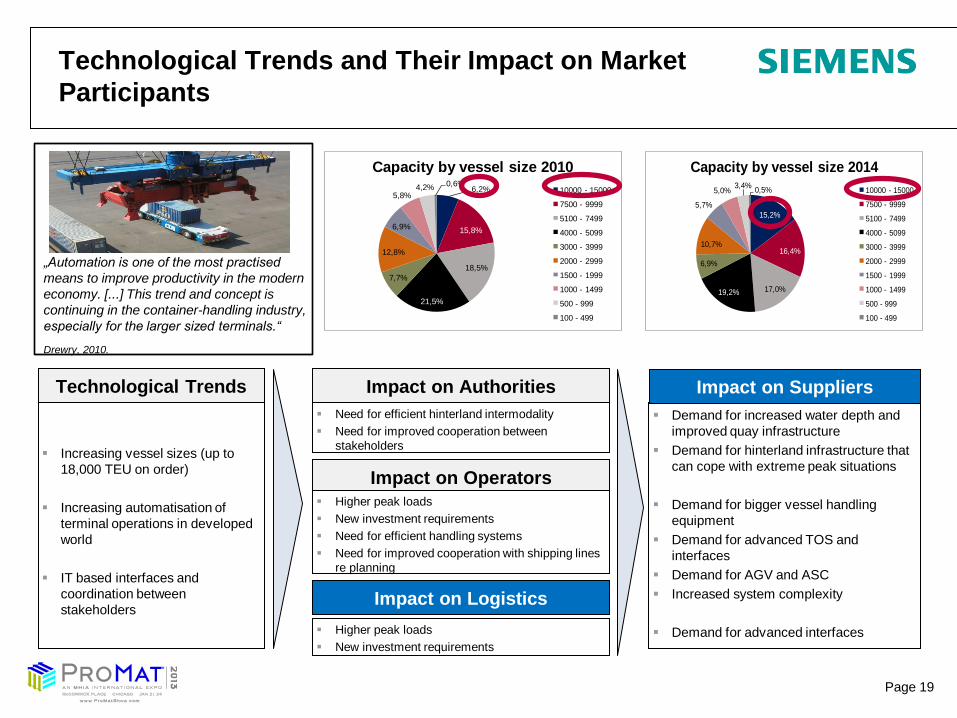
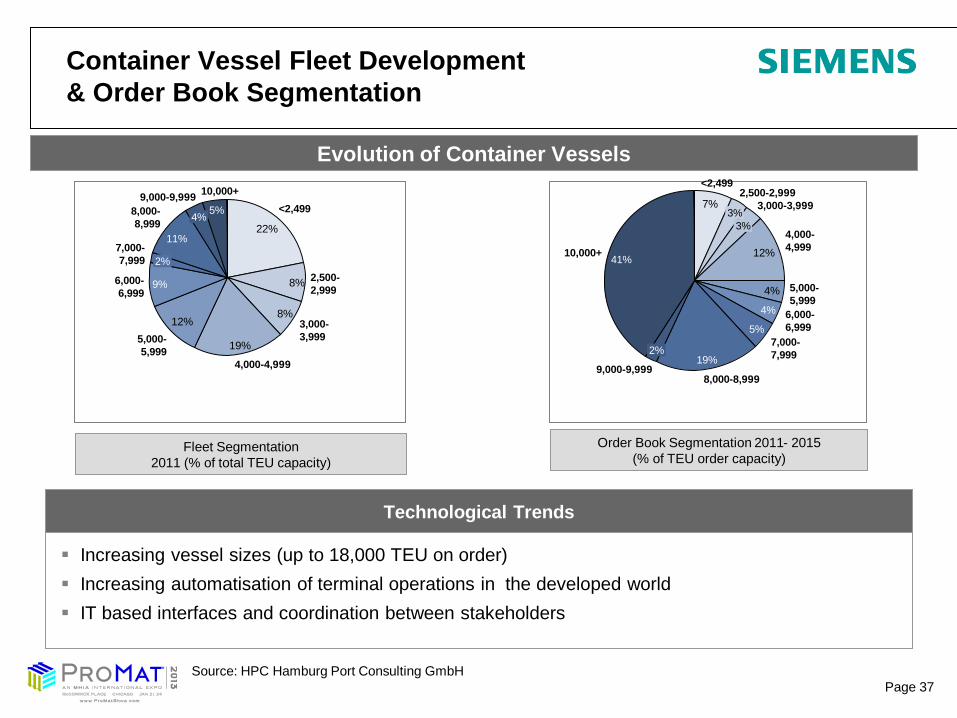
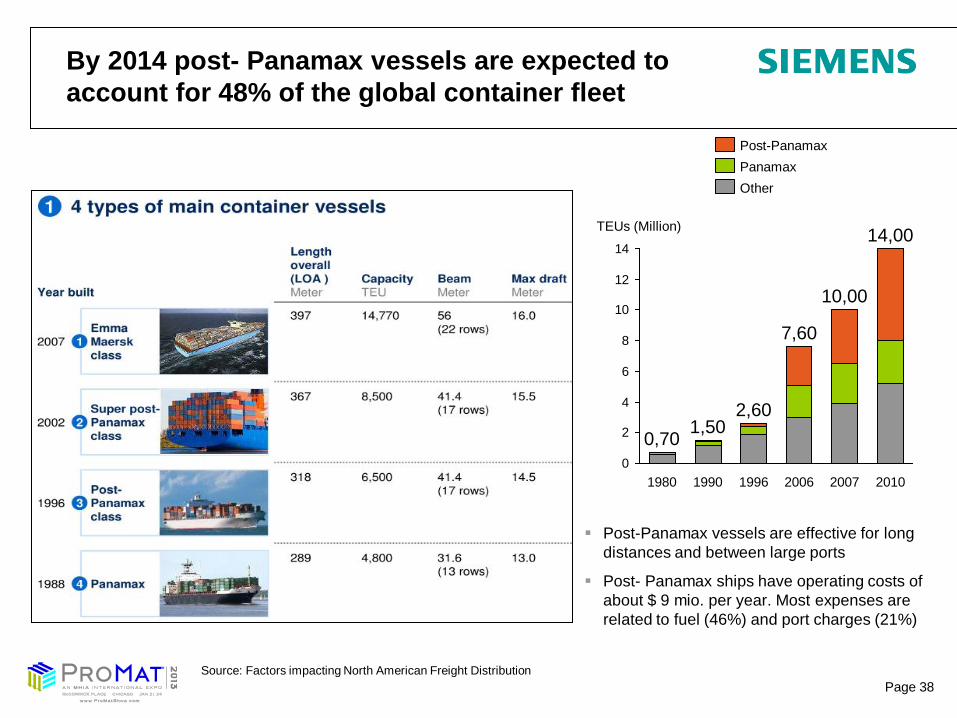
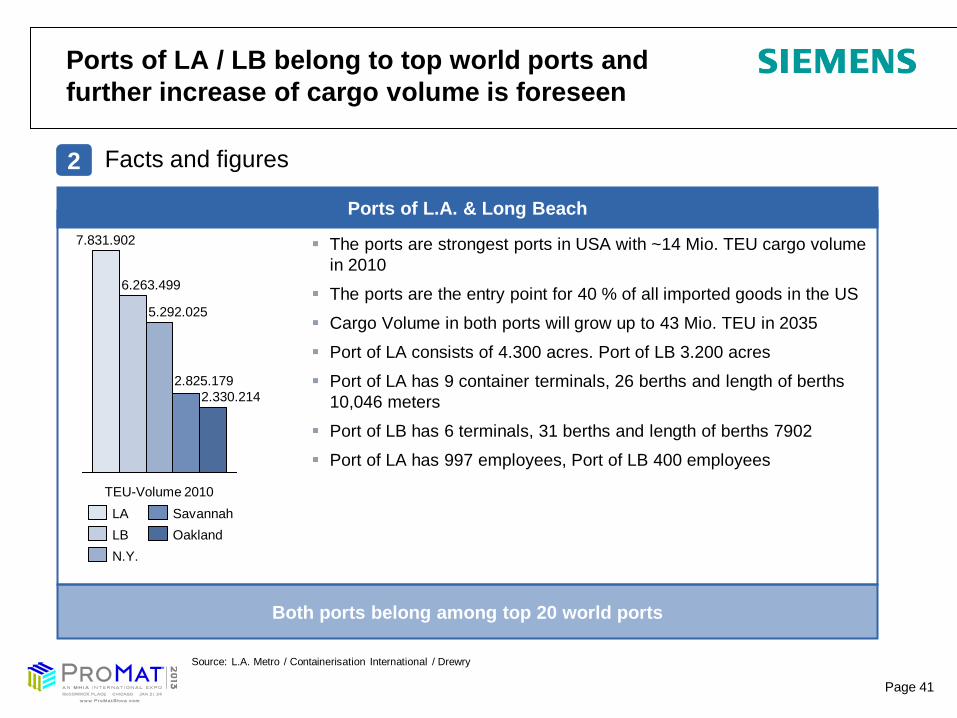
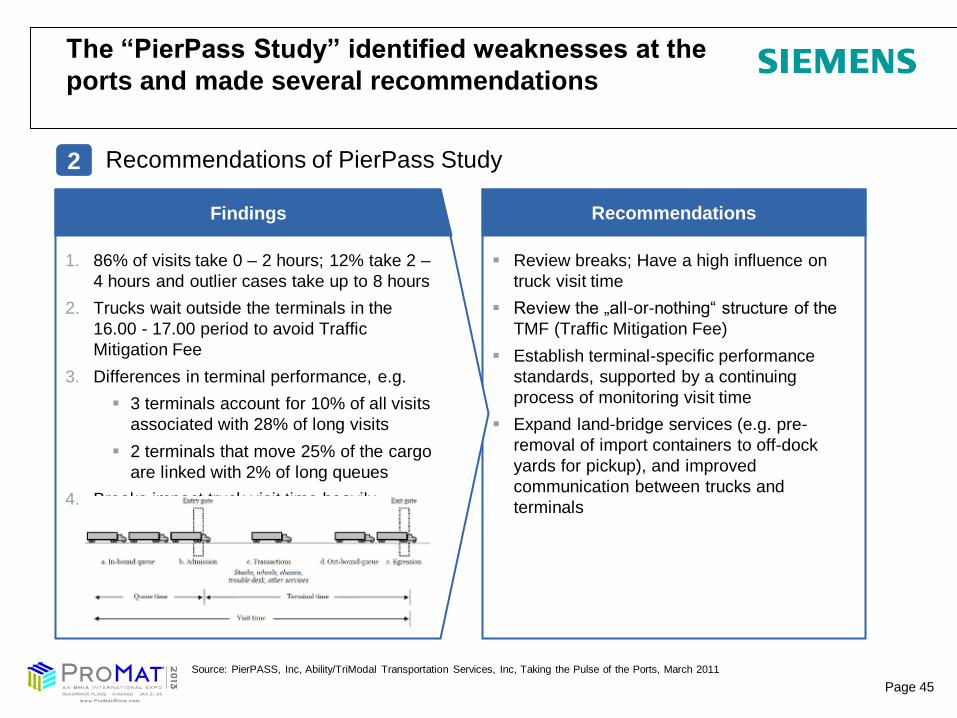
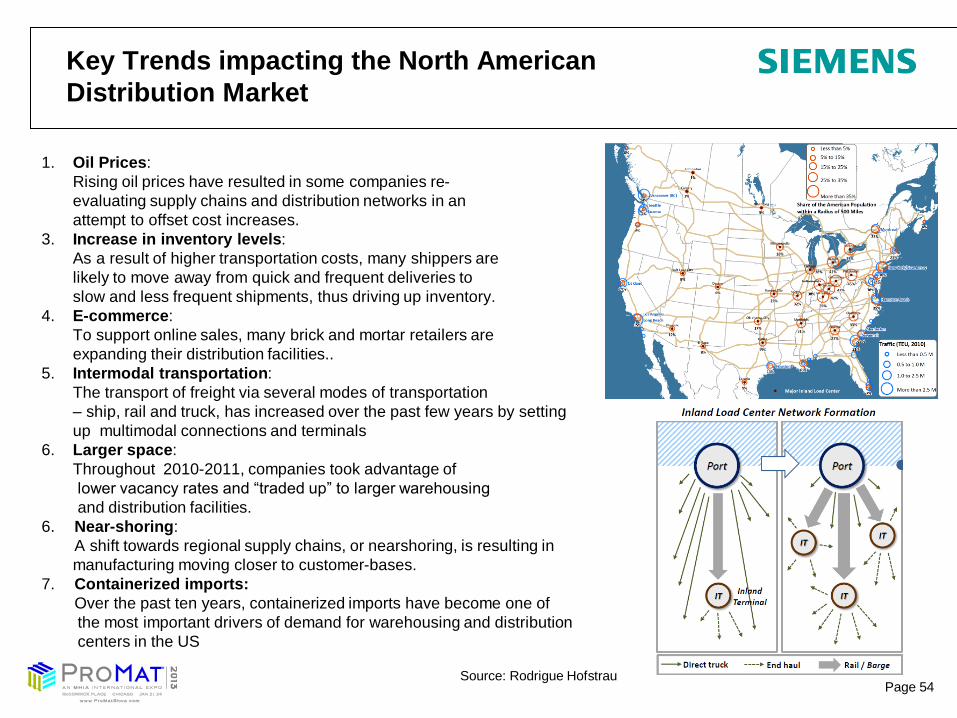
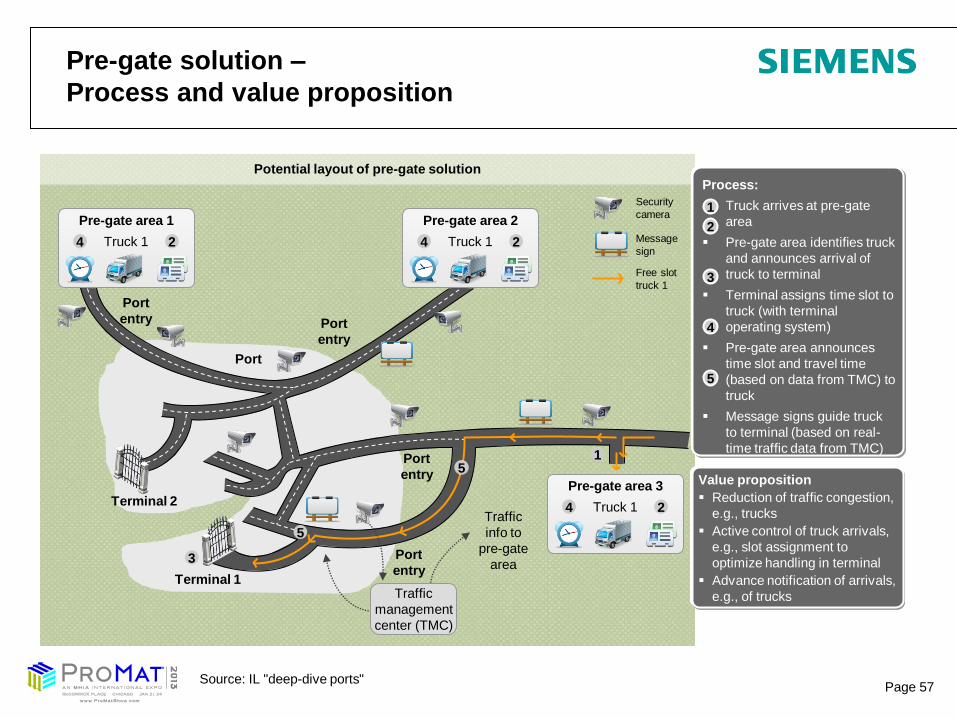