
minitab.com/spm/ · SPM - Core Capabilities The core capabilities of SPM include classification,...
16
Powerful machine learning software for developing predictive, prescriptive, and analytical models. minitab.com/spm/
Transcript of minitab.com/spm/ · SPM - Core Capabilities The core capabilities of SPM include classification,...

Powerful machine learning software for developing predictive, prescriptive, and analytical models.
minitab.com/spm/

Salford Predictive Modeler Powerful machine learning software for developing predictive, descriptive, and analytical models.
Minitab helps companies and institutions to spot trends, solve problems and discover valuable insights in data by delivering a comprehensive and best-in-class suite of data analysis and process improvement tools. Combined with unparalleled ease-of-use, Minitab makes it simpler than ever to get deep insights from data. Plus, a team of highly trained data analytic experts ensure that users get the most out of their analyses, enabling them to make better, faster and more accurate decisions.
For over 40 years, Minitab has helped organizations drive cost containment, enhance quality, boost customer satisfaction and increase effectiveness. Thousands of businesses and institutions worldwide use Minitab Statistical Software, Companion by Minitab, and Quality Trainer to uncover flaws in their processes and improve them. In 2017, Minitab acquired Salford Systems, a leading provider of advanced analytics which delivers a suite of powerful machine learning, predictive analytics and modeling capabilities.
The Company

minitab.com/spm/ 1
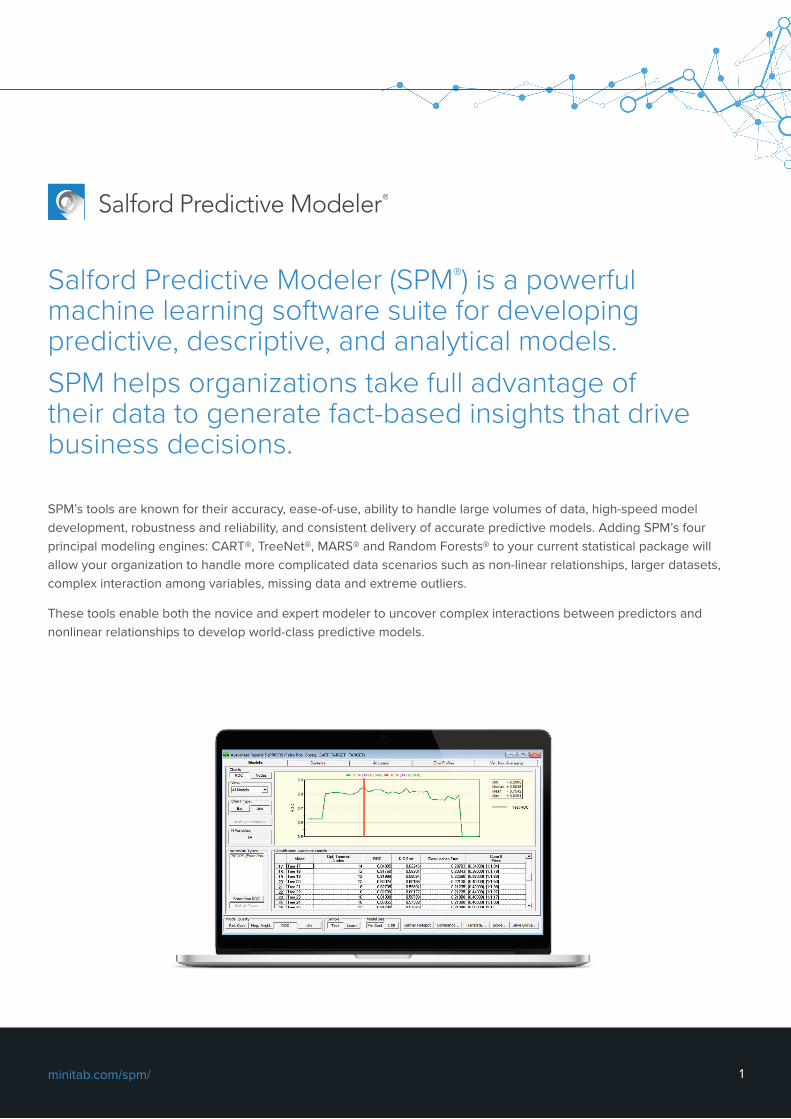
Salford Predictive Modeler (SPM®) is a powerful machine learning software suite for developing predictive, descriptive, and analytical models. SPM helps organizations take full advantage of their data to generate fact-based insights that drive business decisions.
SPM’s tools are known for their accuracy, ease-of-use, ability to handle large volumes of data, high-speed model development, robustness and reliability, and consistent delivery of accurate predictive models. Adding SPM’s four principal modeling engines: CART®, TreeNet®, MARS® and Random Forests® to your current statistical package will allow your organization to handle more complicated data scenarios such as non-linear relationships, larger datasets, complex interaction among variables, missing data and extreme outliers.
These tools enable both the novice and expert modeler to uncover complex interactions between predictors and nonlinear relationships to develop world-class predictive models.
Salford Predictive Modeler
2
Salford Predictive Modeler
SPM - Core Capabilities
The core capabilities of SPM include classification, regression, survival analysis, missing value analysis, data binning and clustering/segmentation to cover a diverse array of machine learning and data science needs. Some of the largest corporations in the world use SPM’s reliable and accurate models.
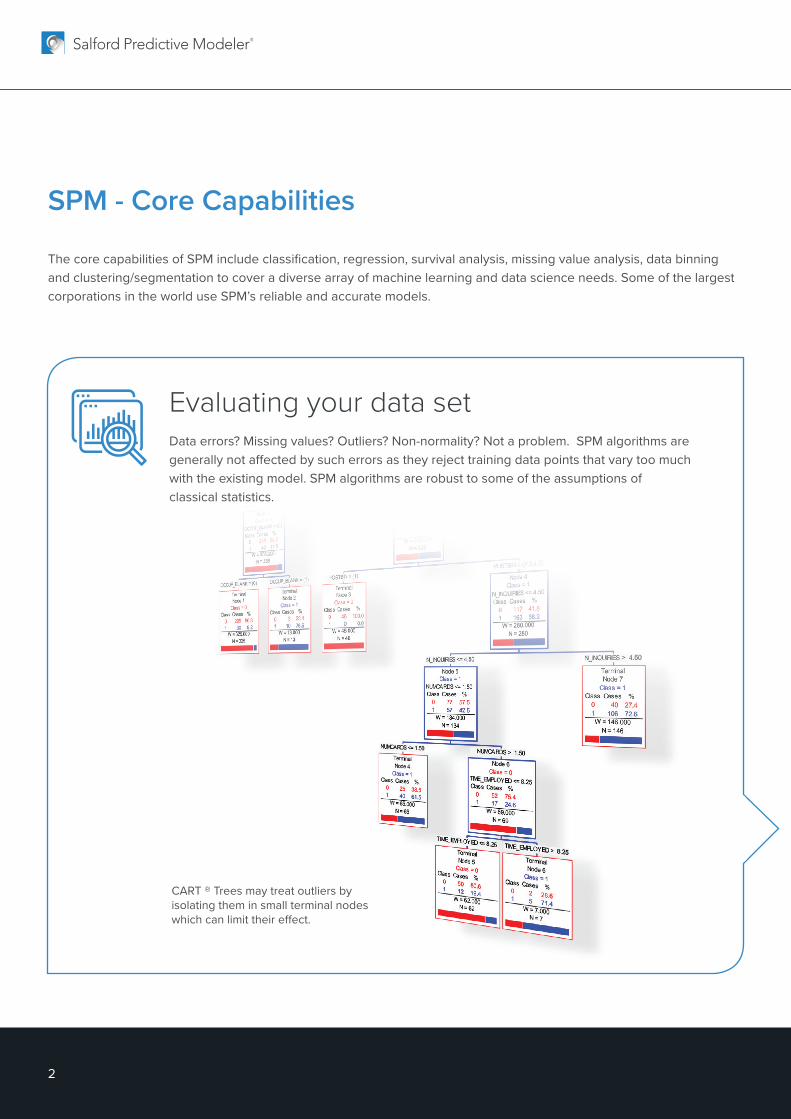
Evaluating your data setData errors? Missing values? Outliers? Non-normality? Not a problem. SPM algorithms are generally not affected by such errors as they reject training data points that vary too much with the existing model. SPM algorithms are robust to some of the assumptions of classical statistics.
CART ® Trees may treat outliers by isolating them in small terminal nodes which can limit their effect.
minitab.com/spm/ 3
Creating modelsUncover complex interactions between predictors and complex nonlinear relationships to build more accurate models. SPM helps you select the most significant factors from a large pool of candidates.
For new modelers, SPM does not require coding. Default settings provide a hard to beat baseline model, without time-consuming setup.
• Missing Values: Automatically handles missing values without deleting rows or columns
• Unbalanced Data: Automatically upweights rare class, thus ensuring proper detection of rare events
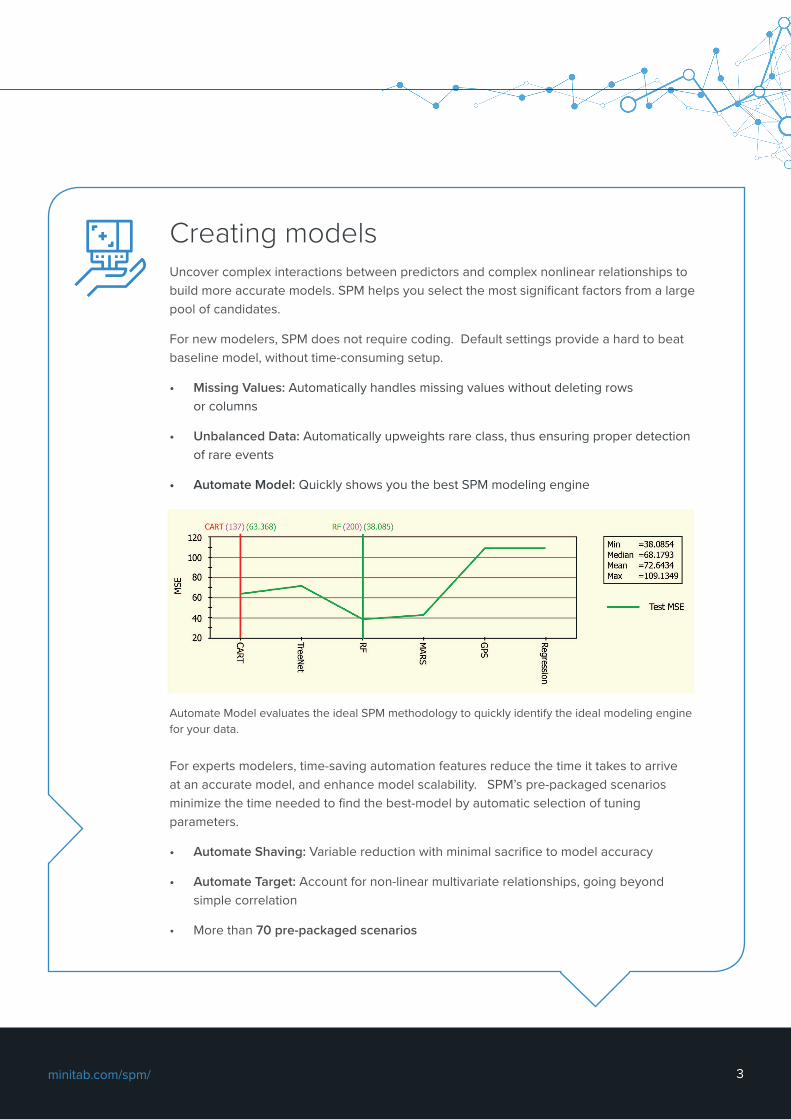
• Automate Model: Quickly shows you the best SPM modeling engine
Automate Model evaluates the ideal SPM methodology to quickly identify the ideal modeling engine for your data.
For experts modelers, time-saving automation features reduce the time it takes to arrive at an accurate model, and enhance model scalability. SPM’s pre-packaged scenarios minimize the time needed to find the best-model by automatic selection of tuning parameters.
• Automate Shaving: Variable reduction with minimal sacrifice to model accuracy
• Automate Target: Account for non-linear multivariate relationships, going beyond simple correlation
• More than 70 pre-packaged scenarios
4
Salford Predictive Modeler
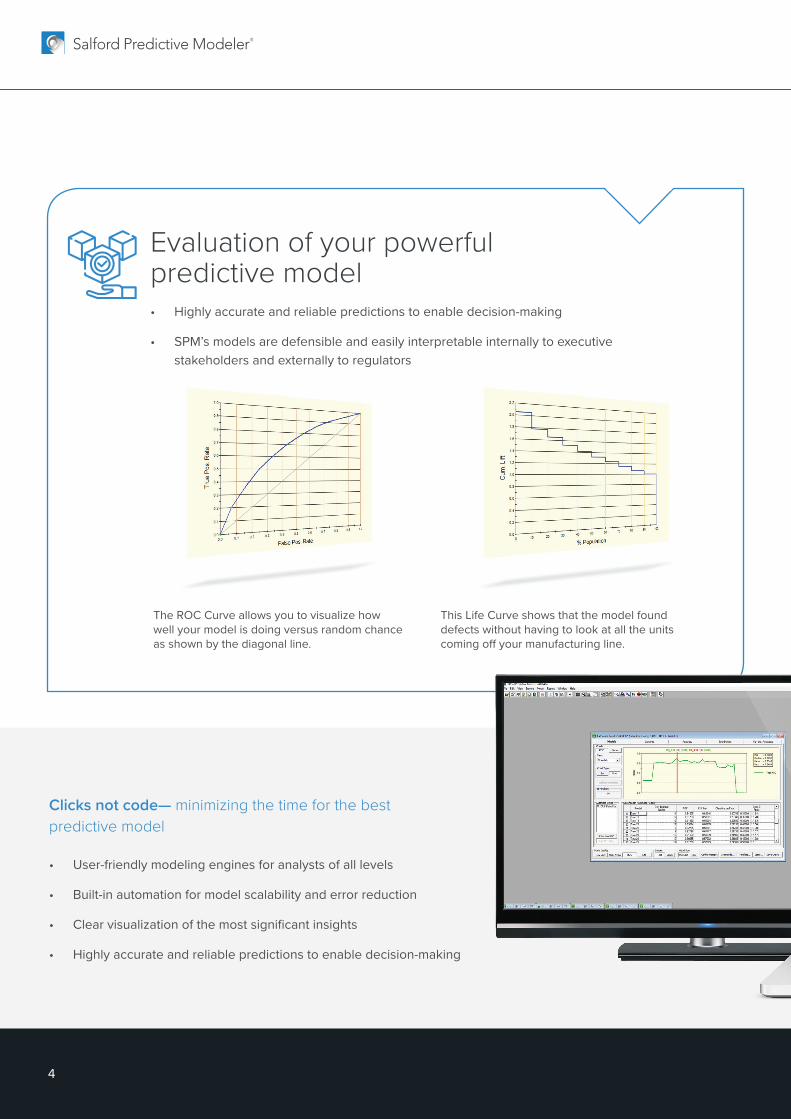
Evaluation of your powerful predictive model• Highly accurate and reliable predictions to enable decision-making
• SPM’s models are defensible and easily interpretable internally to executive stakeholders and externally to regulators
The ROC Curve allows you to visualize how well your model is doing versus random chance as shown by the diagonal line.
This Life Curve shows that the model found defects without having to look at all the units coming off your manufacturing line.
Clicks not code— minimizing the time for the best predictive model
• User-friendly modeling engines for analysts of all levels
• Built-in automation for model scalability and error reduction
• Clear visualization of the most significant insights
• Highly accurate and reliable predictions to enable decision-making
minitab.com/spm/ 5
Fortunately, [SPM made it]…very simple for us to hone in on the key predictors and be able to devise strategies to deal with those effectively. I’m a believer that Minitab and SPM can work very effectively together.
Master Black Belt, Global Operations for a top manufacturing organization
6
Salford Predictive Modeler
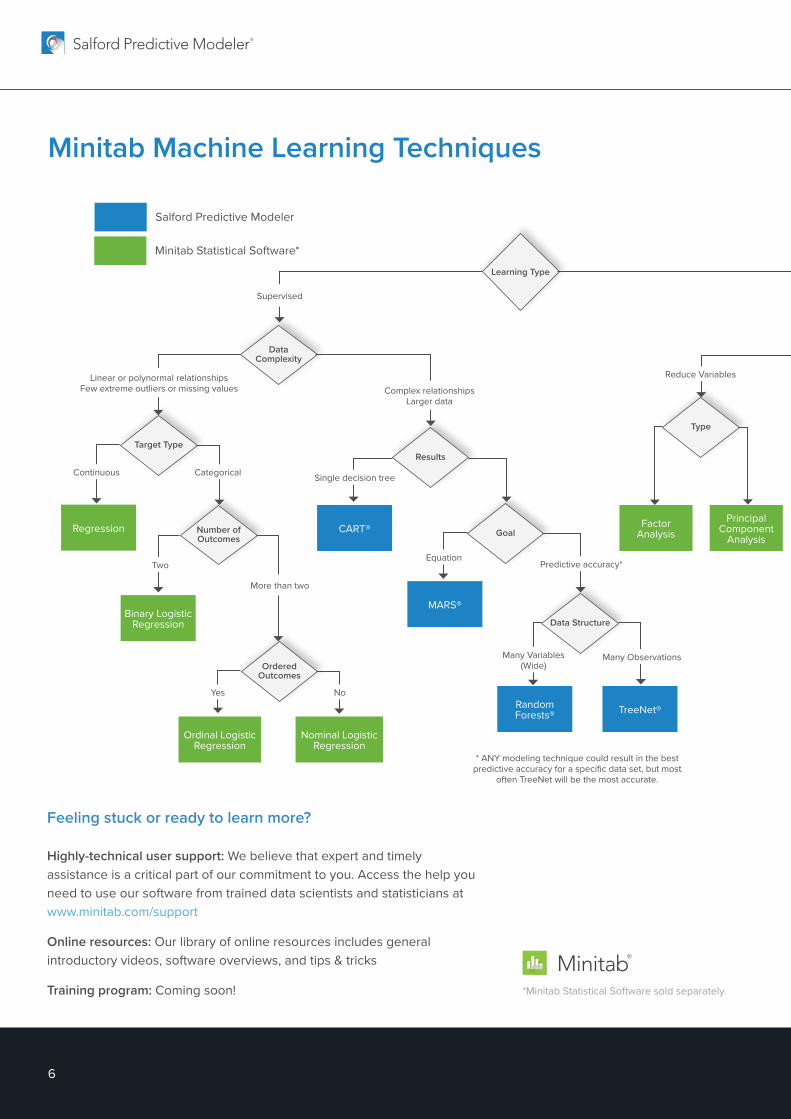
Minitab Machine Learning Techniques
*Minitab Statistical Software sold separately.
Feeling stuck or ready to learn more?
Highly-technical user support: We believe that expert and timely assistance is a critical part of our commitment to you. Access the help you need to use our software from trained data scientists and statisticians at www.minitab.com/support
Online resources: Our library of online resources includes general introductory videos, software overviews, and tips & tricks
Training program: Coming soon!
Salford Predictive Modeler
Minitab Statistical Software*
Regression CART®
MARS®
Random Forests® TreeNet®
Binary Logistic Regression
Ordinal Logistic Regression
Nominal Logistic Regression
Factor Analysis
Principal Component
Analysis
Supervised
Linear or polynormal relationshipsFew extreme outliers or missing values
Continuous Categorical Single decision tree
EquationPredictive accuracy*
Many Variables (Wide)
Yes No
* ANY modeling technique could result in the best predictive accuracy for a specific data set, but most
often TreeNet will be the most accurate.
Many Observations
Reduce Variables
Two
More than two
Complex relationships Larger data
Learning Type
Data Complexity
Goal
Data Structure
Number of Outcomes
OrderedOutcomes
Type
Target TypeResults
minitab.com/spm/ 7
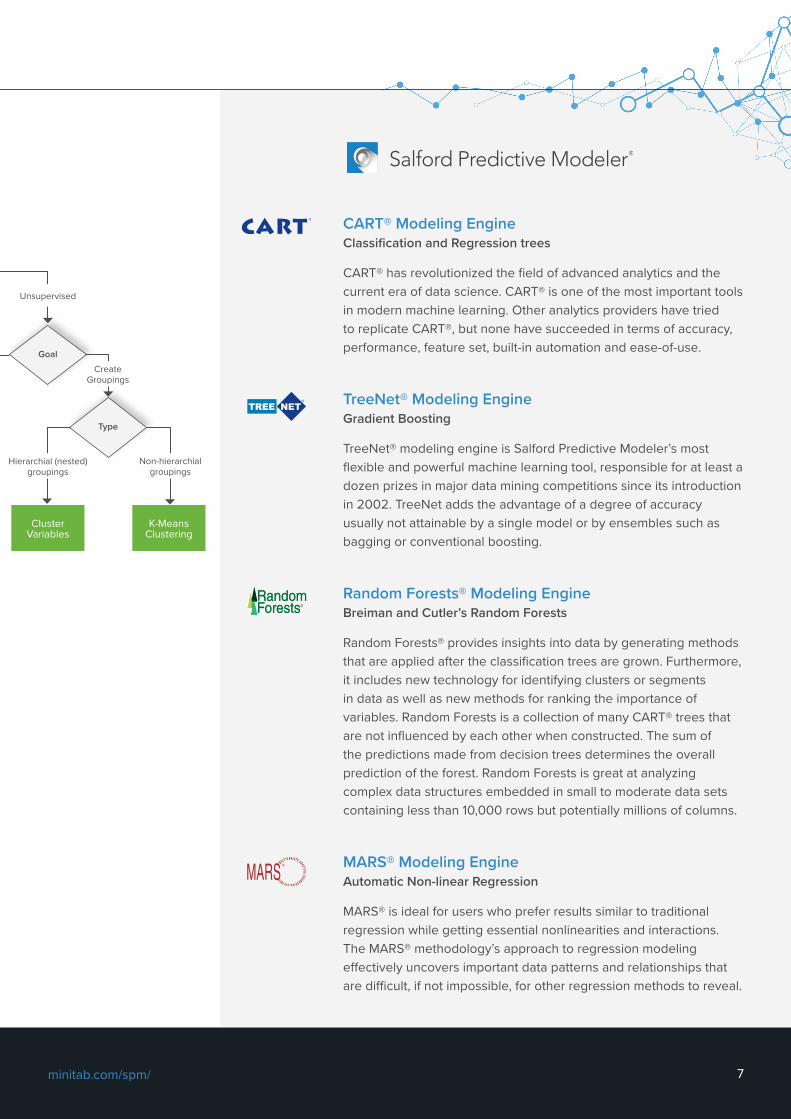
CART® Modeling Engine Classification and Regression trees
CART® has revolutionized the field of advanced analytics and the current era of data science. CART® is one of the most important tools in modern machine learning. Other analytics providers have tried to replicate CART®, but none have succeeded in terms of accuracy, performance, feature set, built-in automation and ease-of-use.
TreeNet® Modeling Engine Gradient Boosting
TreeNet® modeling engine is Salford Predictive Modeler’s most flexible and powerful machine learning tool, responsible for at least a dozen prizes in major data mining competitions since its introduction in 2002. TreeNet adds the advantage of a degree of accuracy usually not attainable by a single model or by ensembles such as bagging or conventional boosting.
Random Forests® Modeling Engine Breiman and Cutler’s Random Forests
Random Forests® provides insights into data by generating methods that are applied after the classification trees are grown. Furthermore, it includes new technology for identifying clusters or segments in data as well as new methods for ranking the importance of variables. Random Forests is a collection of many CART® trees that are not influenced by each other when constructed. The sum of the predictions made from decision trees determines the overall prediction of the forest. Random Forests is great at analyzing complex data structures embedded in small to moderate data sets containing less than 10,000 rows but potentially millions of columns.
MARS® Modeling Engine Automatic Non-linear Regression
MARS® is ideal for users who prefer results similar to traditional regression while getting essential nonlinearities and interactions. The MARS® methodology’s approach to regression modeling effectively uncovers important data patterns and relationships that are difficult, if not impossible, for other regression methods to reveal.
Salford Predictive Modeler
Cluster Variables
K-Means Clustering
Create Groupings
Hierarchial (nested) groupings
Non-hierarchial groupings
Unsupervised
Goal
Type
8
Salford Predictive Modeler
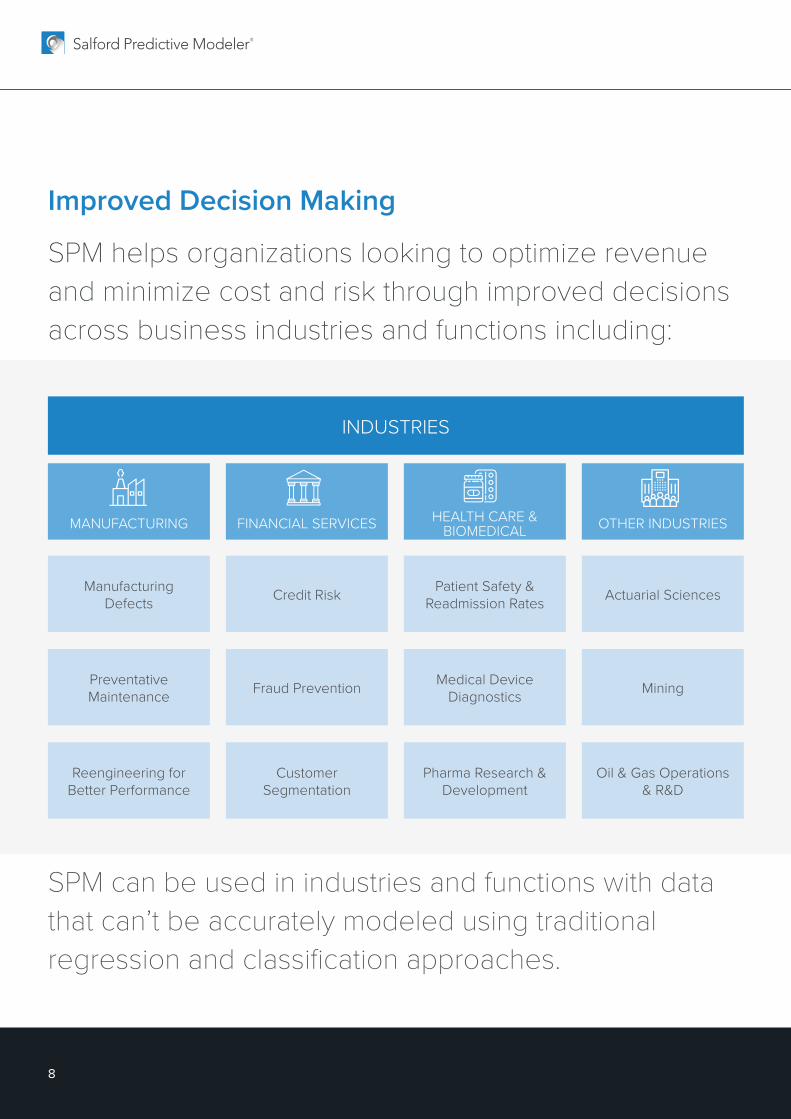
Improved Decision Making
SPM helps organizations looking to optimize revenue and minimize cost and risk through improved decisions across business industries and functions including:
INDUSTRIES
MANUFACTURING
Manufacturing Defects Credit Risk Patient Safety &
Readmission Rates Actuarial Sciences
Preventative Maintenance Fraud Prevention Medical Device
Diagnostics Mining
Reengineering for Better Performance
Customer Segmentation
Pharma Research & Development
Oil & Gas Operations & R&D
FINANCIAL SERVICES HEALTH CARE &BIOMEDICAL OTHER INDUSTRIES
SPM can be used in industries and functions with data that can’t be accurately modeled using traditional regression and classification approaches.

minitab.com/spm/ 9
Maximize Supply Chain Efficiencies Targeted Marketing
Operational Optimization
Customer Retention & Churn
Improving Work Processes Customer Satisfaction
CONTINUOUS IMPROVEMENT MARKETING
FUNCTIONAL AREAS
10
Salford Predictive Modeler
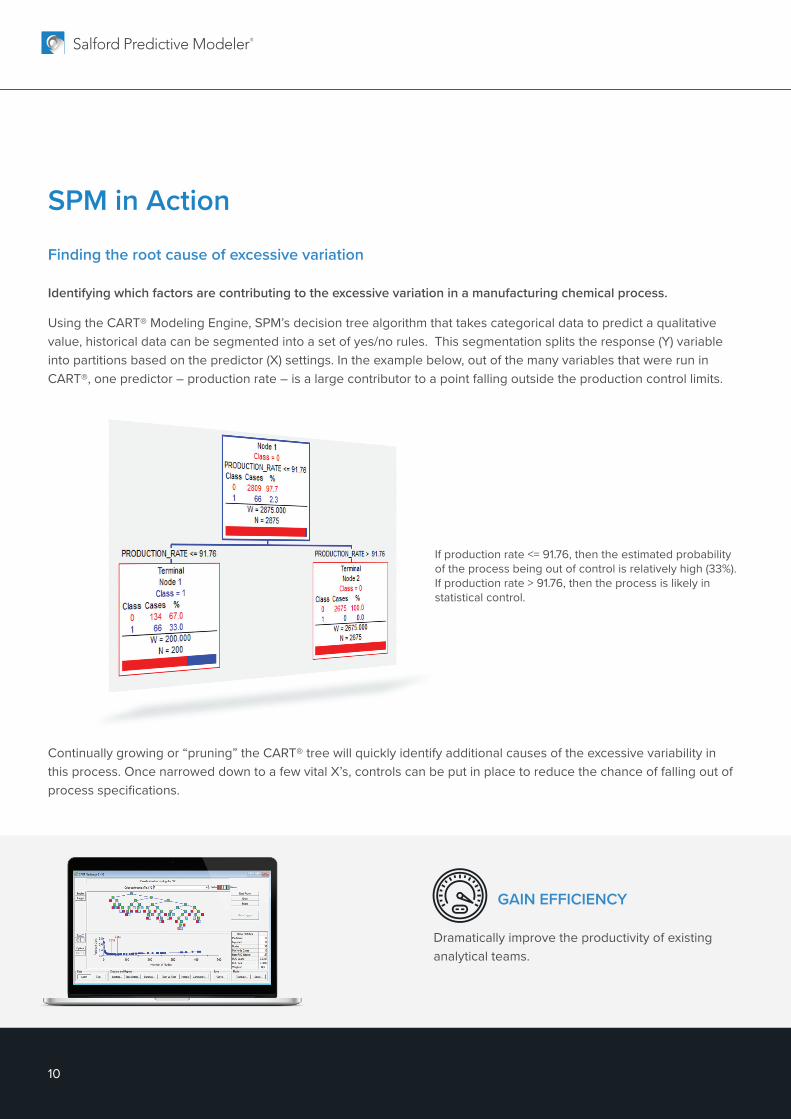
SPM in Action
Finding the root cause of excessive variation
Identifying which factors are contributing to the excessive variation in a manufacturing chemical process.
Using the CART® Modeling Engine, SPM’s decision tree algorithm that takes categorical data to predict a qualitative value, historical data can be segmented into a set of yes/no rules. This segmentation splits the response (Y) variable into partitions based on the predictor (X) settings. In the example below, out of the many variables that were run in CART®, one predictor – production rate – is a large contributor to a point falling outside the production control limits.
Continually growing or “pruning” the CART® tree will quickly identify additional causes of the excessive variability in this process. Once narrowed down to a few vital X’s, controls can be put in place to reduce the chance of falling out of process specifications.
If production rate <= 91.76, then the estimated probability of the process being out of control is relatively high (33%). If production rate > 91.76, then the process is likely in statistical control.
GAIN EFFICIENCY
Dramatically improve the productivity of existing analytical teams.
minitab.com/spm/ 11
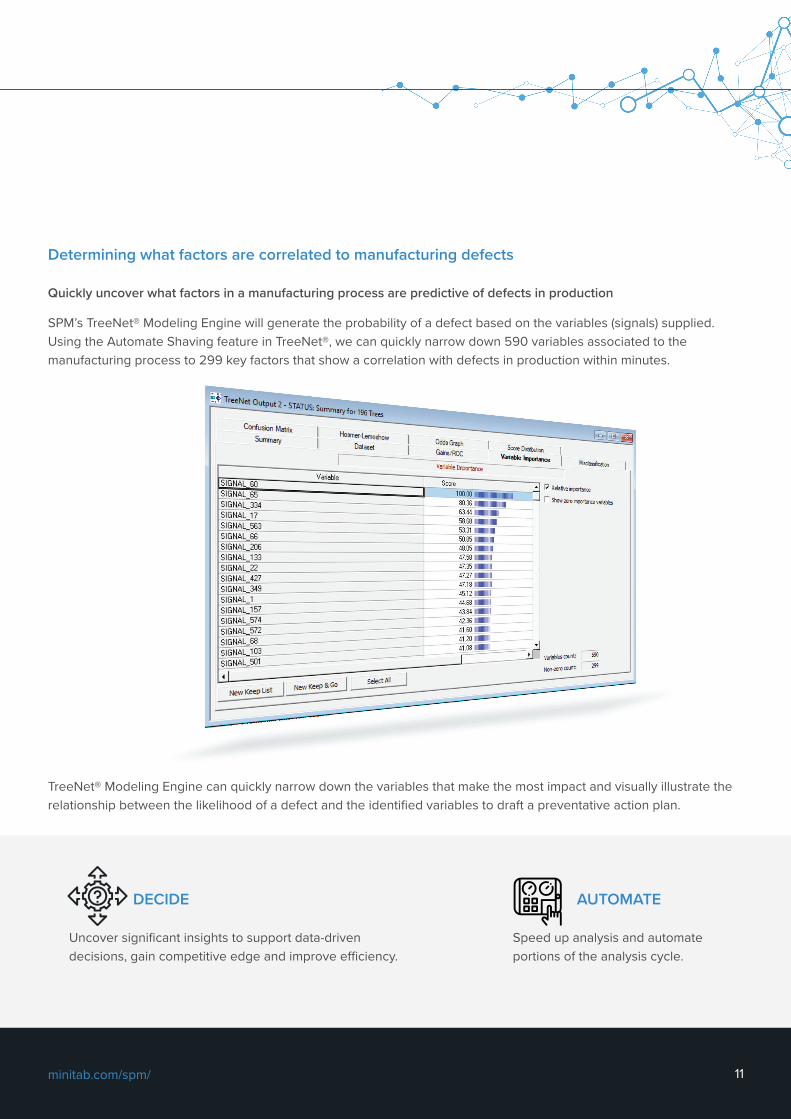
Determining what factors are correlated to manufacturing defects
Quickly uncover what factors in a manufacturing process are predictive of defects in production
SPM’s TreeNet® Modeling Engine will generate the probability of a defect based on the variables (signals) supplied. Using the Automate Shaving feature in TreeNet®, we can quickly narrow down 590 variables associated to the manufacturing process to 299 key factors that show a correlation with defects in production within minutes.
TreeNet® Modeling Engine can quickly narrow down the variables that make the most impact and visually illustrate the relationship between the likelihood of a defect and the identified variables to draft a preventative action plan.
AUTOMATE
Speed up analysis and automate portions of the analysis cycle.
DECIDE
Uncover significant insights to support data-driven decisions, gain competitive edge and improve efficiency.
12
Salford Predictive Modeler
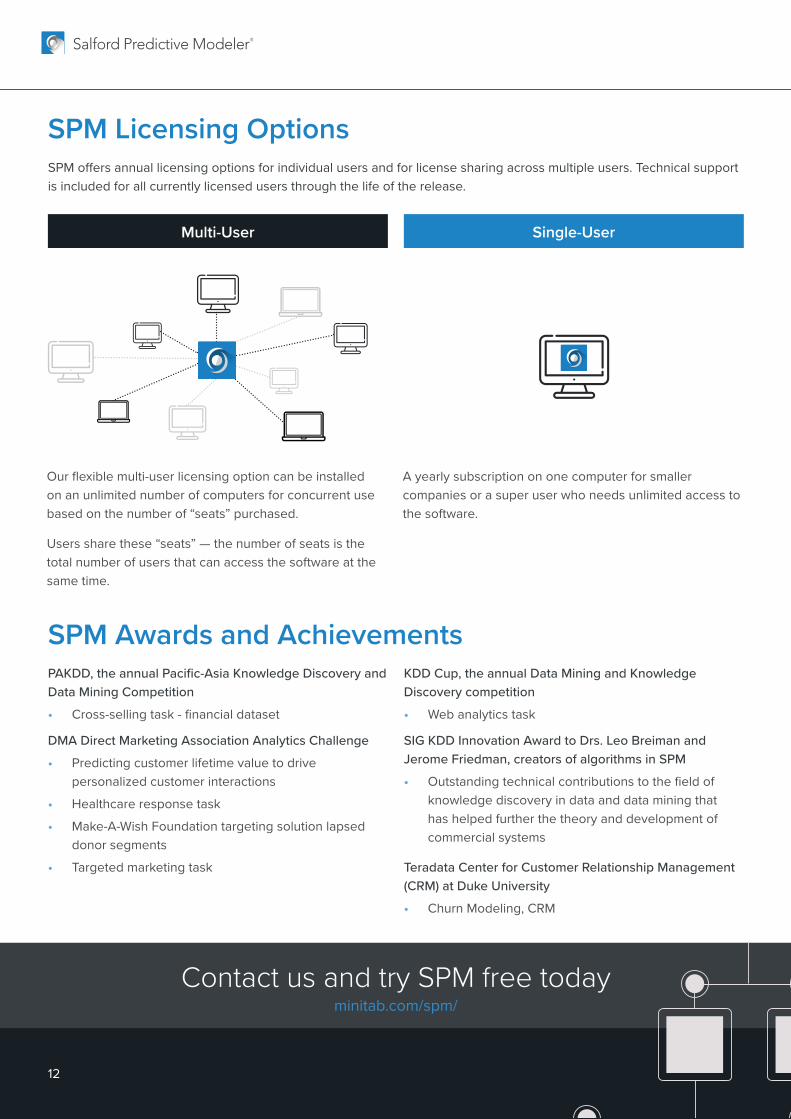
SPM offers annual licensing options for individual users and for license sharing across multiple users. Technical support is included for all currently licensed users through the life of the release.
SPM Awards and AchievementsPAKDD, the annual Pacific-Asia Knowledge Discovery and Data Mining Competition
• Cross-selling task - financial dataset
DMA Direct Marketing Association Analytics Challenge
• Predicting customer lifetime value to drive personalized customer interactions
• Healthcare response task
• Make-A-Wish Foundation targeting solution lapsed donor segments
• Targeted marketing task
KDD Cup, the annual Data Mining and Knowledge Discovery competition
• Web analytics task
SIG KDD Innovation Award to Drs. Leo Breiman and Jerome Friedman, creators of algorithms in SPM
• Outstanding technical contributions to the field of knowledge discovery in data and data mining that has helped further the theory and development of commercial systems
Teradata Center for Customer Relationship Management (CRM) at Duke University
• Churn Modeling, CRM
SPM Licensing Options
Single-UserMulti-User
Contact us and try SPM free todayminitab.com/spm/
Our flexible multi-user licensing option can be installed on an unlimited number of computers for concurrent use based on the number of “seats” purchased.
Users share these “seats” — the number of seats is the total number of users that can access the software at the same time.
A yearly subscription on one computer for smaller companies or a super user who needs unlimited access to the software.