
SPM: A General Linear Approach - MIT CSAIL of Mathematics and Statistics, McGill University,...
41
` Statistical parametric maps in functional imaging: A general linear approach Friston KJ 1 , Holmes AP 2 , Worsley KJ 3 , Poline J-P 1 Frith CD 1 and Frackowiak RSJ 1 1. The Wellcome Dept. of Cognitive Neurology, Institute of Neurology, Queen Square WC1N 3BG and the MRC Cyclotron Unit, Hammersmith Hospital, W12 OHS, UK 2. Dept. of Statistics, Glasgow University, Glasgow G12 8QQ UK 3. Dept of Mathematics and Statistics, McGill University, Montreal H3A 2K6 CANADA Address for correspondence Karl J Friston c/o: The MRC Cyclotron Unit, Hammersmith Hospital DuCane Road London W12 OHS UK Tel (081) 740 3162 Fax (081) 742 2987 email [email protected] Keywords: Statistical Parametric Maps, Analysis of Variance. General Linear Model, Statistics, Functional imaging, Gaussian Fields, Functional anatomy.
Transcript of SPM: A General Linear Approach - MIT CSAIL of Mathematics and Statistics, McGill University,...

`Statistical parametric maps in functional
imaging: A general linear approach
Friston KJ1, Holmes AP2, Worsley KJ3, Poline J-P1 Frith CD1 and Frackowiak RSJ1
1. The Wellcome Dept. of Cognitive Neurology, Institute of Neurology, Queen Square
WC1N 3BG and the MRC Cyclotron Unit, Hammersmith Hospital, W12 OHS, UK
2. Dept. of Statistics, Glasgow University, Glasgow G12 8QQ UK
3. Dept of Mathematics and Statistics, McGill University, Montreal H3A 2K6
CANADA
Address for correspondence
Karl J Friston
c/o: The MRC Cyclotron Unit, Hammersmith Hospital
DuCane Road
London W12 OHS UK
Tel (081) 740 3162
Fax (081) 742 2987
email [email protected]
Keywords: Statistical Parametric Maps, Analysis of Variance. General Linear Model,
Statistics, Functional imaging, Gaussian Fields, Functional anatomy.

Abstract
Statistical parametric maps are spatially extended statistical processes that are used to
test hypotheses about regionally specific effects in neuroimaging data. The most
established sorts of statistical parametric maps (e.g. Friston et al 1991, Worsley et al
1992) are based on linear models, for example ANCOVA, correlation coefficients and t
tests. In the sense that these examples are all special cases of the general linear model it
should be possible to implement them (and many others) within a unified framework.
We present here a general approach that accommodates most forms of experimental
layout and ensuing analysis (designed experiments with fixed effects for factors,
covariates and interaction of factors). This approach brings together two well
established bodies of theory (the general linear model and the theory of Gaussian
Fields) to provide a complete and simple framework for the analysis of imaging data.
The importance of this framework is twofold: (i) Conceptual and mathematical
simplicity, in that the small number of operational equations used are the same,
irrespective of the complexity of the experiment or nature of the statistical model and (ii)
the generality of the framework provides for great latitude in experimental design and
analysis.
Introduction
The aim of this paper is to describe and illustrate an implementation of the general
linear model that facilitates a wide range of hypothesis testing with statistical parametric
maps. This approach can be used to make statistical comparisons ranging from an
unpaired t test to linear regression in the context of analysis of covariance. Its
importance lies in (i) expediency; in that a single conceptual and algorithmic framework
can replace the many currently employed; (ii) generality; in that experimental design is
completely unconstrained (in the context of the general linear model) and (iii)
portability; these linear models can be applied to any method of constructing a
statistical parametric map.
Functional mapping studies (e.g. activation studies or comparing data from
different groups) are usually analyzed with some form of statistical parametric
mapping. Statistical parametric mapping refers to the construction of spatially extended
statistical processes to test hypotheses about regionally specific effects. Statistical
parametric maps (SPMs) are image processes with voxel values that have, under the
null hypothesis, a known distributional approximation (usually Gaussian).
The power of statistical parametric mapping is largely due to the simplicity of the
underlying idea: Namely one proceeds by analyzing each voxel using any (univariate)
statistical parametric test. The resulting statistics are assembled into an image, that is
then interpreted as a spatially extended statistical process. SPMs are interpreted by
referring to the probabilistic behaviour of stationary Gaussian fields (e.g. Adler 1981).
Stationary fields model not only the univariate (univariate means pertaining to one
variable) probabilistic characteristics of the SPM but also any stationary spatial
covariance structure (stationary means not a function of position). 'Unlikely' regional
excursions of the SPM are interpreted as regionally specific effects (e.g. activations or
differences due to pathophysiology). In activation studies regional or focal activation is
attributed to the sensorimotor or cognitive process that has been manipulated

experimentally. This characterisation of physiological responses appeals to functional
specialization, or segregation, as the underlying model of brain function. When
comparing one group of subjects with another, a local excursion is taken as evidence of
regional pathophysiology. When the physiological and cognitive (or sensorimotor)
deficits are used to infer something about functional anatomy; this inference is usually
based on a lesion-deficit model of brain organization. One could regard all applications
of statistical parametric mapping as testing some variant of the functional segregation or
lesion-deficit hypothesis.
The idea behind statistical parametric mapping is, of course, not new. Statistical
parametric mapping represents the convergence of two earlier ideas; change distribution
analysis and significance probability mapping. Change distribution analysis was a
pioneering voxel-based assessment of neurophysiological changes developed by the St.
Louis group for PET activation studies (e.g. Fox and Mintun 1989). This technique
provided a mathematical underpinning for the powerful subtraction paradigm still
employed today. Significance probability mapping was developed in the analysis of
multichannel electrophysiological (EEG) data and involves the construction of
interpolated pseudomaps of a statistical parameter. The fact that SPM has the same
initials is not a coincidence, and represents a nod to its electrophysiological counterpart.
Unlike significance probability maps in electrophysiology, SPMs are well behaved in
the sense they are approximated by stationary, spatially extended stochastic processes
(due to the fact that neuroimaging samples uniformly and that the point spread function
is stationary). This well behaved and stationary aspect of SPMs (under the null
hypothesis) meant that theoretical advances were made, to a point where this area is
growing rapidly and is an exciting part of applied spatial statistics. This development
has been in the context of the theory of Gaussian fields (e.g. Friston et al 1991,
Worsley et al 1992, Worsley et al 1993a, Worsley 1994, Friston et al 1994); in
particular the theory of level-crossings (Friston et al 1991) and differential topology
(Worsley et al 1992).

SPMs can be as diverse as the experimental design and univariate statistics used in
their construction. Experimental designs in functional neuroimaging can be broadly
divided into; (i) subtractive, (ii) parametric and (iii) factorial. Their application can be
either to activation studies (time-series) or to group studies where each individual is
studied once. Cognitive or sensorimotor subtraction is the best known example of the
subtraction design in activation studies (e.g colour - Lueck et al 1991, or higher
cognitive function - Frith et al 1992). Categorical comparisons of different groups
using SPMs represent another common application of statistical parametric mapping
(e.g. depression - Bench et al 1992). Parametric designs include studies where some
physiological, clinical, cognitive or sensorimotor parameter is correlated with
physiology to produce an SPM of the significance of the correlation or regression. In
activation studies this may be the time on target during a visuomotor tracking paradigm
(Grafton et al 1993), performance on free recall (Grasby et al 1994).or frequency of
stimulus presentation (Price et al 1993). In the analysis of different populations the
parameter may reflect symptom severity (Friston et al 1992a) or some simple variable
such as age (Martin et al 1992). Clearly the parameter being correlated can be
continuous (e.g. time on target) or discrete (e.g. word presentation frequency).
Factorial designs provide the opportunity to consider an interaction between the
treatments or sorts of condition (two factors interact if the level of one factor affects the
effect of the other. At its simplest an interaction is a difference in a difference). In
activation studies this may be the interaction between motor activation (one factor) and
time (the other factor), an interaction that provides information about adaptation
(Friston et al 1992b). Another example of an interaction is between cognitive activation
and the effects of a centrally acting drug (Friston et al 1992c, Grasby et al 1993). In
summary there are many ways a hypothesis can be formulated and correspondingly
there are as many sorts of SPMs.
All the examples in the previous paragraph used SPMs in conjunction with a test
statistic (usually the t statistic or correlation coefficient) that represented a special case

of the general linear model. This begs the question 'is there a single general approach
that could accommodate all the above examples (and more)?' The purpose of this work
was to identify an instantiation of the general linear model that would do this.
This paper is divided into two sections. The first section deals with the theory behind
the general linear model, the implementation and making statistical inferences. This
section includes a brief review of how significant regional excursions (activation foci or
other regionally specific effects) can be characterized and identified. The second
section illustrates various applications of the approach, ranging from t tests to
interaction terms in analyses of covariance. The applications are illustrated with an
exemplary data set obtained during a word generation activation study of normal
subjects.

A general approach
The general linear model
The general linear model for a response variable xij (such as rCBF) at voxel j =
1,...,J is:
xij = gi1ß1j + gi2ß2j + ......giKßKj + eij 1
where i = 1,....,I indexes the observation (e.g. scan). The general linear model
assumes the errors (eij) are independent and identically distributed normally [N(0,
σj2)]. For example in activation studies this means one is assuming an equal error
variance (σj2) across conditions and subjects (but not from one voxel or brain structure
to the next). Here the ßkj are K unknown parameters for each voxel j.
The coefficients gik are explanatory variables relating to the conditions under which
the observation (e.g. scan) i was made. These coefficients can be of two sorts: (i) a
covariate (e.g. global CBF, time, plasma prolactin level, ... etc) in which case eqn(1) is
a familiar multivariate regression model or (ii) indicator-type or dummy variables,
taking integer values to indicate the level of a factor (e.g condition, subject, drug ... etc)
under which the response variable (rCBF) is measured. Mathematically speaking
there is no distinction between these two sort of variables but we make the distinction
for didactic reasons. Eqn(1) can be written in matrix form as a multivariate general
linear model;
X = Gß + e 2
Here X is a rCBF data matrix with elements xij X has on column for each voxel j and
one row for each scan. The matrix G is comprised of the coefficients gik and is called
the design matrix. The design matrix has one row for every scan and one column for
every effect (factor or covariate) in the model. ß = [ß1 | ß2 | , . . . . , | ßJ] is the

parameter matrix where ßj is a column vector of parameters for voxel j. e is a matrix
of normally distributed error terms. It may be noted that eqn(2) does not have a
constant term. The constant term can be explicitly removed by mean correcting the data
matrix or implicitly by adding a column of ones to G. For didactic purposes we
assume the data X are mean corrected. Least squares estimates of ß say b, satisfy the
normal equations (Scheffe 1959 p9):
GTG b = GTX
if G is of full rank then GTG is invertible and the least squares estimates are uniquely
given by
b = (GTG)-1GTX
where Ebj = ßj and Varbj = σj2 (GTG)-1 3
If the errors are normally distributed then the least squares estimates are also the
maximum likelihood estimates and are themselves normally distributed (see Scheffe
1959). Varbj is the variance-covariance matrix for the parameter estimates
corresponding the jth voxel.
These simple equations can be used to implement a vast range of statistical analyses.
The issue is therefore not so much the mathematics but the formulation of a design
matrix (G) appropriate to the study design and the inferences that are sought. This
section describes one general approach that is suited to functional imaging studies.
The design matrix can contain both covariates and indicator variables reflecting the
experimental design. Each column of G has an associated unknown parameter in the
vectors ßj. Some of these parameters will be of interest [e.g. the effect of particular
sensorimotor or cognitive condition or the regression coefficient of rCBF (the response
variable) on reaction time (covariate)]. The remaining parameters will be of no interest

and pertain to confounding effects (e.g the effect of being a particular subject or the
regression slope of voxel activity on global activity). Confounding here is used to
denote an uninteresting effect that could confound the estimation of interesting effects
(e.g. the confounding effect of global changes on regional activations). The two levels
(indicator vs covariate and interesting vs not interesting) suggest that G (and ß) can be
split twice into four partitions G = [ Gl | Gc | Hl | Hc ] and similarly ß = [ßlT | ßcT |
lT | cT]T with estimators b = [blT | bcT | g lT | gcT]T. Here effects of interest are
denoted by the G partitions and confounding effects of no interest by H partitions. The
subscripts l or c refers to the nature of the effect (level within a factor or a covariate).
There is a fundamental distinction between effects that are interesting and those that are
not, as will be seen below. The distinction between levels and covariates is not
mathematically important but helps in understanding and describing the nature of the
design matrix. Although there is no mathematical difference between treating the level
and covariate separately and together, we actually deal with them as separate matrices in
our software implementation. This helps to clarify things when reading the code and
interacting with the programs. Each partition of the design matrix has one row for each
scan and one column for each effect modelled by that partition. Using these partitions
Eqn(2) can be expanded:
X = Gl ßl + Gc ßc + Hl l + Hc c + e 4
where Gl represents a matrix of 0s or 1s depending on the level or presence of some
interesting condition or treatment effect (e.g the presence of particular cognitive
component). The columns of Gc contain the covariates of interest that might explain
the observed variance in X (e.g. dose of apomorphine or 'time on target'). Hl
corresponds to a matrix of indicator variables denoting effects that are not of any
interest (e.g. of being a particular subject or block effect). The columns of Hc contain
covariates of no interest or 'nuisance variables' such as global activity or confounding
time effects ßl are effects due to the treatments of interest (e.g. activation due to

verbal fluency). ßc are the regression coefficients of interest. l are the effects of no
interest (e.g. block or subject effects) and c are the regression coefficients for the
nuisance variables or confounding covariates.
To make this general formulation clear consider the model for an unpaired t test. In
this instance G = [Gl], where the elements of the column vector Gl are 0 for all rCBF
measurements in one group and 1 for the other group. A simple regression of reaction
time on rCBF would be implemented by making G = [Gc] where Gc is a column vector
containing the reaction time data. The randomized block design ANCOVA
implemented by the MRC SPM software corresponds to G = [Gl | Hl | Hc] where Gl
specifies the activation condition, the Hl account for subject (block) effects and Hc is a
column vector of confounding global CBF covariates. The point to be made here is
that nearly every conventional statistical design is a special case of eqn(4) or in other
words most linear parametric analyses can be implemented with eqn(4) .
In this paper scaling the images to remove global or whole brain effects is considered
a pre-processing step. If we tried to incorporate a geometric scaling into the statistical
model we would end up with a model that was more complicated than those considered
here.
Experimental design - the forms for Gl and Hl
In functional imaging one measures some physiological variable, usually
hemodynamic (e.g. rCBF) in a number of conditions (levels of a factor). In many
instances the same conditions are measured in a series of blocks; for example in PET,
baseline and activations (conditions or factor levels) are repeated in a number of
subjects (blocks or plots). In fMRI different conditions are usually repeated serially in
blocks over time.
The situation gets more complicated if one repeats the activation study under different
conditions or in different subjects. The designs appropriate for this situation are called
split-plot designs [a good reference for psychology applications is Winer 1971) and see
Worsley et al (1991) for an example in the PET literature using region of interest

analysis]. There are some complications that can arise when using split-plot designs,
however the situation is simplified if the block (or subject) effects are always included
thereby restricting the analysis to within-block effects. This is the approach taken here.
An example of this sort of experimental design, in PET, would be two verbal fluency
studies, one in a series of normal subjects and one in a group of schizophrenic patients,
or a psychopharmacological activation study in two groups of normal subjects studied
with and without an appropriate antagonist. An example in fMRI would be the
repetition of a blocked series of sensorimotor conditions in a different subject. In these
examples the design is not completely blocked. In other words all conditions within
and between studies are not repeated in the same block (e.g. subject). For example one
cannot perform a verbal fluency activation study in a subject, give the subject
schizophrenia, and then repeat the activation study. This partial blocking problem
suggests the following form for Gl and Hl: Let the experiment be divided into a series
of studies. In each of the s = 1,.....S studies ns conditions are measured in all of ms
subjects (or more generally blocks). There is however no requirement for the number
of conditions or subjects (blocks) within each study to be the same. This design is, we
consider, the most accommodating for functional imaging experiments. One can think
of this design as allocating ∑ns conditions to ∑ms blocks in any permutation allowed.
The column position of the '1' in the ith row of Gl denotes which of the ∑ns conditions
the ith scan was obtained under and the position of the column with a '1' in the ith row
of Hl denotes the subject (block) in which that measurement was made.
The suggested terminology, adopted in this paper, divides the experiment into
studies. Each study comprises one or more scans on one or more subjects (more
generally bocks). Each subject in scanned in one or more conditions. Conditions can
be variously classified and indeed may include several treatments [e.g. entreating
subjects to perform a series of psychological tasks (cognitive treatments) with and
without a drug (pharmacological treatments)]. A single level of any cognitive or
sensorimotor treatment is a task and may be repeated in a number of conditions; but
note that the first time a task is administered is one condition and the second time is

another condition. The design matrix depends only on studies, subjects and
conditions. The effects of a specific task are assessed by comparing one set of
conditions with another using contrasts, as discussed in later sections.
This one-way layout does not explicitly model interaction terms or effects due to
study. This simplicity is deliberate and allows the investigator to test for the [simple]
main effects of condition and interactions between condition effects and study post hoc
(by testing for the appropriate effects on the ∑ns condition specific parameters ßl).
The alternative would be to model these effects explicitly in G. The problem with this
approach is that the effect of interest would only be assessed in an omnibus sense. For
example imagine a pharmacological activation (with P scans or conditions) performed
in three groups, a normal, a schizophrenic and a depressed group. The interaction
between condition and study (i.e. a regionally specific differential response to the drug
challenge, across the three diagnostic groups) could be assessed using the ratio of
variances (see below) but there would be no information about which group differed
from which, or about the nature of the effect (augmented or blunted response). All
these pairwise, direction-specific comparisons could be made post hoc if the experiment
was treated as 3P (∑ns) distinct conditions. The proposed layout does exactly this.
A note of caution here: The multiple study (or split-plot) approach is proposed
primarily for the analysis of interactions between condition and studies (and main
effects of condition). Testing for the main effects of study is not so straightforward.
This is because the estimates of the error terms are based on a within-block analysis and
may not be appropriate for comparing between-block effects such as those due to study
(See Winer 1971).
The solution implicit in eqn(3) requires that G be of full rank or non-singular. This is
guarantied for the covariates, assuming all the covariates are linearly independent;
however it is sometimes the case that the Gl and Hl are not linearly independent. This
is dealt with by applying constraints to the design matrix. In the current context this is
effected by constraining all the block effects (effects not of interest) to sum to zero.

This is equivalent to treating the uninteresting effects as residuals about the effects of
interest.
Adjusting for the confounding effects of no interest
It is often wise to report physiological changes from a particular voxel in order to
indicate the size of the physiological effect. This is best demonstrated by reporting the
data (e.g. rCBF) after adjusting for the confounding effects of nuisance variables (e.g.
global activity) and other spurious effects (e.g. block effects). After estimating ß the
adjusted data X* are given by discounting the effects of no interest (i.e. in mean
corrected form):
X* = X - [Hl | Hc].[ g lT | gcT]T
5
[Hl | Hc] represents the uninteresting or confounding parts of the design matrix
(obtained by stacking the uninteresting factor level partition and the uninteresting
covariates partitions side by side). [ g lT | gcT]T represents the corresponding parameter
estimates. The g l and gc are linear estimators of l and ch, the uninteresting
components of ß. The adjusted mean condition affects are given by the elements of bl
and the regression coefficients by bc.
Statistical inference - Omnibus or overall effects at each voxel
In this section we address statistical inferences about the effects of interest (condition
and covariates of interest). We also clarify the relationship between statistical
parametric mapping (i.e. massive univariate testing) and multivariate analysis.
The omnibus significance is assessed by testing the null hypothesis that including the
effects of interest does not significantly reduce the error variance. This is equivalent to
testing the null hypothesis that ßl and ßc are zero. In the sense that this inference does
not address any specific condition (or covariate) it is referred to as an omnibus test.
Note that in contradistinction to the use of 'omnibus' in reference to tests that pertain to
the whole image (e.g. the gamma-2 of Fox et al 1988) 'omnibus' is used here in a
univariate sense for a particular voxel [this use of omnibus is preferred because
detecting a significant regional effect (see below) is also an implicit confirmation that an
effect exists somewhere in the image; i.e. in the old omnibus sense].
The null hypothesis that the effects embodied in Gl and Gc are not significant can be
tested in the following way. The sum of squares and products due to error R(Ω) is
obtained from the difference between the actual and estimated values of X (Ω is the
alternative hypothesis to the null hypothesis and includes the effects of interest):
R(Ω) = (X - G.b)T(X - G.b) 6
The error sum of squares and products under the null hypothesis R(Ω0) i.e. after
discounting the effects of interest (Gl and Gc) are given by:
R(Ω0) = (X - [Hl | Hc].[g lT | gcT]T)T.(X - [Hl | Hc].[g lT | gcT]T)
7
Clearly if Hl and Hc do not exist this simply reduces to the sum of squares and
products of the response variable (X TX ). At this point we could (in principle) proceed
in one of two directions. The first direction would be to test the omnibus significance
of all effects of interest over all voxels. This would correspond to a multivariate
analysis of variance or covariance (MANOVA or MANCOVA). Although many
standard texts deal with MANOVA and MANCOVA separately there is no distinction in
the context of the current analysis. The second approach would be to test for omnibus
significance over effects of interest in a univariate sense at each voxel (c.f. ANOVA or
ANCOVA at each voxel). The second is employed by statistical parametric mapping
and preserves the regional specificity of the omnibus test at the cost of not being able to

extend the 'omnibusness' to the whole brain (i.e. a multivariate omnibus test). The
multivariate omnibus significance would be tested with a single statistic, for example:
Λ = | R(Ω) | / | R(Ω0) | 8
where Λ is Wilk's statistic (known as Wilk's Lambda). A special case of this test is the
Hotelling T2 test (see Chatfield and Collins 1980). However there is a problem here;
namely R(Ω) and R(Ω0) are both singular (meaning Λ is undefined). This is a simple
result of having more voxels than scans. This is one reason statistical parametric
mapping adopts a mass univariate approach (mass univariate analyses implemented in
parallel at each voxel). For a single voxel j eqn(8), after appropriate transformations
reduces to the univariate ratio of variances (see Chatfield and Collins 1980 for details):
Fj = (r/[r0 - r]) . [Rj(Ω0) - Rj(Ω)] / Rj(Ω) 9
where Rj(Ω) corresponds the the jth element on the leading diagonal of R(Ω) and
similarly for Rj(Ω0). Fj is distributed according to the F distribution with degrees of
freedom r0 - r and r. Generally r = I - rank(G) and r0 = I - rank( [Hl Hc] ) where I is
the total number of scans. If the data have been mean corrected and Hl has not, it is
necessary to remove an extra degree of freedom from r0. The Fj can be displayed as an
image to create an SPMF directly testing the overall significance of all effects
designated 'of interest'. In practice SPMFs are seldom employed as direct tests of
hypotheses but this form of omnibus testing is very useful for selecting subsets of
voxels that are used in some further analysis [e.g. singular value decomposition or
principal component analysis. See Friston et al (1993)].
Statistical inference - specific effects at each voxel
In the previous section the F ratio of variance was used to make some inference about
the effects of all conditions and covariates of interest. In this section the significance of

specific effects is examined. This is effected with the t statistic using linear compounds
or contrasts of the parameter estimates bj = [b1j , b2j , ......]T. For example if we
wanted to test for activation effects between conditions one and two then we would use
the contrast c = [ -1 1 0 0 ....]. The significance of a particular linear compound of
effects at voxel j is tested with:
tj = c.bj /εj
where the standard error for voxel j = σ2j is estimated by εj2 [c.f. eqn(3)]:
εj2 = ( Rj(Ω) / r ) c.(GTG)-1.cT 10
tj has the Student's t distribution with degrees of freedom r. When displayed as an
image the tj constitute an SPMt and represent a spatially extended statistical process
that directly reflects the significance of the profile of effects 'prescribed' by the contrast
c.
Statistical inference - specific effects - over the entire SPM
In this section we address the problem of how to interpret the SPMt in terms of
probability levels or p-values. The problem here is that an extremely large number of
non-independent univariate comparisons have been performed and the probability that
any region of the SPM will exceed an uncorrected threshold by chance is relatively
high. In recent years advances have been made that have solved this problem. These
advances have focussed on chosing thresholds that render the chance probability of
finding an activation focus, over the entire SPM, suitably small (e.g. 0.05). The
threshold can be of two types (i) a critical height that the region has to reach or (ii) a
critical size (above some threshold) that a region must exceed before it is considered
significant. Another way of looking at these approaches is to consider that a local
excursion of the SPM (a connected or contiguous subset of voxels above some
threshold) can be characterized by its maximal value (Z) or by its size (n - the number
of voxels that constitute the region). Both these simple characterizations have an
associated probability of occurring by chance over the volume of the SPM. These two
probabilities form the basis for making a statistical inference about any observed
regional effect:
The analyses behind the distributional approximations for Z and n derive from the
theory of continuous, strictly stationary, stochastic Gaussian random fields (Gaussian
here refers to the multivariate Gaussian probability distribution of any subset of points,
not to the autocorrelation function). To simplify the analysis the SPMt is
transformed to a SPMZ using a probability integral transform or other standard
device. Strictly speaking this univariate transformation does not make a t-field into a
Gaussian field unless the degrees of freedom of the SPMt are very high. In what
follows we assume that we are dealing with reasonably high degrees of freedom and
that the SPMZ is a reasonable lattice representation of an underlying continuous
Gaussian field. Analytical expressions for the distributional approximations of tmax
(the largest t value) have now been established (Worsley et al 1993,Worsley 1994)
however approximations for nmax (the size of the largest region) have not.
The p-value based on Z, the largest value in the region
The probability of getting at least one voxel with a Z value of say height u or more,
in a given SPMZ of volume S [PS(Z > u)] is the same as the probability that the
largest Z value is greater than u [P(Zmax > u)]. This is the same as the probability of
finding at least one region above u. The central tenet here relies on the fact that the
probability of getting at least one region above u and the expected number of regions
tend to equality (at high values of u).
PS(Z > u) = P(Zmax > u) = P(m ≥ 1) ≤ Em
11

Where m is the number of regions. The problem therefore reduces to finding the
expected number of foci at u. An analysis was presented in Friston et al (1991) that
showed how this expectation could be identified using the theory of Gaussian fields.
This analysis approximated activation foci with suprathreshold ellipsoid regions.
Subsequently the Euler characteristic (the number of blobs minus the number of holes)
has been proposed as an approximation to the number of foci. The Euler characteristic
was introduced in a key paper by Worsley et al (1992) that also established a formal
link between the theory presented in Friston et al (1991) and earlier work on the
expected number of maxima (see Adler 1981) [the expressions derived on the basis of
ellipsoid regions (Friston et al 1991) and those based on maxima (Adler 1980) were
shown to have, asymptotically, the same form but differ by a factor of π/4 at infinitely
high thresholds (Worsley et al 1992)]. The important issue here is that whether one
uses the number of foci, the Euler characteristic or the number of maxima, very
consistent results are obtained. At high thresholds the number of regions, the number
of maxima and the Euler characteristic all tend to the same value. The Euler
characteristic is more amenable to mathematical analysis than the earlier formulations
and has led to extensions to SPMt and SPMF (Worsley et al 1993a, Worsley
1994). For simplicity we will work with the number of maxima (Hasofer 1978):
P(Zmax > u) ≤ Em) ≈ S (2π)-(D+1)/2 W-D uD-1 e-u2/2 12
W is a measure of smoothness and is related to the full width at half maximum
(FWHM) of the SPM’s “resolution”. Equivalently W is inversely related to the number
of “resolution elements” or Resels (R) that fit into the total volume (S) of the D-
dimensional SPM. (R = S/FWHMD).
In practice W can be determined directly from the effective FWHM if it is known
when W = FWHM/√(4loge2) or estimated post hoc using the measured variance of the
SPMZ's first partial derivatives:

W =i
D
=∏
1
Var∂SPMZ/∂xi -1/(2D) 13
see Friston et al (1991) and Worsley et al (1992) for more details.
The p-value based on n, the size of the region
The probability of getting one or more regions of say size k or more in a given
SPMZ thresholded at u (say SPMuZ) of volume S [PS(n > k)] is the same as the
probability that the largest region consists of k or more voxels [P(nmax > k)].
Expressions for this probability rely on a number of previously known distributional
approximations and a conjecture that n2/D has an exponential distribution (in the limit of
high thresholds) (Nosko 1969, 1970; Adler 1981). By assuming this form for P(n =
x) to be asymptotically correct we (Friston et al 1994) determined the parameters of the
distribution by reference to its known moments. It was shown that:
PS(n > k) = P(nmax ≥ k) = 1 - exp( -Em.e-βk2/D )
where β = [Γ(D/2 + 1).Em/S.Φ(-u)]2/D 14
Where Φ(-u) is the error function (integral of the unit Gaussian distribution)
evaluated at the threshold chosen (-u). Eqn(14) gives an estimate of the probability of
finding at least one region with k or more voxels in an SPMuZ. Notice that u (the
threshold) can be chosen. The optimum threshold should maximize sensitivity. In a
previous paper we derived an approximate expression for the sensitivity to a 'random'
signal (Friston et al 1994). We demonstrated how the sensitivity, or power, depends
on an interplay between the shape of the signal and the threshold used. Our results
indicated that low thresholds are more powerful for activation foci that are larger than
the FWHM of the imaging device. In the sense that all signals (that are not subject to
partial volume effects) arise in structures that satisfy this constraint one might anticipate
that low thresholds will be generally the more powerful. On the other hand, if the
FWHM is bigger than at least some focal activations, the significance based on peak
height may be more powerful. In what follows we present both characterizations
It should be born in mind that the results presented here are only good
approximations for large thresholds, so it would seem prudent to keep the thresholds
high enough for the p-values to remain valid. Simulations suggest that the
approximations hold reasonably well for thresholds as low as 2.4 (see Friston et al
1994).
Applications
This section describes the data used to illustrate the diversity of ways the expressions
above can be used. The PET data were obtained from normal subjects during a word
generation activation paradigm. The results of each analysis will be displayed in the
same format. This format includes the design matrix, the contrast, the SPMZ and a
table of regions that have been characterized in terms of their size and their maximal
height [PS(nmax > k) and PS(Zmax > u)].
The data
The data were obtained from five subjects scanned 12 times (every eight minutes)
whilst performing one of two verbal tasks. Scans were obtained with a CTI PET
camera (model 953B CTI Knoxville, TN USA). 15O was administered intravenously as
radiolabelled water infused over two minutes. Total counts per voxel during the
buildup phase of radioactivity served as an estimate of regional cerebral blood flow
(rCBF) (Fox and Mintun 1989). Subjects performed two tasks in alternation. One task
involved repeating a letter presented aurally at one per two seconds (word shadowing).
The other was a paced verbal fluency task, where the subjects responded with a word
that began with the letter presented (intrinsic word generation). To facilitate intersubject
pooling, the data were realigned and spatially [stereotactically] normalized (Friston et al
submitted) and smoothed with an isotropic Gaussian kernel (FWHM of 16mm).

A single subjects analysis
This example introduces the basic implementation and highlights an equivalence
between various simple statistical tests (e.g. unpaired t-tests and testing for
correlations). It deals with situations in which there is one subject scanned in many
conditions or (equivalently from a mathematical perspective) many subjects scanned
under the same condition. This section also covers comparing two groups of scans
with paired and unpaired t tests. Finally it introduces the notion of removing
confounding effects using linear regression.
In this the first and simplest example we address the effects of activations due to
intrinsic word generation or, equivalently, deactivations due to word repetition
(extrinsic word generation) in a single subject (one of the five studied). Following the
philosophy of cognitive subtraction this is effected by subtracting the word shadowing
from the verbal fluency conditions to assess the activations associated with cognitive
components in word generation that are not in word shadowing (e.g. the intrinsic
generation of word representations and the 'working memory' for words already
produced). In this instance we have one study, one subject and 12 conditions.
(comprising two tasks). The condition effects of interest are tested using a covariate of
the form Gc = [-1 1 -1 ....1]T i.e. -1 for word shadowing and 1 for word generation.
Of course we can treat this covariate as levels in a factor and Gc could be renamed Gl.
As stated in the theory section there is no mathematical distinction: In this instance
there is no difference between regressing rCBF on a series of +1s and -1s or taking the
mean difference between odd and even scans. To account for the confounding effects
of global differences the global activities were considered as covariates of no interest
Hc. There are two covariate effects to be estimated (one interesting and the other not).
The analysis can be seen as an example of (i) multiple linear regression, (ii) ANCOVA
(regarding Gc as Gl) or (iii) a simple correlation after partialling out a 'nuisance'

variable or confound. The important point is that these perspectives are all rather
redundant because they are all exactly the same instantiation of the same linear model.
The design matrix G = [Gc | Hc] corresponding to this analysis is seen in Figure 1
(top right). The resulting SPMZ (top left) is seen to identify significant actions in the
left dorsolateral prefrontal cortex (including the opercular portion of Broca's area and
related insula), left extrastriate areas, right cerebellum, right and left frontal pole and
the precuneus. Note that the contrast is simply '1' for the covariate effect of interest
and zero elsewhere c = [1 0]. In general the p-values based on spatial extent are less
'significant' than those based on peak height. This would be expected if the regions
activated were smaller than the FWHM of the SPM [about 18 mm according to
eqn(13)].
In the above analysis we could have pretended that we had studied 12 individuals in
one of two states; with two studies, each with six subjects scanned in a single
condition. This has exactly the same degrees of freedom and gives exactly the same
SPMZ as above and (if we ignore the confounding covariate) can be seen as an
unpaired t-test at each voxel. If one had scanned 6 subjects under both tasks there
would be one study, six subjects and 2 conditions. The degrees of freedom in this
example would be less because one would also be estimating subject-specific (block)
effects and the design matrix would include a subject or block partition Hl (c.f. a
paired t-test). In general the degrees of freedom of the t statistic is equal to the number
of scans minus the number of estimated parameters (including a constant term, that may
be explicitly included in Hl or made implicit in the analysis by mean correction of the
data and covariates).
In the analysis of groups of subjects with scans obtained under the same condition
this design (using one covariate of interest) can be useful in indentifying regionally
specific associations between physiology and some behavioural or symptom score in a
parametric fashion (e.g. Friston et al 1992a).

An activation study using intersubject averaging
This example introduces the more general ANOVA-like layout and its extension to
ANCOVA, again using covariates to remove the effects of confounding or nuisance
variables. This removal reveals more clearly the underlying condition-specific effects
of interest and is exactly the same as that implemented in the previous section (i.e. by
linear regression). Three sorts of analyses are considered (subtractive, parametric and
factorial). All are implemented at the level of the contrast used in comparing condition-
specific effects.
In this case there is one study, five subjects and 12 conditions. We removed the
confounding effects of global activity by designating these as covariates of no interest
Hc. This example is equivalent to a one way ANCOVA with a completely blocked
design. There are 12 condition specific effects, five subject effects (block) and a
covariate effect. The SPMF corresponding to this analysis is depicted in Figure 2.
This SPM can be regarded as an image of the [significance of] variance introduced by
the experimental design (or more exactly the sums of squares due to condition effects
relative to error). The design matrix used in this example is seen in Figure 3 and is
displayed by placing the partitions in the same order as in Eqn(4) i.e. [ Gl | Gc | Hl | Hc
]. Here Gl models the 12 conditions and Gc is empty because there are no covariates
of interest. Because of the constraint on the design matrix only four subject effects are
estimated directly (see the corresponding design matrix Hl partition). Hc is seen to be a
column of global activities (on the far left). The objective of further analysis, using
contrasts, is to test specific hypotheses that particular differences between conditions
account for this variance in physiology:.
A subtractive approach
Suppose one wanted to identify significant activation foci associated with word
generation as above by pooling data from all the subjects. Having estimated the 12
condition-specific effects the effect of verbal fluency vs word shadowing is assessed
using a contrast that is 1 in all the verbal fluency conditions, -1 in the word generation

and 0 elsewhere c = [1 -1 1 -1 ... -1 0 0 0 0....]. The results of this analysis are
presented in Figure 3 which shows the design matrix, the contrast and the resulting
SPMZ. The results demonstrate significant activations in the left anterior cingulate,
left dorsolateral prefrontal cortex, operculum and related insula, thalamus and left
extrastriate (among others). The relationship of the left prefrontal and mediodorsal
thalamic activations, to the underlying anatomy is seen in Figure 4 which is the
SPMZ sectioned in three orthogonal planes and rendered on an arbitrary structural
MRI scan. The extent and regional topography of the dorsolateral prefrontal activation
is highlighted in Figure 5 by rendering the SPM onto the cortical surface of the same
structural scan as in the previous figure.
The correspondence between this group analysis and the single subject analysis can
be seen by comparing the SPMZs in Figures 1 and 3. The most conspicuous
difference is that unlike the group as a whole, the single subject fails to activate the
thalamus (see below) but overall there is a remarkable similarity.
A parametric approach
In this example we tested for monotonic and linear time effects using the contrast
depicted in Figure 6. The results of this analysis identify bilateral foci in the posterior
temporal regions, the precuneus and the left prefrontal and anterior cingulate that show
monotonic decreases in rCBF. These decreases are task-independent.
This example is trivial in its conception but is used here to introduce the notion of a
parametric approach to the data. Parametric approaches avoid many of the
shortcomings of 'cognitive subtraction'; and 'additive factors logic' in testing for
systematic relationships between neurophysiology and sensorimotor, psychophysical,
pharmacologic or cognitive parameters. These systematic relationships are not
constrained to be linear or additive and may evidence very nonlinear behaviour
reflecting complex interactions at a physiological or cognitive level (from a statistical
perspective these interactions are linear in the parameters).

A factorial approach
This example looks at regionally specific interactions, in this instance between the
activation effect due to intrinsic word generation and time. The contrast used is
depicted in Figure 7 and shows a typical mirror symmetry. The design matrix has not
changed but we are now testing for a specific profile of condition effects. The greatest t
values will obtain when the condition effects (i.e. relative activations) 'match' the
contrast. As the contrast initially goes up, down, up, down and then switches to
down, up, down up, this contrast will highlight those regions that de-activate early in
the experiment and activate towards the end. In other words those areas that show a
time-dependent augmentation of their activation. The areas implicated include left
frontal operculum, insula, thalamus and superior temporal cortex. Note that these
regional results suggest a true physiological 'adaptation' in the sense that it is the
physiological response (to a task component) that shows a time-dependent change
(contrast this with the task-independent changes of the previous section).
The SPMZ in this analysis is reported in a descriptive way only because no region
was assessed as significant (at p < 0.05). This means that unless one had made
specific predictions about which regions were going to be involved, no statistical
inference about regional activation could be made on the basis of these results.
This example also shows how to do a factorial experiment without explicitly
modeling interaction terms in the design matrix. This approach has proved powerful in
the demonstration of time-dependent adaptation during motor practice (Friston 1992b)
and in psychopharmacological activation studies crossing cognitive activation and
pharmacological manipulations (Grasby et al 1993). In the example above we have
described a time-dependent reorganisation of physiological responses to the same task.
It is tempting to call this plasticity, however the term plasticity means many things to
many people and hence the term should be used carefully.
The adjusted responses

Recall that adjusted data has been adjusted for uninteresting effects [see Eqn(5)]. As
an example of an adjusted response we have chosen data from a voxel from the left
thalamus. This region clearly shows a variable and complicated response with time-
dependent changes (see previous section). The adjusted data for the analysis of all
subjects for a voxel in the left mediodorsal thalamus is shown in Figure 8. The bars
represent the mean adjusted condition-specific estimates of rCBF and the dots
correspond to individual (adjusted) data. The regional activation from which this voxel
was selected is seen on orthogonal MRI sections in Figure 4. This thalamic response is
very interesting with no activation in the first 4 conditions and a profound activation in
the last six. At some point during the course of this experiment the physiological
changes supporting the cognitive processing elicited by verbal fluency changed
markedly to involve the mediodorsal thalamus and, by reference to figure 7, augment
responsiveness of the opercular cortex and insula.
The single subject analyses revisited
This section deals with situations were one wants to compare several activation
studies obtained in different groups. This sort of design is especially powerful in
looking at the effect of centrally active drugs, pathophysiology, clinical diagnosis etc,
on condition-specific activations, where the conditions may themselves involve several
treatments and the condition-specific effects may themselves be interaction terms (e.g.
the adaptation above). We take the limiting case of this general situation where there is
only one subject in one of two studies. This ties in neatly with the single subject
analysis above and allows us to make a number of points; however it should be
remembered that everything in the remainder of this section applies when the two (or
more) studies include more than one subject.
In this application we want to look at the first subject in the context of the remaining
four in terms of activations due to intrinsic word generation. Although we might
anecdotally compare the activation profiles for the single subject (Figure 1) and for the
group (Figure 3) the apparent differences may not be the most important (or indeed

significant). This section addresses the differences between the single subject's
activations and the group's activation in a more formal way. Here the design matrix
has two studies. The first study has four subjects and the second study is of the single
subject. In both studies there are 12 conditions, giving effectively 24 conditions (12 in
the group and 12 for the single subject). Again global activity was treated as a
confounding covariate. The differences between the activations constitute an
interaction:
Study x condition interaction
The difference of interest represents a condition x study interaction and is tested
using the contrast shown in Figure 9 (again note the mirror symmetry). This contrast
will highlight regions that activate more in the group than the single subject (or de-
activate less). Because there are effectively 24 conditions effects (two studies with 12
conditions) the contrasts is a vector with 24 elements. The SPMZ in Figure 9 shows
that the most significant differences are in bilateral auditory and periauditory regions.
These are areas that de-activate generally and more profoundly in the single subject
studied. The condition effect tested here is that due to the difference between the two
tasks, however we could have tested other condition specific effects (e.g. time). This
analysis directly addresses how the physiological response of a single subject differs
from some normative data. In other words the activation effects peculiar to this
individual's functional anatomy can be directly assessed using an interaction term. The
importance of this approach lies in careful characterization of single cases when applied
using a lesion deficit model or in assessing inter-individual variability in functional
anatomy.

Discussion
We have described a simple framework within the context of the general linear model
that allows for a diverse interrogation of functional imaging data using statistical
parametric maps. The same implementation and layout can accommodate approaches
that are as simple as an unpaired t test, to ANCOVA with multiple covariates. This
approach partitions the design matrix at two levels (i) according to whether the effect is
interesting or not and (ii) whether the effect is factor level (an indicator-type variable) or
continuous (a covariate). The first distinction is fundamental and directly affects
adjustment for confounding effects and the estimation of omnibus significance at each
voxel. The second distinction is purely conceptual; mathematically there is no
distinction between indicators and covariates.
Specific effects modelled in the design matrix are assessed using linear compounds
(contrasts) of the parameter estimates (such as condition-specific mean activity or
regression coefficients). The resulting statistic's distribution has the Student's t
distribution under the null hypothesis and is used to make statistical inferences.
Inferences about local excursions (peaks) of the SPMt (after transformation to a
SPMZ) use p-values that are estimated using distributional approximations from the
theory of Gaussian fields. These p-values are based on the region's highest value and
the number of voxels comprising that region.
This paper presents the operational expressions required to perform the analysis and
some examples which cover most applications one might envisage. In particular we
have focussed on comparing activation studies performed in different subjects. Our
discussion uses a general taxonomy of activation studies that distinguishes between
subtractive (categorical), parametric (dimensional) and factorial (interactions) designs.
Subtractive designs are well established and powerful devices in functional mapping
but are predicated on possibly untenable assumptions about the relationship between
brain dynamics and the functional processes that ensue (and where these assumptions

may be tenable they are not demonstrated to be so). The main concerns with
subtraction and additive factors logic can be reduced to the relationship between neural
dynamics and cognitive processes. For example even if, from a functionalist
perspective, a cognitive component can be added without interaction with pre-existing
components the brain's implementation of these processes is almost certainly going to
show profound interactions. This follows simply from the observation that neural
dynamics are nonlinear (e.g. Aertsen and Preissl 1991). Indeed nearly all theoretical
and computational neurobiology is based on this observation. Parametric approaches
avoid many of the philosophical and physiological shortcomings of 'cognitive
subtraction'; in testing for systematic relationships between neurophysiology and
sensorimotor, psychophysical, pharmacologic or cognitive parameters. These
systematic relationships are not constrained to be linear or additive and may show very
nonlinear behaviour. The fundamental difference between subtractive and parametric
approaches lies in treating a cognitive process, not as a categorical invariant, but as a
dimension or attribute that can be expressed to a greater or lesser extent. It is
anticipated that parametric designs of this type will find an increasing role in
psychological and psychophysical activation experiments. Finally factorial
experiments provide a rich way of assessing the effect of one manipulation on the
effects of another. They could also be used to establish the validity of subtraction by
assessing the degree of 'interaction' between cognitive processes at a physiological
level. The assessment of differences in activations between two or more groups
represents a question about regionally specific interactions. The limiting case of this
example is where one group contains only one subject and we suggest that this is one
way to proceed with single subject analyzes. We mean this in the sense that the
interesting things about an individual's activation profile are how it relates to some
normal profile or a profile obtained from the same subject in different situations or at a
different time. These differences in activations are interactions.
Assumptions and limitations

The validity and scientific utility of statistical parametric mapping has been established
by its diverse and expert application in many imaging centers over the past years.
Given that the advantages are generally accepted we present here a critical evaluation of
some of the assumptions and limitations of the approach:
(i) Parametric assumptions
Underlying the general linear model is an assumption that the error terms are normally
distributed. Recent interest in non parametric approaches (e.g. Holmes et al -
submitted) might be interpreted as a challenge to this assumption (this interpretation is
not correct). There are a number of reasons for being confident that the data obtained
with imaging devices (particularly PET) conform to Gaussian distributions. The image
reconstruction process in PET (back projection) can be thought of in terms of
convolving the underlying distribution of radiodecay events with itself many many
times. The underlying distribution is approximately Poisson and by central limit theory
the univariate distribution of intensity values in the back projected image will be, almost
certainly, Gaussian. This argument does not however allow for non Gaussian
behaviour of the physiological component in functional images (although there is no
reason to suppose they are not Gaussian); however one can make a reasonable
argument that the univariate behaviour of the final measurements will be Gaussian.
This is because of explicit and implicit convolutions of the original distributions in the
early parts of data processing [e.g. ramp and Hanning filtering in frequency space (i.e.
convolving in Cartesian space) during reconstruction and Gaussian smoothing of
images as a pre-processing step]. Even if the original physiological measurements
were not Gaussian, after these convolutions they will be (nearly).
(ii) Homoscedasticity
Homoscedasticity is term referring to invariant second order behaviour (variance) of
the error term over different conditions. Although generally accepted in most
applications of the general linear model this constancy is not necessarily always the

case. If the error variance associated with one condition was very different from that
associated with another then the statistical inferences based on a t value in the SPMt
cannot be guarantied. This is because the distributional approximations may no longer
be valid. Given that very few observations (usually up to twelve for PET activation
studies) are available it would be very difficult to demonstrate a significant difference in
error variance (or indeed demonstrate that they were not significantly different). It is
interesting to note that the criticism levelled at approaches that use an estimate of error
variance pooled over voxels (namely, one cannot assume that error variance is region-
independent) can be turned around and applied to statistical parametric mapping
(namely one cannot assume that error variance is condition-independent). Variance
estimators which accommodate condition-specific changes in error variance are the
subject of some current work (Worsley - personal communication).
(iii) Stationarity
In statistical parametric mapping weak stationarity is assured under the null
hypothesis since the mean at any voxel is zero and the variance is unity, because the
error variance is estimated separately at each voxel. However there is another aspect of
stationarity that is assumed; namely a stationary multivariate behaviour, or more simply
the correlations between different parts of the SPM are unchanging (for Gaussian
fields homogeneous correlation structure, in addition to weak stationarity implies strict
stationarity). This assumption is implicit in modelling the SPM as a stationary
stochastic process (usually a Gaussian random field). It is possible that (i) the
smoothness changes from region to region and (ii) long range correlations in error
variance may show a regional specificity. The first nonstationary behaviour can only
be demonstrated with 'local' estimates of smoothness (W above). The distributional
approximations for the estimators of W are currently being investigated in order to
address this issue at an empirical level (Poline - personal communication). It is
expected that this form of nonstationarity will not be significant in the sense that one
can usually assume the same point spread function for all parts of the original data. The
second sort of regionally specific deviation from stationarity is due to functional
interactions between remote brain areas that are mediated physiologically (i.e. by
functional connectivity). This sort of nonstationarity can be discounted at one level by
noting that under the null hypothesis there are no systematic physiological interactions.
A deeper analysis however reveals the fundamental distinction between the mass
univariate approach taken by statistical parametric mapping and equivalent multivariate
approaches. In multivariate approaches one would explicitly use the measured
covariance structure of the error terms in making some statistical inference about the
effects of a treatment on the multivariate measure (i.e. the profile of activity over the
entire brain). Because these inferences depend on inverting the error variance-
covariance matrix they are not applicable to voxel-based analyses of neuroimaging data
(this is because the matrices are singular due to the great number of voxels relative to
the number of scans). The solution is therefore to proceed on a univariate basis
(treating each voxel as if it were measured in isolation) and then model the covariances
among voxels using a Gaussian field model. Note also that the multivariate approach is
rather weak in that it cannot be used to make regionally specific inferences.
(iv) Low degrees of freedom
SPMs will fail at low degrees of freedom. The reasons for this failure can be quite
entertaining (see Worsley et al 1993b). This limitation is however simply the familiar
caution 'statistics are only meaningful when one has enough data' restated in the
context of spatially extended statistical processes. It is difficult to prescribe a lower
limit for the degrees of freedom that one should use: Ideally one would like to see at
least 30. However the practical limitations of PET make this number of scans
prohibitive in the analysis of single subjects and one could be obliged to work with ten
degrees of freedom or less. Because low degrees of freedom compromise conventional
single subject analyses we consider the suggestions above concerning single subjects
(and their analysis using group data) to be particularly important. It should be
remembered that the lower the degrees of freedom the less a transformed SPMt

conforms to a Gaussian field model. In this case of very low degrees of freedom (e.g.
10 - 20) non parametric approaches may be more appropriate (e.g. Holmes et al 1994)
or reference to distributional approximations for the SPMt (as opposed to the
SPMZ) should be considered (Worsley 1994)
In conclusion we have presented a unified framework using the general linear model
and the theory of Gaussian fields that facilities the analysis of neuroimaging data using
a variety of experimental layouts. These can range from categorical and factorial
activation studies to parametric designs with many covariates. This generalization
should increase the latitude of possible experiments available to the imaging
neuroscientist.
Acknowledgments
Part of this work was undertaken while KJF was funded by the Wellcome Trust. We
would like to thank colleagues in the Neuroscience Section at the MRC for help and
support in developing these ideas.

References
Adler RJ (1981) The geometry of random fields. Wiley, New York.
Aertsen A & Preissl H (1991) Dynamics of activity and connectivity in physiological
neuronal Networks in Non Linear Dynamics and Neuronal Networks Ed Schuster HG
VCH publishers Inc., New York NY USA p 281-302
Bench CJ Friston KJ Brown RG Scott LC Frackowiak RSJ and Dolan RD. The
anatomy of Melancholia - focal abnormalities of cerebral blood flow in major
depression Psychol Med (1992) 3:607-615
Chatfield C and Collins AJ (1980) Introduction to multivariate analysis. Chapman and
Hall, London. p189-210
Fox PT Mintun MA Reiman EM and Raichle ME (1988) Enhanced detection of focal
brain responses using intersubject averaging and distribution analysis of subtracted
PET images J Cereb. Blood Flow 8:642-653
Fox PT, Mintun MA (1989) Non-invasive functional brain mapping by change
distribution analysis of averaged PET images of H15O2 tissue activity J.Nucl. Med.
30:141-149
Friston KJ Frith CD Liddle PF Dolan RJ Lammertsma AA & Frackowiak RSJ (1990)
The relationship between global and local changes in PET scans J. Cereb. Blood Flow
Metab. 10:458-466
Friston, K.J Frith, C.D Liddle, P.F and Frackowiak, R.S.J. (1991) Comparing
functional (PET) images: The assessment of significant change. J. Cereb. Blood Flow
Metab. 11:690-699.
Friston KJ Liddle PF Frith CD Hirsch SR and Frackowiak RSJ. (1992a) The left
medial temporal region and schizophrenia: A PET Study. Brain 115:367-382
Friston, K.J Frith, C Passingham, R.E Liddle, P and Frackowiak, RSJ (1992b) Motor
Practice and neurophysiological adaptation in the cerebellum: a positron tomography
study. Proc. Royal Soc. Lond. Series B. 248:223-228.

Friston, K.J Grasby, P Bench,C Frith, C Cowen, P Little, P., Frackowiak, R.S.J and
Dolan, R (1992c) Measuring the neuromodulatory effects of drugs in man with
positron tomography. Neuroscience Letters 141:106-110.
Friston KJ Frith CD Liddle PF & Frackowiak RSJ (1993) Functional connectivity: The
principal component analysis of large (PET) data sets. J. Cereb. Blood Flow Metab.
13:5-14
Friston KJ, Worsley KJ, Frackowiak RSJ, Mazziotta JC & Evans, AC (1994)
Assessing the significance of focal activations using their spatial extent. Human Brain
Mapping 1:214-220.
Friston KJ, Ashburner J, Poline JB, Frith CD, Heather JD and Frackowiak RSJ
Spatial realignment and normalization of images, submitted.
Frith CD Friston KJ, Liddle PF, and Frackowiak RSJ. (1991) Willed action and the
prefrontal cortex in man. Proc. R. Soc. Lond. B 244:241-246.
Grafton S Mazziotta J Presty S Friston KJ Frackowiak RSJ and Phelps M (1992)
Functional anatomy of human procedural learning determined with regional cerebral
blood flow and PET. J. Neuroscience 12:2542-2548.
Grasby P Friston KJ Bench C Cowen P Frith C Liddle P Frackowiak, R.S.J and
Dolan R (1992) Effect of the 5-HT1A partial agonist buspirone on regional cerebral
blood flow in man. Psychopharmacology 108:380-386
Hasofer AM (1978) Upcrossings of random fields. Suppl. Adv Appl. Prob. 10:14-21
Holmes AP, Blair RC, Watson JDG and Ford I. Non-parametric analysis of statistical
images from functional mapping experiments J. Cereb. Blood Flow Metab. - submitted
Lueck CJ, Zeki S, Friston KJ, Deiber NO, Cope P, Cunningham VJ, Lammertsma
AA, Kennard C, and Frackowiak RSJ. The colour centre in the cerebral cortex of man.
Nature (1989) 340:386-389.
Martin, AJ, Friston, KJ, Colebatch, JG, and Frackowiak RSJ. Decreases in regional
cerebral blood flow in normal aging. J.Cereb. Blood Flow Metab. (1991) 694-689.
Nosko VP (1969) Local structure of Gaussian random fields in the vicinity of high
level shines. Soviet Mathematics Doklady, 10:1481-1484

Nosko VP (1970) On shines of Gaussian random fields (in Russian) Vestnik Moscov.
Univ. Ser. I Mat. Meh., 1970:18-22
Price C Wise RJS Ramsay S Friston KJ Howard D Patterson K and Frackowiak RSJ
(1992) Regional response differences within the human auditory cortex when listening
to words. Neurosci. Letters 146:179-182
Scheffe H (1959) The analysis of variance, Wiley, New York.
Spinks TJ Jones T Bailey DL Townsend DW Grootnook S Bloomfield PM Gilardi MC
Casey ME Sipe B and Reed J (1992) Physical performance of a positron tomograph for
brain imaging with retractable septa. Phys. Med. Biol. 37:1637-1655
Talairach J, Tournoux P (1988) A Co-planar stereotaxic atlas of a human brain.
Thieme, Stuttgart
Townsend DW Geissbuhler A Defrise M Hoffman EJ Spinks TJ Bailey D Gilardi MC
and Jones T (1992) Fully three-dimensional reconstruction for a PET camera with
retractable septa IEEE Trans Med. Imaging M1-10:505-512
Winer BJ (1971) Statistical Principles in experimental design, 2nd Edition, McGraw-
Hill, New York
Worsley KJ Evans AC Strother SC and Tyler JL (1991) A linear spatial correlation
model with applications to positron emission tomography J. Am. Statistical Assoc.
86:55-67
Worsley KJ Evans AC Marrett S & Neelin P (1992) A three-dimensional statistical
analysis for rCBF activation studies in human brain. J. Cereb. Blood. Flow Metab.
12:900-918
Worsley KJ Evans AC Marrett S and Neelin P (1993a) Detecting and estimating the
regions of activation in CBF activation studies in human brain. In Qualification of
brain function: Tracer kinetics and image analysis in brain PET. eds. K Uemura, N
Lassen, T Jones and I Kanno Excerpta Medica, London p535-548
Worsley KJ, Evans EC, Marrett S and Neelin P (1993b) Authors reply (letter) J Cereb.
Blood Flow Metab. 13:1041-1042

Worsley KJ (1994) Local Maxima and the expected Euler characteristic of excursion
sets of χ2, F and t fields. Advances Appl. Prob. 26;13-42
Legends for figures
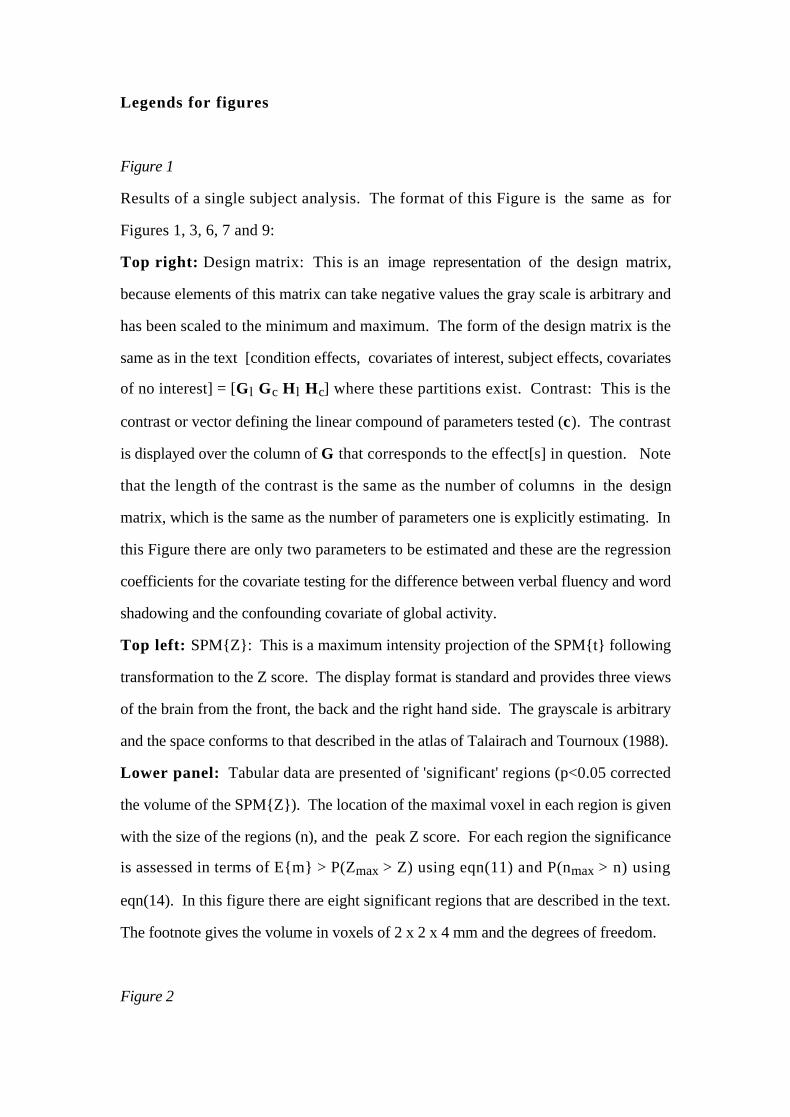
Figure 1
Results of a single subject analysis. The format of this Figure is the same as for
Figures 1, 3, 6, 7 and 9:
Top right: Design matrix: This is an image representation of the design matrix,
because elements of this matrix can take negative values the gray scale is arbitrary and
has been scaled to the minimum and maximum. The form of the design matrix is the
same as in the text [condition effects, covariates of interest, subject effects, covariates
of no interest] = [Gl Gc Hl Hc] where these partitions exist. Contrast: This is the
contrast or vector defining the linear compound of parameters tested (c). The contrast
is displayed over the column of G that corresponds to the effect[s] in question. Note
that the length of the contrast is the same as the number of columns in the design
matrix, which is the same as the number of parameters one is explicitly estimating. In
this Figure there are only two parameters to be estimated and these are the regression
coefficients for the covariate testing for the difference between verbal fluency and word
shadowing and the confounding covariate of global activity.
Top left: SPMZ: This is a maximum intensity projection of the SPMt following
transformation to the Z score. The display format is standard and provides three views
of the brain from the front, the back and the right hand side. The grayscale is arbitrary
and the space conforms to that described in the atlas of Talairach and Tournoux (1988).
Lower panel: Tabular data are presented of 'significant' regions (p<0.05 corrected
the volume of the SPMZ). The location of the maximal voxel in each region is given
with the size of the regions (n), and the peak Z score. For each region the significance
is assessed in terms of Em > P(Zmax > Z) using eqn(11) and P(nmax > n) using
eqn(14). In this figure there are eight significant regions that are described in the text.
The footnote gives the volume in voxels of 2 x 2 x 4 mm and the degrees of freedom.
Figure 2

SPMF: Maximum intensity projection of the SPMF computed according to eqn(9)
for the design matrix in Figure 3. The design matrix was used to assess the 12
condition effects in all five subjects. Experimental variance is prominent in bitemporal,
[anterior and posterior] cingulate, thalamic regions and opercular portions of Broca's
area. The display format is the same as in the previous figure and the gray scale is
arbitrary. All the F ratios are significant at p < 0.05 (uncorrected).
Figure 3
A subtractive analysis based on intersubject averaging.
The format is the same as for Figure 1. The design matrix now includes condition and
subject (block) partitions and the contrast can be seen to test for differences in condition
means in the verbal fluency and word shadowing conditions. The corresponding
profile of activations in seen in the SPMZ. Significant activations are tabulated
below and are described in the main text.
Figure 4
The same data presented in Figure 3 but here the SPMZ has been sectioned in three
orthogonal planes and displayed on top of an arbitrary MRI image that has been
spatially normalized to the same anatomical space. This figure details the functional
anatomy of the left prefrontal and mediodorsal thalamic activations and their
relationship to underlying anatomy.
Figure 5
The same data as in Figure 3, but here the SPMZ has been rendered onto the same
MRI image as in the previous figure (Figure 4). This figure details further the
topography of the left prefrontal activation which can be seen to involve the opercular
portion of Broca's area, inferior frontal gyrus and extend almost to the frontal pole.
This is the largest contiguous region of activations elicited by this comparison (see
Table in Figure 3).

Figure 6
A parametric analysis
The format of this figure is the same as for Figure 1 and shows the results of testing for
a linear monotonic time effect using a contrast of the condition effect estimates
Figure 7
A factorial analysis
The format of this figure is the same as for Figure 1 and shows the results of testing for
an interaction between activations due to verbal fluency and time. The contrast used
detects regions whose response to verbal fluency increases with time. No region can
be considered significance because the largest region would have been obtained on
8.5% of occasions by chance (see lower panel). The results of this analysis can only
be reported descriptively and no statistical inference can be made about the regionally
specific effects.
Figure 8
Adjusted regional activity.
Using the results displayed in the previous figure a voxel in the mediodorsal thalamus
was selected and the adjusted activity was plotted for each of the 12 conditions. The
bars represent mean condition-specific estimates and the dots represent individual data
adjusted for confounding effects Note the time-dependent augmentation of activations
due to verbal fluency.
Figure 9
An interaction analysis comparing a single subject and the remaining subjects.
The design matrix now has 24 condition effects (12 for the group and 12 for the single
subject). The contrast is testing for a failure to activate (or a greater de-activation) in the

single subject with respect to the group. The bitemporal areas de-activate more
profoundly than one would have predicted on the basis of the group data.