
SPICER CONSULTING SYSTEM SC28 SC28 Monitoring System
9
1 SC28 Monitoring System SYSTEM SC28 SPICER CONSULTING SPICER CONSULTING, Eden Laboratory, Broadmead Road, Stewartby, Bedfordshire, England MK43 9ND Tel: +44 1234 765773 Fax: +44 1234 765778 E-mail: [email protected] Web: www.spicerconsulting.com • Long term monitoring of the room environment for electron beam instruments, including Scanning Electron Microscopes (SEM), Transmission Electron Microscopes (TEM) , Electron Beam Lithography tools and SEM-based metrology and inspecon tools • Connuously measures Magnec fields in 3 axes, Floor vibraon in 3 axes and Acousc levels all at 2kHz, and Temperature/humidity at 1Hz • Inputs for 1 x 3-axis magnec field sensor, 3 x Wilcoxon 731A accelerometers, Brüel & Kjær precision microphone, Temperature/Humidity sensor, and one BNC AUX • Up to 14 different graphs may be displayed giving simultaneous display of the data as it is acquired • Acquires sensor data and logs spectra and charts to date-stamped files • Headless - Can run without user interface open • Compares environment to specificaons with PASS/FAIL indicaon. Sends signal to a traffic light or sends email if offline or out-of-spec SC28/SI with sensors 14-Sep-2021 SC28 in use
Transcript of SPICER CONSULTING SYSTEM SC28 SC28 Monitoring System

1
SC28 Monitoring System
SYSTEM SC28 SPICER CONSULTING
SPICER CONSULTING, Eden Laboratory, Broadmead Road, Stewartby, Bedfordshire, England MK43 9ND Tel: +44 1234 765773 Fax: +44 1234 765778 E-mail: [email protected] Web: www.spicerconsulting.com
• Long term monitoring of the room environment for electron beam instruments, including Scanning Electron Microscopes (SEM), Transmission Electron Microscopes (TEM) , Electron Beam Lithography tools and SEM-based metrology and inspection tools
• Continuously measures Magnetic fields in 3 axes, Floor vibration in 3 axes and Acoustic levels all at 2kHz, and Temperature/humidity at 1Hz
• Inputs for 1 x 3-axis magnetic field sensor, 3 x Wilcoxon 731A accelerometers, Brüel & Kjær precision microphone, Temperature/Humidity sensor, and one BNC AUX
• Up to 14 different graphs may be displayed giving simultaneous display of the data as it is acquired
• Acquires sensor data and logs spectra and charts to date-stamped files
• Headless - Can run without user interface open
• Compares environment to specifications with PASS/FAIL indication. Sends signal to a traffic light or sends email if offline or out-of-spec
SC28/SI with sensors
14-Sep-2021
SC28 in use

2
SC28 Hardware The SC28/SI supports 1 x 3-axis magnetic field sensor, 3 x Wilcoxon 731A accelerometers, Brüel & Kjær precision microphone and 1 x Temperature/Humidity sensor. It samples the magnetic fields, vibrations and acoustic levels at 2 kHz and temperature/humidity at 1Hz. The SC28 monitoring system is provided without a PC. The requirement for the personal computer is Windows 7/8.1/10, screen pixels at least 1280 x 960, and Ethernet Interface at least 100Mbps. The processor, RAM and hard Disc must be as recommended for the operating system.
Overview The SC28 monitoring system is purposed-designed to monitor the environment for electron beam instruments, including Scanning Electron Microscopes (SEM), Transmission Electron Microscopes (TEM), Electron Beam Lithography tools and SEM-based metrology and inspection tools. It can log the spectrum and charts of ambient magnetic fields, vibrations, acoustic levels, temperature and relative humidity. It measures the magnetic fields, vibrations and acoustic levels at a sample frequency of 2 kHz and temperature/humidity at 1Hz. Measurements are taken continuously, with no gaps, so that no event is missed.
The SC28 software runs on a Windows PC that is connected to the same Local Area Network as the SC28/SI. It automatically detects the SC28/SI hardware without needing to know its IP address in advance. The SCplot program is included with the SC28 software and allows you to view and print results as well as save graphs for use in reports.
SC28/SI-Sensor Interface (Ethernet-based)
The SC28/SI operates from DC power (9-36V, 12 W max). A universal AC power adaptor is supplied.
There is an input for one Spicer Consulting 3-axis magnetic field sensor. Sensor SC24/DC+AC and Sensor SC11/AC are compatible.
There are inputs for three Wilcoxon 731A accelerometers. The inputs provide the constant current power supply for each Wilcoxon 731A and are suitable for most other types of piezo accelerometers.
There is an input for a Brüel & Kjær 4190/2669L precision microphone. The SC28/SI-Sensor Interface provides the special power supplies for the 2669L microphone pre-amplifier to enable the microphone to operate to its full specification.
There is an input for a SC28/TH Temperature/Humidity sensor. The sample rate is 1Hz max.
In addition, one AUX input is available for a user-defined channel as required.
Sensor SC24/DC+AC
This is the 3-axis magnetic field sensor supplied with the SC28 monitoring system. It can measure DC and AC fields, e.g. changing DC fields from trams and elevators and AC power line fields. It has internal bias coils that are used to null the Earth’s field. The bias coil currents are reset by clicking an icon on the program screen when the sensor is moved. The measurement range is ± 20 mG. The sensor has low noise and is accurate to within 1% when completely warmed up.
Sensor SC11/AC
This is a 3-axis AC magnetic field sensor with a lower bandwidth of 1 Hz and a dynamic range of 80 mG (8 mT) Pk-Pk.
Brüel & Kjær 4190 microphone Wilcoxon 731A accelerometers (three)
SC28/SI Sensor SC24/DC+AC
Sensor SC28/TH
Sensor SC11/AC
3
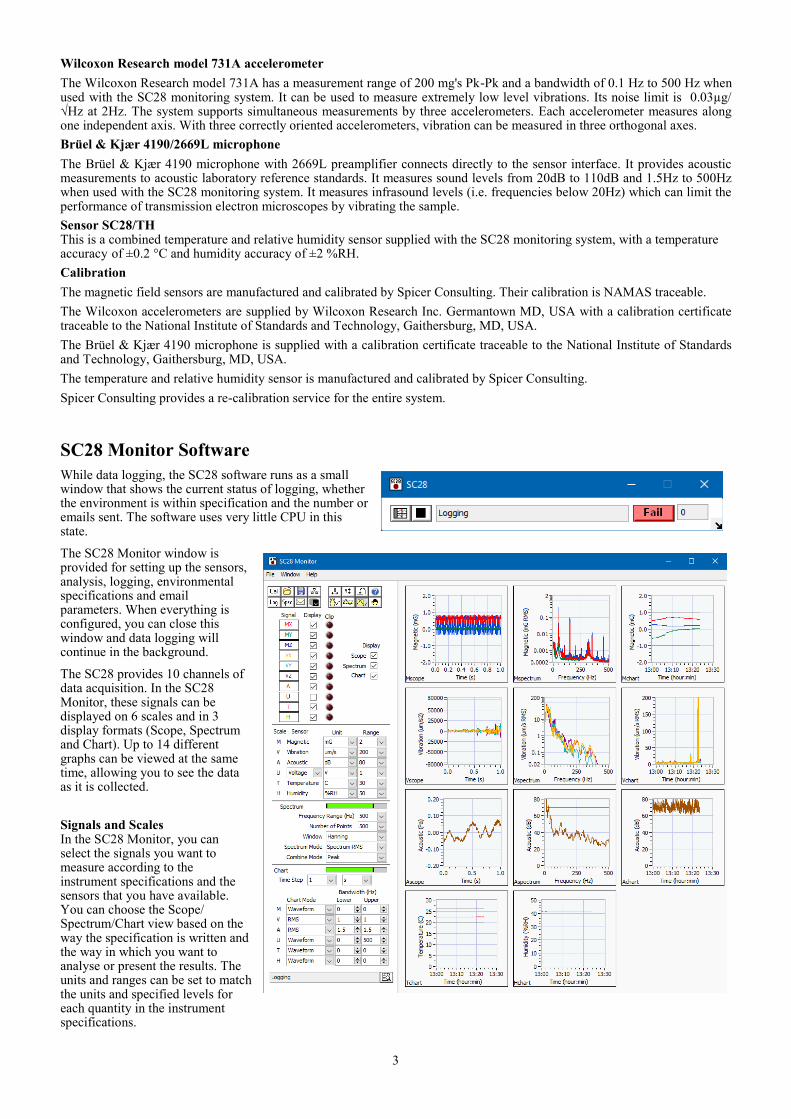
Wilcoxon Research model 731A accelerometer
The Wilcoxon Research model 731A has a measurement range of 200 mg's Pk-Pk and a bandwidth of 0.1 Hz to 500 Hz when used with the SC28 monitoring system. It can be used to measure extremely low level vibrations. Its noise limit is 0.03µg/√Hz at 2Hz. The system supports simultaneous measurements by three accelerometers. Each accelerometer measures along one independent axis. With three correctly oriented accelerometers, vibration can be measured in three orthogonal axes.
Brüel & Kjær 4190/2669L microphone
The Brüel & Kjær 4190 microphone with 2669L preamplifier connects directly to the sensor interface. It provides acoustic measurements to acoustic laboratory reference standards. It measures sound levels from 20dB to 110dB and 1.5Hz to 500Hz when used with the SC28 monitoring system. It measures infrasound levels (i.e. frequencies below 20Hz) which can limit the performance of transmission electron microscopes by vibrating the sample.
Sensor SC28/TH This is a combined temperature and relative humidity sensor supplied with the SC28 monitoring system, with a temperature accuracy of ±0.2 °C and humidity accuracy of ±2 %RH.
Calibration
The magnetic field sensors are manufactured and calibrated by Spicer Consulting. Their calibration is NAMAS traceable.
The Wilcoxon accelerometers are supplied by Wilcoxon Research Inc. Germantown MD, USA with a calibration certificate traceable to the National Institute of Standards and Technology, Gaithersburg, MD, USA.
The Brüel & Kjær 4190 microphone is supplied with a calibration certificate traceable to the National Institute of Standards and Technology, Gaithersburg, MD, USA.
The temperature and relative humidity sensor is manufactured and calibrated by Spicer Consulting.
Spicer Consulting provides a re-calibration service for the entire system.
SC28 Monitor Software
While data logging, the SC28 software runs as a small window that shows the current status of logging, whether the environment is within specification and the number or emails sent. The software uses very little CPU in this state.
The SC28 Monitor window is provided for setting up the sensors, analysis, logging, environmental specifications and email parameters. When everything is configured, you can close this window and data logging will continue in the background.
The SC28 provides 10 channels of data acquisition. In the SC28 Monitor, these signals can be displayed on 6 scales and in 3 display formats (Scope, Spectrum and Chart). Up to 14 different graphs can be viewed at the same time, allowing you to see the data as it is collected.
Signals and Scales In the SC28 Monitor, you can select the signals you want to measure according to the instrument specifications and the sensors that you have available. You can choose the Scope/Spectrum/Chart view based on the way the specification is written and the way in which you want to analyse or present the results. The units and ranges can be set to match the units and specified levels for each quantity in the instrument specifications.
4
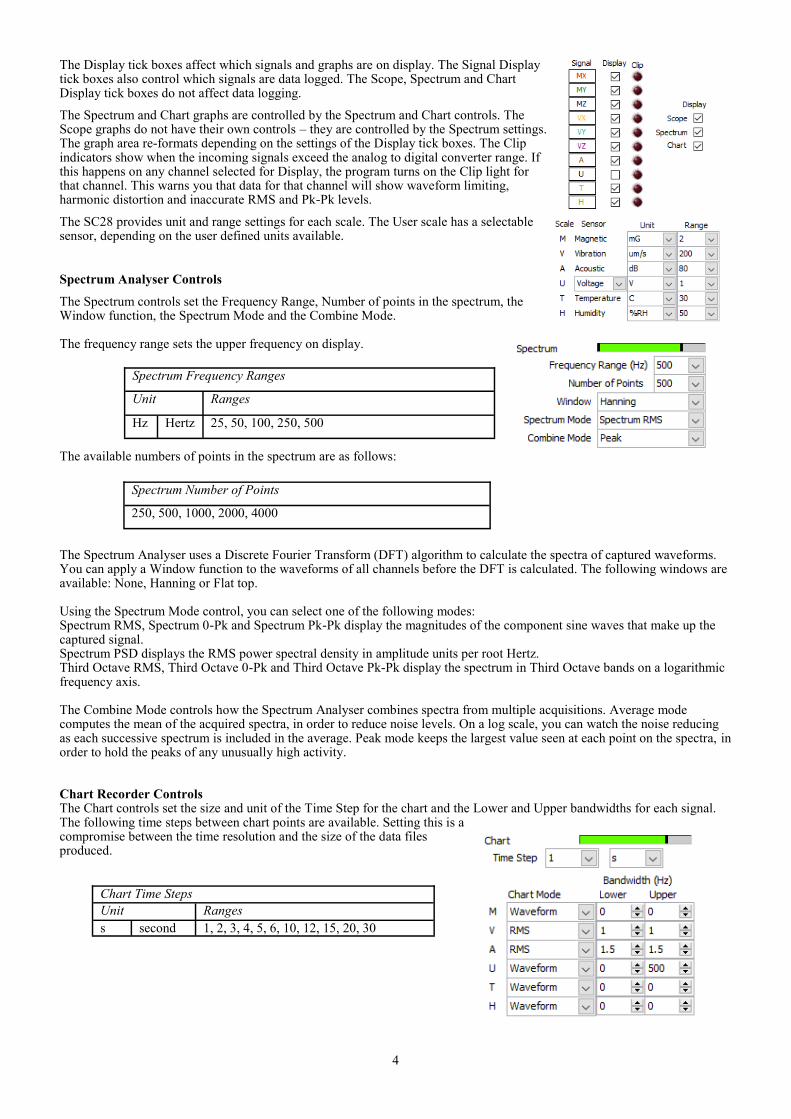
The Display tick boxes affect which signals and graphs are on display. The Signal Display tick boxes also control which signals are data logged. The Scope, Spectrum and Chart Display tick boxes do not affect data logging.
The Spectrum and Chart graphs are controlled by the Spectrum and Chart controls. The Scope graphs do not have their own controls – they are controlled by the Spectrum settings. The graph area re-formats depending on the settings of the Display tick boxes. The Clip indicators show when the incoming signals exceed the analog to digital converter range. If this happens on any channel selected for Display, the program turns on the Clip light for that channel. This warns you that data for that channel will show waveform limiting, harmonic distortion and inaccurate RMS and Pk-Pk levels.
The SC28 provides unit and range settings for each scale. The User scale has a selectable sensor, depending on the user defined units available.
Spectrum Analyser Controls
The Spectrum controls set the Frequency Range, Number of points in the spectrum, the Window function, the Spectrum Mode and the Combine Mode. The frequency range sets the upper frequency on display. The available numbers of points in the spectrum are as follows: The Spectrum Analyser uses a Discrete Fourier Transform (DFT) algorithm to calculate the spectra of captured waveforms. You can apply a Window function to the waveforms of all channels before the DFT is calculated. The following windows are available: None, Hanning or Flat top. Using the Spectrum Mode control, you can select one of the following modes: Spectrum RMS, Spectrum 0-Pk and Spectrum Pk-Pk display the magnitudes of the component sine waves that make up the captured signal. Spectrum PSD displays the RMS power spectral density in amplitude units per root Hertz. Third Octave RMS, Third Octave 0-Pk and Third Octave Pk-Pk display the spectrum in Third Octave bands on a logarithmic frequency axis. The Combine Mode controls how the Spectrum Analyser combines spectra from multiple acquisitions. Average mode computes the mean of the acquired spectra, in order to reduce noise levels. On a log scale, you can watch the noise reducing as each successive spectrum is included in the average. Peak mode keeps the largest value seen at each point on the spectra, in order to hold the peaks of any unusually high activity. Chart Recorder Controls The Chart controls set the size and unit of the Time Step for the chart and the Lower and Upper bandwidths for each signal. The following time steps between chart points are available. Setting this is a compromise between the time resolution and the size of the data files produced.
Spectrum Frequency Ranges
Unit Ranges
Hz Hertz 25, 50, 100, 250, 500
Spectrum Number of Points
250, 500, 1000, 2000, 4000
Chart Time Steps
Unit Ranges
s second 1, 2, 3, 4, 5, 6, 10, 12, 15, 20, 30
5
You can select from 3 different Chart Modes for each Scale. The Lower and Upper Bandwidth controls set the 3dB frequency ranges that contribute to the display. The bandwidths available depend on the data acquisition hardware, the number of chan-nels, the Sensor, Unit and Chart Mode. The limits are summarised in the table below:
Chart waveform mode charts the waveform directly. Each trace shows the mean of the maximum and minimum value of the signal that was seen during the time step for each point.
Chart RMS and Pk-Pk modes are useful for charting the variation of AC magnetic fields, vibrations or sound levels over a period of time.
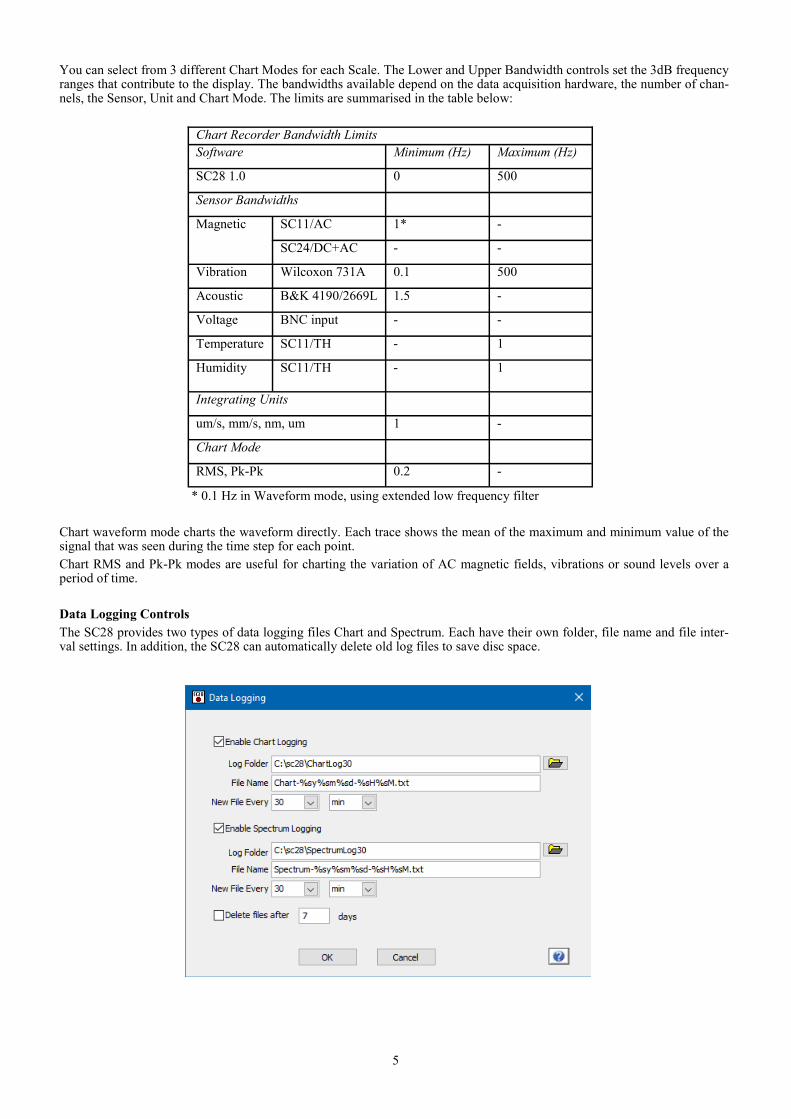
Data Logging Controls
The SC28 provides two types of data logging files Chart and Spectrum. Each have their own folder, file name and file inter-val settings. In addition, the SC28 can automatically delete old log files to save disc space.
Chart Recorder Bandwidth Limits
Software Minimum (Hz) Maximum (Hz)
SC28 1.0 0 500
Sensor Bandwidths
Magnetic SC11/AC 1* -
SC24/DC+AC - -
Vibration Wilcoxon 731A 0.1 500
Acoustic B&K 4190/2669L 1.5 -
Voltage BNC input - -
Temperature SC11/TH - 1
Humidity SC11/TH - 1
Integrating Units
um/s, mm/s, nm, um 1 -
Chart Mode
RMS, Pk-Pk 0.2 -
* 0.1 Hz in Waveform mode, using extended low frequency filter

6
File names can embed date and time information so that they are unique and can show the time period that they cover. The following date/time codes are available:
Start and Finish refer to the start and finish times of the data in the file. All date and time information, including the time zone, is derived from the PC running the SC28 program.
The SC28 starts a new file at the file interval that you set. The following are available:
Each file starts on a whole multiple of its file interval. The available lengths are designed so that whole multiples of the file interval always fit into the next unit above. Therefore, files with lengths set in minutes always fit neatly into each hour and files with lengths set in hours always fit neatly into each day.
When you start the SC28, or after you change the file interval, the SC28 waits until the next whole interval is reached before it starts logging. While in this state, data on the Charts start part way through the interval.
When Chart Logging is enabled, the SC28 includes a point for each signal on display for each Chart Time Step during the file interval.
When Spectrum Logging is enabled, the SC28 combines spectra during the file interval and writes the resulting spectrum to the file for each signal on display.
If Delete Files After is enabled, whenever the SC28 creates a new log file, it checks the folder to see if any files are older than the limit set and deletes them. The Chart and Spectrum folders are handled separately. If logging is not enabled for a folder, files are not deleted from it.
Code Description
%sS Start seconds (00-59)
%sM Start minutes (00-59)
%sH Start hour on 24-hour clock (00-23)
%sd Start day (01-31)
%sm Start month (01-12)
%sy Start year (four digits)
%fS Finish seconds (00-59)
%fM Finish minutes (00-59)
%fH Finish hour on 24-hour clock (00-23)
%fd Finish day (01-31)
%fm Finish month (01-12)
%fy Finish year (four digits)
%zM Time zone minutes (00|30)
%zH Time zone hour (+|-)(00-12)
Unit Ranges
min minute 1, 2, 3, 4, 5, 6, 10, 12, 15, 20, 30
hour hour 1, 2, 3, 4, 5, 6, 8, 12
day Day (24 hours) 1, 2, 3, 4, 5, 6, 7
7
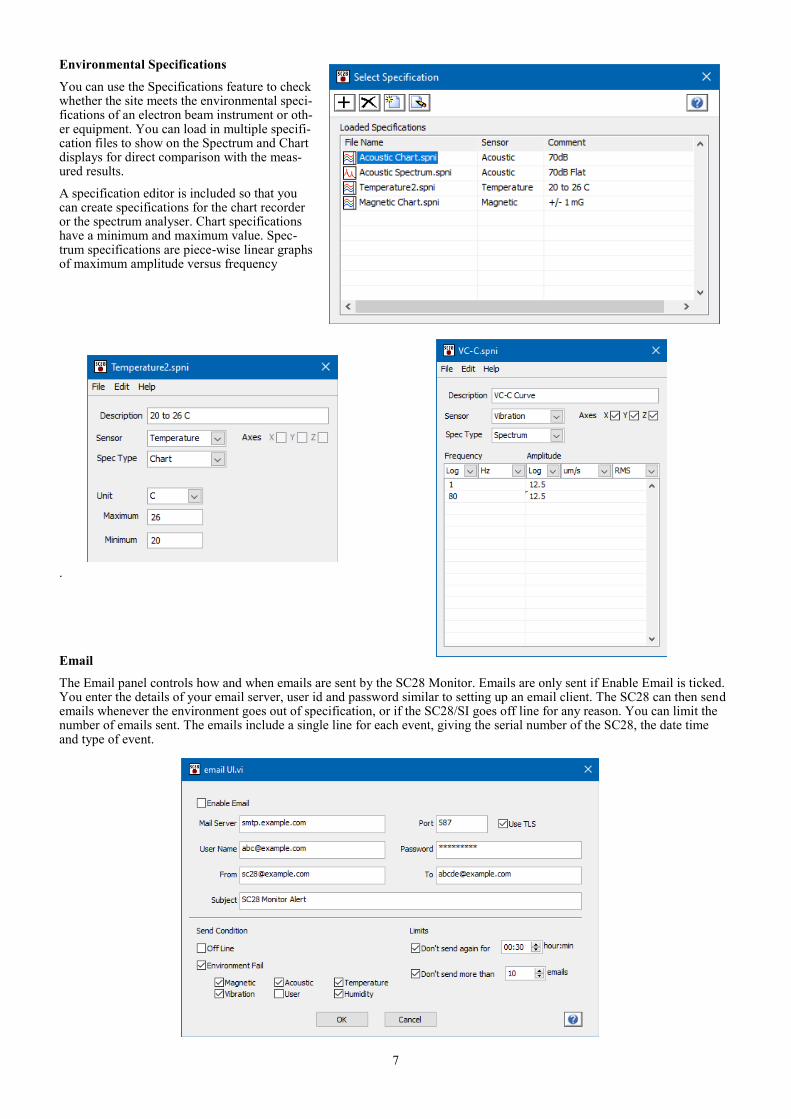
Environmental Specifications
You can use the Specifications feature to check whether the site meets the environmental speci-fications of an electron beam instrument or oth-er equipment. You can load in multiple specifi-cation files to show on the Spectrum and Chart displays for direct comparison with the meas-ured results.
A specification editor is included so that you can create specifications for the chart recorder or the spectrum analyser. Chart specifications have a minimum and maximum value. Spec-trum specifications are piece-wise linear graphs of maximum amplitude versus frequency
.
The Email panel controls how and when emails are sent by the SC28 Monitor. Emails are only sent if Enable Email is ticked. You enter the details of your email server, user id and password similar to setting up an email client. The SC28 can then send emails whenever the environment goes out of specification, or if the SC28/SI goes off line for any reason. You can limit the number of emails sent. The emails include a single line for each event, giving the serial number of the SC28, the date time and type of event.

8
SCplot
SCplot is a comprehensive results editing program that enables results logged from the SC28 Monitor to be formatted for viewing or adding to reports. It can stitch together multiple chart data logging files to make a continuous plot.
SCplot can handle large amounts of data. For example the plot below shows a weeks worth of magnetic field data. The data was extracted from nearly 70 Mbytes of data in 335 files each containing 30 minutes logging at one point per second of 3-axis magnetic field, 3-axis vibration, acoustics, temperature and humidity.
The next plot shows a waterfall plot of the acoustic spectrum for a week.
SCplot supports all the units that are used in the SC28. It can convert units and post-process results with user-specified for-mulas. It can save plots as images, copy them to the paste buffer or append them to a word document. SCplot also provides macro scripting so that command sequences can be captured, saved and re-played.

9
SC28 - Specification
System Box Size 58 x 36 x 19 cm approx. (23 x 14 x 7.5 in
approx.) Weight 11 kg (24 lb) approx.
Personal Computer Requirements Operating System Windows 7/8.1/10 Display At least 1280 x 960 pixels Ethernet Interface At least 100 Mbps Processor As required for operating system. Memory As required for operating system. Hard Disc As required for operating system.
Core System: SC28/SI - Sensor Interface Inputs MAG 3-axis magnetic field sensor VIBX, VIBY, VIBZ 3-axis vibration (3 x Wilcoxon 731A) MIC Microphone (B&K 4190/2669L) AUX BNC voltage input, DC coupled, ±10 V range,
100 kW input impedance. TEMP/RH SC28/TH Temperature/Humidity Sensor DAQ Resolution/Range Bits Input Range Resolution 13 ±10V 2.44 mV Anti-aliasing Filters 20kHz Sampling rate 200 kHz x 8 channels + 1 Hz x 2 channels
continuous Data transfer rate 2 kHz x 8 channels + 1 Hz x 2 channels
continuous Communications USB port for Patlite signal tower Ethernet port for PC/LAN connection Power 9-36V DC, 12 W max
AC Power Adaptor Type Meanwell GST90A24 Input 100-240V AC, 50/60 Hz, 1.3A Output 24V DC, 3.75 A, 90 W max.
3-axis AC Magnetic Field Sensor: SC11/AC Co-ordinate System X, Y, Z rectangular Cartesian Bandwidth 1 - 20 kHz Dynamic Range 80 mG (8 μT) Pk-Pk Noise Limit 3μG RMS max Accuracy ±1 %
3-axis DC Magnetic Field Sensor: SC24/DC+AC Co-ordinate System X, Y, Z rectangular Cartesian Bandwidth DC - 10 kHz Ambient Field Range ±2 G (±200 μT) Dynamic Range ±20 mG (±2 μT) Pk-Pk Noise Limit DC: 5 μG (0.5 nT) Pk-Pk typ. (0.0001 – 0.01 Hz) AC: 0.1 μG/√Hz (10 pT/√Hz) RMS typ. at 50 Hz Accuracy ±1 % (after >2hour warm up). (±15 % cold)
Vibration Sensor: Wilcoxon 731A Accelerometer Type Wilcoxon Research, model 731A Bandwidth 0.1 - 500 Hz Dynamic Range 2 m/s2 (0.2 g’s*) Pk-Pk (in this system) Noise Limit 7 μm/s2 RMS max. 0.35 μm/s RMS at 1Hz, 0.11 μm/s RMS at 5Hz 0.07 μm RMS at 1Hz, 0.0035 μm RMS at 5Hz Accuracy ±5 % (with gain calibration file)
Acoustic Sensor: B&K 4190/2669L Precision Microphone Type Brüel & Kjær, Condenser microphone 4190, Pre-amplifier 2669L Bandwidth 1.5 Hz - 20 kHz Dynamic Range 110 dB (in this system) Noise Limit 20 dB (in this system) Accuracy ±1 dB 3 Hz - 20 kHz
Temperature/Humidity Sensor: SC28/TH Sample rate 1 Hz max Performance Temperature Relative Humidity Dynamic Range 0 - 100 °C 0 - 100 %RH Resolution 0.01 °C 0.01 %RH Accuracy ±0.2 °C ±2 %RH Drift (max) 0.03 °C/Year 0.25 %RH/Year
Signal Tower Type Patlite LR6-3USBW-RYG Power USB Bus powered, 5V, 500mA max Colours Red, Green Dimensions 60mm dia, 199mm height
Software Channels 10: MX, MY, MZ, VX, VY, VZ, A, U, T, H Clipping Visual indication Display modes Scope, Spectrum, Chart (simultaneous) Selection Individual Channels, Display modes Scales 6: Magnetic, Vibration, Acoustic, User-defined, Temperature, Humidity Amplitude units Magnetic field mG, nT, μT, mA/m, A/m Vibration μg’sα, mg'sα, μm/s2, mm/s2, μm/s, mm/s, nm, μm Acoustic mPa, Pa, dB User-defined mV, V, user defined units Temperature °C, °F Humidity %RH Amplitude ranges General 1, 2, 5, 10, 20, 50, 100, 200, 500 dB 50, 60, 70, 80, 90, 100, 110, 120 °C, %RH 30, 40, 50, 60, 70, 80, 90, 100 °F 60, 80, 100, 120, 140, 160, 180, 200 Spectrum Analyser Frequency ranges 25, 50, 100, 250, 500 Hz full scale. Number of points 250, 500, 1000, 2000, 4000 Accuracy Frequency: ±0.01% ±0.02 div Waveform windows None, Hanning, Flat top Spectrum modes RMS, 0-Pk, Pk-Pk, PSD, Third Octave (RMS, 0-Pk, Pk-Pk) Combine spectra Average/Peak Specification files Create, edit, add & remove. Compare with measurements. Chart Recorder Time step 1, 2, 3, 4, 5, 6, 10, 12, 15, 20, 30 s/point Chart modes Waveform, RMS, Peak to Peak, Bandwidth controls Lower and Upper - individual for each scale Data Logging Logging Chart Logging, Spectrum Logging, Folder, Filename, File interval Deletion File age Calibration panel Add/select sensors, reset DC sensor, microphone self check, add/edit user defined units. Setup file Open/save control settings Help Context help on controls, online help file α g’s are units of the acceleration due to gravity


