
SPICAM: Studying the Global Structure and Composition of ...
26
The SPICAM (SPectroscopy for the Investigation of the Characteristics of the Atmosphere of Mars) instrument consists of two spectrometers. The UV spectrometer addresses key issues about ozone and its H 2 O coupling, aerosols, the atmospheric vertical temperature structure and the ionosphere. The IR spectrometer is aimed primarily at H 2 O abundances and vertical profiling of H 2 O and aerosols. SPICAM’s density/temperature profiles will aid the development of meteorological and dynamical atmospheric models from the surface up to 160 km altitude. UV observations of the upper atmosphere will study the ionosphere and its direct interaction with the solar wind. They will also allow a better understanding of escape mechanisms, crucial for insight into the long-term evolution of the atmosphere. 1.1 SPICAM goals SPICAM (Fig. 1), a lightweight (4.7 kg) UV-IR spectrometer on the Mars Express orbiter, is dedicated to recovering most of the atmospheric science that was lost with Mars-96 and its set of SPICAM sensors. The new configuration of SPICAM includes a 2-channel optical sensor (3.8 kg) and an electronics block (0.9 kg). The UV spectrometer (118-320 nm, resolution 0.8 nm) is dedicated to nadir viewing, limb viewing and vertical profiling by stellar and solar occultation. It addresses key issues about ozone and the H 2 O coupling, aerosols, atmospheric vertical temperature structure and the ionosphere. The near-IR spectrometer (1.0-1.7 μm, resolution 0.5- 1.2 nm) is aimed primarily at nadir measurements of H 2 O abundances, and at vertical profiling of H 2 O and aerosols by solar occultation. A simple data processing unit (0.9 kg) provides the interface with the spacecraft. For nadir observations, SPICAM UV is essentially an ozone detector, measuring the strongest O 3 absorption band at 250 nm in the solar light scattered from the ground. In its stellar occultation mode, the UV sensor will measure the vertical profiles of CO 2 , temperature, O 3 , clouds and aerosols. The density/temperature profiles will constrain and aid in developing the meteorological and dynamical atmospheric models from the surface and up to 160 km in the atmosphere. This is 1 SPICAM: Studying the Global Structure and Composition of the Martian Atmosphere J.-L. Bertaux 1 , D. Fonteyn 2 , O. Korablev 3 , E. Chassefière 4 , E. Dimarellis 1 , J.P. Dubois 1 , A. Hauchecorne 1 , F. Lefèvre 1 , M. Cabane 1 , P. Rannou 1 , A.C. Levasseur-Regourd 1 , G. Cernogora 1 , E. Quemerais 1 , C. Hermans 2 , G. Kockarts 2 , C. Lippens 2 , M. De Maziere 2 , D. Moreau 2 , C. Muller 2 , E. Neefs 2 , P.C. Simon 2 , F. Forget 4 , F. Hourdin 4 , O. Talagrand 4 , V.I. Moroz 3 , A. Rodin 3 , B. Sandel 5 & A. Stern 6 1 Service d’Aéronomie du CNRS, F-91371, Verrières-le-Buisson, France Email: [email protected] 2 Belgian Institute for Space Aeronomy, 3 av. Circulaire, B-1180 Brussels, Belgium 3 Space Research Institute (IKI), 84/32 Profsoyuznaya, 117810 Moscow, Russia 4 Laboratoire de Météorologie Dynamique, 4 place Jussieu, F-75252 Paris Cedex 05, Paris, France 5 Lunar and Planetary Laboratory, 901 Gould Simpson Building, Univ. of Arizona, Tucson, AZ 85721, USA 6 SouthWest Research Institute, Geophysics, Astrophysics and Planetary Science, 1050 Walnut Ave., Suite 400, Boulder, CO 80302-5143, USA 1. Introduction
Transcript of SPICAM: Studying the Global Structure and Composition of ...

The SPICAM (SPectroscopy for the Investigation of the Characteristics of theAtmosphere of Mars) instrument consists of two spectrometers. The UVspectrometer addresses key issues about ozone and its H2O coupling, aerosols,the atmospheric vertical temperature structure and the ionosphere. The IRspectrometer is aimed primarily at H2O abundances and vertical profiling ofH2O and aerosols. SPICAM’s density/temperature profiles will aid thedevelopment of meteorological and dynamical atmospheric models from thesurface up to 160 km altitude. UV observations of the upper atmosphere willstudy the ionosphere and its direct interaction with the solar wind. They will alsoallow a better understanding of escape mechanisms, crucial for insight into thelong-term evolution of the atmosphere.
1.1 SPICAM goalsSPICAM (Fig. 1), a lightweight (4.7 kg) UV-IR spectrometer on the Mars Expressorbiter, is dedicated to recovering most of the atmospheric science that was lost withMars-96 and its set of SPICAM sensors. The new configuration of SPICAM includesa 2-channel optical sensor (3.8 kg) and an electronics block (0.9 kg). The UVspectrometer (118-320 nm, resolution 0.8 nm) is dedicated to nadir viewing, limbviewing and vertical profiling by stellar and solar occultation. It addresses key issuesabout ozone and the H2O coupling, aerosols, atmospheric vertical temperaturestructure and the ionosphere. The near-IR spectrometer (1.0-1.7 µm, resolution 0.5-1.2 nm) is aimed primarily at nadir measurements of H2O abundances, and at verticalprofiling of H2O and aerosols by solar occultation. A simple data processing unit(0.9 kg) provides the interface with the spacecraft.
For nadir observations, SPICAM UV is essentially an ozone detector, measuringthe strongest O3 absorption band at 250 nm in the solar light scattered from theground. In its stellar occultation mode, the UV sensor will measure the verticalprofiles of CO2, temperature, O3, clouds and aerosols. The density/temperatureprofiles will constrain and aid in developing the meteorological and dynamicalatmospheric models from the surface and up to 160 km in the atmosphere. This is
1
SPICAM: Studying the Global Structure and Composition of the Martian Atmosphere
J.-L. Bertaux1, D. Fonteyn2, O. Korablev3, E. Chassefière4, E. Dimarellis1, J.P. Dubois1, A. Hauchecorne1,F. Lefèvre1, M. Cabane1, P. Rannou1, A.C. Levasseur-Regourd1, G. Cernogora1, E. Quemerais1, C. Hermans2,G. Kockarts2, C. Lippens2, M. De Maziere2, D. Moreau2, C. Muller2, E. Neefs2, P.C. Simon2, F. Forget4, F. Hourdin4, O. Talagrand4, V.I. Moroz3, A. Rodin3, B. Sandel5 & A. Stern6
1Service d’Aéronomie du CNRS, F-91371, Verrières-le-Buisson, FranceEmail: [email protected]
2Belgian Institute for Space Aeronomy, 3 av. Circulaire, B-1180 Brussels, Belgium3Space Research Institute (IKI), 84/32 Profsoyuznaya, 117810 Moscow, Russia4Laboratoire de Météorologie Dynamique, 4 place Jussieu, F-75252 Paris Cedex 05, Paris, France5Lunar and Planetary Laboratory, 901 Gould Simpson Building, Univ. of Arizona, Tucson, AZ 85721, USA6SouthWest Research Institute, Geophysics, Astrophysics and Planetary Science, 1050 Walnut Ave.,
Suite 400, Boulder, CO 80302-5143, USA
1. Introduction

SP-1240
essential for future missions that rely on aerocapture and aerobraking. UV observa-tions of the upper atmosphere will allow studies of the ionosphere through theemissions of CO, CO+ and CO2
+, and its direct interaction with the solar wind. Also,it will allow a better understanding of escape mechanisms and estimates of theirmagnitude, crucial for insight into the long-term evolution of the atmosphere.
SPICAM’s near-IR sensor, employing the pioneering technology of an acousto-optical tunable filter (AOTF), is dedicated to the measurement of water vapourcolumn abundance in the IR simultaneously with ozone measured in the UV. It willbe achieved with a much lower telemetry budget than the mission’s Planetary FourierSpectrometer. In solar occultation mode, this channel will study the vertical structuresof H2O, CO2 and aerosols.
1.2 BackgroundObservations during the 18th century showed that light from the star Spica decreasedabruptly during occultations by the Moon. It was concluded that the Moon has noatmosphere because, otherwise, refraction would have produced a progressivedimming of the star. The SPICAM acronym is a tribute to this early use of stellaroccultation.
In the Earth’s atmosphere, the occultation technique has been used to measure O3since the 1970s. Only one or two wavelengths were observed at a time in the earlyattempts, making identification of the absorber species uncertain. With the advent ofmulti-pixel detectors, the absorbing species can be safely identified by their spectralsignatures. It also offers the potential to discover new, unexpected species in theatmosphere. The method of absorptive occultation spectroscopy is reviewed inRoscoe et al. (1994) and Smith & Hunten (1990). For terrestrial stratosphericresearch, it has become the most advanced method for long-term monitoring of ozone.In the IR, the most remarkable results are those of the ATMOS/Atlas Space Shuttleexperiment, which provided a set of high-resolution IR spectra of the terrestrial
2
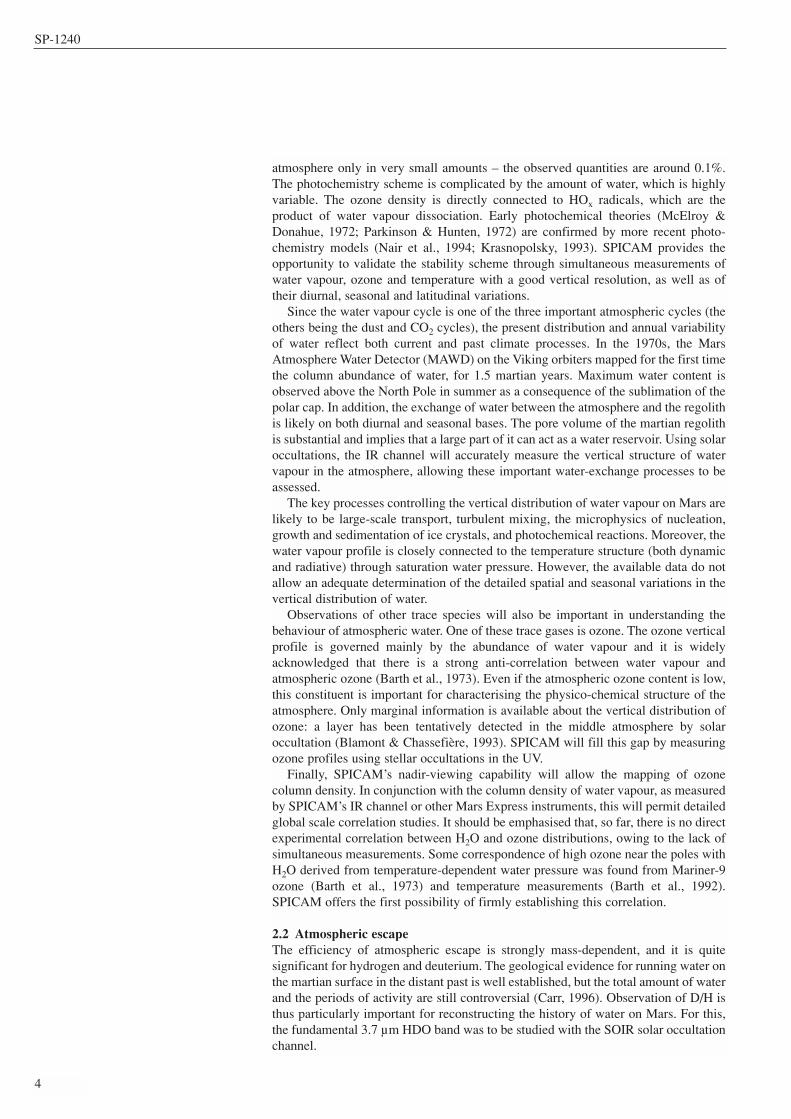
Fig. 1. Flight Model Sensor Unit of SPICAM viewed from above. The IR AOTFspectrometer is at top; the UV spectrometer isat bottom. The common optical axis points tothe left. For the UV spectrometer, the lightenters the mechanical baffle (black), is focusedby a parabolic mirror (bottom right) through aslit, then dispersed by the grating (middle left),to be refocused on the intensified CCDDetector (at centre).

scientific instruments
atmosphere. In the UV-visible, NASA’s SAGE-3 is using full-wavelength coverage ofthe Sun. Onboard Envisat, SCIAMACHY (Scanning Imaging Absorption Spectro-meter for Atmospheric Chartography) is performing solar occultation and nadirobservations, and the GOMOS (Global Ozone Monitoring by Occultations of Stars)instrument is dedicated to the monitoring of ozone and other species by stellaroccultations. SPICAM’s methodology is clearly in line with the most advancedinstrumentation for studying Earth’s atmosphere.
The only solar occultation measurements so far of Mars from spacecraft wereperformed during the Phobos mission using the Auguste instrument (Blamont et al.,1989; Krasnopolsky et al., 1989). Though the Phobos mission was not fullysuccessful, the solar occultation observations lasted more than a month, resulting inan important improvement of our knowledge of the martian water vapour profile(Krasnopolsky et al., 1991; Rodin et al., 1997), aerosol vertical distribution(Chassefière et al., 1992; Korablev et al., 1993) and ozone distribution (Blamont &Chassefière, 1993).
The promising results from the Phobos mission were not fully developed becauseof the failure of the Mars-96 mission, where the SPICAM set of sensors (total 46 kg)was dedicated to studying the martian atmosphere. The 4.7 kg SPICAM ‘Light’ ofMars Express will recover most of the science of SPICAM/Mars-96. Theconsiderable mass saving was achieved by sacrificing all the visible part of thespectrum and by suppressing all redundancy between the two sensors. Also, using thespacecraft for pointing removes the need for pointing platforms and devices. Theproposal for this SPICAM included a separate solar occultation IR sensor (SOIR),inherited from the solar package of SPICAM/Mars-96. This 3.8 kg sensor consistedof a grating spectrometer (1.2-4.8 µm, resolution 0.4-1 nm) for vertical profilingduring solar occultations of H2O, CO2, CO and aerosols and exploration of carboncompounds (Bertaux et al., 2001). Owing to the severe mass constraints of MarsExplorer, this sensor was deleted at the development stage, and replaced by theextremely lightweight near-IR spectrometer based on AOTF technology. Theconsequences for the scientific return are discussed below.
The tenuity of the CO2 martian atmosphere and the partial transparency to solar UVresults in intense photochemical activity, possibly including photocatalytic processesat the surface or on aerosols. Although the global mechanism of atmospheric chemicalstability proposed at the beginning of the 1970s (Parkinson & Hunten, 1972) isgenerally accepted, no substantial progress in modelling has been made in the last20 years. Understanding martian atmospheric chemistry is of fundamental importancefor characterising the history of Mars (escape of species to space, atmosphere/surfaceinteractions such as oxidation) as well as for comparison with terrestrial processes(chemistry/dynamics coupling, possible role of heterogeneous chemistry). Besideschemical processes, addressing the key problems of the martian climate includesunderstanding the transport of radiatively active aerosols, microphysics of clouds,regolith/atmosphere water exchange and wave activity in the atmosphere. So far, mostof the data on the composition and structure of the martian atmosphere relate to thetotal content of the species, with very little information on the vertical profiles ofaerosols, ozone, water vapour and other trace gases. SPICAM focuses on thedetermination of atmospheric characteristics from the surface up to 160 km altitude.SPICAM’s main objectives are defined in the following five subsections.
2.1 Three-dimensional studies related to atmospheric chemical stabilityAn important step in improving our knowledge of martian photochemistry is thevalidation of the currently accepted scheme of chemical atmospheric stability,originally proposed by Parkinson & Hunten (1972). To explain the CO2 stability, thisscheme invokes odd-hydrogen photochemical species that catalyse the recombinationof CO and O. These catalytic reactions are so efficient that O2 and CO appear in the
3
2. Scientific Objectives
SP-1240
atmosphere only in very small amounts – the observed quantities are around 0.1%.The photochemistry scheme is complicated by the amount of water, which is highlyvariable. The ozone density is directly connected to HOx radicals, which are theproduct of water vapour dissociation. Early photochemical theories (McElroy &Donahue, 1972; Parkinson & Hunten, 1972) are confirmed by more recent photo-chemistry models (Nair et al., 1994; Krasnopolsky, 1993). SPICAM provides theopportunity to validate the stability scheme through simultaneous measurements ofwater vapour, ozone and temperature with a good vertical resolution, as well as oftheir diurnal, seasonal and latitudinal variations.
Since the water vapour cycle is one of the three important atmospheric cycles (theothers being the dust and CO2 cycles), the present distribution and annual variabilityof water reflect both current and past climate processes. In the 1970s, the MarsAtmosphere Water Detector (MAWD) on the Viking orbiters mapped for the first timethe column abundance of water, for 1.5 martian years. Maximum water content isobserved above the North Pole in summer as a consequence of the sublimation of thepolar cap. In addition, the exchange of water between the atmosphere and the regolithis likely on both diurnal and seasonal bases. The pore volume of the martian regolithis substantial and implies that a large part of it can act as a water reservoir. Using solaroccultations, the IR channel will accurately measure the vertical structure of watervapour in the atmosphere, allowing these important water-exchange processes to beassessed.
The key processes controlling the vertical distribution of water vapour on Mars arelikely to be large-scale transport, turbulent mixing, the microphysics of nucleation,growth and sedimentation of ice crystals, and photochemical reactions. Moreover, thewater vapour profile is closely connected to the temperature structure (both dynamicand radiative) through saturation water pressure. However, the available data do notallow an adequate determination of the detailed spatial and seasonal variations in thevertical distribution of water.
Observations of other trace species will also be important in understanding thebehaviour of atmospheric water. One of these trace gases is ozone. The ozone verticalprofile is governed mainly by the abundance of water vapour and it is widelyacknowledged that there is a strong anti-correlation between water vapour andatmospheric ozone (Barth et al., 1973). Even if the atmospheric ozone content is low,this constituent is important for characterising the physico-chemical structure of theatmosphere. Only marginal information is available about the vertical distribution ofozone: a layer has been tentatively detected in the middle atmosphere by solaroccultation (Blamont & Chassefière, 1993). SPICAM will fill this gap by measuringozone profiles using stellar occultations in the UV.
Finally, SPICAM’s nadir-viewing capability will allow the mapping of ozonecolumn density. In conjunction with the column density of water vapour, as measuredby SPICAM’s IR channel or other Mars Express instruments, this will permit detailedglobal scale correlation studies. It should be emphasised that, so far, there is no directexperimental correlation between H2O and ozone distributions, owing to the lack ofsimultaneous measurements. Some correspondence of high ozone near the poles withH2O derived from temperature-dependent water pressure was found from Mariner-9ozone (Barth et al., 1973) and temperature measurements (Barth et al., 1992).SPICAM offers the first possibility of firmly establishing this correlation.
2.2 Atmospheric escapeThe efficiency of atmospheric escape is strongly mass-dependent, and it is quitesignificant for hydrogen and deuterium. The geological evidence for running water onthe martian surface in the distant past is well established, but the total amount of waterand the periods of activity are still controversial (Carr, 1996). Observation of D/H isthus particularly important for reconstructing the history of water on Mars. For this,the fundamental 3.7 µm HDO band was to be studied with the SOIR solar occultationchannel.
4

scientific instruments
An important goal of atmospheric studies is the characterisation of escapeprocesses, which are believed to have played an important role in climate evolution.The main processes of removing mass from the atmosphere are the sputtering ofatmospheric species by oxygen pick-up ions at the exobase level, and photochemicalescape (Kass & Yung, 1995; Jakosky et al., 1994). The close coupling of all theatmospheric layers makes it interesting to measure the profiles of hydrogen, carbonand oxygen species in the lower ionosphere, where strong vertical fluxes of thesespecies are supposed to take place. SPICAM will observe resonant scatteringemissions of H, C and O in the altitude range 100-200 km, as well as somefluorescence bands of CO and major ions (CO2
+, CO+). This altitude range, anessential interface region between the low atmosphere and the upper ionosphere(where escape occurs through direct interaction with the solar wind), cannot bestudied with in situ measurements because of the pericentre altitude of 300 km. UVglow measurements by SPICAM should provide information about thermosphericion-neutral chemistry and related vertical fluxes of chemical species at the top of theatmosphere, as well as about their diurnal and seasonal variations.
2.3 Surface/atmosphere chemical interaction; mapping of the atmospheric andsurface oxidant
The level of biologically lethal UV arriving at the surface of Mars is controlled by thevertical column of ozone, which is itself controlled by H2O, according to presentphotochemistry models. These models also predict the presence of O, H2O2, HO2, OHmolecules and radicals, which are extremely reactive with the surface. Together withozone, they are the main factors destroying any organic molecule that could bepresent on the surface (Stoker & Bullock, 1997). This radiative-chemical environmentof exobiological significance will be evaluated at a variety of locations, latitudes andseasons, thanks to the polar orbit of Mars Express and its martian-year lifetime. Aphotochemistry model validated by the consistency of various measurements makesit possible to extrapolate back in time and to assess more safely the conditionsconstraining the development of life on Mars.
More than 25 years ago, the Viking life detection experiments proved that themartian soil is extraordinarily oxidising. The evolution of CO2 from the labelledrelease experiment is consistent with the presence of a thermally labile oxidant.Detection and characterisation of the chemical and physical nature of this powerfuloxidant is therefore of great interest not only from an exobiological point of view butalso for studying exchanges between the atmosphere and the regolith on Mars. In thethin and cold atmosphere, photochemical reactions between traces of water and solarUV probably lead to the production of H2O2 which, in turn, can condense onto soilgrains and airborne dust. Hydrogen peroxide has not yet been detected in the Martianatmosphere. A tentative detection/upper limit experiment in millimetric waves wascarried out using the Interferomètre Radio Astronomique Millimétrique (IRAM)telescope (Moreau et al., 1998). Estimating the total abundance of this constituentmight be feasible using SPICAM’s UV channel.
2.4 Wave activity in the middle atmosphere and thermosphereTheory predicts that the temperature structure of the thermosphere above 120 km isdominated by the balance between EUV heating, non-LTE cooling and moleculardiffusion. In the middle atmosphere (40-120 km), the vertical structure is determinedprimarily by non-LTE solar heating and radiative cooling in the absorption bands ofCO2, and by solar EUV heating at higher levels. The thermal structure is modified bythe circulation driven by this force, and by tides and gravity waves that propagate fromthe lower atmosphere, break and deposit their energy in this region. Lower and uppercirculation models (including General Circulation Models) have recently been extendedinto the middle atmosphere, and need adequate temperature/density data to be validated.
Until recently, there were few temperature profiles measured in the upperatmosphere: Viking lander entry profiles (Seif & Kirk, 1977) and an indirect deriva-
5
SP-1240
tion above 120 km from Mariner-9 airglow (Stewart et al., 1972). New profiles werederived from Mars Pathfinder (MPF) entry accelerometry (Magalhaes et al., 1999)and Mars Global Surveyor (MGS) aerobraking data (Keating, 1998). The ThermalEmission Spectrometer (TES) on MGS produces 3-D temperature fields up to 35 kmin its nadir mode and up to 65 km in the limb-viewing mode (Conrath et al., 1998;1999). Radio occultation studies from Mars probes result in profiles below 20 km (seeHinson et al., 1999 for recent MPF radio profiles). Ground-based microwaveobservations based on CO-line profiling (Clancy et al., 1990) constrain temperatureprofiles on large (planetary) scales up to ~50 km. The thermal structure andcirculation of this part of the atmosphere is of primary importance on Mars: unlike onEarth, where the circulation in the troposphere is somewhat decoupled from that inthe stratosphere, the vertical extension of meteorological phenomena appears to beconsiderable. In some cases, this extension probably reaches the top of the neutralatmosphere around 120 km (e.g. the Hadley cell during northern winter). Thecirculation there may even affect the meteorology at much lower altitude (Forget etal., 1996). For instance, the strong warming of the polar-night atmosphere during duststorms is thought to result from an enhancement of the meridional wind between60 km and 100 km (Wilson, 1997). In fact, this behaviour of the martian atmospheremay limit the performance of the general circulation models and thus ourunderstanding of martian meteorology. How can we account for these upperatmospheric processes? Is the lower thermosphere circulation of importance?Because of their limited vertical coverage (< 65 km), TES and similar instrumentswill not solve the problem, leaving SPICAM as the single optical spectrometercovering this altitude range.
Gravity waves have small vertical wavelengths relative to their horizontal scales,which makes them well adapted for detection by SPICAM. In addition, SPICAM willallow us to observe the propagation and the breaking of these waves up to highaltitude for the first time.
2.5 Impact of aerosols on the martian climate Dusty and volatile aerosols are important components of the martian atmosphere. Thestrong involvement of the aerosols in basic climate fields means that the loweratmosphere may be considered as a ‘dusty climate’ system. A permanent haze existswith a column optical depth from 0.1 to 1 depending on season, with sporadicincreases up to several units during great dust storms. It is known to controltemperatures in the troposphere and lower stratosphere. Heating and cooling byaerosols drive dynamical phenomena, varying on scale from general circulation tolocal waves that give rise to atmospheric turbulence. The contents and distribution ofaerosols in the atmosphere are, in turn, controlled by atmospheric motion, beingincluded in the complex feedback that makes the current climate of Mars extremelyvariable. Volatile aerosols also affect the thermal field by changing the opticalproperties and settling rates of particles, and therefore provide strongly non-linearthermal feedback determined by the saturation curve. This effect is expected to bemost significant during aphelion (Clancy et al., 1996; Rodin et al., 1999).
Exploring the phenomena described above implies detailed studies of the vertical,lateral and size distribution of mineral and volatile aerosols, as well as water vapour,in the lower atmosphere. SPICAM’s large wavelength range (0.12-1.7 µm) providesa unique opportunity to study micron-sized aerosols at high spatial resolution.Simultaneous high-resolution measurement of the water vapour profile yields data onmicrophysical condition of cloud formation, e.g. the degree of supersaturation in thestratosphere and water eddy transport rates in both gaseous and condensed phases.Comprehensive modelling of thermal balance, turbulent transport and microphysicsof water vapour, ice and dust interaction with a self-consistent 1-D model (Rodin etal., 1999) will support these measurements.
The components of the martian atmosphere to be measured by SPICAM are givenin Table 1.
6

scientific instruments
3.1 OverviewSPICAM (Figs. 2-5) consists of two blocks: a sensor unit (SU) that includes UV(SUV) and near-IR (SIR) spectrometers, and a simple data processing unit (DPU).The SOIR solar occultation package (Bertaux et al., 2001) was excluded because ofmission mass constraints, but the UV and IR channels have solar occultationcapability in their limited wavelength ranges. The instrument’s mechanical layout isshown in Fig. 1. Mass, power and telemetry budgets are summarised in Table 2.
7
Table 1. Components of the martian atmosphere measurable by SPICAM.
Species Scientific objective Mode Spectral range Accuracy Altitude range
O3 concentration vertical profile stellar/solar occultation 220-300 nm 2-10% 10-50 km, ∆z < 1 km
O3 total abundance nadir 220-300 nm 5% (> 0.15 µatm) ground res 4×4 km
CO2 atmospheric density and solar/stellar occultation 180 nm 2-10% 20-160 km, ∆z < 1 kmtemperature vertical profile 5K
CO2 surface pressure, tides nadir 200 nm 0.2 mbar n/a
1.43 µm 0.1 mbar
H2O total abundance nadir 1.38 µm 0.2. pr. µm ground res 5×5 km(detectable)
H2O concentration/vertical profile solar occultation 1.1, 1.38 µm see text 5-30 km (clear atm.) 20-50 km (dusty atm.)
∆z = 2-3km
D, H isotope ratios limb emission 121 nm 20%
Aerosols vertical profile of characteristics solar/stellar occultation UV-IR 10–3 (photometry) 5-60 km, ∆z = 2-3 kmmapping of characteristics nadir spectropolarimetry 1.0-1.7 µm polarisation exploratory
rejection 10–4
O2 concentration vertical profile stellar occultation 200 nm 20% 35-90 kmnever done before
O2 concentration limb emission 1.27 µm tentative
H2O2 total abundance nadir 210 nm never done before
SO2 total abundance nadir 220 nm tentative
H, C, O, vertical profiling limb emission 118-320 nm 20% 80-400 km, ∆z ~ 2 kmCO2
+,CO of aeronomic emissions
Soil contribution to surface studies nadir spectropolarimetry 1.0-1.7 µm 10–3 (photometry) ground res 5×5 km
Table 2. SPICAM mass, power and telemetry budgets.
Mass Electronics block (DPU) 0.9 kg
Sensor unit (SU) 3.8 kg
Total 4.7 kg
Power DPU+SUV 13 W
DPU+SUV+SIR 18 W
Data volume
per measurement SUV 3.1 kB
SIR 1.05 kB
per orbit ~ 5 MB
3. The Instrumentation

SP-1240
3.2 UV spectrometer (SUV)The characteristics of the UV spectrometer are summarised in Table 3. For better UVefficiency, SUV includes only two reflective surfaces (Fig. 2). The light flux iscollected by an off-axis parabolic mirror, which reflects the light towards the entranceof the spectrometer. At the focal plane, a mechanical slit system provides twoconfigurations: no slit for stellar occultations, and with a slit for extended sources.The slit is divided into two parts, with different widths allowing two spectralresolutions when observing an extended source. The first (50 µm width) gives goodresolution with lower flux; the second (500 µm) gives more sensitivity at the expenseof a coarser spectral resolution. The slit can be completely retracted, creating a holecorresponding to the total useful field of view of 2×3.16°. This configuration is usedin the stellar occultation mode at dark limb when the spectrum of the star is recordedon a few lines of the CCD. The required pointing accuracy is 0.2°.
A holographic concave toroidal grating from Jobin-Yvon, ion-etched for higher
8
Fig. 2. Optical scheme of SPICAM’s UV andIR channels. 1: aperture blend of the UVchannel; 2: off-axis parabolic mirror; 3: slit(can be changed from wide to narrow, by amechanical actuator, see text); 4: concave UVgrating; 5: intensifier; 6: CCD; 7: IR channelobjective; 8: IR FOV diaphragm; 9/11:collimating lens; 10: AOTF crystal; 12: lighttrap for undiffracted light; 13: detectorproximity lenses; 14: ‘extraordinary’ beamdetector; 15: ‘ordinary’ beam detector; 16:solar opening (closed by shutter when notlooking at Sun); 17/21: flat mirror; 18: IRsolar entry; 19: optical fibre; 20: fibrecollimator.
Fig. 3. Breadboard instrument (June 2000; SIRis the prototype), seen from the same vantagepoint as in Fig. 1. In the final configuration, theparabolic mirror is rectangular, and notcircular.

scientific instruments
9
Table 3. Characteristics of the SPICAM UV channel (SUV).
Primary mirror Off-axis parabola 40×40 mm, coated MgF2, f = 120 mm
Slit 50 µm × 4.6 mm; 500 µm × 2.2 mm
FOV of a pixel 0.7×0.7´2×3.16° no slit (stellar occultation)0.24×0.95º with double slit
Spectral range 118 - 320 nm
Grating holographic, concave, toroidal coated MgF2, 290 lines/mm,blazed 170 nm
Spectral resolution per pixel 0.51 nm
Resolving power (occultations) 120-300 stellar; small slit
Resolving power 120-300 small slit,~20 large slit(extended source)
Pointing accuracy < 0.2º
Detector CCD Thomson TH7863 TE cooled at 270K, useful 288×384 pixels, 23×23 µm
Intensifier Hamamatsu 200M, solar blind CsTe photocathode, input window MgF2 + sapphire
Vertical resolution < 1 km (occultations), ~10 km (limb)
Fig. 4. SPICAM Qualification Model seen fromthe side of the UV spectrometer. Theintensified CCD is placed at the centre. Themirror is at left, the grating is at right.
Fig. 5. The AOTF IR channel. From right:entrance lens, AOTF crystal and the twodetectors, with the electronics board on top.

SP-1240
efficiency, feeds the detection block. The image ratio is ~1, which means that amonochromatic image in the entrance of the spectrometer is conserved in the plane ofthe detector. The spectral resolution for a point source determined by aberrations isabout 1 nm. The CCD detector is a Thomson TH7863 with 288×384 useful pixels anda masked zone of equivalent size. Pixel size is 23×23 µm. The detector is electricallycooled to ~0°C, where the dark current equals 800 electrons per pixel per second, or afew ADU (Analogue to Digital Unit) only. By means of custom-made fibre optics, theCCD is coupled with the output window of the image intensifier (from Hamamatsu,type 200M). A solar blind CsTe photocathode has zero quantum efficiency beyond320 nm. The input window is made of MgF2 in order to reach down to Lyman-α (atarget of SPICAM). An additional sapphire filter is glued above the window and coversit in part, preventing overlapping of diffraction orders and Lyman-α stray light.
3.2.1 Expected performancesTaking into account the optical characteristics of the UV spectrometer components,quantum efficiency of the photocathode, star spectrum and its reddening owing tointerstellar dust absorption, the S/N ratio of SUV in stellar occultation mode can beestimated. Adopting the equation of Henry, it was found that there are nine starsemitting more than 104 phot. s–1 cm–2 nm–1 at 220 nm, and 86 stars emitting 103-104
phot. s–1 cm–2 nm–1. For these two thresholds, S/N is respectively > 91 and > 29 perpixel. There are ~100 pixels that may be used to determine the CO2 or ozoneabsorption, and this gives an idea of the likely accuracy achieved on the retrieval ofline density of CO2 and O3. Simulation exercises show that the accuracy should be ofthe order of 2-10% for CO2 (20-160 km) and ozone (below 50 km).
For an extended source observation, the whole slit is illuminated, and it is possibleto integrate over several lines of the CCD. When looking at nadir (dayside), theexpected number of photoevents that yield S/N ~ 500 for 1 s integration is2.5×105 nm–1 at 270 nm.
For limb observations, a typical airglow emission of 8 kR nm–1 (as recorded at thebright limb by Mariner-9) results in ~ 4000 photoevents per pixel at 220 nm, yieldinga S/N of 62. At wavelengths longer than 300 nm, the large slit would be used forbetter S/N if necessary. Along the large slit, where the spectral resolution is about
10
Fig. 6. Longitude from the Sun aroundpericentre (spacecraft altitude below 800 km)during the first martian year of the mission.(Figure adopted from Hechler & Yanes, 1999).

scientific instruments
5 nm, there is 10 times more flux on each pixel than along the narrow slit. It ispossible again to integrate over several lines of the CCD. For 50 lines, it yields ~104
photoevents per nm at 270 nm, or a S/N of 100 for 1 s integration.For solar occultations, a 0.2 cm2 mirror looking 90º from the main optical axis is
positioned at the entrance pupil, and the detector operates at the lowest gain andintegration time of 10 ms.
3.3 Near-IR spectrometer (SIR)A single-pixel detector of InGaAs, associated with an AOTF, will allow themeasurement of the H2O column at nadir for an instrument mass of only 0.7 kg. Thenew AOTF devices are based on Bragg diffraction of an entrance beam by theultrasonic acoustic wave excited within a crystal. They offer the potential of reachinga resolving power, λ/∆λ, superior to 1000, amply sufficient to measure nadir H2O byscanning the absorption lines at 1.38 µm in the solar reflected spectrum. There are nomoving parts such as a chopper. This new concept for IR spectroscopy has not flownbefore on a civil spacecraft but it is now sufficiently mature for space researchapplication.
The AOTF near-IR spectrometer (SIR) is included alongside the UV package; theoptical scheme is shown in Fig. 2. The principal characteristics of SIR aresummarised in Table 4. A lens telescope 30 mm in diameter has a focal ratio of 1:1.9.A circular diaphragm 1 mm in diameter placed in the focal plane of the telescopeforms the FOV. A collimator with two small lenses forms a beam into a custom-madeTeO2 AOTF crystal with an active zone of 23 mm. The divergence of the beams insidethe crystal is limited to ±5.5°. The linear aperture has the minimal pupil of 3.12 mmin the centre of the crystal and is less than 3.5 mm at the edges. The output systemseparates the beams for different polarisations; it consists of two lenses, the firstcompensating for the divergence of the output beam, and the second focusing the lightat the detector. There are two detectors and two short-focus proximity lenses, for theordinary and extraordinary beams, to allow measurement of the polarisation of theincoming light.
For simplicity, SIR uses the same solar entrance as SUV. An optical fibre deliversthe light to the SIR objective. The entry optics of this fibre creates the angular FOVof about 4 arcsec. A collimator lens at the output of the fibre and a 45° flat mirrormounted at the baffle of the SIR objective complete the design of SIR’s solarentrance.
4.1 Nadir viewingSPICAM will obtain the first simultaneous measurements of water vapour and ozonefor the martian atmosphere. The vertical column of H2O and O3 will be obtained
11
Table 4. Characteristics of the SPICAM near-IR channel (SIR).
Spectral range 1.0-1.7 µm
Spectral resolution 0.5 nm at 1.0 µm; 1.2 nm at 1.7 µm or better than 4 cm–1
FOV 1º
Telescope Lens type, Ø 30 mm
AOTF TeO2, efficiency 70% (in polarised light), aperture 3.6×3.6 mm, ±3.5º
Detector 2 InGaAs PIN diodes (Hamamatsu G5832), Ø 1 mm,1 stage TE cooled to –15ºC, D ~ 3×10¹³ W–1 cm Hz
Transmission of optics 20%
S/N ~1000
4. Measurements

SP-1240
systematically along track, on the dayside, when the spacecraft is nadir-oriented, witha ground resolution of ~4 km at pericentre. The latitude-season coverage for the firstyear of the mission is presented in Fig. 6. SPICAM will operate up to 15 min beforeand after pericentre (attitudes up to 1500 km), and its coverage may be denser than isshown in Fig. 6.
4.1.1. Mapping of H2O total column abundance in the IRThe method of nadir sounding of water vapour in the near-IR bands continues theapproach of Mars 3 and MAWD on the Viking orbiters (Farmer & LaPorte, 1972). ForMars Express, the OMEGA instrument will perform spectral mapping in the samespectral range, but H2O retrievals from these data will be limited because of the muchcoarser spectral resolution. The principal contribution to water vapour mapping onMars-Express is expected from the Planetary Fourier Spectrometer (PFS). PFS offersa near-IR range similar to that of MAWD and a thermal-IR range similar to that ofMariner-9’s Fourier spectrometer (IRIS). The thermal-IR sounding of H2O requires aprecise knowledge of the temperature profile but it provides redundancy and can beused at night.
SPICAM’s observational principle in its nadir mode is the same as that of PFS.SIR’s optical axis is parallel to those of all the nadir-looking instruments on MarsExpress. SIR’s spectral range (1000-1700 nm) requires ~1900 points to be measured.Practically, the amount of data produced by the instrument (polarimetry measure-ments double the quantity) will be limited by the telemetry budget. The frequency ofthe AOTF ultrasonic excitation is selected by software, so only the most interestingparts of the spectrum will normally be measured with the desired sampling. The H2Oband could be characterised using only 20 well-chosen points per nadir viewing (FOV1º), instead of the several thousand for a complete PFS spectrum. The normalexposure time is expected to be within 4 s, allowing the measurement of two spectra(one for each polarisation) of ~300 points each.
Simulated spectra of the atmospheric transmittance in the nadir configuration areshown in Fig. 7. They were computed using the HITRAN-96 database, for amultilayered atmospheric model. The water vapour band at 1.38 µm is apparent. Thisband is highly suited to H2O detection because it is strong and almost free from CO2influence. For those reasons, it was used by MAWD/Viking (Farmer & LaPorte,1972). The spectral signatures of H2O are well resolved at the expected spectralresolution of 4 cm–1. Owing to this relatively high spectral resolution, the gaseousabsorption signatures are easy to distinguish from surface spectral features. Theestimated nadir S/N will be better than 500, so the minimal detectable amount of H2Ocolumn abundance is well below 1 pr. µm.
SIR is capable of measuring the column abundance of CO2 in the 1.43 µm band
12
Fig. 7. Line-by-line spectra of nadiratmospheric transmission. Spectra arecomputed for the water vapour abundance of15 pr. µm and 50 pr. µm (offset in H2O bands)and for surface pressures of 6 mbar and7 mbar (offset in CO2 bands).

scientific instruments
and, therefore, the surface pressure. The pressure change from 6 mbar to 7 mbarresults in a very large modification of the spectrum (Fig. 7). Combined with the S/Nof 1000, it produces an accuracy of better than 0.02 mbar (at least on a relative scale)in the ground pressure. Owing to the AOTF wavelength selection capability, thesurface pressure will be measured simultaneously with H2O, at a very low telemetrybudget.
The ordinary and extraordinary beams at the output of an AOTF crystal can beanalysed simultaneously using two identical detectors, and the polarisation of theincident light can be measured with high accuracy (Glenar et al., 1994). The secondsingle-element detector does not significantly complicate the instrument. Polarimetrymeasurements enable a characterisation of grain size for the surface of Mars and ofthe properties of atmospheric aerosol components (Santer et al., 1985). In particular,it is possible to detect cirrus-like crystal clouds (Lee et al., 1990). With suchmeasurements at a very limited number (2-3) of wavelengths of atmosphericabsorption features (e.g. at 1.25 µm and 1.7 µm, see Fig. 7), important additionalinformation about the reflectivity of the surface and the aerosol extinction will beobtained. AOTF’s wavelength control means that these measurements will beperformed simultaneously with H2O detection.
Also, the spectral measurements by SIR could be used for cross-validation ofOMEGA and PFS data.
4.1.2 Mapping of ozone in the UV For nadir measurements of ozone, the most sensitive method will be used: the strongHartley band around 255 nm imprinted on the solar light scattered by the ground andlower atmosphere. This is the technique that discovered ozone on Mars, and it isextensively used on Earth, showing the Antarctic ozone hole. The reflectance UVspectrum results from several sources:
— light reflected by the surface, defined by an albedo A, and modified twice byextinction of dust and CO2 Rayleigh scattering (at λ > 200 nm);
— light produced by Rayleigh scattering of CO2;
— solar light reflected by aerosols, distributed vertically;— absorption by ozone, distributed vertically.
13
Fig. 8. Modtran computations for nadirgeometry. Solar zenith angle 60º, ozone totalabundance 5 µ-atm. A possible effect of H2O2is considered: no H2O2 (curve a); H2O2 columnof 2×1016 cm–2 (curve b) and 2×1017 cm–2
(curve c).

SP-1240
Wehrbein et al. (1979) were able to fit the Mariner-9 data with a simple singlescattering model, defined by four parameters: ozone optical depth (τ0), surface albedo(A, assumed to be constant in the UV range), optical depth of dust and Rayleigh (τc)and the scale height H0 of ozone, different from the fixed atmospheric scale height HS.Indeed, they found a better fit of the bottom of the spectral reflectance trough (Fig. 8)with a ratio H0/HS = 0.6 than with a fixed value H0 = HS, showing that ozone wasfound mostly near the cold surface where the air is dry in high-latitude regions.
A refined analysis scheme requires a more sophisticated algorithm than the oneused for the early interpretation of Mariner-7 and -9 data (Barth & Hord, 1971; Barthet al., 1973; Wehrbein et al., 1979) but such algorithms are already working for theEarth (the solar backscatter UV method, used by the Global Ozone MonitoringExperiment on ERS-2).
With SPICAM UV, which registers all wavelengths simultaneously, the S/N willbe much greater than for Mariner-9’s UV spectrometer (larger than 100 for eachnanometer of spectrum in 1 s integration time). This allows the aerosol distribution tobe disconnected from the air scale height and Rayleigh scattering. Either a discreteordinate method or codes similar to those used for interpreting solar backscatter UVspectra in the Earth’s atmosphere will be used.
Figure 8, computed for an ozone quantity of 5 µatm (1 µatm = 2.689×10¹⁵ mol cm–2
= 0.1 Dobson units), shows the trough of ozone centred at 255 nm. It is estimated thata trough of ~1% is detectable, corresponding to a vertical optical thickness at 255 nmof 0.5%, or a column density of N = τ0/σ = 4×10¹⁴ mol cm–2, or 0.15 µatm. This allowsmeasurements of ozone in all seasons and latitudes. Above this threshold (say,N > 2 µatm), the statistical noise will be a negligible source of error, while systematicerrors give an uncertainty of 5%.
SUV will be regularly calibrated in flight by observing standard stars and the Sun.The absolute solar spectrum outside the atmosphere is well known. The reflectancespectrum of Mars will therefore be obtained with a good absolute accuracy and at aspectral resolution of 1 nm. Then, in addition to the main features of the reflectionspectrum such as Rayleigh and aerosol scattering overlaid with ozone and CO2absorption, other unknowns can be retrieved:
14
Fig. 9. Variation of the UV nadir transmissionspectrum with surface pressure.

scientific instruments
— for surface pressures of 6 mbar and 8 mbar (the total CO2 vertical column isdirectly connected to the surface pressure), the absorption edge varies in wave-length position at 210 nm (Fig. 9). Therefore, there is the promising possibility ofmeasuring the surface pressure from the position of the absorption edge in thereflected spectrum. An accuracy of half-a-pixel (easily achievable with such ahigh S/N) or 0.25 nm on the wavelength would translate into an accuracy of~0.2 mbar. These data will be used for cross-validation of more precise nadir SIRsurface pressure measurements and, combined with the known altimetry, willprovide a valuable source for meteorological studies.
— H2O2 presents continuous absorption in the UV around 200-220 nm (Yung &Demore, 1999). A simulation of the reflectance (Fig. 8) shows that even for caseb, which is not for maximum H2O2 conditions, there is a small difference. Thoughit is difficult to disentangle the continuous absorption by H2O2 from dust, it ishoped that a careful analysis with assimilation of aerosol data obtained at otherwavelengths will allow the first measurement of this important molecule.
4.2 Vertical profiling by stellar occultation in the UVSPICAM will measure the vertical distribution of CO2, temperature, O3, aerosols, O2and possibly H2O2 by using stellar occultation, as planned for SPICAM/Mars-96.
The principle is simple. Along the spacecraft’s orbit, stars are occulted one after theother by the planetary limb opposite the velocity vector. At a predetermined time, thespacecraft is oriented in such a way that the line of sight of SUV points towards agiven star. The stellar spectrum recorded above the atmosphere (say, at200 km), unaltered by atmospheric absorption, serves as a reference spectrum. Then,while the spacecraft is maintained in a 3-axis, inertial attitude, the line of sightintersects increasingly deeper parts of the atmosphere, down to total occultation.
The stellar occultation technique offers three decisive features:
— an absolute concentration derived from a relative measurement (self-calibrationmeans there is no need for instrument calibration);
— excellent vertical resolution, whatever the distance to the planet (because the staris a point source);
— the accuracy of altitude knowledge, in contrast with limb emission methods, isindependent of the spacecraft attitude. The line of sight is determined entirely bythe direction of the star in the sky (known) and the position of the spacecraft onits orbit.
Stellar occultations will be performed preferably on the night side of the orbit, andwill not affect the operation of dayside mapping instruments. The spacecraft iscommanded to direct the SUV line of sight towards a bright UV star and this fixedorientation is maintained within 0.5° (nominal spacecraft capability is better than0.05°, ensuring that the star remains within the 1° FOV of the instrument during theoccultation, which lasts typically 1-4 min). Several (3-5) occultations per orbit areforeseen, the limiting factor being the spacecraft orientation, which is a resource to beshared among the various investigations. Hot stars are preferred, because they arebrighter in the UV. Their spectra are flatter than the solar spectrum in the UV. Thisoccultation method offers other features:
— whatever the orbit, there will be numerous opportunities for stellar occultations;— when a star is occulted during one orbit, it will be occulted again during the
following orbits at about the same latitude, but at different longitudes;— the vertical profiling is not restricted to be along the ground track, in comparison
with other instrumental methods;— de-occultation (star rise) is also possible, since there is no closed-loop tracking
system.
15

SP-1240
Figure 10 shows the absorption cross-sections of CO2 and ozone in the UV as afunction of wavelength. O2 is absorbing (Schumann-Runge bands) between the peaksof CO2 and O3, offering the possibility of actually measuring O2. Other absorbers aredust (Mie scattering generalised to non-spherical particles) and possibly H2O2 andSO2. The atmospheric transmission simulations are presented in Fig. 11 for varioustangential heights. Besides CO2 and ozone, a dust profile was assumed, with a verticaloptical thickness τd = 0.2 at 300 nm. Rayleigh extinction by CO2 was also included inthe simulations.
Because the CO2 cross-section presents an enormous dynamic range in the UV,CO2 absorption may begin to be detected at an altitude of 150 km. For decreasingtangential heights, the CO2 manifests itself by a sharp cut-off that increases inwavelength, up to ~200 nm at z = 10 km. Longward of 200 nm, the transmissionspectrum is dominated by dust and CO2 Rayleigh extinction, with the additionaltrough at 255 nm due to ozone. The depth of this trough is a direct measure of ozoneline density. From the given S/N in stellar occultation mode (see above), the O3 linedensity Nh accuracy will depend on the UV magnitude of the star. It can be estimatedthat the accuracy on the O3 line density will be about 2% for about 20 stars in the skyand the measuring threshold corresponding to an absorption of ~1% corresponds toNh = 1015 mol cm–2 (horizontal) and local density of 3.5×107 cm–3 at all altitudesz > 15 km (Korablev, Bertaux & Dubois, 2001).
The Rayleigh extinction above 200 nm can be computed from the CO2 line densitydetermined below 200 nm. The remaining continuous absorption above 200 nm maybe attributed to dust/aerosols for a determination of its vertical distribution andspectral characteristics in the UV.
4.2.1 CO2 density and temperature profileOnce the line density of CO2 is determined from the transmission spectra, the localdensity n (z) is determined from an Abel inversion. Then, the hydrostatic equationallows temperature to be determined. As for O3, the accuracy on the CO2 line densitywill be about 2% for 20 stars. The accuracy of the retrieved temperature is estimatedto be ±5K in the whole range of altitude, starting at 130-160 km at the top level, whilethe lowest altitude achieved will depend on the absorption by aerosols or clouds, andwill most likely be 5-20 km.
16
Fig. 10. Absorption cross-sections of CO2 andozone in SPICAM’s UV spectral range.

scientific instruments
There is a known dependence of the CO2 absorption cross-section on thetemperature T. The retrieval process begins by a first iteration with an a priori profileT(z) and corresponding choice of CO2 cross-section. Then, N and n are retrieved, andthe scale height is derived, independently of a wrong choice of the cross-section,providing a new guess for T(z). A few iterations allow convergence of the process. Asimilar retrieval procedure was developed and tested for the GOMOS/Envisat stellaroccultation experiment.
Though nighttime stellar occultations are preferred, it is important to keep in mindthat some daytime occultations should be performed on particularly bright stars on thebright limb. They could be combined with UV airglow limb observations to get abetter understanding of thermal structure, and to solve unambiguously thediscrepancy between Viking and Mariner-9 temperature profiles at z > 120 km. Inaddition, the day-night amplitude variation of the exospheric temperature (at the topof the thermosphere) is a crucial test for the validity of sophisticated ThermosphericGeneral Circulation Models (TGCMs), such as that developed by Bougher et al.(1990). The model predicts a dayside temperature of 270K at 170 km, and a night sideT = 160K at the same altitude, but it was impossible to validate this model owing tothe lack of measurements. SPICAM offers a wide coverage of density/temperatureprofiles (local time, season, latitude, geography and solar activity) with which theTGCM could be validated (or invalidated, and modified accordingly). Then, such amodel could be used as a predictive tool for managing aerocapture/aerobrakingoperations in future.
Finally, SUV has a unique ability to detect condensation clouds during the night.The Pathfinder camera detected fog, but was not able to determine the layer’s altitude.SUV will do this accurately.
4.2.2 The case for molecular oxygenMolecular oxygen is the result of CO2 photodissociation. Its mixing ratio wasmeasured to be of the order of 10–3, and is assumed to be constant. O2 provides in theSchumann-Runge bands (170-210 nm) an additional absorption that should bemeasurable. Calculations show that the difference of transmission between anatmosphere with O2 (O2/CO2 = 10–3) and an atmosphere without O2 amounts to 2%
17
Fig. 11. Simulated stellar occultationtransmission spectra for tangential altitudesfrom 150 km to 10 km in steps of 10 km.

SP-1240
between 80 km and 50 km, in a bandwidth of about 20 nm centred on 190 nm. Theabsorption decreases somewhat below, but is detectable down to 35 km. In principle,one expects a constant mixing ratio of O2, in altitude and over the planet, inasmuchas we understand the chemical reactions that control this molecule. There is, however,the special case of the polar winter, when the CO2 condenses on the martian surfacewhile the O2 remains, enriching the airmass. The O2 mixing ratio may be used as atracer of polar airmass circulation. Its exact value depends on how fast the non-polarairmasses flow to the pole to replenish the locally condensing CO2 atmosphere. TheUV occultation technique is the only way of accessing to this important molecule.
4.3 Solar occultation measurementsAs well as the SUV working in the stellar occultation mode, both SUV and SIR willbenefit from the advanced pointing capabilities of Mars Express for solaroccultations. A solar aperture below the sensor will be pointed towards the Sun byorienting the spacecraft. The angular diameter of the Sun as seen from Mars is 0.35º,but the variability in the brightness of the solar disc requires an attitude controlaccuracy of 0.1º, well within the spacecraft specifications.
In the case of a polar orbit, there is no precession of the orbital plane. Then, duringone martian year, there are two periods of solar occultations, centred on the two dateswhen the Sun is in the orbital plane (the angle between the solar vector and the orbitplane is zero). Therefore, the possibilities of solar occultation measurements areindependent of the other orbital elements.
For the nominal orbit during the mission lifetime, some 700 sunset-sunriseoccultation sequences are expected. The occultations occur within about 60 min ofpericentre. The two hemispheres are covered twice during spring and autumn(Fig. 12). The spacecraft-limb distance during these periods varies between 4000 kmand 11 500 km. The duration of each occultation sequence for the altitude range of 0-150 km is 2-3 min. During the second martian year, there will be fewer occultationscloser to apocentre (spacecraft-limb distance above 8000 km).
Solar occultation spectroscopic sounding of a planetary atmosphere offers severaladvantages. The radiation of the Sun is an incomparably powerful source and it
18
Fig. 12. Periods of solar eclipse for MarsExpress orbit G3A. (Figure adopted fromHechler & Yanes, 1999.)

scientific instruments
traverses the largest possible atmospheric path (the airmass factor reaches 40-45 forMars). As for stellar occultations, the measured spectra are compared with theunattenuated signal above the atmosphere, which is measured in the same sequencebefore occultation to provide self-calibration. A disadvantage is that the atmospherecan be observed only when and where there is a sunset/sunrise.
Vertical resolution of the UV channel is determined by the slit width in onedirection and by the pixel height in the other. Assuming that the spectra will beintegrated over two lines of the CCD, the FOV will be 1.5×1.5 arcmin, leading to alinear resolution of 1.7-5 km. Using a single CCD line doubles the linear resolutionin one direction. The FOV of the IR channel will be better than 4 arcmin because ofthe fibre optics that deliver the solar light to SIR, limiting the vertical resolution at thelimb to 5 km under the best conditions.
The solar-mode SUV will target the same scientific objectives at the terminator asthe stellar occultation mode but with a better S/N. The Sun’s brightness allows deepersounding for dusty conditions. The solar mode SIR can measure water vapour verticalprofiles – extremely important measurements that cannot be done by any otherinstrument aboard Mars Express or any planned US mission.
4.3.1 Water vapour profiling by SIRThe efficiency of the solar occultation method for studying the vertical distribution ofwater vapour was proved during the Phobos mission, when measurements at 1.87 µmdetermined H2O vertical profiles in the altitude range 10-50 km (Rodin et al., 1997).
The simulated absorption spectrum of the martian atmosphere at the limb is shownin Fig. 13. It is similar to the nadir spectra, but the absorptions are much moreprofound. The same near-IR absorption band at 1.38 µm will be used for both. Theabsorption features of H2O in this band are deeper than 10%. The accuracy of water-vapour limb sounding depends on atmospheric conditions. Based on availableobservations (one of which comes from the solar occultation experiment on Phobos,Rodin et al., 1997) and modelling results (Rodin et al., 1999), two types of H2Oprofiles can be considered: ‘dry and cold’ and ‘warm and wet’. The dry verticalprofile of H2O constrained by a relatively cold temperature profile in a clean atmos-phere (Clancy et al., 1990; Rodin et al., 1997) can be described as 100 ppm below
19
Fig. 13. Simulated near-IR spectrum of the martian atmosphere at the limb (tangentialaltitude 10 km).

SP-1240
10 km, ~30 ppm at 15-20 km and 10 ppm above 25 km. In these conditions, thehighest sounding altitude is around 30-35 km, and the lowest, constrained by theaerosol absorption, is within 5-10 km. For ‘warm and wet’ conditions, the highestaltitude is 45-50 km (though the absorption at these altitudes is ~0.5%) but the lowestmay be 10-15 km because of the larger amount of dust in the atmosphere, whichlevitates to higher altitudes.
4.3.2 Profiling and characterisation of atmospheric aerosolsThe main component of martian aerosols is micron-sized dust, a product of soilweathering, and water ice. According to MGS data (Pearl et al., 1999; Smith et al.,1999), clouds composed of 2 µm particles with visible optical depths of up to 0.1 areformed at the water vapour condensation level, which, in equatorial regions, variesfrom lower than 10 km at aphelion to almost 50 km in the perihelion season.Occultation spectroscopy is probably the most sensitive remote-sensing technique fordirectly sounding the vertical structure of clouds and aerosols. In solar occultation, theinformation about the spectral continuum at distant spectral wavelengths is abyproduct of gaseous absorption retrievals. As soon as the slant atmospheric opacitiesat different wavelengths are obtained from occultation data, the aerosol extinction canbe retrieved by Abel inversion. Then, using the Mie theory (possibly adapted for non-spherical particles), a number of unknown parameters characterising the aerosolcomponent can be extracted, such as the size distribution, and the real and imaginaryparts of the refractive index. Also, the vertical variation of key parameters such as theeffective size and the number density can be retrieved.
SPICAM measurements are expected to be able to separate the mineral and volatileaerosol fractions. However, when both fractions are present, it will be difficult todetermine whether mineral dust particles are cloud condensation nuclei or two kindsof aerosols mixed along the optical path. To help the interpretation, these data will becompared with or assimilated into the 1-D cloud microphysics model mentionedabove. It is especially interesting that the vertical profiles of icy aerosols will beobtained in parallel with water vapour profiles. If the observed water vapour is farfrom saturation, we expect mostly mineral dust aerosols that can be verified byspectroscopic analysis. It is a general assumption that the mineral-dust profile iscontrolled by the vertical component of large-scale atmospheric circulation and eddymixing. Therefore, these phenomena can be constrained by the retrieved dust profiles(Korablev et al., 1993).
4.3.3 The consequences of deleting the dedicated solar occultation sensor (SOIR) The classical IR grating spectrometer for solar occultations (Bertaux et al., 2000)covers a broad spectral range (1.3-4.8 µm) at a relatively high spectral resolution (2-4 cm–1), almost the same as the spectral resolution and FOV of PFS. The AOTFspectrometer has the spectral range of 1.0-1.7 µm and the spectral resolution of~3.5 cm–1. The FOV in occultation mode is larger (4-5 arcmin) because of thesimplified entrance system.
Unfortunately, the mass constraints of Mars Explorer dictated the deletion ofSOIR. Apart from the vertical resolution, there is no significant degradation ofaccuracy for H2O profiling in solar occultation. No redundancy is lost; only the1.38 µm H2O band of the three main short-IR absorption bands (1.38, 1.87, 2.56 µm)will be measured, but the grating spectrometer could measure only one at a timeanyway. Reduced spectral resolution does not affect the accuracy drastically. Thenarrower spectral range makes the aerosol profiling less effective, losing the capacityto measure some interesting components:
— the HDO band at 3.7 µm, so the IR measurements of D/H in the loweratmosphere cannot be compared with the UV measurements in the thermosphere;
— exploratory studies of the carbonic compounds at 3.3-3.7 µm;— CO measurements in the fundamental CO band at 4.7 µm and in the 2.3 µm
20

scientific instruments
overtone band. Photochemical models predict that CO with its long lifetimewould not show any significant altitude stratification, but geographical variabilityof CO in the lower atmosphere is worth monitoring;
— strong saturated CO2 bands (at 4.0 µm and 2.7 µm) fall outside of the AOTFspectral range. It was planned to use these bands for atmospheric density studiesat 80-120 km; the same sounding will be done in the UV. This redundancy, andthe possibility of independently measuring the rotational temperature in the CO2bands, is lost.
Conversely, an important advantage of the AOTF spectrometer over the gratingspectrometer is that all the interesting regions of the spectral range can be acquiredwith the desired sampling during the same occultation session using spectral micro-windows (for gaseous components) and distant points (for aerosol characterisation inthe spectral continuum). Thus full advantage will be taken of each occultation, whichare relatively infrequent events.
4.4 Airglow observations at the limb4.4.1 Study of the ionosphere in UVMost of the ionosphere lies below the planned pericentre altitude of Mars Express(300 km) so in situ measurements will be impossible. However, the natural UVairglow of the atmosphere allows remote studies of the ionosphere and its temporalbehaviour as a function of solar-wind parameters. Figure 14 shows the dayglowspectrum recorded by the Mariner-6 and -7 UV spectrometers (Barth et al., 1971).
The main ionisable neutral constituent is CO2. The CO2+ transition (B2Σu+ – X2πg)
at 289 nm is produced by photoionisation of CO2 from solar UV at λ < 69 nm. Theother band CO2
+ (A2Σu – X2πg), between 300 nm and 400 nm, is produced by acombination of photoionisation and fluorescence scattering on CO2
+ ions. TheSPICAM UV long-wavelength cut-off is at 320 nm, which is sufficient to measure the(4,0) and (3,0) transitions of the A-X band.
The intense Cameron band of CO a3π – X1Σ+ observed at 190-270 nm is producedby a combination of photodissociation of CO2 by solar UV (λ < 108 nm), electronimpact dissociation of CO2 and dissociative recombination of CO2
+. The variation of thisband intensity with altitude was used to determine the vertical profile of CO2 above120 km, and from the scale height the temperature of the thermosphere was derived(Stewart et al., 1972). This indirect method of determining CO2 could be validated withSUV, when a stellar occultation is performed on the dayside. The large slit of the FOVwill be used to ease the pointing requirement; the bright stellar spectrum would showup, superimposed on the general airglow only on a few lines of the CCD, and the
21
Fig. 14. Mariner-6 and -7 UV spectrum of the upper atmosphere of Mars at a resolution of20 Å. Limb spectrum at altitudes between140 km and 180 km, including four individualobservations (figure adapted from Barth et al.,1971).

SP-1240
analysis of the spectro-image would provide information on CO2: direct measurementby absorptive occultation, and indirect CO Cameron band emission. Neutral O andneutral H vertical density profiles may be derived from the vertical variations of theirresonance lines at 130.4 nm and 121.6 nm (Lyman-α), respectively.
4.4.2 Hot oxygen corona, atmospheric escape and D/H ratioWhile CO2 + hν → CO2
+ is the main photoionisation source, it is the O2+ ion that is the
most abundant. As a result, a hot atomic oxygen corona around Mars (Ip, 1988),similar to that detected by Venera-11 (Bertaux et al., 1981) around Venus from theemission at 130.4 nm, can be easily detected with SPICAM’s better sensitivity. Thismay be an important source of O escape from the martian atmosphere, somewhatequilibrating the escape of H atoms responsible for the measured enrichment of D/Hratio (a factor of 6) detected in the IR in the lower atmosphere (Owen et al., 1988).
D atoms and H atoms both produce a Lyman-α resonant emission in the upperatmosphere, excited by the H solar Lyman-α line. Since the wavelength separation(H, 121.566 nm; D, 121.533 nm) is larger than the thermal width of each line, theradiative transfer of both types of Lyman-α are totally decoupled. Though SUV hasinsufficient spectral resolution, these two emissions could be tentatively separatedfrom the vertical distribution of the sum intensities. While the H emission shouldpresent a smooth variation around the CO2 absorption limb (around 120 km), becauseit is optically thick, the D Lyman-α emission is optically thin, and the intensitydoubles just above the limb. Any spike at the CO2 limb in the vertical distribution ofLyman-α total intensity limb (estimated to be ~300 R) would be due to D atoms.Therefore, both D abundance and H abundance could be determined in the upperatmosphere, and compared with HDO/H2O measurements in the lower atmosphere inthe IR. With Lyman-α measurements from the Hubble Space Telescope,Krasnopolsky et al. (1998) reported that the D/H ratio in the upper atmosphere waslower by a factor of 10 than the D/H ratio in the lower atmosphere. One possibleexplanation (Cheng et al., 1999) is that HDO is less photo-dissociated than H2O,because of a smaller cross-section. This effect is probably insufficient to explain thediscrepancy, and another explanation is known to be important (Bertaux &Montmessin, 2001): fractionation through condensation. HDO is more prone tocondense in ice crystals than is H2O from the vapour phase, decreasing the D/H ratiowith altitude in regions where the photo-dissociation rate is important. This effect isknown to play an important role in the Earth’s upper troposphere-stratosphere, whereHDO is severely depleted just above the tropopause.
4.4.3 O2 limb airglow in the IRA dayglow 1.27 µm O2 (1∆g) emission was observed from the ground at highresolution by Noxon et al. (1976). This emission was predicted just after the discoveryof ozone on Mars by Mariner-9 (Barth & Hord, 1971). The martian situation is similarto Earth’s, where a strong airglow arises from O2 (1∆g) production from ozonephotolysis. Latitude correlation of this emission with Mariner-9 O3 was reported byTraub et al. (1979). Mapping of this emission was reported by Krasnopolsky &Bjoracker (2000). Krasnopolsky (1997) argues that the O2 emission provides evenbetter insight to photochemistry than ozone, since it is more sensitive to the variationsof the water vapour saturation level (10-35 km) than total ozone, which remainsalmost constant.
The band intensity observed by different authors from the ground varies from1.5 MR to 26 MR; the limb intensity should be greater by a factor of 25 if the dayglowlayer is above dust. If, however, the dayglow and dust are uniformly mixed, this factoris approximately 3. A reasonable compromise of these factors is a mean value of ~10.Therefore, if pointed to a sunlit limb together with SUV, SIR could observe theO2 (1∆g) band intensity of 15-260 MR in a 30 km-thick layer at the limb. This heightcorresponds roughly to the FOV of the IR spectrometer, and the predicted S/N will bebetter than 20 in a single spectral bin, or 200-300 for the entire band.
22

scientific instruments
Several measurements provided by SPICAM are unique, including:
— ozone measurements are not included on any flying or planned mission. Thevertical distribution of ozone will be measured during stellar occultations. H2O2will possibly be detected.
— the density/temperature profiles will provide important constraints for buildingmeteorological and dynamical atmospheric models, from the surface to theexosphere. TES/MGS overlaps up to 80 km altitude, but SPICAM will be theonly way to access up to 160 km, the region used for aerocapture and aero-braking. Stellar occultations provide a unique opportunity for detecting clouds onthe night side and for measuring O2.
— the remote sensing of the ionosphere from natural emissions is not included inany other planned mission. The measurements of D/H from UV limb emissionswill verify if this ratio is constant or if it varies according to condensation/evaporation processes (as around the terrestrial tropopause).
— after the loss of the Pressure Modulation IR Radiometer on the Mars ClimateOrbiter, the only instrument to provide water-vapour vertical profiling will beSPICAM (via solar occultations).
It is already clear that, as on Earth, the atmosphere of Mars has a strong interannualvariability. Atmospheric studies must be pursued at every opportunity. It is alsoessential that a variety of techniques be employed: SPICAM applies the mostsuccessful methods from terrestrial studies: backscatter UV spectroscopy andsolar/stellar occultation limb sounding.
AcknowledgementsThe authors wish to thank M. Richardson, T. Schofield and V. Krasnopolsky foruseful discussions. CNES and the Belgian government are financing SPICAM.
Atreya, S.K. & Z.G. Gu (1994). Stability of the Martian Atmosphere: Is Hetero-geneous Catalysis Essential? J. Geophys. Res. 99, E6, 13,133-13,145
Barth, C.A. & C.W. Hord (1971). Mariner Ultraviolet Spectrometer: Topography andPolar Cap. Science 173, 197-201.
Barth, C.A., C.W. Hord, A.I. Stewart, A.L. Lane, M.L. Duck & G.P. Anderson(1973). Mariner 9 Ultraviolet Spectrometer Experiment: Seasonal Variation ofOzone on Mars. Science 179, 795-796.
Barth, C.A., C.W. Hord, J.B. Pearce, K.K. Kelly, G.P. Anderson & A.I. Stewart(1971). Mariner 6 and 7 Ultraviolet Spectrometer Experiment: Upper AtmosphereData. J. Geophys. Res. 76, 2213-2227.
Barth, C.A., A.I.F. Stewart, S.W. Bougher, D.M. Hunten, S.J. Bauer & A.F. Nagy(1992). Aeronomy of the Current Martian Atmosphere. In Mars (Eds. Kieffer etal.), Univ. of Arizona Press, Arizona, USA, pp1054-1089.
Bertaux, J.L., J.E. Blamont, V.M. Lépine, V.G. Kurt, N.N. Romanova & A.S. Smir-nov (1981). Venera 11 and Venera 12 Observations of EUV Emissions from theUpper Atmosphere of Venus. Planet. Space Sci. 29, 149-166.
Bertaux, J.L., D. Fonteyn, O. Korablev, E. Chassefière, E. Dimarellis, J.P. Dubois,A. Hauchecorne, M. Cabane, P. Ranou, A.C. Levasseur-Regourd, G. Cernogora,E. Quemerais, C. Hermans, G. Kockarts, C. Lippens, M. De Maziere, D. Moreau,C. Muller, E. Neefs, P.C. Simon, F. Forget, F. Hourdin, O. Talagrand, V.I. Moroz,A. Rodin, B. Sandel & A. Stern (2000). The Study of the Martian Atmospherefrom Top to Bottom with SPICAM Light on Mars Express. Planet. Space Sci. 48,1303-1320.
Bertaux, J.L. & F. Montmessin (2001). Isotopic Fractionation through Water Vapor
23
References
5. Conclusion

SP-1240
Condensation: the Deuteropause, a Cold Trap for Deuterium in the Atmosphere ofMars. J. Geophys. Res. Planets 106, E 12, 32879-32884.
Blamont, J.E. & E. Chassefière (1993). First Detection of Ozone in the MiddleAtmosphere of Mars from Solar Occultation Measurements. Icarus 104, 324-336.
Blamont, J.E., E. Chassefière, J.P. Goutail, B. Mege, M. Nunes-Pinharanda, G. Sou-shon, V.A. Krasnopolsky, A.A. Krysko & V.I. Moroz (1989). Vertical Structure ofDust and Ozone in the Martian Atmosphere Deduced from Solar OccultationMeasurements. Nature 341, 600-603.
Bougher, S.W., C.G. Fesen, E.C. Ridley & R.W. Zurek (1993). Mars Mesosphere andThermosphere Coupling – Semidiurnal Tides. J. Geophys. Res. 98, 3281-3295.
Bougher, S.W., R.G. Roble, E.C. Ridley & R.E. Dickinson (1990). The Mars Thermo-sphere. II. General Circulation with Coupled Dynamics and Composition.J. Geophys. Res. 95, 14811-14827.
Carr, M. (1996). Water on Mars, Oxford Univ. Press, Oxford, UK. Chassefière, E., J.E. Blamont, V.A. Krasnopolsky, O.I. Korablev, S.K. Atreya &
R.A. West (1992). Vertical Structure and Size Distributions of Martian Aerosolsfrom Solar Occultation Measurements. Icarus 97, 46-69.
Cheng, B.M., E.P. Chew, Ching-Ping Liu, M. Bahou, Yuan-Pern Lee, Yuk L. Yung &M.F. Gerstell (1999). Photo-Induced Fractionation of Water Isotopomers in theMartian Atmosphere. Geophys. Res. Lett. 26, 3657-3660.
Clancy, R.T., D.O. Muhleman & G.L. Berge (1990). Global Changes in the 0-70 kmThermal Structure of the Mars Atmosphere derived from 1975 to 1989 MicrowaveCO Spectra. J. Geophys. Res. 95, 14543-14554.
Clancy, R.T., A.W. Grossman, M.J. Wolff, P.B. James, D.J. Rudy, Y.N. Billawala,B.J. Sandor, S.W. Lee & D.O. Muhleman (1996). Water Vapor Saturation at LowAltitudes around Mars Aphelion: A Key to Mars Climate? Icarus 122, 36-62.
Conrath, B.J., J.C. Pearl, M.D. Smith & P.R. Christensen (1998). MGS TES Results:Characterization of the Martian Atmospheric Thermal Structure. DPS meeting #30,#11.P06
Conrath, B.J., J.C. Pearl, M.D. Smith & P.R. Christensen (1999). Mars GlobalSurveyor TES Results: Atmospheric Thermal Structure Retrieved from LimbMeasurements. DPS meeting #31, #49.08.
Farmer, C.B. & D.D. LaPorte (1972). The Detection and Mapping of Water Vapor inthe Martian Atmosphere. Icarus 16, 34-46.
Forget, F., F. Hourdin & O. Talagrand (1996). Simulation of the Martian AtmosphericPolar Warming with the LMD General Circulation Model. Ann. Geophys. 14,C797.
Fox, G.K., A.D. Code, C.M. Anderson, B.L. Babler, K.S. Bjorkman (1997). SolarSystem Observations by the Wisconsin Ultraviolet Photopolarimeter Experiment.I. The First Ultraviolet Linear Spectroscopy of Mars. Astron. J. 113, 1152-1157.
Glenar, D.A., J.J. Hillman, B. Saiff & J. Bergstralh (1994). Acouto-optic ImagingSpectropolarimery for Remote Sensing. Appl. Opt. 33, 31, 7412-7424.
Hapke, B. (1981). Bidirectional Reflectance Spectroscopy. I. Theory. J. Geophys.Res. 86, 3039-3054.
Hechler, M & A. Yanes (1999). Mars Express Mission Analysis: the Orbits aroundG3-A and G3-B. MAS working paper #413. ESOC, Darmstadt.
Hinson, D.P., R.A. Simpson, J.D. Twicken, G.L. Tyler & F.M. Flasar (1999). InitialResults from Radio Occultation Measurements from Mars Global Surveyor.J. Geophys. Res. 104, E11, 26997-27012.
Ip, W.H. (1988). On a Hot Oxygen Corona of Mars. Icarus 76, 135-145.Jakosky, B.M., R.O. Pepin, R.E. Johnson & J.L. Fox (1994). Mars Atmospheric Loss
and Isotopic Fractionation by Solar-wind-induced Sputtering and PhotochemicalEscape. Icarus 111, 271-288.
Kass, D.M. & Y.L. Yung (1995). Loss of Atmosphere from Mars due to Solar Wind-induced Sputtering. Science 268, 697-699.
Keating, G.M., S.W. Bougher, R.W. Zurek, R.H. Tolson, G.J. Cancro, S.N. Noll,
24

scientific instruments
J.S. Parker, T.J. Schellenberg, R.W. Shane, B.L. Wilkerson, J.R. Murphy,J.L. Hollingsworth, R.M. Haberle, M. Joshi, J.C. Pearl, B.J. Conrath, M.D. Smith,R.T. Clancy, R.C. Blanchard, R.G. Wilmoth, D.F. Rault, T.Z. Martin, D.T. Lyons,P.B. Esposito, M.D. Johnston, C.W. Whetzel, C.G. Justus & J.M. Babicke (1998).The Structure of the Upper Atmosphere of Mars: In situ AccelerometerMeasurements from Mars Global Surveyor. Science 279, 1672.
Korablev, O.I., J.L. Bertaux & J.P Dubois (2001). Occultation of Stars in the UV:Study of the Atmosphere of Mars. J. Geophys. Res. 106, 7597-7610.
Korablev, O.I., V.A. Krasnopolsky, A.V. Rodin & E. Chassefière (1993). VerticalStructure of Martian Dust Measured by the Solar Occultation from PhobosSpacecraft. Icarus 102, 76-87.
Krasnopolsky, V.A. (1993). Photochemistry of the Martian Atmosphere (MeanConditions). Icarus 101, 313-332.
Krasnopolsky, V.A. (1997). Photochemical Mapping of Mars. J. Geophys. Res.(Planets) 102,13,313-13,320.
Krasnopolsky, V.A. & G.L. Bjoracker (2000). Mapping of Mars O2(1∆) Emission. AGU
2000 Spring meeting, Washington DC, USA.Krasnopolsky, V.A., O.I. Korablev, V.I. Moroz, A.A. Krysko, J.E. Blamont &
E. Chassefière (1991). Infrared Solar Occultation Sounding of the MartianAtmosphere by the Phobos Spacecraft. Icarus 94, 32-44.
Krasnopolsky, V.A., V.I. Moroz, A.A. Krysko, O.I. Korablev, V.S. Zhegulev,A.V. Grigoriev, A.Yu. Tkachuk, V.A. Parshev, J.E. Blamont & J.-P. Goutail (1989).Phobos-2: Solar Occultation Spectroscopic Measurements of the MartianAtmosphere at 1.9 and 3.7 µm. Nature 341, 603-604.
Krasnopolsky, V.A., M.J. Mumma & G.R. Gladstone (1998). Detection of AtomicDeuterium in the Upper Atmosphere of Mars. Science 280, 1576-1580.
Lee, P., S. Ebisawa & A. Dollfus (1990). Crystal Clouds in the Martian Atmosphere.Astron. Astroph. 240, 2, 520-532.
Lellouch, E., G. Paubert & T. Encrenaz (1991). Mapping of CO Millimeter Wave Linesin Mars’Atmosphere: The Spatial Variability of Carbon Monoxide on Mars. Planet.Space Sci. 39, 219-224.
Luhmann, J.G., R.E. Johnson & M.H.G. Zhang (1992). Evolutionary Impact ofSputtering of the Martian Atmosphere by O+ Pickup Ions. Geophys. Res. Lett. 19,2151-2154.
Magalhaes, J.A., J.T. Schofield & A. Seiff (1999). Results of the Mars PathfinderAtmospheric Structure Investigation. J. Geophys. Res. 104, 8943-8955.
Maguire, W.C. (1977). Martian Isotopic Ratios and Upper Limits for Possible MinorConstituents as Derived from Mariner 9 Infrared Spectrometer Data. Icarus 32, 85-97.
McElroy, M.B. (1972). Mars: An Evolving Atmosphere. Science 175, 443-445.McElroy, M.B. & T.M. Donahue (1972). Stability of the Martian Atmosphere. Science
177, 986.Moreau, D., A. Marten & Y. Biraud (1998). Meridional and Seasonal Distributions of
Trace Gases in the Lower and Middle Atmosphere of Mars. Lunar and PlanetaryScience Conference, 1998, Houston, TX, USA, Abstract #1369.
Nair, H., M. Allen, A.D. Anbar & Y.L. Yung (1994). A Photochemical Model of theMartian Atmosphere. Icarus 111, 124-150.
Noxon, J.F., W.A. Traub, N.P. Carleton & P. Connes (1976). Detection of O2 AirglowEmission from Mars and the Martian Ozone Abundance. Astrophys. J. 207, 1025-1035.
Owen, T., J.P. Maillard, C. de Bergh & B.L. Lutz (1988). Deuterium on Mars: TheAbundance of HDO and the Value of H/D. Science 240, 1767-1170.
Parkinson, T.D. & D.M. Hunten (1972). Spectroscopy and Aeronomy of O2 on Mars.J. Atm. Sci. 29, 1390.
Pearl, J.C., M.D. Smith, B.J. Conrath, J.L. Bandfield & P.R. Christensen (1999). MarsGlobal Surveyor TES Results: Observations of Water Ice Clouds. DPS meeting #31,#76.08.
25

SP-1240
Rodin, A.V., R.T. Clancy, R.J. Wilson (1999). Dynamical Properties of Mars WaterIce Clouds and their Interactions with Atmospheric Dust and Radiation. Adv. SpaceRes. 23, 1577-1585.
Rodin, A.V., O.I. Korablev & V.I. Moroz (1997). Vertical Distribution of Water inNear-equatorial Troposphere of Mars: Water Vapor and Clouds. Icarus 125, 21-29.
Roscoe, H.K., R.A. Freshwater, R. Wolfenden, R.L. Jones, D.J. Fish, J.E. Harries &D.J. Oldham (1994). Using Stars for Remote Sensing of the Earth’s Stratosphere.Appl. Optics. 33, 7126-7131.
Rosenqvist, J., P. Drossart, M. Combes, T. Encrenaz, E. Lellouch, J.P. Bibring,S. Erard, Y. Langevin & E. Chassefière (1992). Minor Constituents in the MartianAtmosphere from the ISM/Phobos Experiment. Icarus 98, 254-270.
Santer, R., M. Deschamps, L.V. Ksanfomaliti & A. Dollfus (1985). PhotopolarimetricAnalysis of the Martian Atmosphere by the Soviet MARS-5 Orbiter. I: WhiteClouds and Dust Veils. Astron. Astroph. 150, 2, 217-228.
Seif, A. & D.B. Kirk (1977). Structure of the Atmosphere of Mars in Summer at Mid-latitudes. J. Geophys. Res. 82, 4364-4378.
Smith, G.R. & D.M. Hunten (1990). Study of Planetary Atmospheres by AbsorptiveOccultations. Rev. Geophys. 28, 117.
Smith, M.D., J.C. Pearl, B.J. Conrath & P.R. Christensen (1999). Mars GlobalSurveyor TES Results: Observations of Atmospheric Dust during Mapping. DPSmeeting #31, #48.06.
Stewart, A.I. (1972). Mariner 6 and 7 Ultraviolet Spectrometer Experiment:Implication of CO2
+, CO and O Airglow. J. Geophys. Res. 77, 54-68. Stewart, A.I., C.A. Barth & C.W. Hord (1972). Mariner 9 Ultraviolet Spectrometer
Experiment: Structure of Mars’ Upper Atmosphere. Icarus 17, 469-474.Stoker, C.R. & M.A. Bullock (1997). Organic Degradation under Simulated Martian
Conditions. J. Geophys. Res. 102, 10881-10888. Traub, W.A, N.P. Carleton, P. Connes & J.F. Noxon (1979). The Latitude Variation of
O2 Airglow and O3 Abundance on Mars. Astrophys. J. 229, 846-850.Wehrbein, W.M., C.W. Hord & C.A. Barth (1979). Mariner 9 UV Spectrometer
Experiment: Vertical Distribution of Ozone on Mars. Icarus 38, 288-299.Wilson, R.J. (1997). A General Circulation Model Simulation of the Mars Polar
Warming. Geophys. Res. Lett. 24, 123-126. Yung, Y.L & W.D. DeMore (1999). Photochemistry of Planetary Atmospheres,
Oxford Univ. Press., UK, p.34.
26


