Spend Analysis - Process, Methodology
23
Strategic Sourcing Webinar Series Spend Analysis – There’s always money to save! Mar 14, 2015 Copyright © 2015 BCube Global Solutions All Rights Reserved
-
Upload
ram-raghuraman -
Category
Documents
-
view
105 -
download
2
Transcript of Spend Analysis - Process, Methodology

Strategic Sourcing Webinar Series Spend Analysis – There’s always money to save!
Mar 14, 2015
Copyright © 2015 BCube Global Solutions All Rights Reserved
Agenda for Today
introductionThe presenter, Spend Analysis1
Types of spend, data & categoriesData sources, categories & sub-
categories2Spend analysis – the processSteps involved in performing a comprehensive
analysis3Common types of analysis
Possible templates – limitless opportunities4
Tools and technologyIntroduction, tools, challenges5
Summary, Question & Answer sessionType in your questions or raise your hand.6
Introduction
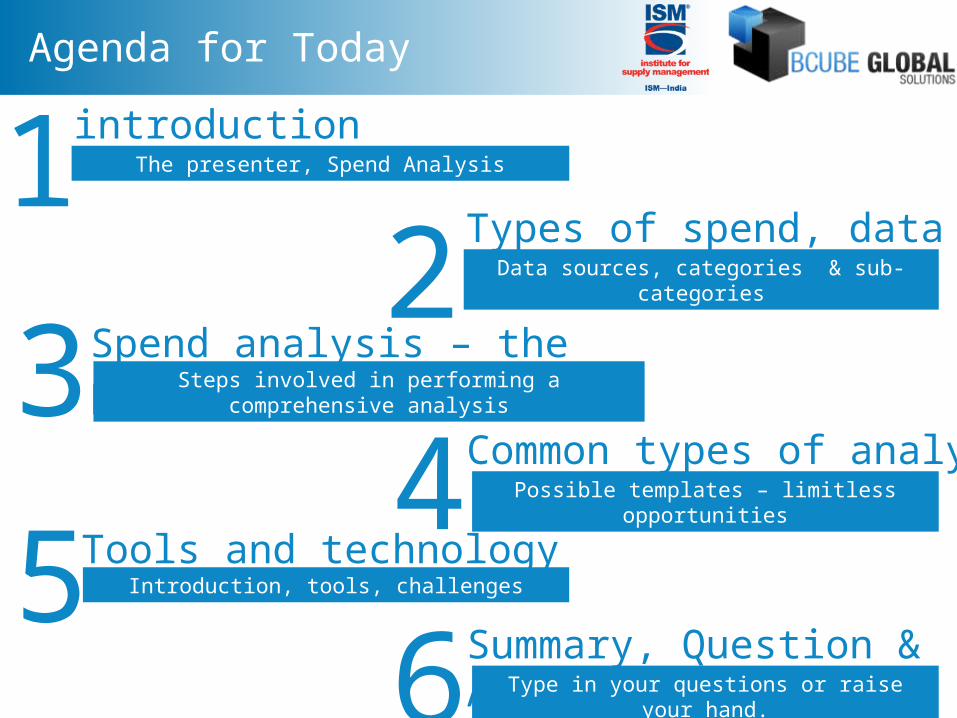
Ram Raghuraman is a skilled Supply Chain professional with an MBA degree from the reputed Purdue University, USA. He has worked at Terex Corporation (Forbes 500), a $ 10 Billion global manufacturer of earth moving equipment, Frost & Sullivan, USA and has extensive global experience executing projects successfully.
Achievements
Managed over $ 100M of Global Spend across multiple categories spread across Europe and North AmericaDeployed Global 3PL network involving 50 + plants/suppliers in Asia, NA & EuropeImplemented lean manufacturing system at a plant that saved $48 millionTrained peers on ERP implementation, lean manufacturingConducted seminars on Negotiation and Leadership within Terex CorpCPSM Certified (held by less than 1% Supply Chain professionals)
Learning
Leadership
Director, ISM India – Chennai Chapter. The Institute of Supply Management is the premier institution in the world for Sourcing and Procurement Professionals.

Spend Analysis – The Basics
Copyright © 2015 BCube Global Solutions All Rights Reserved
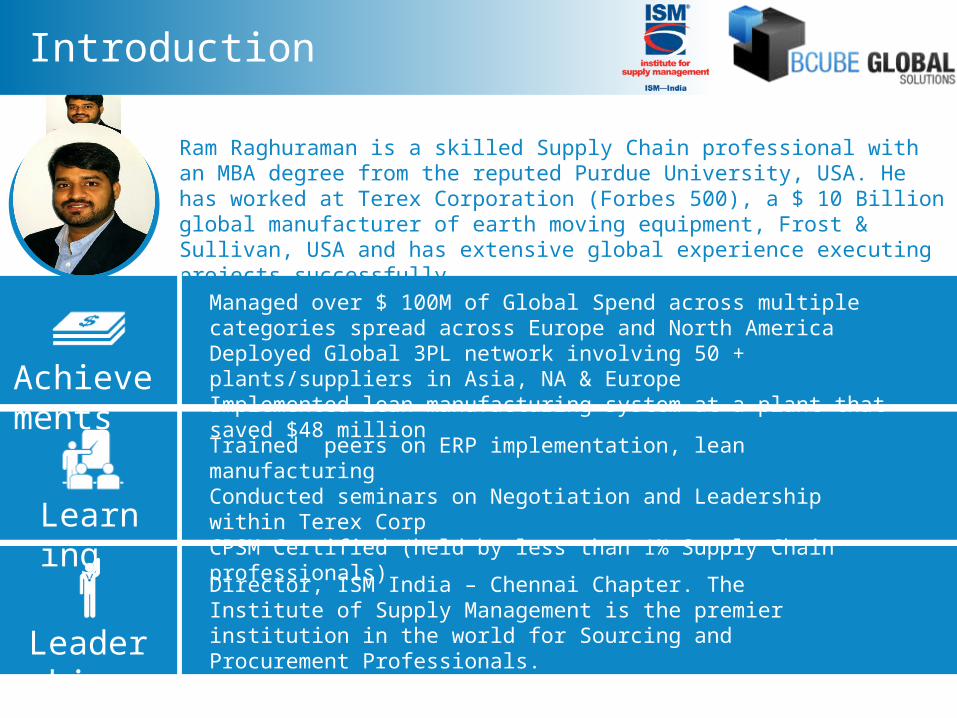
DIRECT SPEND (MATERIAL)
Spend on Goods and Materials that directly influence the product/service that the company is selling. Easier to find and classify!
Commodities Parts and Sub-assemblies ……
Types of spendINDIRECT SPEND (ENABLING SPEND)
Spend on Goods and Services that enable its primary activity
Travel IT MRO & Utilities Capital Goods and Consumables…..
TAIL-SPEND
The bottom 10% of your Indirect spend is known as Tail-Spend
One-off purchases that fall below a certain threshold (say $10,000)
Purchasing done at the plant level by other departments
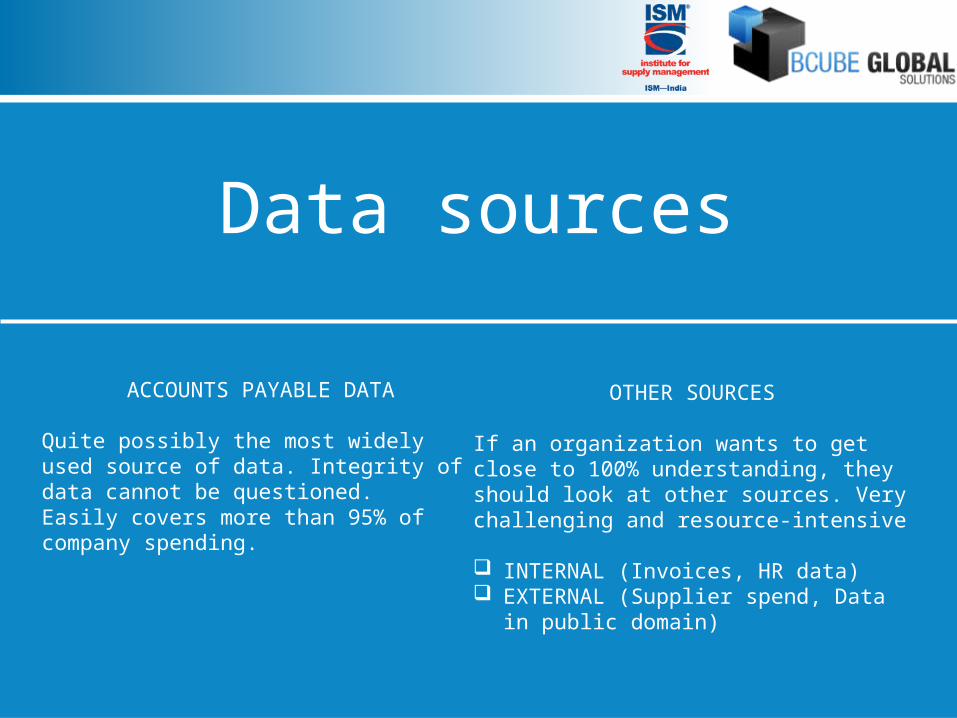
ACCOUNTS PAYABLE DATA
Quite possibly the most widely used source of data. Integrity of data cannot be questioned.Easily covers more than 95% of company spending.
Data sources
OTHER SOURCES
If an organization wants to get close to 100% understanding, they should look at other sources. Very challenging and resource-intensive
INTERNAL (Invoices, HR data) EXTERNAL (Supplier spend, Data in
public domain)
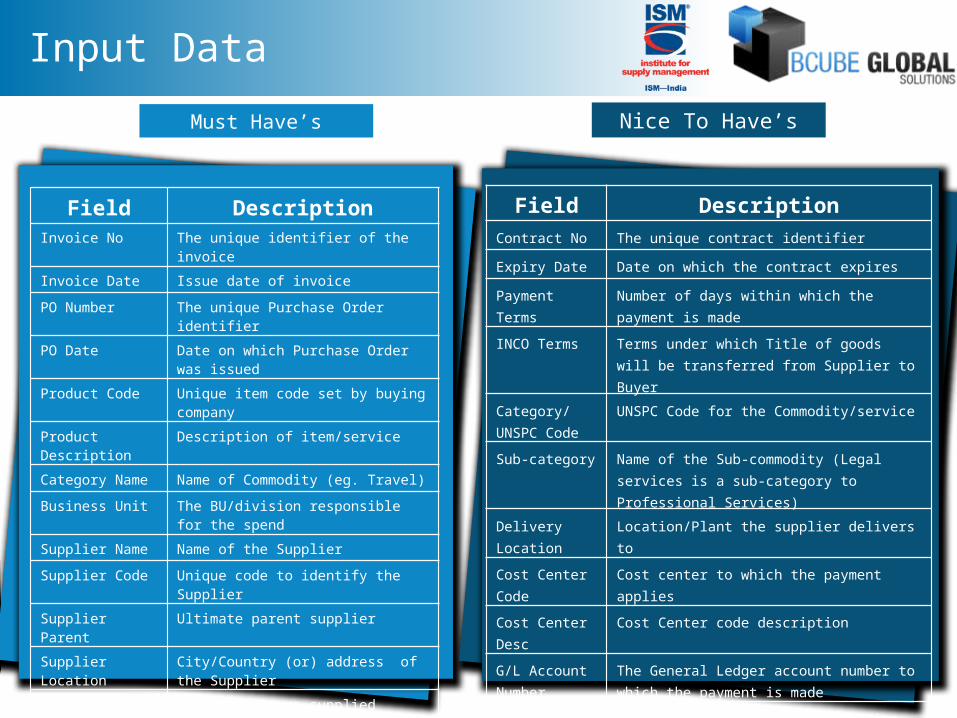
Input Data
Must Have’s Nice To Have’s
Field DescriptionInvoice No The unique identifier of the invoice
Invoice Date Issue date of invoice
PO Number The unique Purchase Order identifier
PO Date Date on which Purchase Order was issued
Product Code Unique item code set by buying company
Product Description
Description of item/service
Category Name Name of Commodity (eg. Travel)
Business Unit The BU/division responsible for the spend
Supplier Name Name of the Supplier
Supplier Code Unique code to identify the Supplier
Supplier Parent Ultimate parent supplier
Supplier Location
City/Country (or) address of the Supplier
Purchased Quantity
Number of items supplied
Unit of Measure Unit by which supplied items are measured
Unit Price Price associated with the Unit of Measure
Currency Currency with which the invoice is made
Invoice Amount Amount listed as due on the invoice
Field DescriptionContract No The unique contract identifier
Expiry Date Date on which the contract expires
Payment Terms Number of days within which the payment is made
INCO Terms Terms under which Title of goods will be transferred from Supplier to Buyer
Category/UNSPC Code
UNSPC Code for the Commodity/service
Sub-category Name of the Sub-commodity (Legal services is a sub-category to Professional Services)
Delivery Location Location/Plant the supplier delivers to
Cost Center Code Cost center to which the payment applies
Cost Center Desc Cost Center code description
G/L Account Number
The General Ledger account number to which the payment is made
G/L Account Description
General Ledger account description
Payment Date Date on which the invoice payment was made
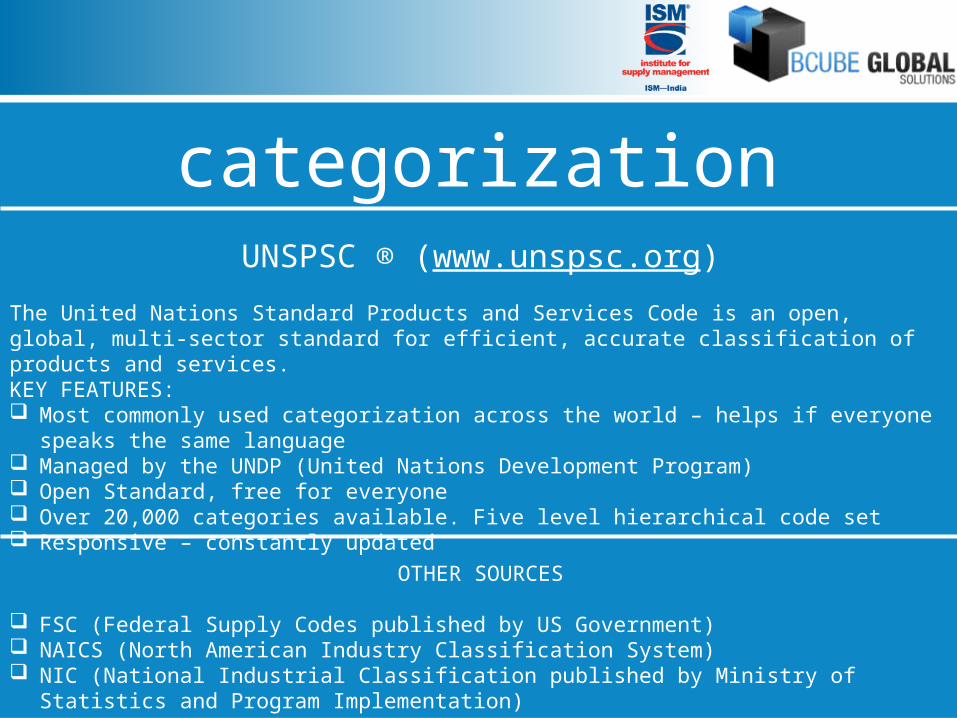
UNSPSC ® (www.unspsc.org)
The United Nations Standard Products and Services Code is an open, global, multi-sector standard for efficient, accurate classification of products and services.KEY FEATURES: Most commonly used categorization across the world – helps if everyone speaks the
same language Managed by the UNDP (United Nations Development Program) Open Standard, free for everyone Over 20,000 categories available. Five level hierarchical code set Responsive – constantly updated
categorization
OTHER SOURCES
FSC (Federal Supply Codes published by US Government) NAICS (North American Industry Classification System) NIC (National Industrial Classification published by Ministry of Statistics and Program
Implementation)
Spend Analysis – The Process
Copyright © 2015 BCube Global Solutions All Rights Reserved
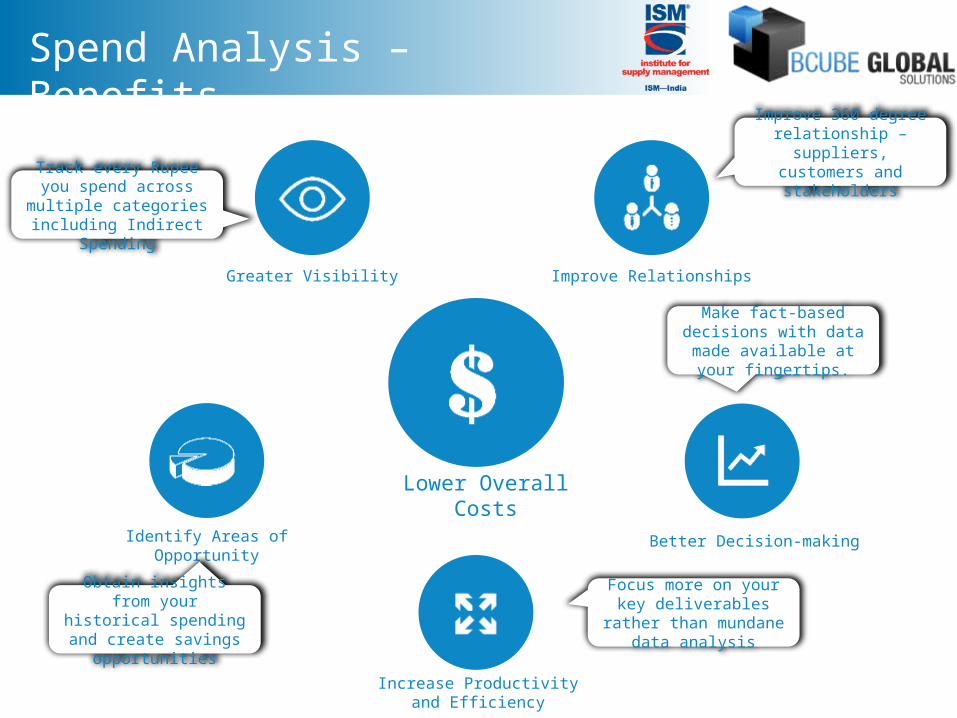
Spend Analysis – Benefits
Lower Overall Costs
Identify Areas of Opportunity
Increase Productivity and Efficiency
Better Decision-making
Greater Visibility Improve Relationships
Track every Rupee you spend across multiple categories including
Indirect Spending
Obtain insights from your historical
spending and create savings opportunities
Focus more on your key deliverables rather
than mundane data analysis
Make fact-based decisions with data
made available at your fingertips.
Improve 360 degree relationship –
suppliers, customers and stakeholders

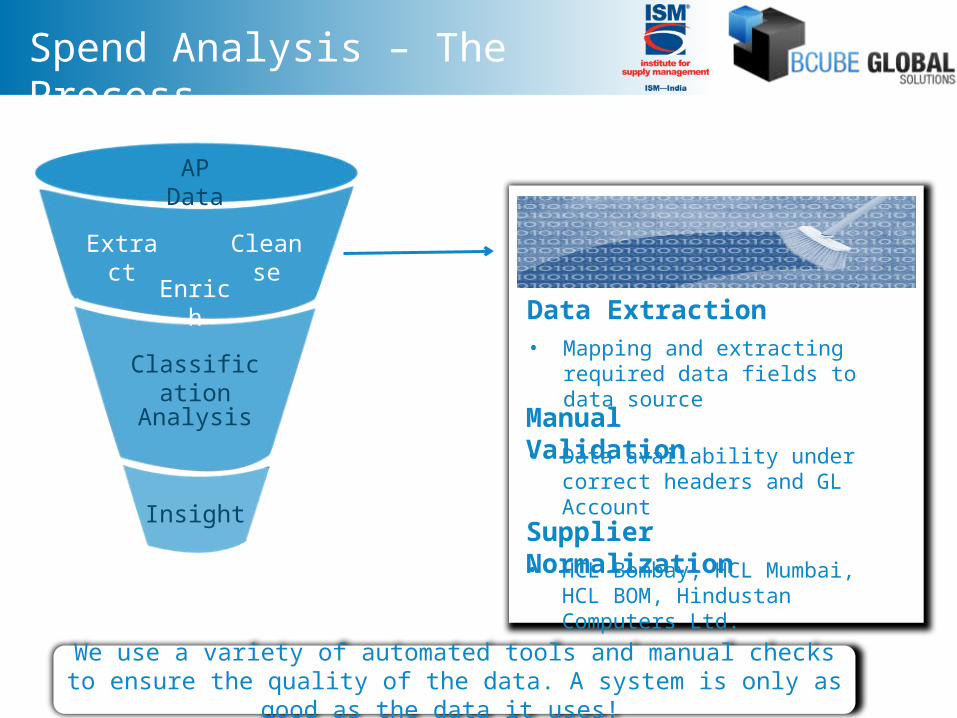
Spend Analysis – The Process
AP Data
AP Data
Extract
Cleanse
Enrich
Classification
Analysis
Insight
Automate the input from your ERP system into our flexible solution.
Custom Web Interface
CSV Format Data
Spend Analysis – The Process
AP Data
AP Data
Extract
Cleanse
Enrich
Classification
Analysis
Insight
We use a variety of automated tools and manual checks to ensure the quality of the data. A system is only as good as the
data it uses!
Data Extraction• Mapping and extracting
required data fields to data source
Manual Validation• Data availability under correct
headers and GL Account
Supplier Normalization• HCL Bombay, HCL Mumbai,
HCL BOM, Hindustan Computers Ltd.
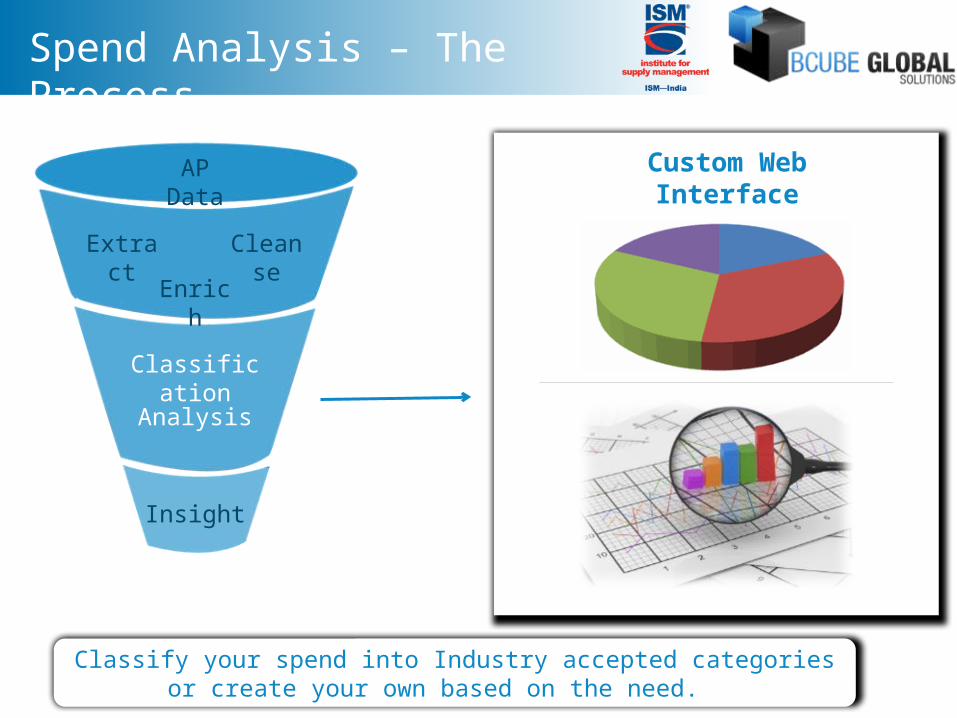
Spend Analysis – The Process
AP Data
AP Data
Extract
Cleanse
Enrich
Classification
Analysis
Insight
Classify your spend into Industry accepted categories or create your own based on the need.
Custom Web Interface
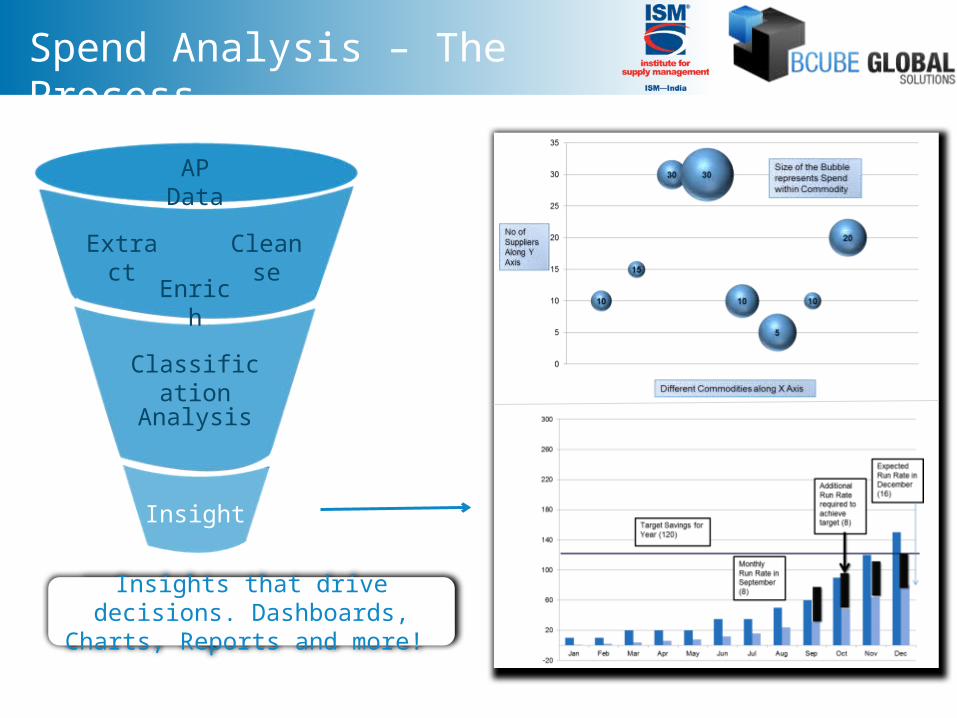
Spend Analysis – The Process
AP Data
AP Data
Extract
Cleanse
Enrich
Classification
Analysis
Insight
Insights that drive decisions. Dashboards, Charts, Reports
and more!

Spend Analysis – Templates
Copyright © 2015 BCube Global Solutions All Rights Reserved
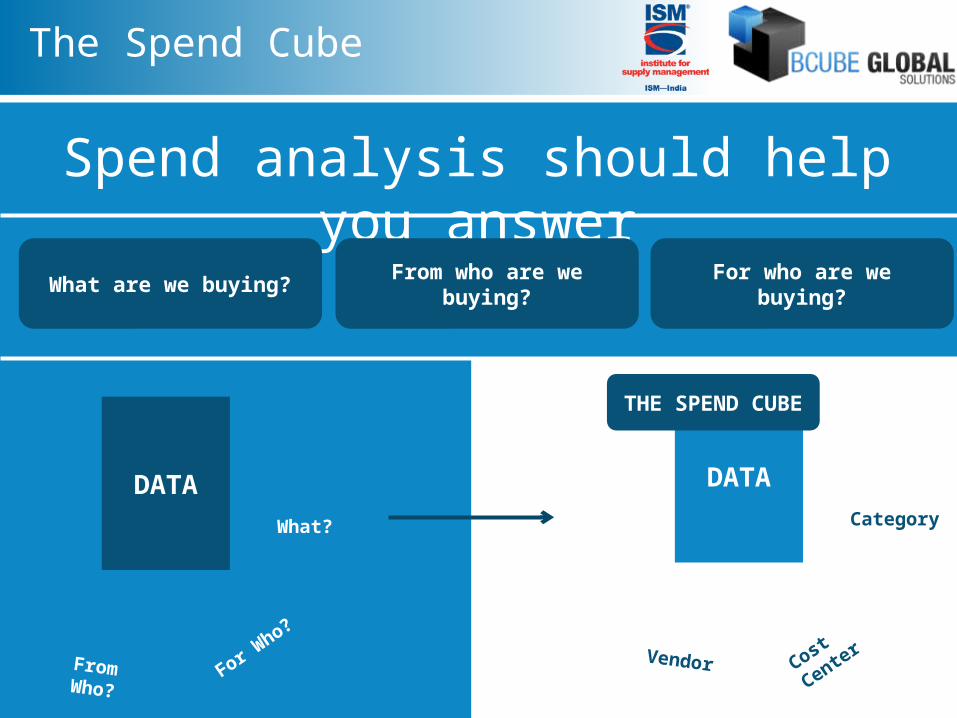
Spend analysis should help you answer
The Spend Cube
What are we buying?From who are we
buying?For who are we
buying?
DATA
From Who?
For
Who?
What?
DATA
Vendor Cost
Center
Category
THE SPEND CUBE
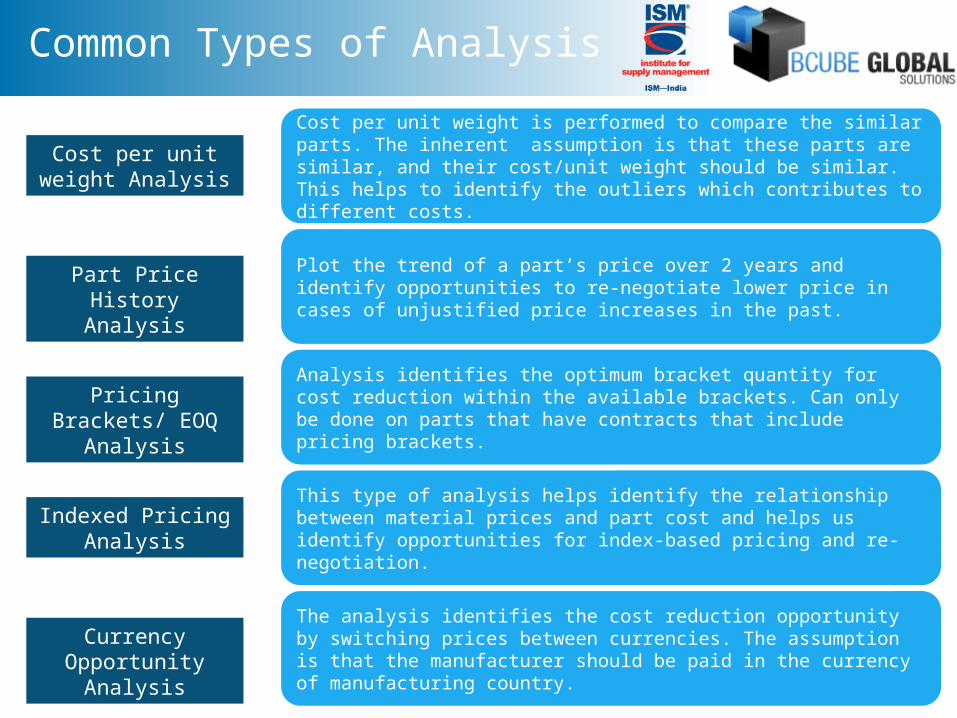
Common Types of Analysis
Cost per unit weight Analysis
Cost per unit weight is performed to compare the similar parts. The inherent assumption is that these parts are similar, and their cost/unit weight should be similar. This helps to identify the outliers which contributes to different costs.
Part Price History Analysis
Plot the trend of a part’s price over 2 years and identify opportunities to re-negotiate lower price in cases of unjustified price increases in the past.
Pricing Brackets/ EOQ Analysis
Analysis identifies the optimum bracket quantity for cost reduction within the available brackets. Can only be done on parts that have contracts that include pricing brackets.
Indexed Pricing Analysis
This type of analysis helps identify the relationship between material prices and part cost and helps us identify opportunities for index-based pricing and re-negotiation.
Currency Opportunity
Analysis
The analysis identifies the cost reduction opportunity by switching prices between currencies. The assumption is that the manufacturer should be paid in the currency of manufacturing country.
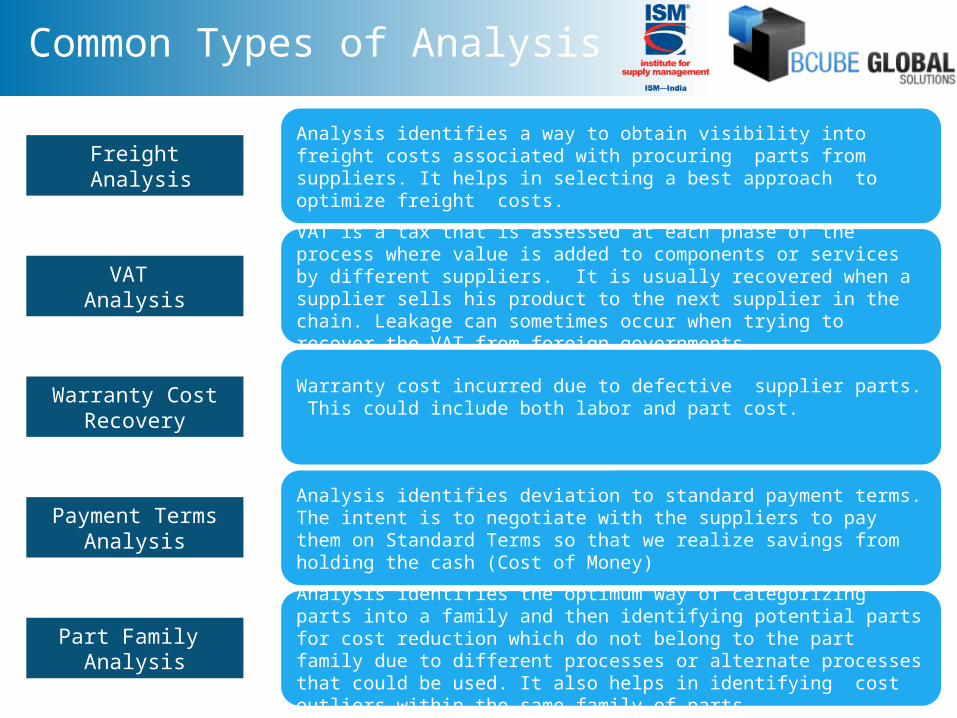
Common Types of Analysis
Freight Analysis
Analysis identifies a way to obtain visibility into freight costs associated with procuring parts from suppliers. It helps in selecting a best approach to optimize freight costs.
VAT Analysis
VAT is a tax that is assessed at each phase of the process where value is added to components or services by different suppliers. It is usually recovered when a supplier sells his product to the next supplier in the chain. Leakage can sometimes occur when trying to recover the VAT from foreign governments.
Warranty Cost Recovery
Warranty cost incurred due to defective supplier parts. This could include both labor and part cost.
Payment TermsAnalysis
Analysis identifies deviation to standard payment terms. The intent is to negotiate with the suppliers to pay them on Standard Terms so that we realize savings from holding the cash (Cost of Money)
Part Family Analysis
Analysis identifies the optimum way of categorizing parts into a family and then identifying potential parts for cost reduction which do not belong to the part family due to different processes or alternate processes that could be used. It also helps in identifying cost outliers within the same family of parts
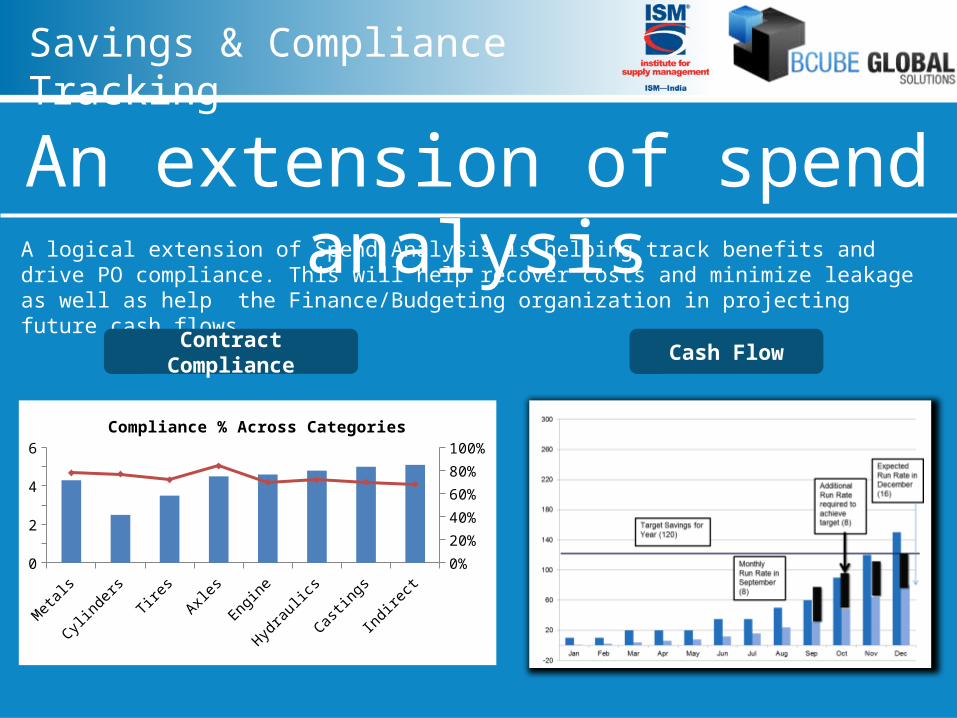
A logical extension of Spend Analysis is helping track benefits and drive PO compliance. This will help recover costs and minimize leakage as well as help the Finance/Budgeting organization in projecting future cash flows
An extension of spend analysis
Savings & Compliance Tracking
Cash Flow
Met
als
Cylin
ders
Tire
s
Axles
Engin
e
Hydra
ulics
Castin
gs
Indire
ct0123456
0%
20%
40%
60%
80%
100%
Compliance % Across Categories
Contract Compliance
Spend Analysis – Tools
Copyright © 2015 BCube Global Solutions All Rights Reserved
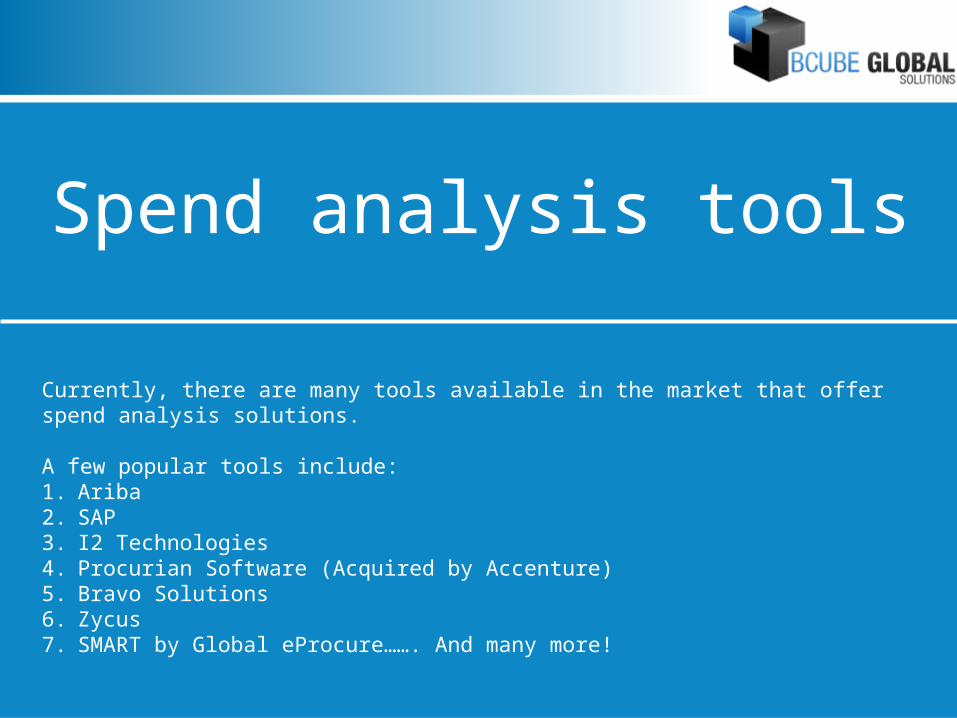
Currently, there are many tools available in the market that offer spend analysis solutions.
A few popular tools include:1. Ariba2. SAP3. I2 Technologies4. Procurian Software (Acquired by Accenture)5. Bravo Solutions6. Zycus7. SMART by Global eProcure……. And many more!
Spend analysis tools
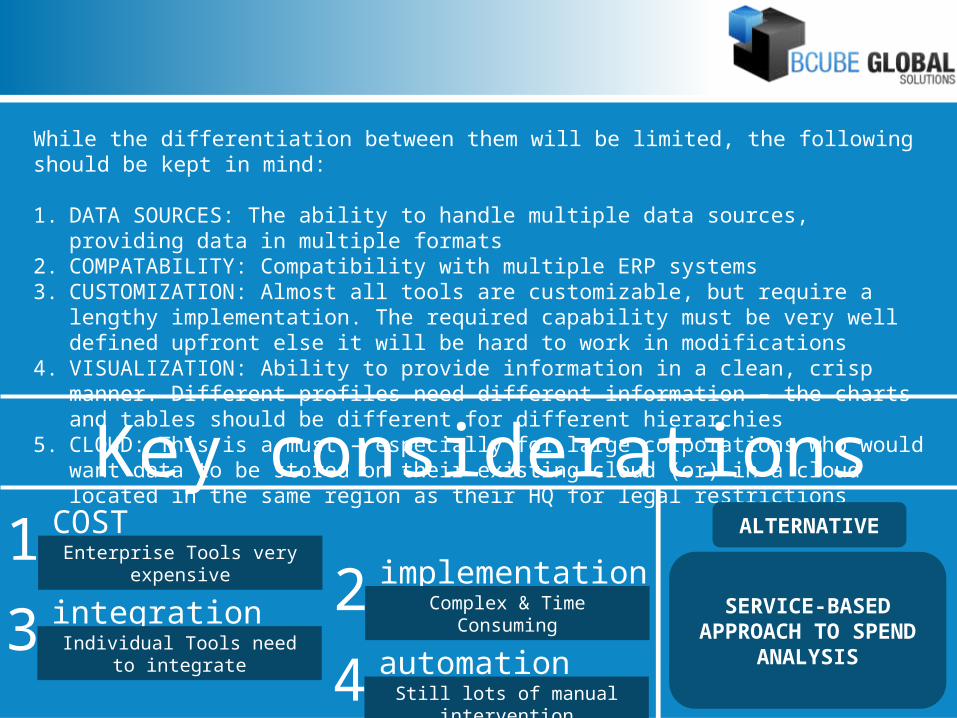
While the differentiation between them will be limited, the following should be kept in mind:
1. DATA SOURCES: The ability to handle multiple data sources, providing data in multiple formats
2. COMPATABILITY: Compatibility with multiple ERP systems3. CUSTOMIZATION: Almost all tools are customizable, but require a lengthy
implementation. The required capability must be very well defined upfront else it will be hard to work in modifications
4. VISUALIZATION: Ability to provide information in a clean, crisp manner. Different profiles need different information – the charts and tables should be different for different hierarchies
5. CLOUD: This is a must – especially for large corporations who would want data to be stored on their existing cloud (or) in a cloud located in the same region as their HQ for legal restrictions
Key considerationsCOST
Enterprise Tools very expensive
1implementationComplex & Time Consuming2integration
Individual Tools need to integrate
3automation
Still lots of manual intervention
4
SERVICE-BASED APPROACH TO
SPEND ANALYSIS
ALTERNATIVE
Thank You!
Copyright © 2015 BCube Global Solutions All Rights Reserved
Ram RaghuramanFounder, BCube Global Solutions
Director, ISM India
Mobile: (91) 95000 17385