SPELLING DRILLS USING A COMPUTER-ASSISTED …rca.ucsd.edu/techreports/IMSSS_112-Spelling Drills...
76
SPELLING DRILLS USING A COMPUTER-ASSISTED INSTRUCTIONAL SYSTEM by Jack M. Knutson TECHNICAL REPORT NO. 112 June 30, 1967 PSYCHOLOGY SERIES Reproduction in Whole or in Part is Permitted for any Purpose of the United States Government INSTITUTE FOR MATHEMATICAL STUDIES IN THE SOCIAL SCIENCES STANFORD UNIVERSITY STANFORD, CALIFORNIA
Transcript of SPELLING DRILLS USING A COMPUTER-ASSISTED …rca.ucsd.edu/techreports/IMSSS_112-Spelling Drills...
SPELLING DRILLS
USING A COMPUTER-ASSISTED INSTRUCTIONAL SYSTEM
by
Jack M. Knutson
TECHNICAL REPORT NO. 112
June 30, 1967
PSYCHOLOGY SERIES
Reproduction in Whole or in Part is Permitted for
any Purpose of the United States Government
INSTITUTE FOR MATHEMATICAL STUDIES IN THE SOCIAL SCIENCES
STANFORD UNIVERSITY
STANFORD, CALIFORNIA


CHAPTER I
INTRODUCTION AND BACKGROUND OF PROBLEM
During the past few years we have seen an ever-increasing number
of books and articles reporting studies in which a digital computer
has been used to control part or all of the selection, sequencing and
evaluation of instructional materials or lessons, and the students'
interactions with these lessons. In general, the term computer
assisted-instruction (CAl) has gained Widespread acceptance as a
label to refer to an instructional procedure which utilizes a computer
in this capacity.
No attempt will be made here to review all of the above-mentioned
literature on CAl, for it ranges widely in terms of specificity of
curriculum materials used, educational development of students involved,
and in the scope of the instructional and learning processes studied.
The interested reader may obtain some sense of the diversity and extent
of this work through perusal of some of the following publications:
Coulson, 1962; Glaser, 1965; Atkinson and Hansen, 1966; Suppes, Hyman,
and Jerman, 1966; Suppes, 1964; Suppes, 1967.
While much of the work cited above has consisted of short-term
laboratory studies, many universities are presently committed to the
study of CAl on a long-term basis and in the context of a more normal
classroom situation. Among these one finds the Universities of Illinois,
Texas, Pennsylvania State, Florida State, California at Santa Barbara
and Irvine, and Stanford.
1
At the latter school, the Institute for Mathematical Studies in
the Social Sciences (IMSSS) has been developing over the last four
years a working CAl system for regular classroom usage, This develop
ment has used two distinc~ approaches, which Suppes (1966) refers to
as "tutorial systems" and "drill and practice systems,"
The tutorial approach to CAl uses the computer in the capacity
of "teacher" to present new materials as well as to control subsequent
student interactions with them, In this capacity an attempt is being
made to teach reading and mathematic.s to primary-grade children in a
school in East Palo Alto, The computer and elaborate terminal equip
ment being used were developed especially for this purpose by IBM and
are located in a separate, new building on the school grounds, A more
complete description of this project may be found in several publica
tions (e,g" Atkinson and Hansen, 1966; Wilson and Atkinson, 1967), The
important distinction is that a "tutorial" CAl system is designed to
approximate or simulate the teacher's normal role and therefore to
assume a principal role in the instructional process for part of' each
school day,
In contrast, drill and practice systems are intended to supplement
the instruction which occurs in the classroom, They are designed to
inrprove--through practice--the skills and concepts which are introduced
by the classroom teacher, At the same time, this more limited objective
makes it possible to use simpler, less expensive equipment,
Beginning i.n the fall of 1965, CAl drill and practice programs
were initiated in two different schools, In both cases a computer at
Stanford was hooked up by telephone lines to control teletypes located
2

in the schools. In one school, fourth, fifth and sixth grade students
received daily drills in arithmetic (Suppes, Jerman, and Groen, 1965).
At the other school, sixth grade children were given daily drills in
spelling. Starting in the fall of 1966 this operation was expanded,
and currently computer-controlled drills are being given to approxL-.
mately 800 students in six schools in five different local communities.
In addition, an elementary school in a remote area of Kentucky has
been linked to the system, and 60 children there are receiving daily
drills in arithmetic. This study made use of the equipment and stu
dents in the school which has been involved in drill and practice in
spelling.
A General Strategy for Research on Drill and Practice in Spelling.
It should be emphasized that the research to be reported here is a
small part of a total on-going investigation of th~ potential use and
value of CAl drill and practice systems. Hence, it would seem wise to
outline briefly the general plan which has been developed to explore
some of the problems in spelling. The strategy, as it has evolved, is
built on the following considerations.
(1) Relevant experimental studies in the area of verbal learning ~Dd
spelling do not, for the most part, provide easily interpretable informa
tion which may be directly applied to the drill and practice routines
in spelling on CAl. For example, given the literally hundreds of
studies which have been done on the effects of massed vs. distributed
practice on verbal learning, it is exceedingly difficult to decide just
which of these findings are applicable when it comes to constructing
optimal drill routines for spelling. Rather, the principal value of
3
the prior research lies in suggesting routines which may then be tested
in this new, applied situation,
(2) Relevant variables affecting the rate of learning in drills--once
identified--should be explored in a systematic manner through a series
of related, short-term studies,
(3) Because of their importance as suggested by earlier pilot studies
and experimentation, the first variables to be investigated will be:
(a) massed and distributed practice on items; (b) session length
as it affects learning; (c) variation in method and portion of stim
ulus presented; (d) overlee.rning and i.ts effect on retention of words,
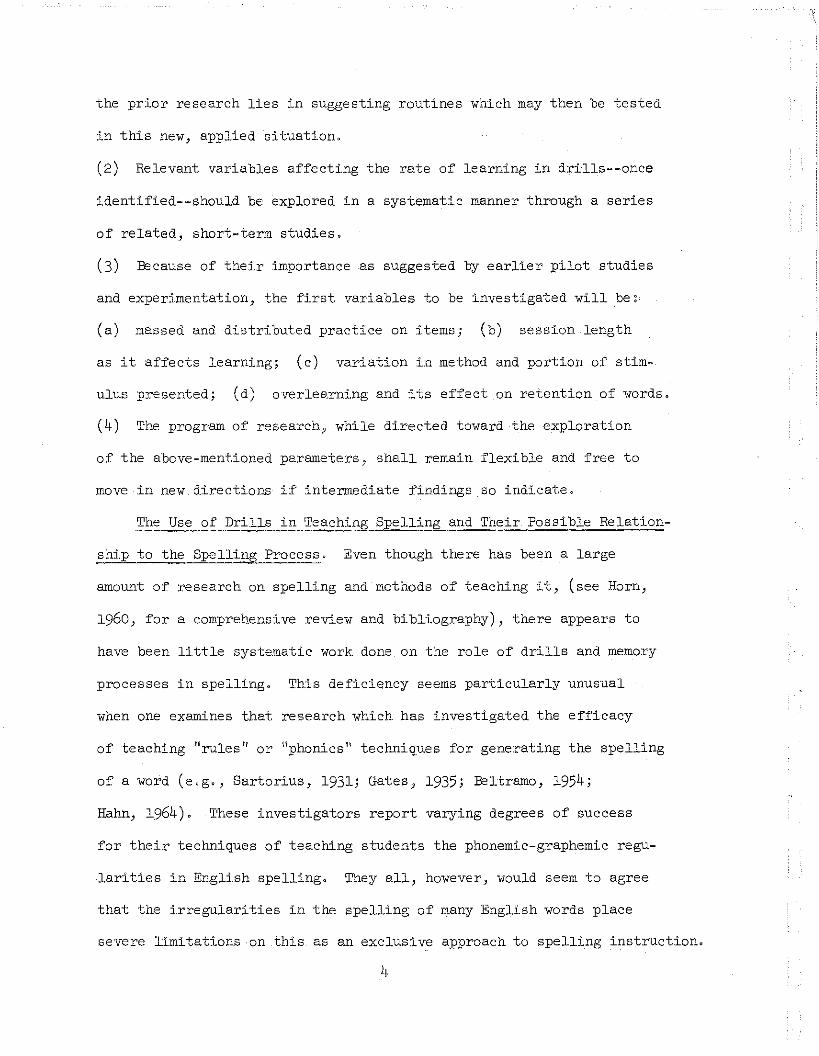
(4) 'The program of research, whi.le directed toward the exploration
of the above-mentioned parameters, shall remain flexible and free to
move in new directions if intermediate findings so indicate,
The Use of Drills in Teaching Spelling and Their Possible Relation
shi.p to the Spelling Process, Even though there has been a large
amount of research on spelling and methods of teaching it, (see Horn,
1960, for a comprehensive review and bibliography), there appears to
have been little syste.matic work done on the role of dri.lls and memory
processes in spelling, This deficiency seems particularly unusual
when one examines that research which has investigated the efficacy
of teaching "rules" or "phonics" techniques for generating the spelling
of a word (e,g" Sartorius, 1931; Gates, 1935; Beltramo, 1954;
Hahn, 1964), These investigators report varying degrees of success
for their techniques of teachi.ng students the phonemic-graphemic regu
larities in English spelling, They all., however, would seem to agree
that the irregularities in the spelling of many English words place
severe limitations on this as an exclusive approach to spelling instruction,
4
A recent study relating to this topic is reported by Hanna, Hanna,
Hodges and Rudorf (1966). Hanna and his associates attempted to write
an algorithm for a computer program which would generate the correct
spelling of a word from the coded phonemes making up the word. Their
algorithm to specify the phonemic-to-graphemic correspondences in
English spelling is three pages in length, is dependent on the precise
dictionary pronunciation of the phonemes, and results in the correct
spelling of a word for only fifty percent of the items attempted.
This comment is in no way intended as a criticism of their work;
nor is there any implication that knowledge of the spelling regularities
specified in their algorithm would not be extremely useful to the
individual speller. What seems apparent, however, is that there are
a large number of frequently-used words in our language whose spelling
must, in part at least, be memorized in a rote fashion.
Certainly, any controvery over the appropriate method to teach
spelling would be greatly reduced if we had more precise information
concerning the spelling process itself. However, very little is
written, and even less seems to be known, about the cognitive processes
which are involved in spelling a word. The Hanna study is one of
the few places one may find an explicit hypothesis concerning the
characteristics of some of these processes. They propose that learning
to spell is primarily a cognitive process, and like most learning can
be thought of as the building up of strategies or "programs" for organ
izing and processing information. The good speller then is one who
somehow has constructed an efficient and accurate cognitive program
for encoding ora~ speech patterns into their proper graphemic
5
representations. They further recommend that these encoding strategies
are best taught inductively, allowing the child to discover for himself
that basic structural properties underlie the spellings of many words.
Such information processing theories of learning and behavior
are currently quite popular and will perhaps someday produce important
knowledge and understanding. It should, however, be made clear that
from a "programming" point of view--to continue the analogy--one faces
something of a dilem.ma in constructing a good speller" An experienced
computer programmer knows that it is often more effici.ent, and sometimes
necessary, in coming up with the correct solution to a question, to
use the machine's memory files rather than some general algorithm
to obtain needed information. In this case, where the algorithm
produces only fifty percent correct responses, it would seem absolutely
essentiaL
It should be noted here that the Hanna study does not contend
that their particular algorithm in any way resembles the actual cogni
tive strategies which an individual uses in spelling a word. Indeed,
they would perhaps argue that the competent speller had developed a
"program" which was much more complex and accurate than theirs. The
following conceptualization of the spelling process represents an
attempt to extend the information processing notion, but at the same
time to place greater emphasis on the function of the memory capacity
of the individual.
The spelling process could perhaps be thought of as depending on
two parallel, interrelated memory processes or strategies for retrieval
of information stored in long-term memory. It is conjectured that the
6

individual, when called upon to spell a word, will first of all search
his long-term memory store and attempt to find some sort of complete
representation of that word, For the mature, competent speller this
search seems to be exceedingly rapid and results in the almost instan
taneous production of the correct orthography, The processing time
required for the good speller to generate most frequently-used words
would seem to preclude the possibility that he uses a strategy dependent
on internalized rules or algorithmB for matching appropriate grapheme
to phoneme,
Rather, the second strategy wou.ld seem to be called into use mainly
when the word is unfamiliar and infrequently used, or when its excessive
length for some reason does not permit it to be stored as a single
unit, Often when this strategy is apparently being used to spell a
word, the individual will, as he proceeds serially through the word,
continue to search through his memory for a match between his spelling
and his long-term store of graphemic representations of words and sounds,
In addition, it would appear likely that during the learning
phase of this spelling process, both of these retrieval strategies
should be developed concurrently if we wish to maximize efficiency and
accuracy, Since the first strategy is dependent on the size and accessi
bility of the individual's well-learned word store, an instructional
system which focused exclusively on teaching rules and phonemic-graphemic
regularities would seem to be inadequate, We must also attempt to
strengthen and increase the individual's store of frequently-used words
and their associated spelling, Hopefully, a drill and practice routine
using a CAl system provides an efficient method of accomplishing this
objective, 7

While it is a matter of conjecture how the associations between
words and their correct spellings are established, it seems plausible
to think of them as being learned in a manner similar to that in which
a paired-associate item is acquired, If such an assumption is reason
able, and the learning of the correct spelling of a word does in
some way resemble the learning of a paired-associate item, several
potential research questions are immediately apparent, One of the
more interesting was suggested in a recent article by Greeno (1964)
which reported a paired-associate experiment that perhaps had implica
tions for spelling,
Greeno compared two practice conditions in which the repetitions
of some items were distributed in the normal sequence and others
were repeated on successive trials, He found evidence indicating that
little or no learning occurred on the second trial when an item was
repreated immediately or very soon after a previous presentation, In
addition, he found that the distributed condition produced more
learning than the massed condition, and argued that this result pro
vided evidence for a discrimination theory of paired-associate learning
as opposed to a reinforcement or contiguity theory,
One could contend that learning to spell a word involves a
similar discrimination process, For example, suppose a child is called
on to ,spell the world "BOAT," Assume also that the child has had
sufficient experience with the language and spelling so that the response
he generates is not simply a random series of letters, If he is not
sure of the word, he is likely to consider a n\unber of possible
spellings--for example, BOT, BOTE, and BOAT, Now in order to spell
8
the word correctly, he must learn to discriminate among several--and
in this case, reasonable--alternatives. Eventually we would hope that
he would eliminate the wrong alternatives and associate just the
correct spelling with the spoken word.
If this description does resemble the process that actually
occurs in learning to spell a word, then we would expect that greater
learning would occur when practice on unlearned words in a list is dis
tributed rather than massed.
Directly relevant to this problem are two unpublished studies
(Keller, 1966; Fishman, 1967) which were run using the same CAl system
used in this experiment. In his stUdy, Keller presented words under
two conditions. Words in the first condition, if missed, were corrected
and the next item presented. Words in the second condition were not
corrected immediately; rather, the student was informed that he was
wrong and told to try again. 1:11: after the second try he still mis
spelled the word, he was given the correct spelling and told to copy
it. In spite of the greater time and llJzuber of practices which the
students had on the second condition words, the probability of a
correct response on these was not significantly better than for those
words which were not repeated. It would seem likely that one of the
principal reasons for this unusual finding was that the words were
too easy (overall probability of an error on the retention test was
less than 10%). Thus the potential effects of the extra practice
on condition two words may have been obscured because most of the
students could easily learn the words they did not know without the
benefit of extra practice trials.
9
Fishman's study attempted to evaluate the results of presenting
words in massed or distributed trials. Two groups of three words each
were presented once every other day over a period of six days. The
learning trials on four other groups of words were massed so that all
of the trials for that group occurred on the same day. She found that
the probability of a correct response for the words in the massed
conditions was higher than those distributed during the trial sessions,
but that on two-week retention tests the words learned under distributed
practice were remembered at a higher rate.
These studies indicate that we do not yet understand clearly the
effects of varying our method of dealing with incorrect responses, or
of the optimal routines for spacing practices on an item. The present
experiment was designed to further explore both of these problems.
Explicitly, both Greeno's and Keller's studies provide evidence
suggesting that the immediate repetition of error items will produce
minimal learning on the repeated presentations of an item. At the same
time, both Greeno's and Fishman's results indicate that distributed
spacing of practice trials on error items would be superior. In this
study it was decided to investigate the issue by presenting words
under three conditions. When a word was m.isspelled, it was either
(1) not repeated during that session, (2) repeated immediately, or
(3) repeated after four other items had been presented. If Greeno's
findings are applicable in this situation, then We might expect the
first two conditions to produce approximately equal learning, i.e.,
immediate repetition of an item would not greatly increase learning
for that item. On the other hand, the spaced practice on items in
10

the third condition should be consistently superior in affecting rate
of learning.
Individual Confidence in Spelling. Implicit in the earlier dis
cussion on the possible nature of the spelling process is the notion
that as the maturing speller is augmenting his store of quickly
retrievable words and acquiring strategies for generating the regularly
spelled words, he must at the same time develop a third necessary skill.
No matter what combination of processes he may use to generate the
spelling of a word, he must make ,.decisions as he progresses in his
response as to the correctness of a particular spelling. Presumably
upon completion of his response, if not before, he must decide whether
or not his spelling can be matched with whatever internal representation
he may have of the word. In most cases the experienced speller will
be able to generate a response which in some way approximates the
correct spelling, but he mayor may not fail when he tries to make an
accurate assessment of the adequacy of his answer.
The reasons for such a failure are difficult to specify exactly.
For example, a person might decide that his response is correct because
he has an inaccurate representation of the word in his long-term
memory. Or he may have generated the spelling by using inappropriate
strategies dependent on phonemic-graphemic regUlarities. Most important,
the decision process itself at the juncture when one decides on the
correctness of the response may be inadequate for several reasons.
For example, an individual may base his decision on something
other than a systematic attempt to match his response with a correct
representation in his memory. He might, for instance, base his decision
11
on a generalized self-perception that he is a "good" or "bad" speller,
He could also be influenced by the immediate--and perhaps irrelevant-
context in which he is asked to respond, Thus, if he had just been
told he had misspelled three words in a ·row, he would perhaps display
a tendency to decide that his next spelling also was wrong,
In spite of these and related problems, it was decided that this
decision process was such an important component of spelling behavior
that it would be interesting to obtain a measure of the student's
confidence in the correctness of his particular spelling of a word,
Such a measure, it was hoped, would provide partial answers to the
following questions: (1) How accurate are elementary school children
at assessing the correctness of their spelling? and (2) Are they
capable of discriminating subjective impressions of their accuracy into
several categories?
While a number of studies involving college-age students (e,g" Bern
bach, 1966; Atkinson and Shiffrin, 1967) have reported obtaining a
measure of a person's confidence in his response, we are not aware of
any research using this dependent variable with elementary school
children,
Summary of Purposes of the Study, To summarize briefly, the
principal purposes of the study were twofold, First of all, we wished
to examine the effects of varying the number and spacing of repetitions
on error items to see how these factors would influence the rate of
learning of new spelling words in a drill context, Therefore, words
were presented under one of three conditions: (1) no repetition of
error items during a session; (2) immediate repetition of error items;
12
(3) repetition of error items after four other words had been pre
sented. Our second major purpose was to test whether or not a student's
confidence in the correctness of his particular spelling of a word was
reliably related to his performance in spelling that word.
Our overall general purpose was to continue the long-term investi
gation of the feasibility of using a CAl system of drill and practice
as both a pedagogical and research tool. For example, specific problems
relating to programming, computer hardware, and data collection and
storage are not fUlly resolved. Similarly, questions concerning
coordination of effort between the university research team and the
public school staff are constantly arising. Studies such as this
will hopefully contribute valuable information leading to the eventual
solution of many of these issues.
CHAPTER II
DESIGN AND EXPERIMENTAL PROCEDURE
Subjects, The subjects used in this study were the ch~ldren in
two sixth grade classes in an elementary school in East Palo Alto.
Originally sixty students began the experiment, but due to transfers to
other schools, absenteeism, and related problems, only forty-two chil
dren completed their lists and the subsequent retention tests,
The school which the subjects attend is located in a "culturally
disadvantaged" area, and the vast majority of the students are non
Caucasian, As measured on the Lorge-Thorndike Intelligence Test, the
mean I,Q, for those subjects who cow~leted tre experiment was 85; the
range of scores was from 60 to 101, with only two subjects scoring
above laO, It should be noted that this is a group-administered test
which is largely verbal in nature, and which almost certainly under
estimates the real ability of the students,
In reading achievement the students also appear to be below
average, Using the Stanford Achievement Tests for intermediate grades,
the mean reading achievement score for the group was just over the
minimum 4th grade level, which would place them approximately two
years below their actual sixth grade placement and well into the
bottom quartile of the national averages,
A question may legitimately be raised as to why such an atypical
sample of elementary school children was chosen for the study, First
of all, it was felt that in part the students' below-average achievement
14

in school refle.cted the (cumulative effects of a lack of basic language
arts skills which could perhaps be improved through the kind of drills
which CAl can provide. Secondly, it was hypothesized that the unique
ness and newness of a CAl system may be particularly motivating for a
group of students who are typically less interested in school achieve
ment than their middle-class counterparts.
Equipment. The computer used in this experiment is a modified
Digital Equipment Corporation PDP-l, with a variety of input and output
devices. Essentially, this machine is a high speed digital computer
which has been programmed to service a maximum of 28 user programs
simultaneously on a real-time sharing basis. The time-sharing capa
bility is made possible through the use of a high speed memory drum
which reads user programs in and out of the computer's core memory
at a rapid rate.
The audio system which was used is made up of a small Westing
house P-50 computer which controls twelve tape drives. This smaller
computer is linked directly to the PDP-l and is controlled by programs
running on the latter. Each of the tape drives can randomly access
any desired segment of a continuous loop of magnetic tape in well
under two seconds. These tape loops are 24 inches in circumference,
six inches wide, and contain 128 separate tracks. On each track eight
one-second segments may be recorded and accessed. Both the PDP-l and
the audio system were connected directly by telephone lines to the
terminal equipment at the school.
The terminal equipment was set up in a converted storeroom located
a short distance from the two classrooms. In the storeroom were
15
located four student stations, each containing a standard Model-33
Teletype and a set of earphones. Each station also contained an extra
audio outlet so that all audio messages could be monitored without dis
turbing the students as they proceeded through a lesson. To minimize
distractions and noise from other teletypes, these stations were
separated from each other by four-foot high room-dividers.
All four terminals were controlled by a single program on the
PDP-l; each student was serviced sequentially in a round-robin cycle.
Due to the extremely rapid speed of the computer, the student received
the impression that he was getting !ifull-time" service, although
actually the computer devoted oUly a small fraction of its running
tim.e to anyone individuaL
Preliminary Training and Orientation. In order to provide a
thorough introduction to the experimental procedures and to accustom
the students to working on a teletype, an extensive orientation and
training program was run during the fall of 1966. Also, since the
controlling computer program and part of the terminal equipment had
been added to the system in the late summer, it proved to be an
opportune time to correct some of the tecQ~ical and hardware problems
which inevitably arise in the development of' new CAl systems 0
After meeting with the whole class and explaining in general
terms the procedure to be folJ.owed on the spelling drills, the experi
menter and his assistant demonstrated and explained the use of the
teletype and aUdio system to each student individually over a two-week
period.
16
During this introductory phase all students were run on the same
list of "easy" fourth grade words, The principal emphasis at this
time was in developing familiarity with the teletype keyboard and the
overall administrative procedures involved in leaving the classroom,
checking into the terminal room, adjusting the earphones, etc, No
attempt was made to teach the students to USe standard typing tech
niques; rather they were instructed and aided in finding the letters
on the keyboard and encouraged to be as accurate as possible in their
typing, This latter consideration was especially important since there
was no way for them to erase or correct a typing error, and the com
puter program which evaluated their responses did not distinguish
between typing and other spelling errors,
After all the students had had an opportunity to go through
several practice sessions and were beginning to develop a reasonable
facility at finding and typing the letters, the idea of using confi
dence ratings was introduced, Again the students were instructed
individually and given practice until they seemed to understand the
Use and meaning of the various ratings, From the time when the
students were first introduced to the equipment up to this point where
they had learned to use confidence ratings, four weeks had elapsed.
The original intention had been to begin the formal experiment
at the completion of the practice and training period, However, a
major hardware problem developed and the computer system was completely'
inoperative for an extended period, Rather than beginning the experi
ment and having it interrupted at the mid-point by Christmas vacation,
it was decided to Use the time remaining until vacation to give the
17

students further practice and work on word lists somewhat easier than
those which they would encounter in the experiment. The other pro
cedures used in these practice sessions were identical to those in
the experiment.
Word Selection. Careful study of the students' performance during
the early practice sessions, consultation with their teachers, and
their ability as exhibited on achievement tests all indicated that our
original intention of using uniform lists of words for all students
was grossly inadequate and impractical because of the heterogeneity of
the classes.
In deciding on the word list to be used in the experiment, four
criteria were used. (1) The words should have high frequency of
occurrence and should be useful in the students' writing. (2) The
words should be appropriately difficult so that the student would
miss a minimum of 50% of the words on his first attempt at spelling
them. (3) On the other hand, the words should be easy enough so that
by his fifth time through a list the student would spell at least
10 out of 12 of these words correctly. (4) The list length should be
such that a student could complete an entire drill in a ten-minute
sessiono
To meet all of these criteria, it is obvious that each student
would have to use completely individualized lists, specifically
tailored to his ability and educational achievement. While such
individualization of curriculum materials is perhaps an ultimate aim
of CAl, as a more realistic compromise it was decided to use three
major levels of word difficulty, to construct lists twelve words in
18
length, and to attempt to place each student on that level which
would maximize his rate of learning during a ten-minute drill session.
Construction of Word Lists. The problem of constructing word
lists that are of similar difficulty is complex. Many factors--the
length of the word, the number of permissible variant spellings for
the phonemes in the word, and the frequency of occurcrencec of 'the word
in English--probably are important in determining spelling difficulty.
Individuals will also differ greatly in their language experience and
facility, so that a word which is easy for one student to spell might
be impossibly hard for another.
Bearing all of these complications in mind, it was decided to use
the New Iowa Spelling Scale (Greene, 1954) as the source of an objective
measure of the difficulty of a word. This scale is the product of the
testing of some 238,000 pupils throughout the country in the early
1950's to determine what percentage of students at each grade level
could spell a word correctly. Using this measure, the words for the
study were selected in the following manner.
First of all, three general pools of words were formed by listing
alphabetically for each of three grade levels--4th, 5th and 6th grades-
all of the words in the New Iowa Spelling Scale which were spelled
correctly by 40% to 50% of the students in each of these grades.
Then for each grade level, six lists of twelve words were formed by
(1) randomly selecting six words at a time of equal difficulty from
the general grade-level pool, and (2) randomly assigning each word to
one of the six lists. Using this procedure, the eighteen lists in
Appendix A were constructed. It should be noted that the six lists
19

1. No Repetition
on each grade level are equivalent in range of difficulty and in the
number of words represented by anyone percentage measure.
Assignment of List Levels and Experimental Conditions. Upon com
pletion of the construction of the lists as described above, the 60
students were assigned to go through six lists on one of the three grade
levels. A student's assignment to a particular level was based on his
performance in the practice sessions and his ability as measured on
the achievement tests. The criteria for moving to a new list within
a level were that the student either (1) spelled 10 out of 12 words
correctly on the first tryon that item on a particular day, or (2) had
gone through the same list for five days without meeting the first
criterion.
On all grade levels and word lists, the following daily presentation
procedures were used. For a particular student and twelve-item list,
four words were assigned to one of three conditions:
(RO) Words in this condition were not
repeated during the session, regard
less of the correctness of the subject's
response.
2. Immediate Repetition (Rl) Words in this condition which were
misspelled were repeated iwwBdiately.
3. Spaced Repetition (R4) Words in this condition which 'were mis-
spelled were repeated after the presen
tation of four intervening items.
Words were never presented more than twice in a session, so that if a
subject missed all of the words in Rl and R4, he would have a maximum
20
of 20 presentations for that session--eight of which would be repeti
tions of error items.
Words, conditions and subjects were balanced so that any particular
word was always given under RO to one-third of the sUbjects, Rl for
the second third, and under R4 for the remainder of the subjects. Table 1
summarizes the general experimental conditions for all lists on all
grade levels. On their appropriate grade level, subjects and words
were randomly assigned within this pattern. Since each student who
completed the experiment went through six lists, the total time for
the experiment for a particular student was a maximum of 30 school
days. The minimum time, of course, depended on how fast the student
learned the list, but it. was seldom less than 20 school days.
Daily Operation During Experiment. A full-time monitor was on
duty whenever the children were using the teletypes. Her presence
was primarily a precautionary measure so that an adult was available
in case of an equipment failure or other emergency. The actual check-in,
presentation and evaluation of the drill, and the sign-out were all
handled by the CAl system and occurred as follows.
The student entered the room, sat down at a free terminal, and
put on his earphones. On the page-printer on the teletype he saw the
message, "Please type your number." After he typed his identification
number and depressed the space bar--the latter operation was used as
a termination signal for all student responses--the computer then
looked up this number in the student history section of the program,
determined what list the student was working on that day, randomly
permuted the order of presentation of the individual words on the
21
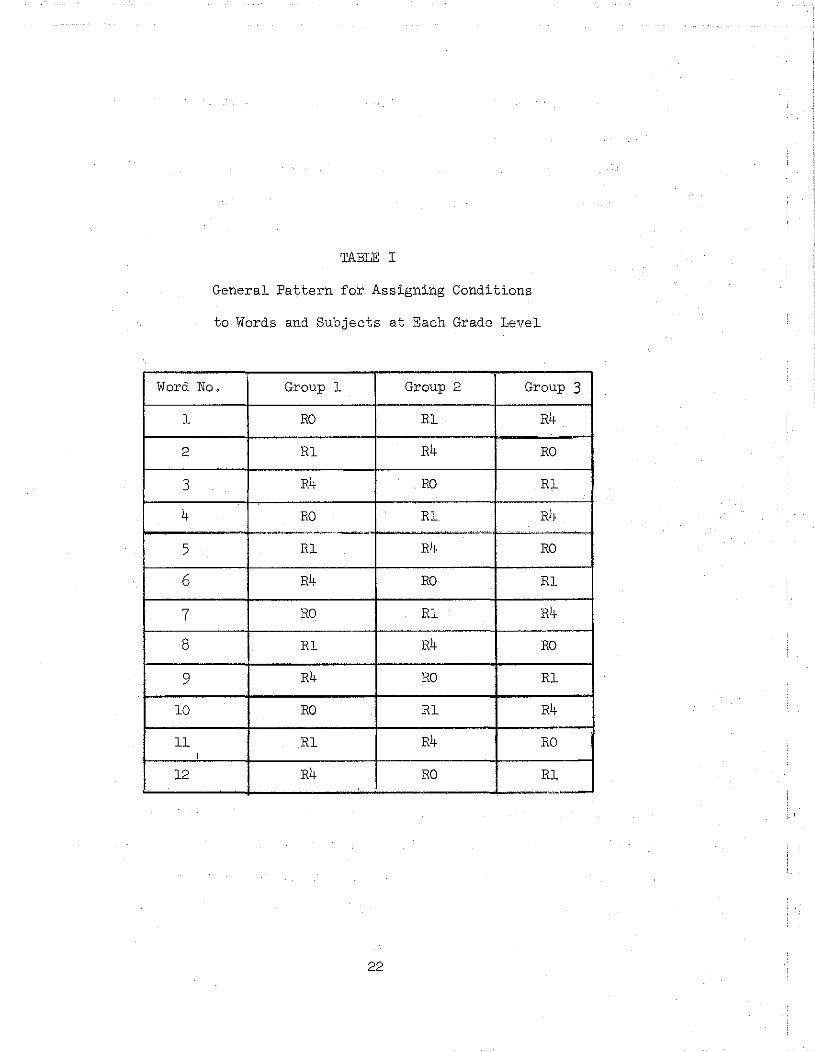
TABLE I
General Pattern for Assigning Conditions
to Words and Subjects at Each Grade Level
Word No. Group 1 Group 2 Group 3
1 RO Rl R4
2 Rl R4 RO
3 R4 . RO Rl
4 RO Rl R4,,,,,,,,",,,-,-'.=' ""'0-'.'-,""'-
5 Rl R4 RO
6 R4 RO Rl
7 RO Rl R4
8 Rl R4 RO
9 R4 RO Rl
10 RO Rl R4
11 Rl R4 ROI
12 R4 RO Rl~--
22

list, and positioned the tape on the aUdio system. Next it sent a
command to the teletype to print the stUdent's name, his list number,
and the date and time the session was beginning.
At this· point the child heard over the earphones the message, "If
you hear the aUdio, please type an 'a' and a space," and at the same
time saw this same message printed on the page. If there were something
wrong with the audio system, he would call the monitor. Ordinarily
he proceeded by following the spoken directions, i.e., he typed an
"a" and a space, and the lesson began.
To signal the student that a word was about to be presented, the
machine typed a dash (-). The audio system then presented a word, used
the word in a sentence, and then repeated the word again. As soon as
the audio track was through playing, the machine typed the number of
that partiCUlar item (1,2,3,etc.). This was the student's signal to
begin his response. When he finished typing his answer, he depressed
the space bar. The machine then waited for him to type one of
four numerals (1,2,3, or 4) as an indication of his degree of confidence
in his answer.
Attached to each machine was a small chart reminding the student
of the meaning of each confidence rating. The child was told to type
the number which identified the phrase most closely corresponding to
his feeling. The phrases were:
(1) Positive word is right
(2) Fairly sure word is right
(3) Fairly sure word is wrong
(4 ) Positive word is wrong
23
Immediately after receiving this number the computer evaluated
the student's response. If the student had responded correctly, the
teletype printed out after the student's spelling of the word the
message, "--C--", letting the student know he was right. If he was
wrong, it, typed the message, "--X--';, followed by several spaces and
a correct spelling of the word. If for some reason the student had not
completed his response after forty seconds, the machine typed out the
message, 1l __ TU __ il, meaning tim.e is upo As on a wrong answer this
message was followed by several spaces and the correct spelling of the
word.
Following all incorrect or timed-out responses, the student was
given six seconds to study the correct answer before the next item
was presented. On correct responses the study time was three seconds.
After proceeding through all of the items on the list in a similar
fashion, the student received a printed message, "End," followed by
his name, list number for the next session, the date and ending time,
and the number of words he spelled correctly on the day's lesson.
These daily drills were collected by the monitor, and at no time during
the experiment was the student given a copy of the words to study on
his own.
A flow chart summarizing the presentation procedure may be found
in Figure 1-
Retention Tests. Retention tests on all words which an individual
had gone through were given one week after the entire group had finished
their experimental runs. Since individuals varied in the number of
runs they had needed to reach criterion, this meant that the time
from the last run on a li.st until the retention test also varied.
24

Audio I _ IStudent spells I .. (Presentation~ word
of word
40 sec~ i
elapsed?3 second
study
Type--TlJ-(Answer)
No
r--< word,Student types·
t., Nocorrec .
Confidence Rating . ?
·Yes
Type--e-~
l\)V1
Next I ~;SWord
1st).. ( Presentation).. I
?
No
6 second r~-----'----...jstudy I II( ITYPe--X-
(Answer)
Set counterto presentword after'4 items
No Rl?
Yes
Figure 1. Flow chart for daily presentation routine for each word on 12 item list

In the case of the first list the individual had studied in the experi
ment, the retention interval was approximately six weeks. For the
last list studied, the minimum interval was one week; the average
retention interval for the entire group and all lists was just over
three weeks.
Retention tests were given in the same manner as the experimental
runs, with the exception that error items were not repeated. The
students were given immediate feedback about the correctness of their
responses.
Since time limitations prohibited testing a subject on all six
lists on the same day, the retention tests 'were divided into two parts.
Lists for Weeks 1-3 were given on the first day, and lists for Weeks 4-6
were presented on the succeeding day. (Rather unexpectedly, the fact
that these test sessions were somewhat longer than a normal practice
session may have affected student performance adversely. This problem
will be discussed later in the Results Section.)
Data Collection. For every student response the following informa
tion was transmitted to the controlling computer program and stored
on disk memory:
1. Subject identification number
2. List number
3. Run number (i.e., was this the first, second, or nth time the
student had gone through the list?)
4. Relative item number of the word for that session (i.e., was
word presented 1st, 2nd, 3rd, etc.?)
5. Identification number for the word
26
6. Experimental condition number under which the word was presented
7. Number indicating whether this was the 1st or 2nd presentation of
the word for that session
8. Was the response correct, an error, or a time-out?
9. Confidence rating
10. Time in hundredths of a second from the end of the audio message
to the first letter of the student response
11. Time in hundredths of a second to the last letter of the student's
response
12. Time from the completion of the response to the confidence rating
With the exception of the latency information all of this data was
also retrievable from the daily lesson print-outs at the school. One
of the jobs of the monitor at the terminal site was to keep a daily
tally of the student performance; this information was then compared
with the data stored by the computer and served as a valuable means
for checking accuracy.
27
CHAPTER III
ANALYSIS OF EXPERIMENTAL RESULTS
Problem of Incomplete Data. AnaLysis of the outcome of the experi
ment was made somewhat complicated by the following considerations:
(1) Eighteen of the original sixty students who began the study did
not go through all six lists as the original design had specified.
(2) Because of the criteria used to advance a student to a new list,
the total number of runs for anyone subject varied considerably from
person to person.
The first problem of incomplete data may be handled in several
ways. The common solution to this dilemma seems to be, in most edu
cational research, to use the data from only those subjects completing
the entire experiment. From a purely statistical point of view this
appears to be a satisfactory procedure, so long as one is very care
ful about subsequent generalizations to the larger population.
In this experiment it was decided to examine the data in two
phases. First, the data from all the subjects--whether or not they
had completed all six lists--was summarized and plotted on graphs.
This data from the entire original group did not differ substantively
from that which was used in the more thorough, SUbsequent analyses
for the smaller group of subjects who completed the entire experiment.
Re-definition of Groups. Of the original 60 SUbjects, 21 out of
23 students using the 6th grade words completed their lists; 15 out of
18 students on the 5th grade words finished the experiment; in the
28
group using the 4th grade words, only 6 out of 19 students finished.
This high attrition rate in the latter group was due to: (1) three
students ·transferred to other schools; (2) four students had to'be
dropped for disciplinary reasons (e.g., refusal to follow directions);
and (3) high rate of absenteeism.
Consequently, for purposes of analysis the remaining subjects
were regrouped. into two groups, composed as follows:
(1) High Group 21 subjects, all of whom ran on 6th grade words;
(2) Low Group 21 subj ects, 15 ran on 5th grade words; 6 used
4th grade words.
First Analysis--Total Errors to Criterion
The first major analysis was based on the total number of errors a
subject made on a particular list from Run 2 up to and including the run
on which he reached the 10 out of 12 criterion--or had made five runs
without reaching this criterion. Table 2 illustrates the basis for
computing the score for each condition on each list. Errors on
repeat items for a run are not included in the scoring. As can be
seen, a student's score for a particular condition could range from
° errors to a maximum of 16 if he missed all the items for that
condition on every run.
A four-way analysis of variance for a mixed model with fixed and
random effects was computed, using as the major dimensions: 2 Groups
(High and Low); 3 Conditions (RO, Rl, R4); 6 Weeks (1st through 6th);
and 21 Individuals (per group).
The dimension labeled Weeks is somewhat misleading, for all
individuals did not use six weeks to go through their lists.
29

TABLE 2
Possible Number of Errors for Each
Condition and List on Runs 2 to 5
,.." ..•. .'-,-Condition RO Rl R4
Run 2 4 4 4
Run 3 4 4 4
Run 4 4 4 4
Run 5 4 4 4
. Total 16 16 i 16
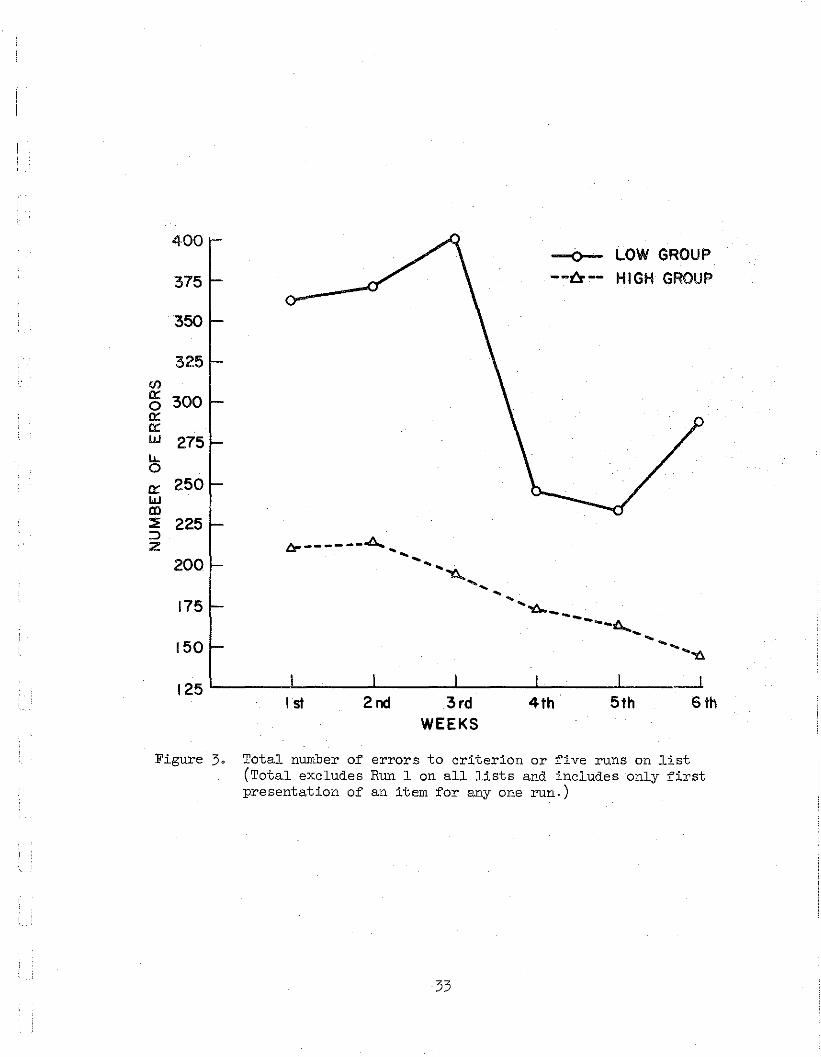
The inclusion of this faction in the analysis was prompted by inspection
of the total error data (see Figure 3), The observable general decrease
in errors as subjects went through their lists suggested that a possi-
ble "learning-to-learn" effect was occurring, To test whether or
not this could be the case the Weeks dimension was included, and
represents the order in which a subject proceeded through his six
lists, Since list order was randomized, this decrease in errors does
not represent the level of difficulty for a particular list of words,
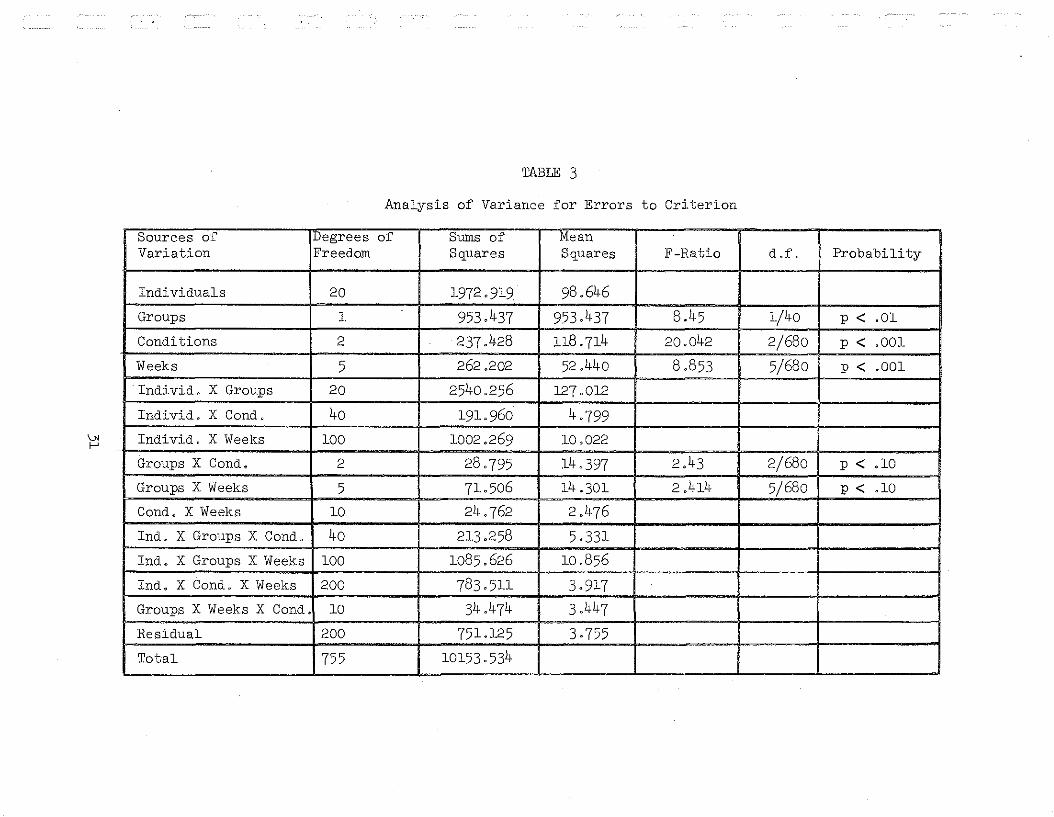
The complete results of this analysis, including the interactions,
are presented in Table 3, The error term for computing the F-ratios
for the three main effects (i,e" Groups, Conditions, and Weeks) is
not simply the residual mean square, In the case of the Group effect,
the error term Was found by adding the sum of squares of Individuals,
30
'-'"f-'
TABLE 3
Analysis of Variance for Errors to Criterion
Sources of Degrees of Sums of MeanVariation Freedom Squares Squares F-Ratio d of. Probability
Individuals 20 1972.9l 9 98.646
Groups 1 953.437 953.437 8.45 1/40 p < .Ol
Conditions 2 237.428 u8.714 20.042 2/680 p < .001
Weeks 5 262.202 52.440 8.853 5/680 p < .00l
Individ. X Groups 20 2540.256 127·012
Individ. X Condo 40 191.960 4.799
Individ. X Weeks 100 1002.269 lO.022J
Groups X Condo 2 28.795 14.397 2.43 2/680 p < .lO
Groups X Weeks 5 71.506 l4.30l 2.4l4 5/680 p < .10
Condo X Weeks lO 24.762 2.476
Ind. X Groups X Condo 40 2l3.258 5.331
Ind. X Groups X Weeks lOO 1085.626 10.856
Ind. X Condo X Weeks 200 783.5U 3.9l7
Groups X Weeks X Condo 10 34.474 3.447
Residual 200 751.l25 3.755
Total 755 lOl53.534
-0- LOW GROUP--t!r-- HIGH GROUP
N = NO. OF RESPONSESON WHICH EACH DATAPOINT IS BASED
·8
.7L1J(/)zo0.(/)L1J0: .6
I-
fcl0:0:
8 .5u.o>!::~ .4«Ino0:0.
.3
p-_.----4,.. ...,.. ....... ...~' ", ...
" ~,,,,,~,,,,,,,,,,,
I,I,,
I,&
. 2 '---......:___---.-,....-......,.-~--L..:___-7"""""""_;_ ___;_........,.-__.__J,_-___;___::_~
I(N=1512)· 2 (N=1464) 3(N=I080) 4 (N=672 \ 5(N=384) R.lenlion (N=504)N =1512 N= 1488 N= 1292 N=I056} N=732 rest N=504
RUNS
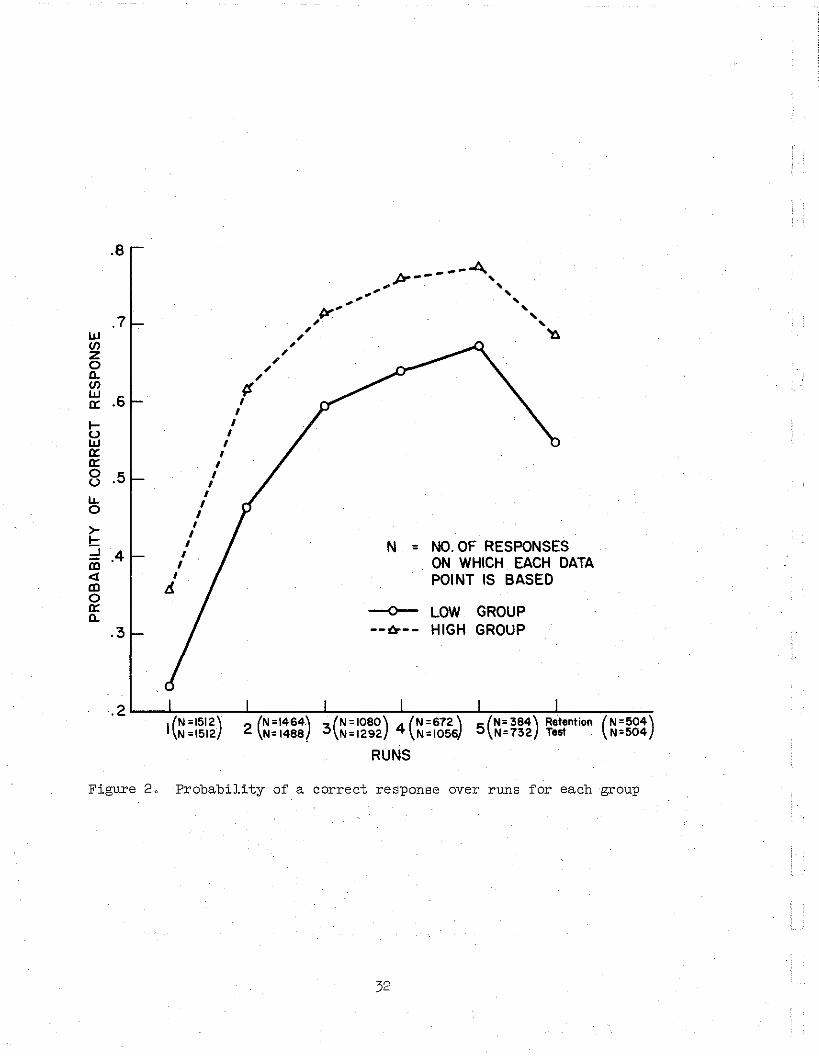
Figure 20 Probability of a correct response over runs for each group
32
5th
-0- LOW GROUP--~-- HIGH GROUP
4th3rdWEEKS
2nd1st
6-------4..~ ....
"~ ... ... , ....."6.__
--.....~-.. -..""8
L-__-L__--l ...I-__-..l...~__.L__._1
6th
400
375
350
3251Ila:: 3000a::"w 275IJ..0
a:: 250wa:l::l; 225:::>z
200
175
150
125
Figure 3. Total number of errors to criterion or five runs on list(Total excludes Run I on all lists and includes only firstpresentation of an item for anyone run.)
33

and the Group by Individuals interaction, and dividing by the total
degrees of freedom (ioeo, 40)0 For the other two main effects, the'
error term is the sum of the following interactions: (1) Groups by
Conditions; (2) Groups by Weeks; (3) Individuals by Groups by Conditions;
(4) Individuals by Groups by Weeks; (5) Individuals by Conditions by
Weeks; and (6) Eesidual; this total is then divided by the sum of the
degrees of freedom (ioeo, 680)0 None of these interactions are signifi
cant or particUlarly interesting since they include variation due to
expected individual differenceso In any case, this estimate of the
error term is certainly conservative in the sense that it increases
the size of the error variance, and thus is less likely to produce a
significant F-ratio for the main effectso
Group Differences 0 The significant difference (F = 8045,
p < 001) found between the Low and High groups was not surprising,
since the groups were selected on the basis of their ability and were
run on different lists of wordso The initial hope had been that the
use of harder 'words for the High group would serVe to make the task
equally difficult for this group as for the Low groupo That the
experimenter was not successful in equalizing relative difficulty is
readily apparent in Figure 2, which shows the overall learning rate
of the two groups as they proceeded over runs on a listo
Week Differenceso A highly significant difference (F = 8 0853,
p < 0001) was found for the Weeks effecto Interestingly the Groups by
Weeks interaction approached significance (F = 20414, p < .10)0 This
differential effect of Weeks on the two groups--as well as the overall
decrease in total errors,--may be clearly seen in Figure 3. It should
34

be recalled that this experiment was begun after each subject had had
several weeks of orientation and training on the task. Evidently, the
complexity of the response demanded--involving as it does motoric skills
and memory processes--is such that factors other than knowledge of
specific words is being learned.
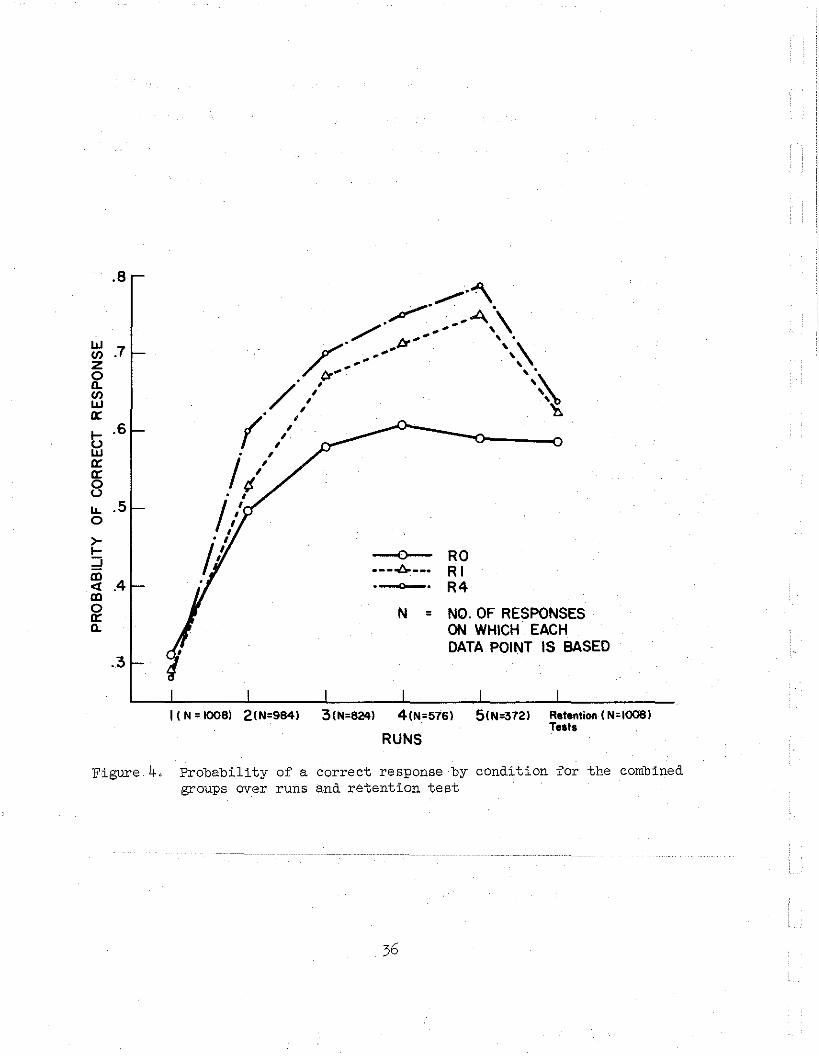
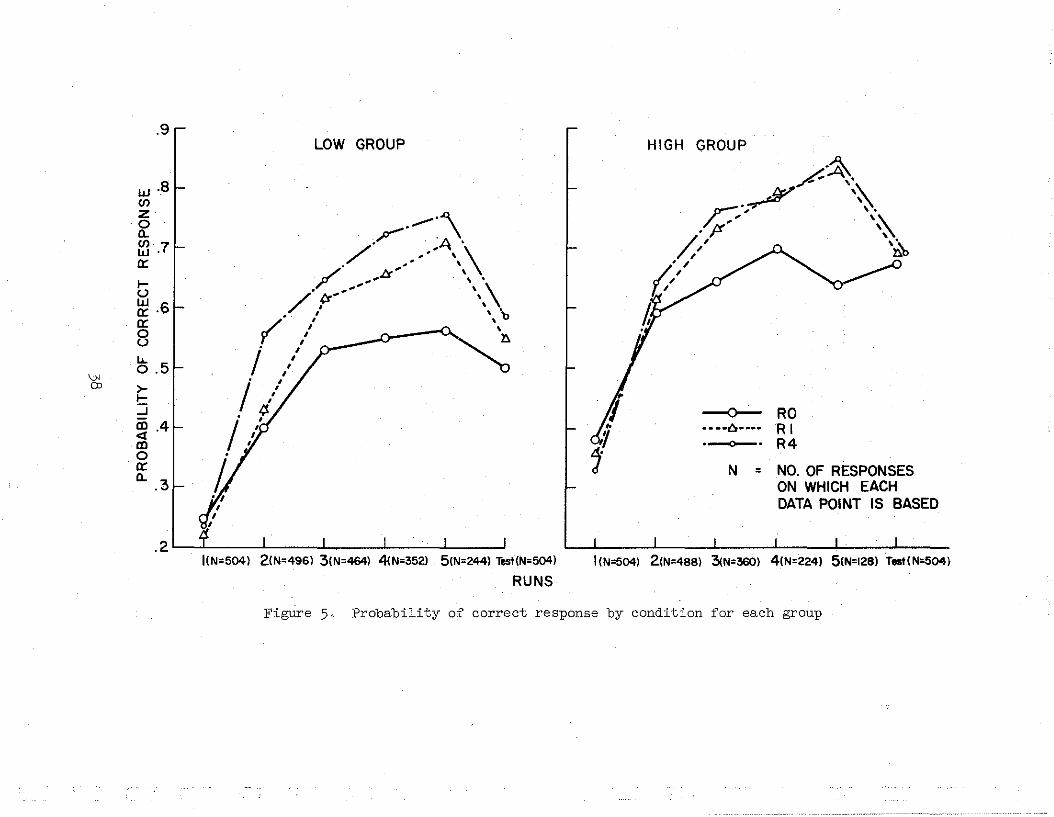
Condition Differences. The variation in number and spacing of
repetitions on error trials produced a significant difference (F = 20.042,
P < .001) between conditions. This difference is reflected in Figures
4 and 5, which show the probability of a correct response on the first
try for all items over runs. Inspection of these graphs does not make
it immediately clear if the significance found is due to the large
difference between RO (no repetition of error items) and the other two
conditions, or if the apparent superiority of R4 over Rl is also
statistically significant.
Consequently, t-tests for correlated scores (McNemar, 1962) were
run to compare Rl (immediate repetition of an error item) and R4
(repetition of an error item after four intervening items). The results
are summarized in Table 4. As may be seen, these conditions do differ
significantly for the combined groups and for the Low group, but not
for the High. This difference in the effect of the conditions on the
Low and High groups is also indicated in the interaction term (Group
by Condition) for the analysis of variance, which approaches signifi
cance (F = 2.43, p < .10).
Analysis of Retention Test Scores
An analysis of variance for the number correct for retention test
scores was carried out employing the same model and dimensions as those
35
--<>-----1::.- __
.8
w(/) .7zlr(/)wex:I- .6~ex:ex:8LL .5o~I-;!ID<X .4IDoex:l1.
.3
,N
RORIR4
= NO. OF RESPONSESON WHICH EACHDATA POINT IS BASED
I ( N = 1008) 2(N=984l 3 (N=824l 4CN=576l 5(N=372l Rlllenlion (N=IOO8)Te.l.
RUNS
Figure 4. Probability of a correct response by condition for the combinedgroups over runs and retention test
36
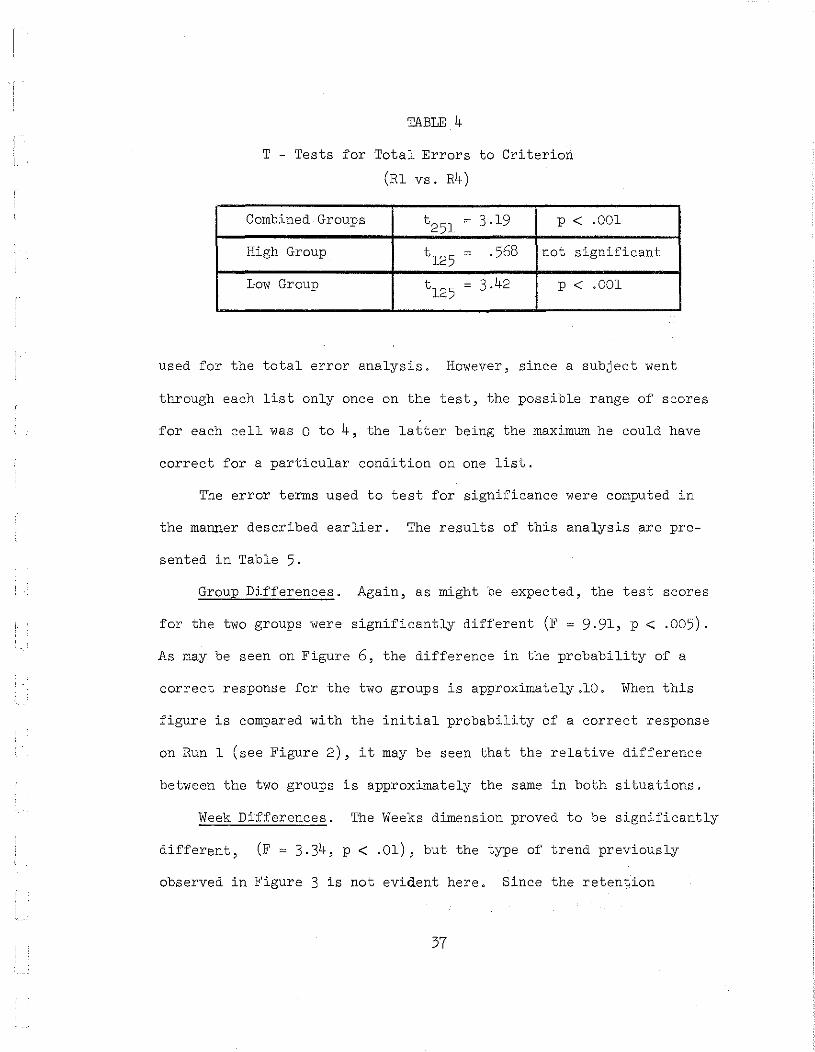
TABLE 4
T - Tests for Total Errors to Criterion
(Rl vs. R4)
Combined Groups t251
~ 3.19 p < .001
High Group t125
~ .568 not significant
Low Group t125
~ 3.42 p < .001
used for the total error analysis. However, since a subject went
through each list only once on the test, the possible range of scores
for each cell was 0 to 4, the latter being the maximum he could have
correct for a particular condition on one list.
The error terms used to test for significance were computed in
the manner described earlier. The results of this analysis are pre
sented in Table 5.
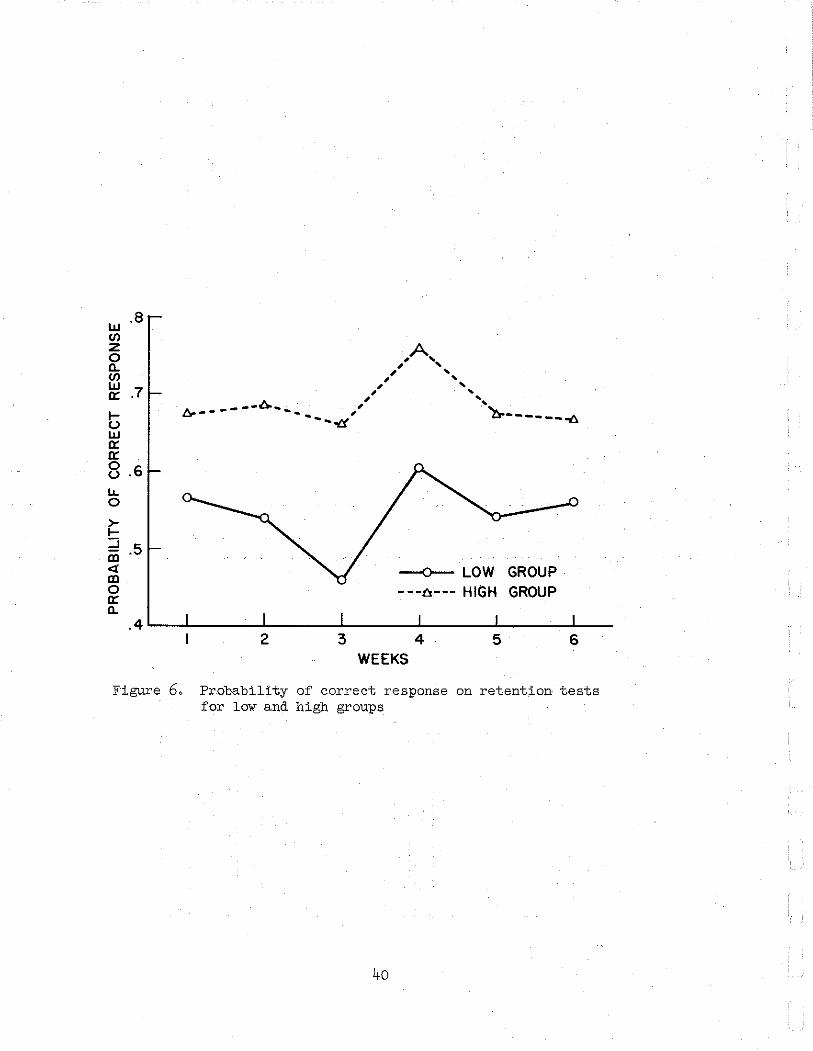
Group Differences. Again, as might be expected, the test scores
for the two groups were significantly different (F ~ 9.91, P < .005).
As may be seen on Figure 6, the difference in the probability of a
correct response for the two groups is approximately.10. When this
figure is compared with the initial probability of a correct response
on Run 1 (see Figure 2), it may be seen that the relative difference
between the two groups is approximately the same in both situations.
Week Differences. The Weeks dimension proved to be significantly
different, (F ~ 3.34, p < .01), but the type of trend previously
observed in Figure 3 is not evident here. Since the retention
37
·9
.2' I I I ! ! I
IlN=504) 2(N=496) 3(N=464) 4(N=352l 51N=244l Tesf(N=504)
RUNS
--0- RO--·-6-·-- R IR4
N = NO. OF RESPONSESON WHICH EACHDATA POINT IS BASED
.~F·~~p---". ~
/p" \~.,/':/ n \~
(;/ .............. ,"
/ r.'b
~
HIGH GROUP
I (N=504) 2(N=488) 3lN=360l 4(N=224) 5(N=1281 Test(N=5041
fJ.f
1
LOW GROUP
"-'-"\/' . A'
/. "" '\. ,... \
"",L::r \
/" fY~'~~ . \:\./' " ,r'/ _.--<l.. \,b
/,,' ~ -........ r.
/ 1/" "/ /
I,
i
w·8(/)
z·0
a..(/)w·70::
IUW0:: .60::
8u.0.5
~...J
~.4!Xlo0::a..
.3
V<co
Figure 5. Probability of correct response by condition for each group

'->J\D
TABLE 5
Analysis of Variance for Retention Test Scores
Sources of Degrees of Sums of MeanVariation Freedom Squares Squares F-Ratio d.L Probabili ty
Individuals 20 82.026 4.101Groups 1 6L713 61.713 9.91 1/40 p < .005Conditions 2 5.923 2.961 3.187 2/680 p < .05Weeks 5 15.518 3.103 3.34 5/680 p < .01Indiv. X Groups 20 166.952 8.347Indiv. X Condo 40 38.521 0.963Indiv. X Weeks 100 97·925 0·979Groups X Cond. 2 2.166 L083Groups X Weeks 5 3.047 0.609Condo X Weeks I 10 8.886 0.888Ind. X Groups X Condo 40 5L166 1.279Ind. X Groups X Weeks 100 119.951 L199Ind. X Condo X Weeks 200 177.668 0.888
Groups X Condo X Weeks 10 6.356 0.635Residual 200 146.642 0·733Total 755 948.469
-l
.8w(/)zoa.(/)w0:: .7
tJw0::0::
8.6u.o~I-;;;j 5!D'«!Do0::a.
A" ", ..., ..., ..., ...
I::. ' "A_ •• --- .......' '"~- .... ......... -d' ~------~
-0-- LOW GROUP---0--- HIGH GROUP
.4 '----'- -'--__--'- ....L.-__--I. ....L.-_
2 3 4WEEKS
5 6
Figure 60 Probability of correct response on retention testsfor low and high groups
40

interval varied considerably for words in Week 1 compared with those in
Week 6, for example, one might have reasonably expected a general in
crease in correct responses over the Weeks dimension. Figure 6, however,
seems to indicate that the varying retention interval did not produce any
easily interpretable, systematic effects.
The dramatic difference between the 3rd and 4th Week test scores
for both groups seemed rather unusual until it was realized that this
difference may be primarily attributable to using the scores from retention
tests given over a two-day period and to using longer-than-normal sessions
for each sUbject's testing. Thus, the general slight downward trend for
Weeks 1 to 3, followed by the sharp rise on Week 4 and another downward
trend for the remaining weeks may well be due to some sort Of fatigue
factor operating within each of the two test sessions. This unfortunate
confounding of effects could have been avoided if the words had been
randomized,over all six lists instead of merely within each list. This
was not done because the experimenter assumed the increase in session
length would not affect the results so noticeably.
Condition Differences. The condition differences were significant
(F = 3.187, p < .05), but the magnitude of this difference was consider
ably less than in the test for total errors.
Table 6 presents the results of running a t-test for correlated
scores for the various condition combinations. It can be seen that the
main significance effects come principally from the Low group, and
involve mainly the difference in retention between no-repetition items
(RO) and those which were repeated (Rl and R4). However, it should be
noted that the trend observed in the first analysis of error scores is
41

TABLE 6
T - Tests for Condition Differences
on Retention Tests
Conditions Low Group High Group
RO Rl t125
1.86 .10 t125
.81 notvs. - p < = signif.
RO R4 t125
2.68 .01 t125 1.35
notvs. = p < = signif .
Rl vs. R4 t125 .96
not t125 1.23
not= signif . = signif
also found here (i.e", the probability of being correct is greatest for
R4 followed by Rl and then RO)
Analysis of Difference Scores
The scores for this analysis were computed by substracting a
subject's score (number correct) on Run 1 for a list from his score
on the retention test for that same list. Since the maximum number
correct for each condition on a list is 4, the obtained difference
scores could range from -4 (if the subject had all of the words correct
on Run 1 and missed all of these items on the retention test) to +4
(if the subject missed all the items on Run 1 and had them all correct
on the retention test). Unlike the scores for total errors to criterion,
this difference score is not directly affected by the number of runs a
subject might have had on a list.
'['he results of this analysis are found in Table 7. The only source
of variation which was significant was that for Conditions (F = 3.51,
p < .05).
42

-l='DJ
TABLE 7
Analysis of Variance for Difference Scores
Sources of Degrees of Sums of TVleari 1Variation • Freedom Squares Squares F-Ratio d.L Probability
Individuals 20 55.740 2.787
Groups 1 0.894 0.894 0.258 1/40 not signif.
Weeks 5 8.756 1.751 1.096 5/680 not signif.
Conditions 2 12.835 6.417 . 4.018 2/680 p < .05
Ind. X Groups 20 82.661 4.133-- -_..---
Ind. X Weeks 100 207.798 2.077
Ind. X Condo 40 51.052 1.276
Groups.X Weeks 5 15.820 3.164 1.981 5/680 p < .10
Groups X Condo 2 0.645 0.322
Weeks X Condo 10 9.608 0.960
Ind. X Groups X Weeks 100 217.290 2.172
Ind. X Groups X Condo 40 66.465 1.661
Ind. X Week X Condo 200 251.835 1.259
.Groups X Weeks X Condo 10 12 .211 1.221
Residual 200 224.009 1.120
Total 755 1217.627.... .,.-,,-~~--_•...-
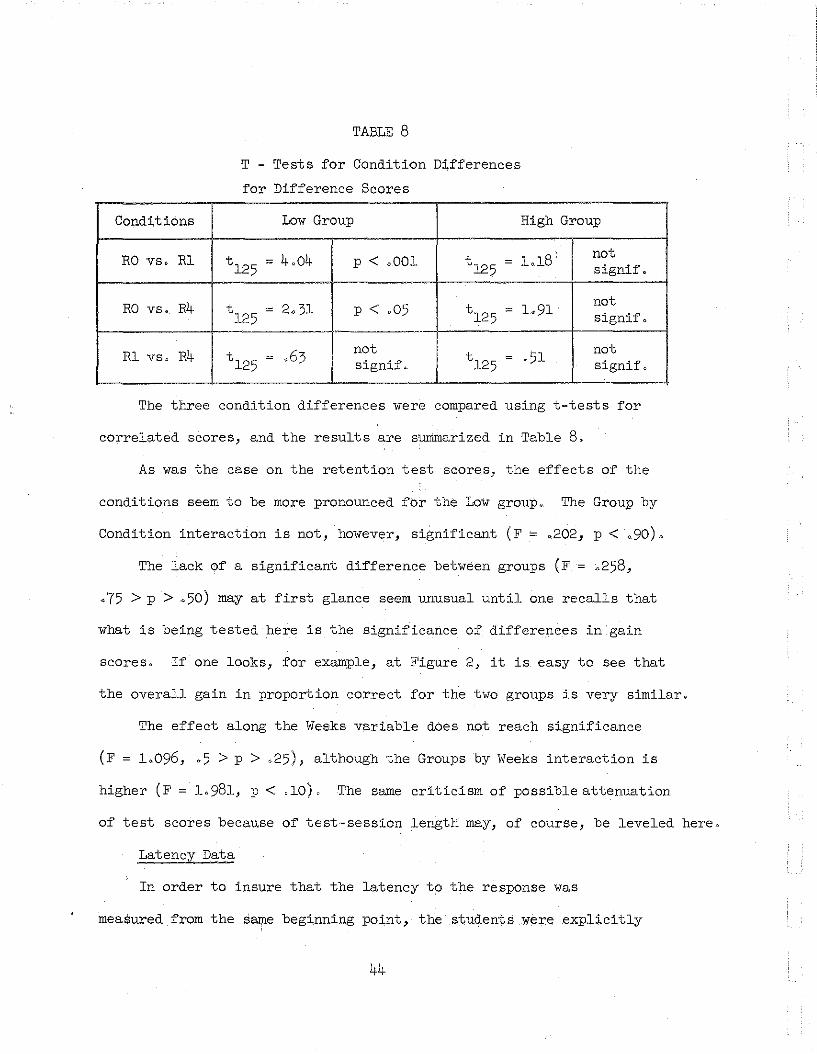
TABLE 8
T - Tests for Condition Differences
for Difference Scores
Conditions Low Group High Group
RO vs. Rl t125
4.04 p < .001 t125
L18' not= = signif.
- -
RO R4 t125
2.31 p < .05 t125 L91
notvs. - .-signif.
~. .- --
Rl vs. R4 t125 .63
not t125 ·51
not= =signif. signif.
The three condition differences were compared using t-tests for
correlated scores, and the results are summarized in Table 8.
As was the case on the retention test scores, the effects of the
conditions seem to be more pronounced for the Low group. The Group by
Condition interaction is not, however, significant (F = .202) P < .90).
The lack of a significant difference between groups (F = .258,
.75 > p > ·.50) may at first glance seem unusual until one recalls that
what is being tested here is the significance of differences in gain
SCOres. If one looks, for example, at FigQre 2, it is easy to See that
the overall gain in proportion correct for the two groups is very similar.
The effect along the Weeks variable does not reach significance
(F = L096, .5 > p > .25), although the Groups by Weeks interaction is
higher (F = 1.981, P < .10). The same criticism of possible attenuation
of test scores because of test-session length may, of course, be leveled here.
Latency Data
In order to insure that the latency to the response was
measured from the s~e beginning point, the students we~e explicitly
44

instructed not to begin their answer until the number of the item was
printed by the teletype. The first latency then was the number of
seconds elapsing from the time the item number was printed until the
subject struck the first key. The second recorded latency was measured
from the same beginning point to the termination response (i.e., depress
ing the space bar). The third latency was the time from the termination
signal to the confidence rating.
This method of obtaining a uniform starting point for the latency
measures may mask real differences which exist in the needed processing
time for a particular word or condition. It should be recalled that
each item is pronounced three times, once in a sentence context and
twice alone. The total time for the audio presentation and the typing
of the item number was just under five seconds. Once the student is
familiar with the word, presumably after the first run, this time during
the audio presentation would be available to the student to use as he
needs or desires. For example, if the item is one he is uncertain of,
he could use the last four seconds of the audio presentation period to
begin his recall or encoding of the proper response. On the other hand,
if he feels he knows the word, he could use this time to daydream or
even to become frustrated with the slowness of the whole procedure.
One cannot be sure that such a difference in necessary processing time
will be accurately reflected in the latency as measured.
Why then was the completion of the audio message used as the
starting point for latency measures? Perhaps, the student should have
been allowed to respond as soon as he was able; the first key he struck
should have terminated the aUdio, and the time from the beginning of
the word presentation to the first key used as the latency measure.
This procedure was not followed for two reasons: (1) The lack of con
sistent high fidelity and reliability in the transmission of audio
messages made it seem necessary to repeat the ·word to maximize accurate
perception of the item; and (2) the controlling computer program would
have had to have been modified extensively in order to allow the student
to terminate the audio before its completion. Since there was little
evidence indicating that such a modification was really necessary or
of great importance in this essentially explorative phase of the total
study, it was not made.
All of the latency data reported in this section was averaged
separately for each individual; thus, each individual is weighted
equally in the overall means, and the s lower-learning student is not
represented disproportionately simply because he took more runs to
learn a listo
Latencies for Correct and Error Responses. F·igure 7 shows the
overall difference in mean latencies between correct and incorrect
responses for the combined groups. This difference seems to be quite
congruent with most of the experimental literature which generally
reports a higher latency for incorrect responses.
On Figure 8 the correct and error latencies are depicted as they
diminish over runs on a list. Again, such a difference was expected
and is in keeping with general findings.
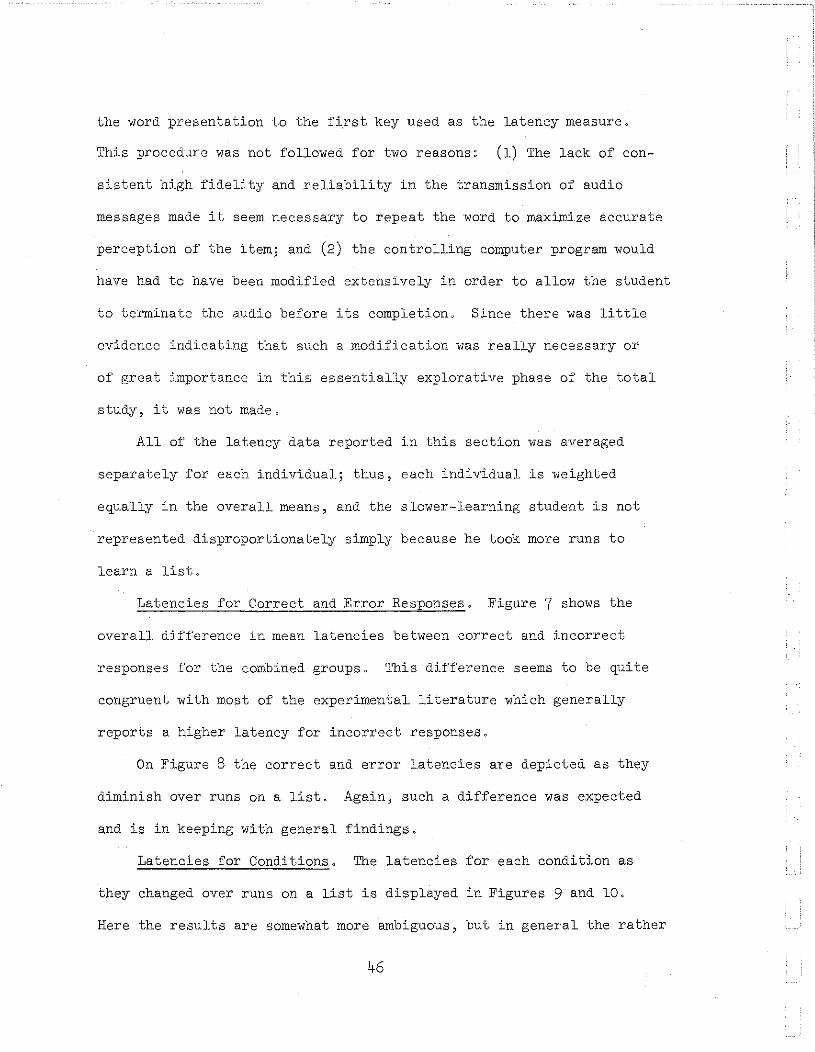
Latencies for Conditions. The latencies for each condition as
they changed over runs on a list is displayed in Figures 9 and 10.
Here the results are somewhat more ambiguous, but in general the rather
46

small differences between latencies for the conditions probably reflects
the difference between the number of correct and incorrect responses in
each condition. For example, in Figure 10 for the Low group, where the
Rl and R4 latencies are quite consistently lower than RO, the latencies
for the former conditions may be interpreted as a result of the fact that
items in Rl and R4 are more likely to be correct.
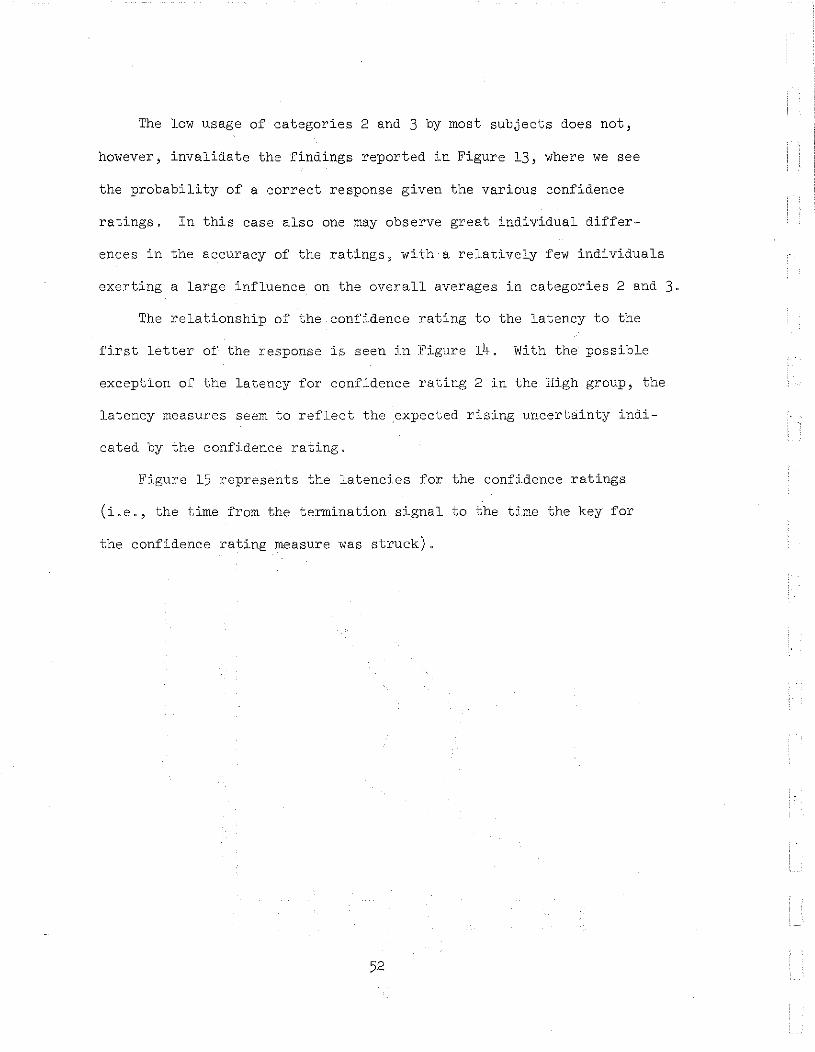
Latencies to End of Response. Figure 11, which presents the laten
cies to the last letter of the response, is included as an example of the
information obtained from this measure. They too seem to follow the trends
apparent in the latency to the first letter, and are quite in line with
one's intuitive expectations--i.e., as the student learns the word better,
he can complete his response faster.
Confidence Rating Measures
Because of the great individual variations in the use of confidence
rating categories, it is rather difficult to report overall summary
statistics for this measure which do not distort the results to some
degree.
As with the earlier latency data, all means and frequencies were
computed separately for each individual and the overall means calculated
from these averages.
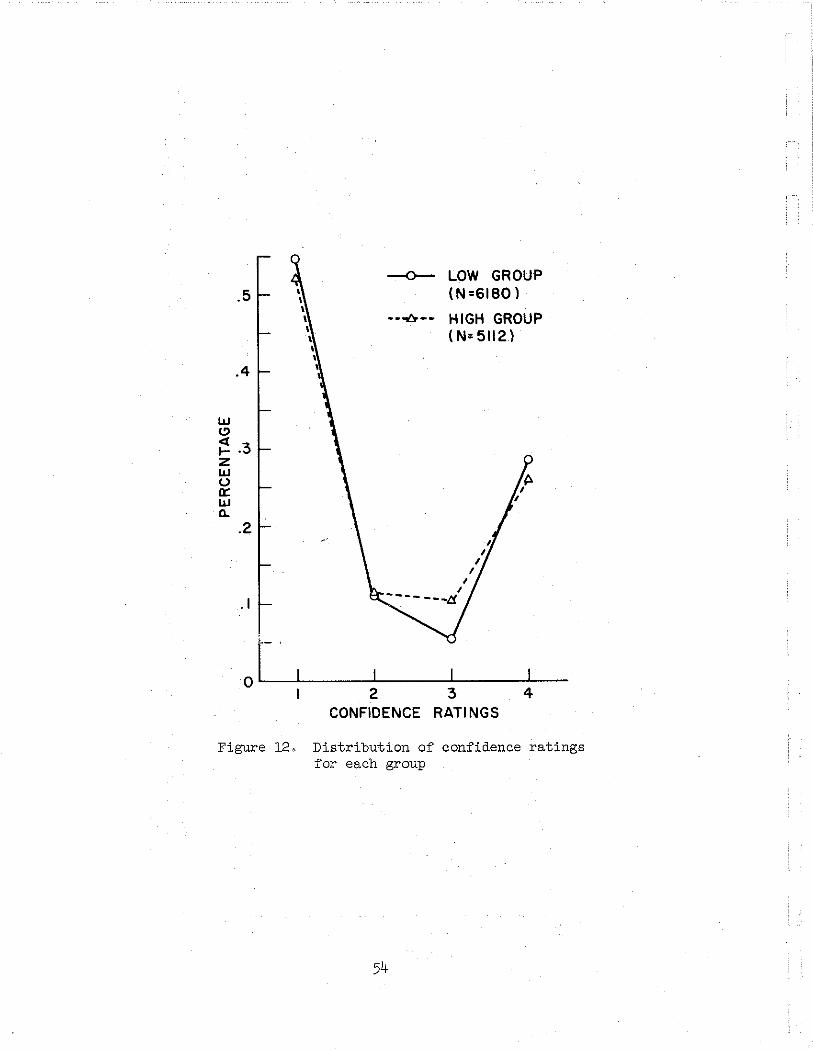
The overall distribution of the use of the various confidence
ratings for the two groups can be seen in Figure 12. The overwhelming
tendency of most subjects to be either positive they are right or posi
tive they are wrong appears even more extreme if one inspects the
individual distributions for each rating. Here one observes that
approximately two-thirds of the subjects used categories 2 and 3 less
than 5 percent of the time.
47

3.4
3.2
1IlozoUl1J . 3.01Il
2.8
2.6 '----'-__~__1..._ ...J...__
CORRECTRESPONSES
\N=66651
ALLRESPONSES
ERRORRESPONSES
\N=46271
Figure 70 Mean latencies to first letter forcorrect and error responses forcombined groups
48

3.6
3.4
3.2
lJ)
o 3.0z,oUlJJ 2.8lJ)
2.6
2.4--0-- CORRECT•• -06-- •• ERROR
2.2 '--....,....-----'-----'-----''----.........-~I 2 3
RUNS
4 5
Figure 8. Mean latencies to first letter by runs forcorrect and error responses for combinedgroups
49

~RO
---0--- R I---0--- R4
3.4
3.2
3.0
enozoUlLJ 2.Ben
2.6
2.4 N = NO. OF RESPONSESON WHICH EACHDATA POINT IS BASED
\ .\
2.2L1_LI__-.JIL-__IL-__IL-~-----ll _((N=I008) 2IN=984) 3(N=824) 4.\N=576) 5(N=372)
RUNS
Figure 9. Mean latency to first letter by condition forcombined groups
50
-0- RO---(;r-- R I-~. R4
....~"".~ ....-,"'\... ...
HIGH GROUP
l<N=5041 2(N=488) 3(N=3601 4(N=224) 51N=12815(N=244)
RUNS2(N=496) 3(N=464) 4(N=352)
LOW GROUP
\~. \
\. /''''''~\V· .~
~ ...'\"
"'b{
\(N=504)
4.0
3.8
3.6
3.4
III03.2z0U
\Jl l}j 3.0f-'
2.8
2.6
2.4
2.2
Figure 10. Mean latency to first letter by condition over runs
The low usage of categories 2 and 3 by most subjects does not,
however, invalidate the findings reported in Figure 13, where we see
the probability of a correct response given the various confidence
ratings, In this case also one may observe great individual differ
ences in the accuracy of the ratings, with a relatively few individuals
exerting a large influence on the overall averages in categories 2 and 3,
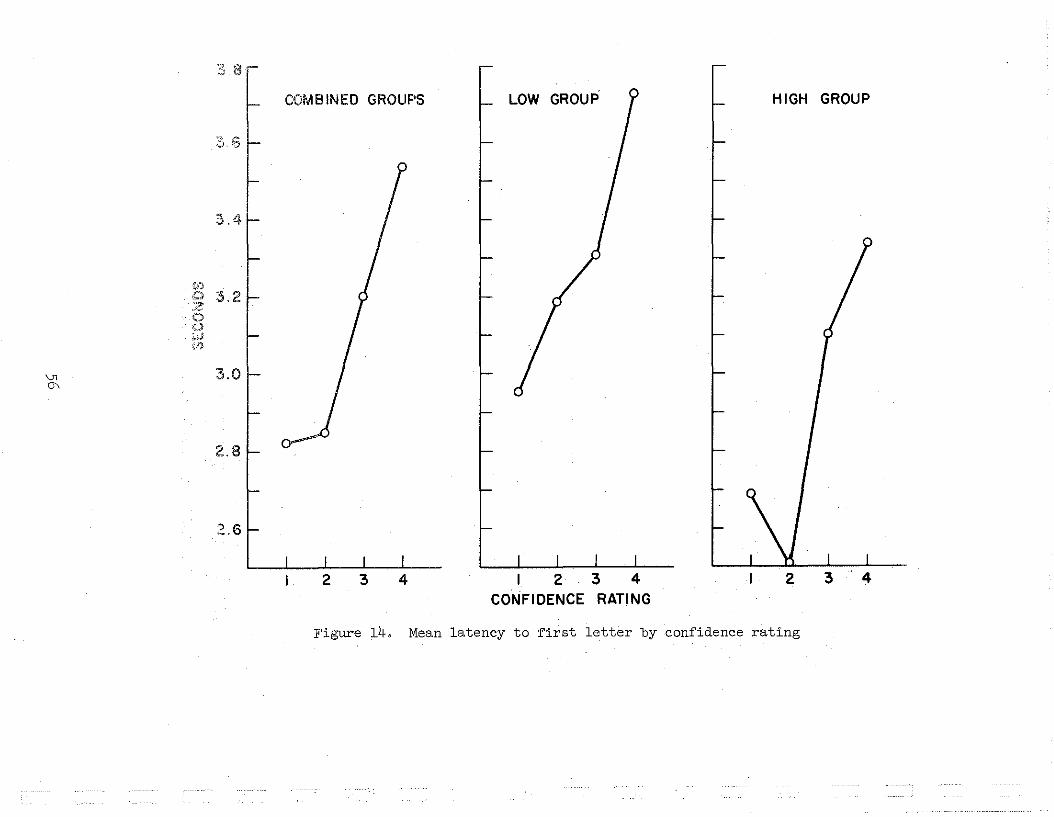
The relationship of the confidence rating to the latency to the
first letter of the response is seen in Figure 14, With the possible
exception of the latency for confidence rating 2 in the High group, the
latency measures seem to reflect the expected rising uncertainty indi
cated by the confidence rating,
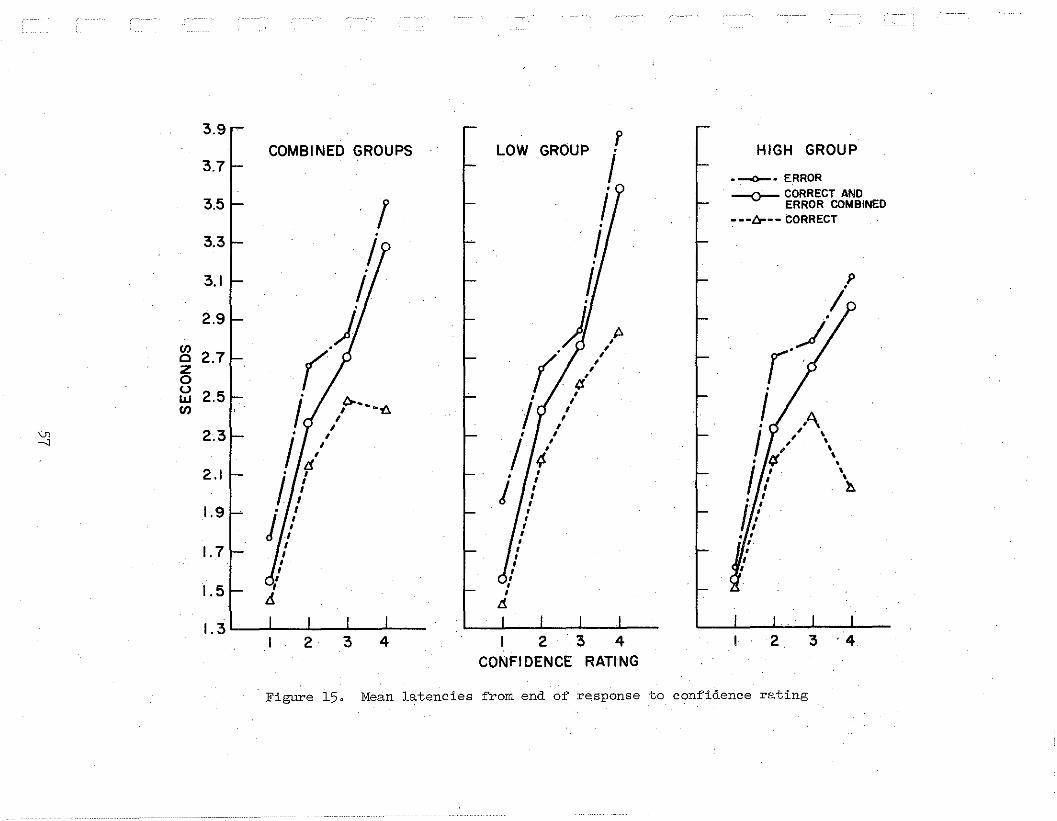
Figure 15 represents the latencies for the confidence ratings
(i,e" the time from the termination signal to the time the key for
the confidence rating measure was struck),
52
13
12
(/)o·z0UIJJ II
Vl(/)
\>l
10
N - NO. OF- RESPONSES
-o-CORRECT---6- •• ERROR
--0- RO---1:>--- R I.-0-. R4
~'\\. ,
\~~>,">'n.
.............",.~
...................
"~..........~"~
9'! J , I I
I(N=3036) 2(N=2952l 3(N=2372) 4(N=I728) 5(N=11I6)
RUNS2 3 4 5
Figure lla. Mean latency to last letter of responsefor correct and error over runs forcombined groups
Figure llb. Mean latency to last letter of responseby condition for combined groups
--0- LOW GROUP(N=6180)
._-t;,-- HIGH GROUP(N=5112)
.5
.4
wCl«I- .3zwuCl::WQ.
.2
.1
I2
CONFIDENCE
I3
RATINGS
I4
Figure 12, Distribution of confidence ratingsfor each group
54

IlN=33291 2IN=673) 31N=331l 4(N=1761l IIN=26691 2(N=5741 31N=5361 4(N=13371
CONFIDENCE RATINGS
HIGH GROUPLOW GROUP1.0
.9UJCf)
~ .8CL.Cf)UJ .70::
t;UJ .60::0::8 .5u.0 AVl
>-Vl
I-:J .3iii<f
~ .20::CL.
.1
0
Figure 13. Probability of correct response given the various confidence ratings
'-"0\
:3 8--
6
3.4
tiJCl 3.2,ZoG-_.};.,.\'Ofl
3.0
2.8
COMBINED GROUPS LOW GROUP HIGH GROUP
2.6
2 3 4 I 2 3 4CONFIDENCE RATING
2 3 4
Figure 14. Mean latency to first letter by confidence rating
\\
•,,h
3 . 42
HIGH GROUP
._. ERROR
--:r- CORRECT ANDERROR COMBINED
---~-- CORRECT
A,,,,,I;{',,
I,I
LOW GROUP
I 2 3 4CONFIDENCE RATING
43
.c.- ..... ..~I
I
2
COMBINED GROUPS
3.9
3.7
3.5
3.3
3.1
2.9
l/lo 2.7z0<.Jw 2.5l/l
V1 2.3-1
2.1
1.9
1.7
1.5
1.3
Figure 15, Mean latencies from end of response to confidence rating

CHAPTER IV
DISCUSSION OF EXPERIMENTAL RESULTS
Summary of Major Results
Analyses of variance were computed using the following major dimen"
sions: 3 Conditions (RO, Rl, R4); 2 Groups (High and Low); and Weeks
(1st through 6th). Using this model, three sets of scores were analyzed:
(1) total errors to criterion or five times through each list; (2) total
correct on retention tests; (3) difference in number correct on retention
test minus the number correct on the first time through a list. In
addition, t-tests were rlli~ to compare the difference in effects between
the various conditions.
Total Errors to Criterion. All three major dimensions were found
to be significantly different: Conditions (F ~ 20.042, P < 0001);
Groups (F ~ 8.45, p < 001); Weeks (F ~ 8.85, p < .001).
T-tests comparing conditions Rl and R4 showed R4 to be signifi
cantly superior to Rl for the combined groups, (t ~ 3.19, p < .001)
and for the low group (t ~ 3042, P < .001), but not for the High group
(t ~ .568).
Retention Test Scores. In this analysis the three major dimensions
were also significantly different: Conditions (F ~ 3.187, p < 005);
Groups (F ~ 9.91, P < 0005); Weeks (F ~ 3.34, p < .01).
T-tests for condition differences were significant beyond the 010
level in only two cases and for only the Lo'w group: RO vs. Rl (t ~ 1.86,
p < .10), and RO vs. R4 (t ~ 2.68, p < .01) 0
58

59
easy, and that only two or three trials are necessary to produce an
almost perfect score, It would seem likely that a possible difference
in the potential advantage of one condition over another would be
limited here by a "ceiling" effect on learning as a large proportion of
students in the Righ group reach criterion before five runs on a list,
Such an observati.on does not, of course, rule out the possibility
that the conditions actually do affect the two groups in different ways,
Further experiments should be able to provide some insight into this
problem by further increas~ng the difficulty level of items for the
High group,
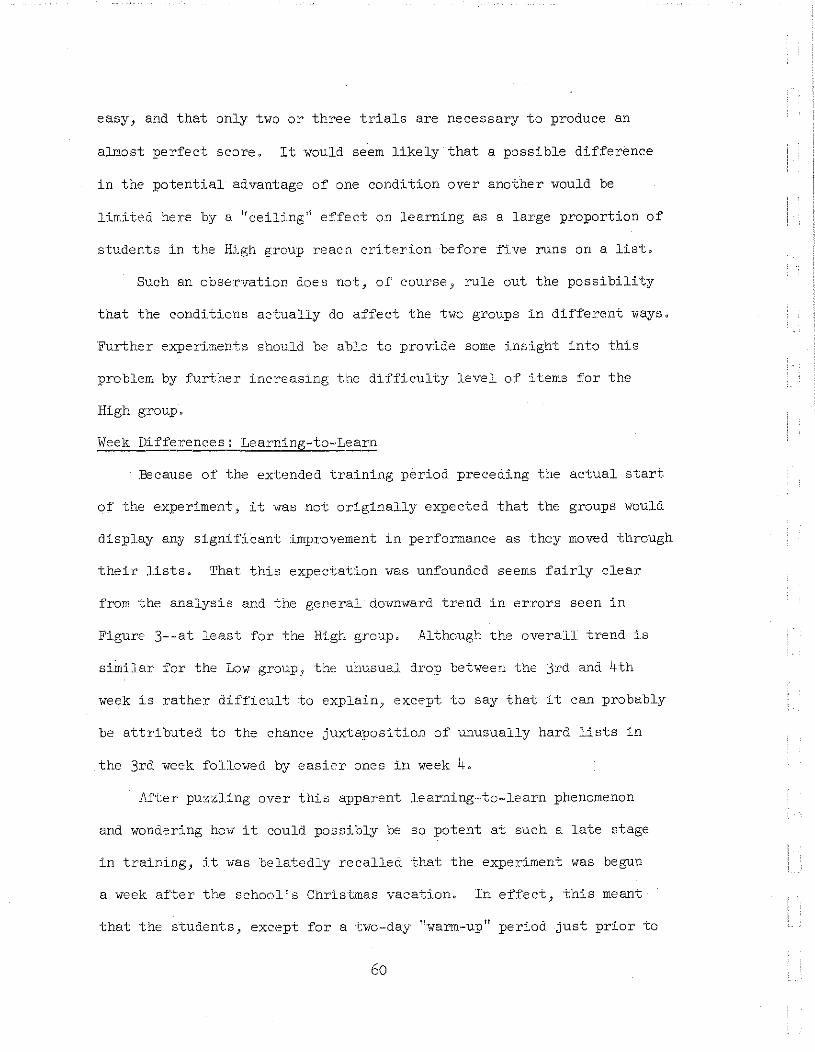
Week Differences: Learning-to-Tearn
Pecause of the extended training period preceding the actual start
of the experiment, i twas not originally expected that the groups would
display any significant i.mprovement in performance as they moved through
their lists, That: this expectation was unfounded seems fairly clear
from the analysis and the general'downward trend in errors seen in
Figure 3--at least for the High gro'~p, Although the overall trend is
similar for the Low group., the unusual drop between the 3rd and 4th
week is rather difficult to explain, except to say that it can probably
be attributed to the chance juxtaposition of unusually hard lists in
the 3rd week followed by easier ones in week 4,
After puzzling over this apparent learning-to-learn phenomenon
and wondering how it could possibly be so potent at such a late stage
in training, it was belatedly recalled that the experiment was begun
a week after the school's Christmas vacation" In effect, this meant
that the students, except for a two·-day "warm-up" period just prior to
60
the actual first run in the experiment, had not had any practice for
over three weeks. Evidently, this layoff was sufficient to cause them
to lose many of the skills necessary for the task.
Condition Effects
The one result which was consistently found through all of the
analyses--and which may be clearly seen in Figure 4, for example--is
that repetition of error items produced greater learning. This result
would seem to contradict Greeno's and Keller's findings that immediate
repetition of an item did not produce much learning on the second pre
sentation. It appears likely that the difference in the complexity of
response being learned in the present experiment, when compared with
that required in Greeno's paired-associate study (i.e., learning the
spelling of a word versus learning an arbitrary single digit response)
is sufficiently great that the extra immediate practice for spelling
was helpful. In Keller's study it should be noted that the experi
mental procedure perhaps contributed to the apparent ineffecti'veness
of the immediate repetition of a word. When a child missed a word
for the first time in Keller's experiment, he was not given the
correct spelling, but was merely told to try again. After the second
failure, the correct spelling was presented, and the child was told
to copy it. It would seem quite possible that this copying response
would involve a minimum of cognitive activity, and hence would perhaps
not help the student in his future attempts to recall the word.
In regard to distributed practice on error items, the results of
the present experiment are less clear, but seem potentially more
interesting. The R4 condition (repetition after four intervening items)
was found to be consistently superior to Rl (immediate repetition),
61

but the difference was often not significant. The important ~uestion
is whether or not this consistent trend represents an actual difference
between the effects of Rl and R4. Certainly in the analysis of total
errors to criterion and the accompanying t-test comparing Rl and R4
(see Tables 3 and 4), the difference between these conditions for the
Low group seems substantial 0 However, the fact that none of the
analyses produced a significant difference between Hl and R4 for the
High group indicates that we must be cautious in our inferences. While
it seems plausible that the relative ease witb. which the High group
learned the words may have acted to limit the potential real differ
ences between condition effects, we can not be certain that this was
actually the case. Therefore in the following discussion our effort
to explain the consistent superiority of R4 over Rl admittedly rests on
the assumption that this difference in condition effects was not a
chance phenomenon.
Any attempt to account for the possible superiority of R4 must of
necessity be highly speculative. As a theoretical framework this
description will rely strongly on the conceptualization of memory
processes proposed by Atkinson and Shiffrin (1967), although no
attempt will be made to app~y their mathematical models.
If we recall the experimental procedures, we will remember that
the subjects were given no indication as to the condition under which
a word was presented. They therefore had no idea if a word was going
to be repeated--either immediately or a few items later. (This state
ment is not strictly true after the first run on a list, for there was
the possibility that a subject would recall that a particular word
62
was or was not going to be repeated. Interviews with the subjects
at the conclusion of the experiment, however, revealed that if such
recall was occurring, they were not aware of it.)
It will be recalled that when a subject missed a word, he was
given the correct spelling, followed by a six-second study interval
before the next item was presented. We shall assume that during this
interval whatever strategy the student used to try to learn the word
was not dependent on the condition. If one is not willing to accept
this assumption for all runs, it certainly is valid for Run 1 on a
list when the subject could not have any idea as to which items would
be repeated. In any case, we would suggest that the difference in the
effects of the Rl and R4 conditions occurs as a result of the differ
ence in the processes used to retrieve the words from memory when they
are presented a second time.
As an example, when an Rl word is missed, it is presented immediately
again at the end of the study interval. Regardless of what strategies
the student may have used to try to commit the word to memory during the
study period, an attempt to spell the word at this point would not seem
to necessitate any search of long-term memory or any attempt on his
part to reconstruct his original strategy. All he needs to be able to
do is to keep in his short-term memory, for a period of 10 to 15 seconds,
the particular spelling he has just seen. He could seemingly accomplish
this simply by engaging in a serial rehearsal of the letters.
On the other hand, the recall of an R4 word on the second presen
tation during a run is more complex. He has in the interim between the
first and second presentation been actively engaged in learning and
recalling other words. This activity would seem to preclude any possi
bility that he may have kept the word in short-term memory through a
rehearsal process. More likely, when called upon to spell the word a
second time, he must attempt to either retrieve from long-term memory
whatever representation of the word he has stored there, or reconstruct
the spelling of the word using the strategies he devised earlier. The
retrieval process here must be much more similar to that which is ordi
narily used in generating the spelling of a word than is the case in the
second tryon an Rl word.
To summarize briefly, it is being hypothesized that the superiority
of the R4 condition perhaps can be accounted for in the kind of practice
it provides in retrieving a word from long-term memory; in contrast,
the Rl condition does not necessitate such practice since these words
can be recalled through a rehearsal process in short-term memory.
The validity of this hypothesis could perhaps be tested if one
interspersed a short interference activity after each study interval for
the words. This should prevent rehearsal of the words in short-term
memory. If one then found that the superiority of R4 over Rl was dimin
ished, a stronger argument could be made that the difference lies in
the retrieval processes.
This particular interpretation of the experimental results is quite
consistent with the idea stemming from Greeno's study that distributed
practice would be superior because it provides training in discrimination.
In this case one could speak of the R4 retrieval process as one which
constantly necessitates discrimination among similar items in long-term
memory. This notion would perhaps have greater validity if we qualified
64
it by asserting that accurate spelling does seem finally to depend on
one's ability to make precise discriminations between reasonable alter
natives; but this ability to discriminate in turn depends on the efficient
and accurate use of memory processes to retrieve these alternatives.
Retention Test Scores
Two important questions need to be discussed in relation to the
retention tests, although in neither case are definitive answers readily
obvious. The first question is concerned with the decrease on the reten
tion tests of the magnitude of the differences between condition effects;
this decrease may be observed in Figures 4 and 5, and in our analysis of
test scores. Although there is still a significant overall difference
between conditions, the effects are considerably reduced, and there is
no longer any significant difference between Rl and R4.
Given the relatively few practice trials that a student had on a
word and the length of the retention interval, this decrease is not
really surprising. What probably happened is that the subject forgot
many of the particular associational and retrieval strategies he had
developed and had only partially mastered, and in the retention test
was forced to rely on his long-term store of well-learned words and his
ability to process words on the basis of the regularity of their
spelling.
The second question to be discussed relates to the possible diminu
tion of retention test scores due to the session length. If this does
indeed account for the unexpected findings displayed in Figure 6, then
it also underscores the need for more research on optimum session
length for drills of this type. Perhaps such research would reveal
65

that the length of the session itself is not the most important variable,
but rather that the unexpected variation in the required time for a
session produces adverse effects. On the other hand, it is also possi
ble that the type of active concentration and attention required in this
kind of task is such that brief sessions are best for maximizing the
rate of learning.
Latency Data
One of the often-mentioned potential advantages of CAl systems is
that machine control of stimulus presentation enables the experimenter
to collect latency data heretofore unavailable to the educational re
searcher. There seems to be little doubt, as Suppes (1964) asserts, that
the relatively crude measures of learning we usually use in educational
research may often fail to uncover crucial and real differences between,
for example, two methods of teaching a mathematical concept.
On the other hand, latency data may reveal little information
which is not obtainable from simpler dependent measures. The crucial
distinction perhaps lies in the subtlety of the behavioral change the
experimenter is trying to detect. Given that one is uncertain as to
the magnitude of change one might reasonably expect from the experimental
manipulations, the collection of response latency data would seem to
be warranted--especially if their collection is relatively inexpensive
and simple as it is in CAl. There is obviously no guarantee that such
data will be any more informative than other measures.
In this experiment it seems fairly clear that the latency data
does not reveal important differences which were not detected by the
correct/error measure. As was pointed out earlier, this failure may in
66
part be due to the way the first latency was measured; or it could simply
be due to the fact that there were not any real significant differences
in processing time required for the various conditions.
Nevertheless, the fact that the measured latencies in this experi
ment didn't seem to disclose unexpected information, or that they were
primarily a means of confirming information gained from simpler dependent
measures, does not negate their potential value in CAl research.
Confidence Rating Measure
As was expected for reasons pointed out earlier, it is difficult to
interpret the results for this particular dependent measure. If one
looks simply at the overall summary statistics such as those found in
Figure 13, it appears that the confidence ratings and the probability of
a correct response are related in an orderly, linear fashion. However,
the wide variation in individual accuracy and the low usage of categories
two and three would seem to place severe limitations on the usefulness of
this particular measure--at least as it was obtained in this experiment.
If a confidence rating measure is to be a valuable dependent
variable, then it would seem desirable that steps be taken to increase
individual accuracy and to encourage wider use of more than two cate
gories. Perhaps this objective could be accomplished through some
sort of feedback to the individual as to the accuracy of his confidence
rating. (For example, see Phillips, Shiffrin and Atkinson, 1967). In
our experimental situation there was no particular incentive for an
individual to try to maximize the accuracy of his rating or to use all
of the categories, since the evaluation of his response was based
strictly on his spelling. But it is also possible that for students

of this age group and ability that the degree of their uncertainty
or confidence is bipolar, and that they find it difficult to make finer
discriminations,
From a pedagogical point of view there can be little doubt that
ohildren should be encouraged to assess the accuracy of their spelling
of a word, and it seems likely that this decision process could be
improved through proper training, Further experimentation in which
such training was a principal variable could possibly provide valuable
information,
It is also possible that other indirect measures than those employed
would yield more precise knowledge as to the state of learning in the
individual. For example, it would be a relatively simple matter to
allow the student to start over when he felt he had made a mistake on a
word. Some combination of measures of the time he took on the word
and the number of re-starts he used might be highly informative.
In conclusion, it should be emphasized that the problem of trying
to obtain more sensitive measures of learning is very important--particu
larly to CAL. The power of the computer to make decisions on optimum
selection and sequencing of materials will only be realized when, and
if, we are able to find the proper dependent measures which adequately
characterize the individual's current state of learning.
68
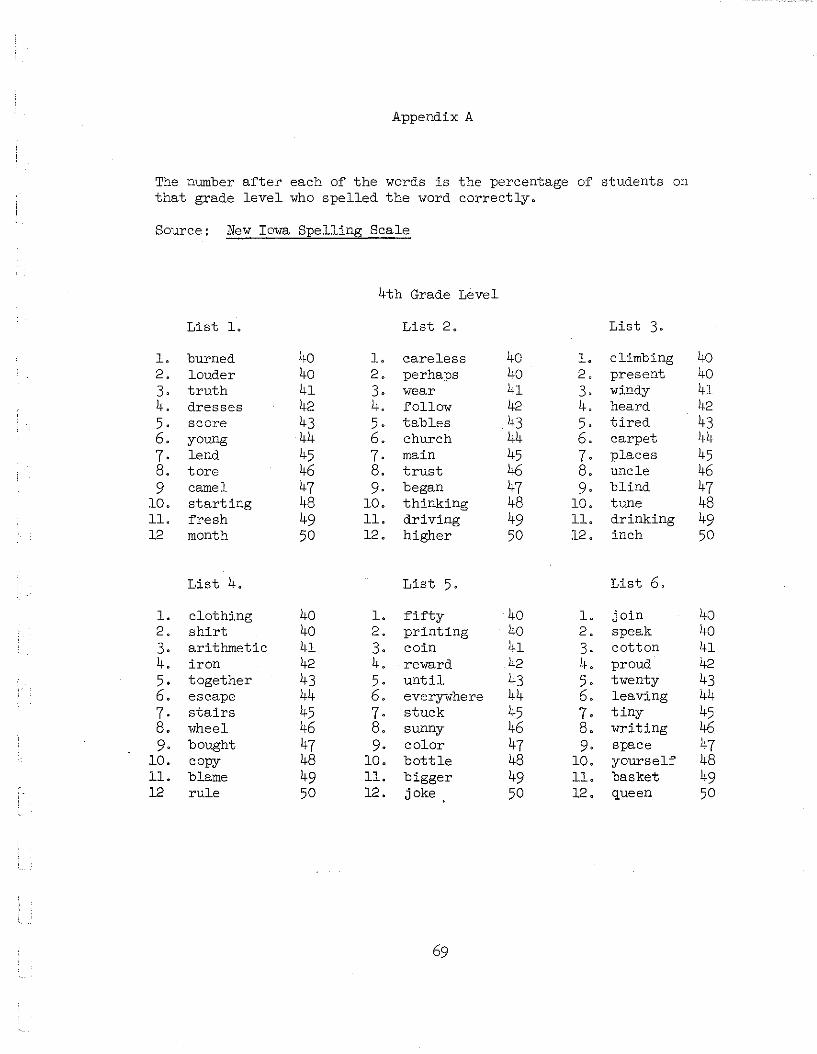
Appendix A
The number after each of the words is the percentage of students onthat grade level who spelled the word correctly.
Source: New Iowa Spelling Scale
4th Grade Level
List l. List 2. List 3.
l. burned 40 l. careless 40 l. climbing 402. louder 40 2. perhaps 40 2. present 403. truth 41 3. wear 41 3. windy 414. dresses 42 4. follow 42 4. heard 425. score 43 5. tables 43 5. tired 436. young 44 6. church 44 6. carpet 447· lend 45 7· main 45 7. places 458. tore 46 8. trust 46 8. UIlcle 469 camel 47 9· began 47 9· blind 47
10. starting 48 10. thinking 48 10. tune 4811. fresh 49 ll. driving 49 ll. drinking 4912 month 50 12. higher 50 12. inch 50
List 4. List 5. List 6.
l. clothing 40 l. fifty 40 l. join 402. shirt 40 2. printing 40 2. speak 403. arithmetic 41 3. coin 41 3. cotton 414. iron 42 4. reward 42 4. proud 425. together 43 5. until 43 5. twenty 436. escape 44 6. everywhere 44 6. leaving 447· stairs 45 7· stuck 45 7. tiny 458. wheel 46 8. sunny 46 8. writing 469· bought 47 9· color 47 9· space 47
10. copy 48 10. bottle 48 10. yourself 48ll. blame 49 ll. bigger 49 11. basket 4912 rule 50 12. joke 50 12. queen 50
69

Appendix A (cont.)
5th Grade Level
List 7. List 8 List 9
1. puzzle 40 1. harbor 40 1. fields 402. complain 41 2. theater 41 2. swiftly 413. factory 42 3. curve 42 3. double 424. human 42 4. insist 42 4. laughed 425. seldom 43 5. vanish 43 5. contains 436. rare 44 6. peanut 44 6. protect 447. earned 45 7. coward 45 7. climbing 458. towel 46 8. vacation 46 8. animal 469· quit 47 9· sailor 47 9· using 47
10. circle 48 10. sign 48 10. either 4811. knock 49 11. rainy 49 11. since 4912. ladies 50 12. level 50 12. tried 50
List 10. List 11. List 12.
1. cottage 40 1. control 40 1. admit 402. selfish 41 2. really 41 2. questions 413. figure 42 3. foolish 42 3. habit 424. machine 42 4. partner 42 4. rough 425. dining 43 5· lying 43 5. oranges 436. telephone 44 6. wilderness 44 6. agreed 447. picture 45 7· quarter 45 7· shoulder 458. cloudy 46 8. explain 46 8. pencils 469. whose 47 9. elect 47 9. nicest 47
10. flight 48 10. kitchen 48 10. velvet 4811. chief 49 11. howling 49 11. interest 4912. steel 50 12. taught 50 12. thrill 50
70
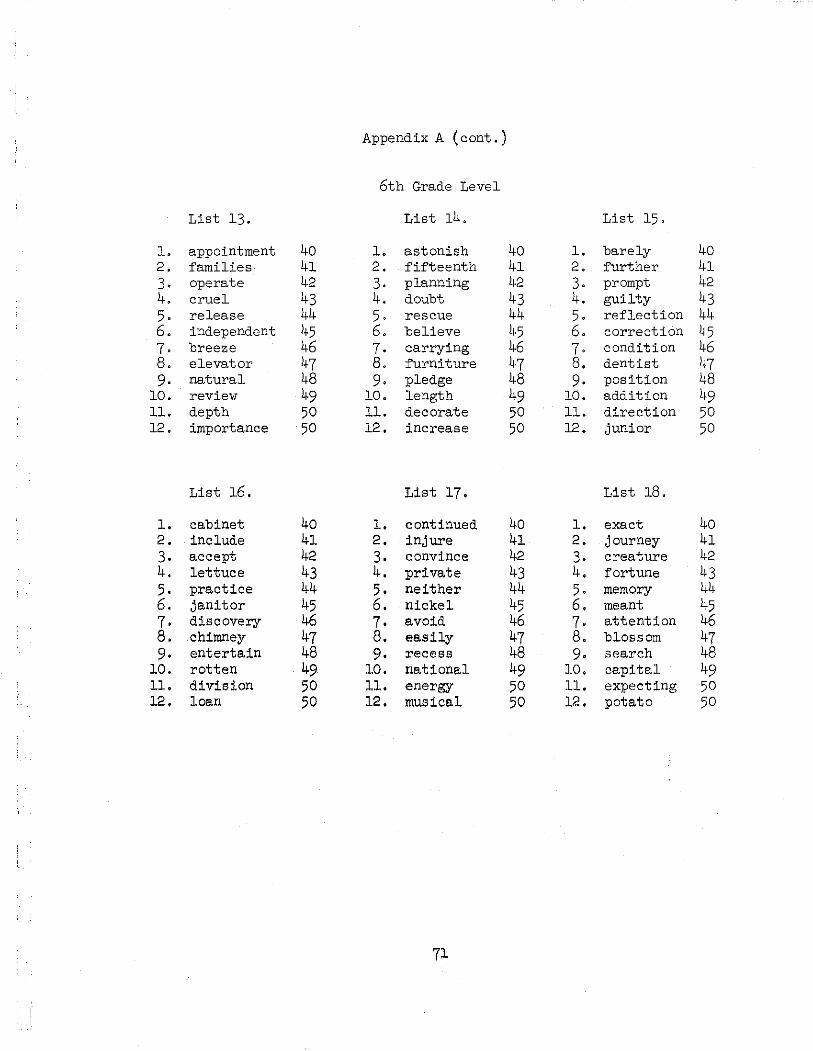
Appendix A (cont. )
6th Grade Level
List 13. List 14. List 15.
1. appointment 40 1. astonish 40 1. barely 402. families 41 2. fifteenth 41 2. further 413. operate 42 3. planning 42 3. prompt 424. cruel 43 4. doubt 43 4. guilty 435. release 44 5. rescue 44 5. reflection 446. independent 45 6. believe 45 6. correction 457. breeze 46 7. carrying 46 7· condition 468. elevator 47 8. furniture 47 8. dentist 479· natural 48 9. pledge 48 9· position 48
10. review 49 10. length 49 10. addition 49n. depth 50 n. decorate 50 n. direction 5012. importance 50 12. increase 50 12. junior 50
List 16. List 17. List 18.
1. cabinet 40 1. continued 40 1. exact 402. include 41 2. injure 41 2. journey 413. accept 42 3. convince 42 3. creature 424. lettuce 43 4. private 43 4. fortune 435. practice 44 5. neither 44 5. memory 446. janitor 45 6. nickel 45 6. meant 457· discovery 46 7. avoid 46 7. attention 468. .chimney 47 8. easily 47 8 . blossom 479· entertain 48 9. recess 48 9. search 48
10. rotten 49 10. national 49 10. capital 49n. division 50 11. energy 50 n. expecting 5012. loan 50 12. musical 50 12. potato 50
71
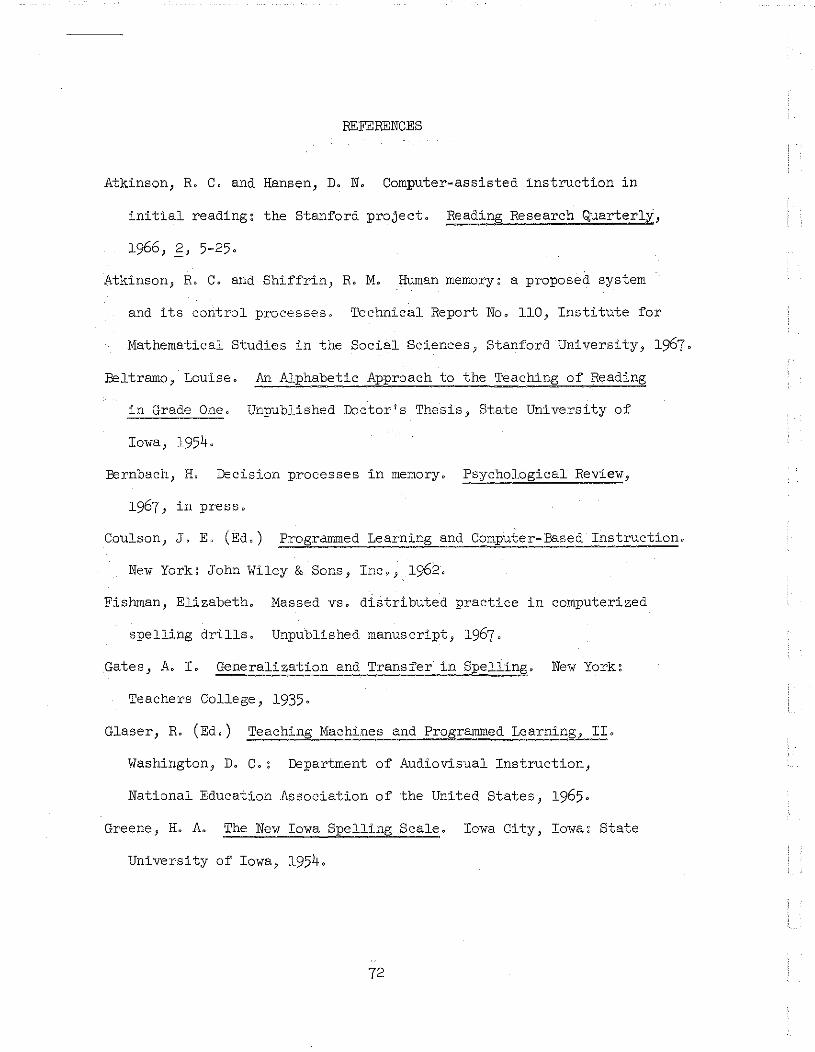
REFERENCES
Atkinson, R. C. and Hansen, D. N. Computer-assisted instruction in
initial reading: the Stanford project. R~ading Research Quarterly,
1966, ~, 5-25.
Atkinson, R. C. and Shiffrin, R. M. Human memory: a proposed system
and its control processes. Technical Report No. 110, Institute for
Mathematical Studies in the Social Sciences, Stanford University, 1967.
Beltramo, Louise. An Alphabetic Approach to the 'reaching of Reading
in Grade One. Unpublished Doctor's Thesis, State University of
Iowa, 1954.
Bernbach, H. Decision processes in memory. Psychological Review,
1967, in press.
Coulson, J. E. (Ed.) Programmed Learning and Computer-Based Instruction.
New York: John Wiley & Sons, Inc.,. 1962.
Fishman, Elizabeth. Massed VB. distributed practice in computerized
spelling drills. Unpublished manuscript, 1967.
Gates, A. I. Generalization and Transfer in Spelling. New York:
Teachers College, 1935.
Glaser, R. (Ed.) Teaching Machines and Programmed Learning, II.
Washington, D. C.: Department of Audiovisual Instruction,
National Educati.on Association of the United States, 1965.
Greene, H. A. The New Iowa Spelling Scale. Iowa City, Iowa: State
University of Iowa, 1954.
72
73

Suppes, P., HYman, L., Jerman, M. Linear structural models for response
and latency performance in arithmetic. Technical Report No. 100,
Institute for Mathematical Studies in the Social Sciences, Stanford
University, 1966.
Suppes., P., Jerman, M., and Groen, G. Arithmetic drills and review on
a computer-based teletype. Technical Report No. 83 , Institute for
Mathematical Studies in the Social Sci.ences, Stanford University, 1965.
Wilson, H. A., and Atkin30n, R. C. Computer-·based instrllction in
in initial reading: a progress report of the Stanford project. In
H. Levin and Joanna Wi.lliams (Eds.), Baslc Studies on Reading,
1967, in press.
74