Speedboat to Tugboard Conversion
42
Final Report RC Speedboat to Tugboat Conversion Team 64 Matthew Thomas, Hamish Smeele, Kenny Lei, Tae Lee and Raymond Lau (left to right)
Transcript of Speedboat to Tugboard Conversion

Final Report RC Speedboat to Tugboat Conversion
Team 64 Matthew Thomas, Hamish Smeele, Kenny Lei, Tae Lee and Raymond Lau (left to right)

Table of Contents
Pg #
Customer Needs Assessment 2
Goal Statement 2
Specification Table 2
Need/Metrics Matrix 3
Gantt Chart 3
Summary of Rough Concepts 4
Down Selection 9
Prototype Designs 10
Nozzle Prototype Design 10
Flow Channel Design Prototype 12
Simple Deflector Prototype Design 11
Final Design Improvements on Stock Boat 11
Flow Channel Theory 12
Deflector Theory 12
Adding Weights 13
Test Procedures and Test Results 14
Operating Procedure 17
Operating Guidelines 18
Maintenance 18
Environmental Impact 18
Marketability 18
Cost Analysis 1819
Final Recommendations 19
Division Responsibility 20
1

Customer Needs Assessment The needs of our consumers determined our design parameters. We surveyed people of different backgrounds to determine their needs for this product. (See Appendix for survey) Based on the results of the surveys, the main design parameters that were consistently required were price, reliability, and improved thrust of the tug boat. The consumers valued reliability and improved thrust over all the other needs of the tugboat. It was noted that the majority of the audience interested in the products were between the ages of 12 and 16.
Table 1: Importance of Customer Needs (3= most important, 2=moderately important 1=least
important) Goal Statement Design a modification kit for the ‘Double Horse KMarine 7009’ RC boat to optimise the pulling force as the primary objective. The optimization of speed, manufacturing cost, reliability, and aesthetics of the boat are secondary objectives. The design must meet the constraints that the customer requires. The target market is teenage RC enthusiasts. Specification Table Below is a chart we constructed that shows the needs of our customers with metrics that support the needs. The marginal and ideal values describe what we want our final design to achieve. We removed metrics for durability because it was impossible to determine the amount of cycles our boat can withstand before failure.
Table 2: Specification Sheet
2

Needs and Metrics Matrix
Table 3: NeedsMetric Matrix
Table 4: Gantt Chart
3

Summary of Rough Concepts Each group member produced three design concepts each and included why each design modification would be effective as a design solution. Terrence
Flow Channel (Design A) Initially designed to attach to the rudder shafts, this design channels the flow without constricting the flow rate from water beneath the boat. We ended up going with this idea after we failed to have success with fitting the nozzle beneath the rudder shafts.
Higher Angled Propeller Shaft (Design B) Designed to counterbalance the moment caused by thrust that would cause the boat’s front to pitch up. It would also be lower in the flow stream where the issue of flow aeration would no longer be a problem. This idea was abandoned due to the projected loss of horizontal thrust and the difficulty associated with repositioning the internal components.
Tripropeller/drive shaft (Design C) Designed to have more thrust due to additional propeller blade surface area. Two external shafts would drive two propellers propellers. Idea abandoned due to difficulty of repositioning internal components to fit additional shafts. This design would also Also projected power loss due to gear connections was high. This idea also required modification of hull exterior. Hamish
4

Cylindrical Nozzle (Design D) A simple cylindrical nozzle around the propeller. Half the nozzle will be exposed under the boat in order to allow water flow. Redistribute internal components to move the COM towards bow. Idea was abandoned in order to pursue the more promising variable area nozzle.
Variable Pitch Blades (Design E) Blades 3D printed with hex geometry on ends. Hex end of blade fit into a central cavity which connects to the central shaft. Blade pitch can be reinserted into the propellor mount to alter the pitch of the propellor. Redistribute internal components to move the COM towards bow. Idea abandoned because of logistical difficulties in attaching the propeller mount to the drive shaft and difficulties attaching the blades to the propeller mount.
Stabilizing wings (Design F) 3D printed hydrofoil attached to hull of the boat. Redistribute internal components to move the COM towards bow. This allows for the boat to better balance itself and prevent tipping over which is common during high speed or in unsettled waters. Proposed idea defied the rules which states that the body of the boat cannot be modified or have parts attached. Kenny
5

Tripropeller/drive shaft: Belt Driven (Design G) Use gears inside the boat to connect the center propeller shaft to two other shafts on each side for 3 propellers. The idea is to increase the amount of propellers and thrust power. Idea was abandoned due to the energy loss associated with belt gear connections and logistics of fitting 3 shafts with the internal components.
Longer Drive Shaft Behind Boat (Design H) Increase the length of the propeller shaft to allow better water flow between the boat and the propeller. Idea was scrapped as the extended propeller shaft left no room for the rudder which was necessary for the control of the boat. Also the propeller would be farther away from the boat’s center of mass, which would result in less thrust.
3 Series Propellers 1 Shaft (Design I) In this design, we are connecting two additional propellers to the same propeller shaft that may increase the amount of traction on the water. Idea was abandoned as the propellers would have to be positioned WAY too close to one another in order for them to fit between the rudder and the rear of the boat Raymond
6

Nozzle with Variable Orientation (Design J) Attach a nozzle with a curved cross sectional area which may be turned by the steering mechanism of the rudder.. The idea of this is that the smaller area of the outlet, relative to the inlet, will result in a great force from the water exiting. This should be true based by Bernoulli's Equation. Idea abandoned because too difficult to manufacture and propeller hits nozzle when attached.
Straight Nozzle with dual Propeller (Design K) Along with a straight nozzle, attach an additional propeller to the propeller shaft. The extra propeller may be able to allow more traction and increase the thrust of the boat. Idea abandoned because not enough room between boat and rudder.
Nozzle (Design L) Using the same curved nozzle as design one, position the rudder back behind the nozzle instead of using the turning mechanism on the nozzle. This was the idea we prototyped first. Matt
7

Larger Propeller (Design M) Larger propeller would theoretically mean more mass flow and more distance to torque on the water. This would require altering the rudder shaft and 3D printing a new propeller. Idea abandoned due to difficulty in modifying rudder shafts. Also blades would be out of the water. Converging Diverging Nozzle (Design N) For this design, we connect three different sized propellers on the same propeller shaft in ascending order. The nozzle will have a curved shape to fit each propeller. Too difficult to create, not enough projected benefit. Reversed Boat Direction With Rammer (Design O) Instead of the propellers being in the back of the boat, we move them to the font. This would result in the frontal pull instead of a rear push. Idea abandoned as there is little evidence of benefit. Also the increased flow of water from the propellers would counteractively push the boat in the opposite direction prefered.
8

Deflector (Design P) This design allows the flow to be directed in the axial direction, which increases the thrust of the boat. Without the deflector, energy is lost when water flows through the hole between the rudder shafts. This idea was one of the viable designs we tested. Down Selection Each team member came up with 3 prospective design ideas. We evaluated our designs against our specifications and narrowed our original 16 design ideas to the 3 most likely to improve our thrust. To see these designs and how we decided which to pursue see appendix. A pugh chart was created using metrics from the specifications and the 3 designs using the flow channel concept as the datum for comparison. The nozzle scored best and so we prototyped the nozzle.
Table 5: Pugh Chart
Manufacturing Cost This is the estimated cost of producing each design idea. All three of our ideas were 3D printed, therefore our cost would only be based on the amount of volume being printed. Battery Life The propeller resistance is what causes the battery life to diminish. Since we kept the same propeller on all three designs, no resistance was added to the propeller. Improved Pulling Force Pulling force was measured from a static pull test which is described later on in the report. We estimated the nozzle to have the highest pulling force, because of the increased exit velocity of the flow. Modification to Hull and Rudder Shafts The constraints of this design project prevented us from doing any modifications to the hull and rudder shafts of the boat. All three designs were attached to the drive shaft of the boat. Aesthetic Appeal Elegant design, looks appealing to consumers Low Time of Assembly Estimated time necessary to add or remove modification Tows at Reasonable Velocity Predicted velocity improvement of towing for modification
9

Speed While Not Towing Predicted velocity improvement of towing for modification Prototype Design Nozzle Design Prototype A nozzle prototype was produce in solidworks by revolving the NACA 4415 foil profile with 5 degrees of pitch. The inlet area was created as large as possible and the pitch was optimised for the approximate reynolds number of the flow to produce a maximum lift to drag ratio. The prototype was 3D printed using ABS.
Figure 1: Nozzle Prototype
After prototyping the nozzle and printing two iterations we were unable to find a sufficient way to attach the nozzle to the boat because the propeller blade was not concentric. For the static testing, we attached the nozzle with tape to the rudder shafts as a temporary support. After testing we found a decrease in performance of the static thrust. Although the nozzle increased the exit velocity of the flow, it significantly decreased the inlet area of the propellor and thus the mass flow rate through the propellor. Thus we concluded that the nozzle was not the best design to pursue. Flow Channel Design Prototype The next design favored by our Pugh Chart was the flow channel. The flow channel was designed in order to block the entrance of air into our flow stream and guide the flow in an axial direction. The deflector was designed to sit on top of the rudder shafts with a tab that connected to the propeller shaft. Testing proved that it improved our force by 5%.
Figure 2: Flow Channel
We derived the following formula for thrust from Reynolds Transport Theorem with multiple assumptions and found that increasing our mass flow would increase our pulling force.
10

We were unsure if the flow channels side tabs were impeding flow into the propellor so we created the simple deflector. The channel flow design decreased aeration of the propellor more than the simple deflector due to the fins on each side. Simple Deflector Prototype Design
Figure 3: Simple deflector
The simple deflector showed only a 1% an increase from the stock boat and so we found that the tabs to direct our flow in the axial direction were necessary. Therefore we redesigned the flow channel with inlets before the propeller and added weight at the front of the boat to balance our moment and have the flow go more in the axial direction. We recorded a 16% increase in thrust from the stock boat.
Figure 4: Final Design
Our Final Design Improvements upon Stock Performance
● Our final design increased our thrust from our stock boat by 16% however our towing velocity stayed about the same
● The modification improved our boats stability with an increase in control of our boat while towing
● The stock boat is quick and easy to convert into a tug boat taking an average of 2 minutes to retrofit
● Our design is durable and can withstand fracture from a drop of 4 feet while attached to boat ● Our design consists of only a single plastic piece with no mounting hardware and is therefore
an optimized design for cost Deflector Theory
11

During testing it was noted that a significant amount of water exited the propellor upwards. This design blocks the exit of the water upwards instead fluid will have to exit the propellor in the xdirection. The deflector also helps prevent the propellor from being ventilated by air. The deflector should reduce the speed that the boat planes at due to the dynamic pressure on the deflector creating a torque on the boat.
Figure 5: Aeration of Propellor during static testing
Flow Channel Theory Model D was designed so that it did not impede the flow of water into the propellor whilst also minimizing aeration of the propellor and deflecting water in the horizontal direction. It has an opening in the front to increase inlet mass flow. Model D below became our final design.
Figure 6: Four Prototypes
Adding Weights We added weights to the boat to adjust the tilt of the boat so that the propellor so that the boat was in the horizontal direction. It was noticed during static testing that the oscillation of the boat in the vertical direction was significant in reducing the thrust by aeration of the propellor. By minimising vertical direction forces we reduced the oscillation of the boat Adding weight also decreased aeration of the propellor by submerging it further into the water.
12

Figure 7: Diagram of Forces on Boat
By tilting the boat in 5 degrees to front, the amount of the force generated by the propeller gets maximized in horizontal direction. We compared the initial thrust between stock and stock with weights. As a result, the initial thrust increased by approximately 10%.
Weights (25g on each side) (in front near PCB)
Maximum mass from the scale (g)
Maximum pull strength (N)
No 395 3.871
Yes 413.75 4.054
Test Procedures & Test Results
A. Static Test
Figure 8: Static Testing Diagram
In order to compare the tugging force between prototypes, we calculated max thrust for the boat by using a scale and pulley system inside a fish tank. Scale values would fluctuate so we recorded the most consistent value for our pull force. We did several tests and averaged the results to get our values for comparison.
13

Table 6: Test Results from Static Pull Test
Model A had a significant decrease in pulling force compared to the stock due to a lack of mass flow as explained in the design prototype section. Other models(from B to D2) showed higher values than the stock from the test because they are designed to prevent loss of the mass flow due to airflow. B. Speed Test
Speed Test without a barge
Speed Test with a barge
On a water tunnel of 40 feet, we measured the time the boat takes for to reach from one end to
another. And we ran another test with a barge attached to the boat.
Model With a barge Weights Time(s) Average speed of
14

(in front near PCB)
(average of 2 runs)
the boat (m/s)
Stock no no 5.5 1.35
yes N/A N/A N/A
With modification
no yes 6.5 1.53
yes yes 31.6 0.387
Table of result from the speed test The data in the table above are the averages of two runs. We did not have a chance to run speed test with the stock boat with the barge. In fact, the time we got from the speed test with the modification when pulling the barge was 31.5 seconds which was close to the average time the class got. This showed that our modification, with an increase in thrust when the boat is static, did not increase either the terminal velocity or the pulling force when the boat is running at constant speed.
15

Operating Procedure Conversion Steps: Step 1: Using a Phillips head screwdriver, remove the two screws on each side of the rudder, as shown in Figure 2. Step 2: Once the screws are removed, the rudder will disassemble along with the two attached rods, as shown in
Figure 3. Step 3: As shown in Figure 4, remove the nut securing the propeller with a slipjoint plier. When the nut is removed,
the propeller should easily slide off of the shaft. Step 4: Run the bottom shaft of the boat through the hole of the deflector from the kit. The deflector should be
placed between the two rudder shaft entries as shown in Figure 4. Step 5: Put together the disassembled parts in reverse order of the steps above. The final assembly should resemble
that of Figure 6.
Figure 1 Figure 2 Figure 3
Figure 4 Figure 5 Figure 6
Safety issues In order to install our kit, the user must disassemble the parts of the stock boat. When doing so, tiny parts such as the nut, rudder shafts, and propeller will be detached and may be a choking hazard for toddlers nearby. Make sure there is adult supervision when using tools for assembly. Do not attempt to disassemble the boat’s battery. Operation guidelines
16

When operating the boat, make sure the frequency is clear of interference. When tightening the nut onto the propeller shaft, make sure it is not too loose or too tight. If the nut is turned too tight, it may over stress the plastic and wear it out or even cause it to break. Once installed, check if the deflector wiggles, if it does, continue to tighten. Repeat until it feels secure. Before operating the boat, make sure the deflector is not in the way of the rudder, as well as the propeller. Maintenance When the deflector is not in use, make sure it is stored in a rigid container to prevent applying pressure to the sides of the deflector which may cause it to snap. The deflector can be cleaned with water, but is not dishwasher safe. Keep the deflector away from high heat which may cause it to melt and deform. When disposing the kit, be sure to recycle the plastic. Environmental Impact The modification kit is to be produced from ABS which is recyclable. Since the modification kit is 3D printed it significantly reduces its environmental impact of the product. The kit does not produce waste from packaging or carbon emissions from transportation. The modification kit does not require disassembly which means that it can be recycled at low cost. Marketability A tug boat modification kit would be purchased by someone who already owns an RC boat. A hobby shop owner in Canada reported online that on average he sells about 100 RC cars to every 1 RC boat. The leading maker of RC cars sold about 1 million RC cars in the last 4 years. Since they have the largest market share that approximately 2 million RC cars were sold in the last 4 years in Canada. This would mean that about 5000 RC boats would be sold annually in Canada. We can proportion this number by population size. The US has 6 times as many people as Canada so this would mean that approximately 30,000 RC boats are sold annually in the US. Assuming 20 percent of RC boat owners would be interested in our product we find that we have a market of at most 6000 pieces sold per year. Cost Analysis Since we have a relatively small market of prospective customers molding may be too expensive. Molding machinery is expensive and our design is of complicated design requiring high level of tolerance so the molding die would also be expensive. Therefore our means of production will be 3D printing. We will assume our 3D printer costs us 3000 dollars and the printing material costs 20 dollars per kg. Our design could be printed in 30 minutes by printing 2 designs at a time, if we optimize our printing we could get our time to 20 minutes. We will assume that we will pay an employee at 8 dollars an hour to print our pieces. Putting all of these assumptions into a formula we get the following.
17

Final Recommendations Our final design produced significant improvements for our primary goal of increasing pulling force within the strict constraints of our project and limited project time. More improvement could be made to secondary design goals of speed, manufacturing cost and reliability. https://www.youtube.com/watch?v=HgFbGAdLdM
18

Division of Responsibilities Matthew Thomas
● Led the team concept generations ● Generated the prototype test plan ● Led the down selection process ● Conducted Cost Analysis for the production and distribution of the final design ● Ran calculations for the drag experienced by the boat
Hamish Smeele
● Conducted design understanding research and calculations for the stability of the boat ● Led the designs of rough concepts as well as viable concepts ● Final Presentation ● Created nozzle prototype design ● Weekly Reports ● Generated the final prototype design
Kenny Lei
● Conducted research and calculations for design understandings in boat propulsions with the focus on nozzles and propellers
● Created propeller design model accordingly ● Led documentation ● Managed project goal and processing schedules ● Worked with boats electrical components for power delivery
Tae Hee Lee
● Manufactured design prototypes ● Managed deconstruction and decomposition of the boat ● Charge of 3D Printing the parts ● Conducted fabrication ● Led the creation of Solidworks CAD drawings and the Bill of Materials
Raymond Lau
● Led the performance tests ● Conducted surveys and assessment for customer needs. ● Created NeedsMetric Matrices accordingly ● Managed specifications sheet
19

<Appendix> Table of contents
1. Analysis……………………………………………………………..……………….21 28
2. Engineering Drawings …………………………………………………………...…29 38
3. Weekly Report …….…………………………………………………………....…..39 40
20

1. Analysis Decomposition
The PCB receives a radio signal from the remote controller (RC) which contains throttle information. The PCB controls the electical power to motor, which delivers mechanical power to the drive shaft. Then the power is transmitted from the drive shaft power to water. Cost Analysis (with Bill of Material) Parts name Part
Number Estimated cost
(commercialized) Mass production cost
(~100 units) Materia
l 1 Servo 0640115
C $12.95 $10.36 Plastic
2 Screw propeller 0640215C
$0.293 per gram of plastic
$0.02 per gram Plastic
3 Motor+Mount 0640315A
$4.53 $4.5 +$0.02 per gram Plastic +
stainless steel
4 Main shaft 0640415C
$0.40
$0.02 per gram Stainless steel
5 Copper tube 0640515C
$0.1 per gram of copper
$0.01 per gram Copper
6 Tail vane parts (rudder)
0640615A
$0.293 per gram of plastic
$0.02 per gram Plastic
7 Top cover 0640715C
$0.293 per gram of plastic
$0.02 per gram Plastic
8 Hull (boat body) 0640815C
$0.293 per gram of plastic
$0.02 per gram Plastic
9 7.2V NiMH battery
0640915C
$17.15 $17.15 NiMH
10 PCB(power control box)
0641015A
$0.293 per gram of plastic
$0.02 per gram Plastic
21

Power Delivery Battery
● The stock battery is a 7.2V battery. ● The current per hour is labeled as a 700 milliamperehour. ● The battery, with the boat running at full throttle, lasts between 15 to 20 minutes. We
calculated that it has a mass of 0.073 kilograms. ● The battery takes roughly 5 hours to fully charge. ● The power capacity is theoretically calculated with P=IV which gives 700mAh * 7.2V = 50.4
Motor ● The motor used is an RS 370 motor. ● Data from another team suggests that the motor spins at around 3300 rpm. ● The internal resistance of the motor is around 3.4 ohm. ● From the D.C. motor torque vs speed curve, we see that the higher the torque the lower the
rotational speed.
22

Boat Drag From our tests of the boat pulling a spring, we find that the motor and propeller pull on average about 1 pound or 0.285kg. Assumption: At max velocity the boat’s thrust is balanced by the drag of water on it which is why it no longer accelerates. Our terminal velocity, found by performance testing was approximately 3 m/s. To find the coefficient of drag of our boat, we can use these experimentally found values in the drag formula:
F drag = 21 Vρ 2 ACdrag
. = Cdrag
Fdrag.5 ρV A*
2
Where A is the area of the back of the submerged boat. The area is approximately 0.1m by .075m = .075m2, so:
Cdrag = .133 Looking at engineering toolbox it says that a long streamlined object has a typical coefficient of drag of 0.10 and so this method seems to have gotten within a respectable factor of accuracy. Thrust Design A factor in analyzing the performance of a propeller is its pitch. The pitch is the distance that the propeller travels from one rotation. We must find the most efficient pitch to use for our tugboat. If the pitch is too high, the motor’s RPM and torque will be reduced. On the other hand, if the pitch is too low then the top speed will be reduced and the acceleration will be increase. Since we are converting a speedboat to a tugboat, we are not as concerned about top speed. Thus, it may be in our favor to have a propellor of low pitch, which will give us a higher acceleration which will help us get our load moving.
It is convenient, in terms of manufacturing, for our propellor to have 4 blades. Generally, with more blades, the boat will obtain better balance and distribution of pressures. However, it may not always help as more blades also increase drag which may be counter effective.Blade shapes mainly comes in four forms: Naca, B.Troost, Ogival, and Hybrid. For a 4 blade propeller, a blade area ratio of 55% is optimal.
23

Tug vessels utilize nozzle designs to increase trust. Nozzles concentrate the pressures induced by the rotating propellers to a certain direction to maximize the efficiency of the work done by the propellers. There are two main types of nozzles: Kort Nozzle and Rice Nozzle. The Rice nozzle proves to be better as it has a drag coefficient of about 17 times less than that of the Kort Nozzle. We can see from the figure below that the Rice speed nozzle increases speed as well as pulling power which will be good for dual mode.
Rice Thrust Nozzle Profile:
A onebladed causes the least drag, however it lacks balance. Thus, twobladed propellers are usually standard. Three bladed propellers provide a smoother acceleration because one blade will always be in the water. According to Top Notch Marine, a threebladed propeller is generally used when the objective is to attain the highest top speed, while the fourbladed propeller is usually used to attain a faster hole shot and reduced vibration. The downside of a fourbladed propeller is less steering torque.
24

Pitch ratio can be determined by dividing the pitch of a propeller by its diameter. The optimal pitch ratio for tug boats is between 0.55 to 0.80, for heavy cruisers is 0.65 to 1.0, and for fast cruisers is 0.9 to 1.5. Based on this research, we created a propeller, shown below, on solidworks that fits our prefered specifications. However, it was scrapped as majority of the group voted to focus on the nozzles and deflectors.
25

Nozzle Theory and Design A nozzle can be used to increase the max propulsive force on the boat. A simple Reynolds transport theorem calculation (back of the envelope) was used to estimate the force increase that could be produced.
Assumptions: ● Volume of control volume does not change ● Incompressible flow and continuity ● Uniform velocity profile at inlet and outlet ● Pressure is the same on either side of the nozzle ● V1 ~ 0 during static test ● F = 2.84N without nozzle Reynolds Transport Theorem:
(ρv)dV v(v )dAFCV = ∫
CV
∂∂t + ∫
CSρ ∙ n︿
cv v(v )dAF = ∫
CSρ ∙ n︿
v vQ = A1 1 = A2 2 ρQṁ = = v vρA1 1 = ρA2 2
ρ(v A A ) Q ( )FCV = 22
2 − v12 1 ~ − ρ 2 1A2
With no nozzle: F = 2.84N, A2 = 1452 mm2 Q = 2.05E3 m3s1⇒
With nozzle: Assuming Q remains constant A2 = 1260mm2 F = 3.34N (18% increase over stock)⇒ Reynold Number: If Re > 4000 flow from the nozzle will be turbulent
V 0.1 ms1 (max velocity before turbulence)e 000R = 4 = μρvl = 0.001 Pas
(1000)∙v∙39mm ⇒ ≃
Turbulence is a significant problem with this design due to small nozzle diameter and high velocity. Since flow will be almost always turbulent it is hard to model, we decided to prototype a propellor and test in a tank.
26

The nozzle should also increase the thrust force due to the lift generated by the foil design. Boat Stability The balance of forces/moments on the boat is important in considering the stability and performance of the boat.
Figure 2A: Forces acting on the boat Assuming that the force generated on the barge is only due to xdirection forces:
Figure: Simplified Force Balance in xdirection
Sum of Forces on Boat in xdirection:
∑
FNet Barge = F Px − FD,Boat − FD,Barge
27

To increase the force on the barge we can either decrease the plane of the boat ( ), increase FP orӨ decrease the drag on the boat/ barge.The planing angle of the boat without modification was measured as 10 degrees using a slow motion camera. Weight to submerge the boat: Because we did not want to risk damaging our motor/battery, we did not do an actual submerging test. However, we can estimate the forced required to submerge the boat by using the archimedes principle. Doing a force balance we see that the buoyancy force should equal the mass gravity force when completely submerged. The weight of the boat is approximately 3.4 Newtons. Simplified to a rectangular box, the boat is approximately .35 m long, .075 m wide and .06 m tall.
Buoyancy = Vρ
= 1000kg/m3ρ
V = .35 m * .075 m * .06m = .00158 m3
Mass of displaced water = Mass of boat + Mass of added weight
Mass of added weight = Mass of displaced water Mass of boat
With these, we calculate that the boat can take approximately 2.73 pounds before being completely submerged. Angle to Flip boat: Testing in a bathtub we found that we could tilt the boat approximately 60 degrees before it would roll over. Weight distribution: The centre of mass (C.O.M) was measured by measuring the from the rear of the boat which cause it to begin to fall of the edge of a table. We found that the center of mass was 105 mm from the rear of the boat. 2. Engineering Drawings
28
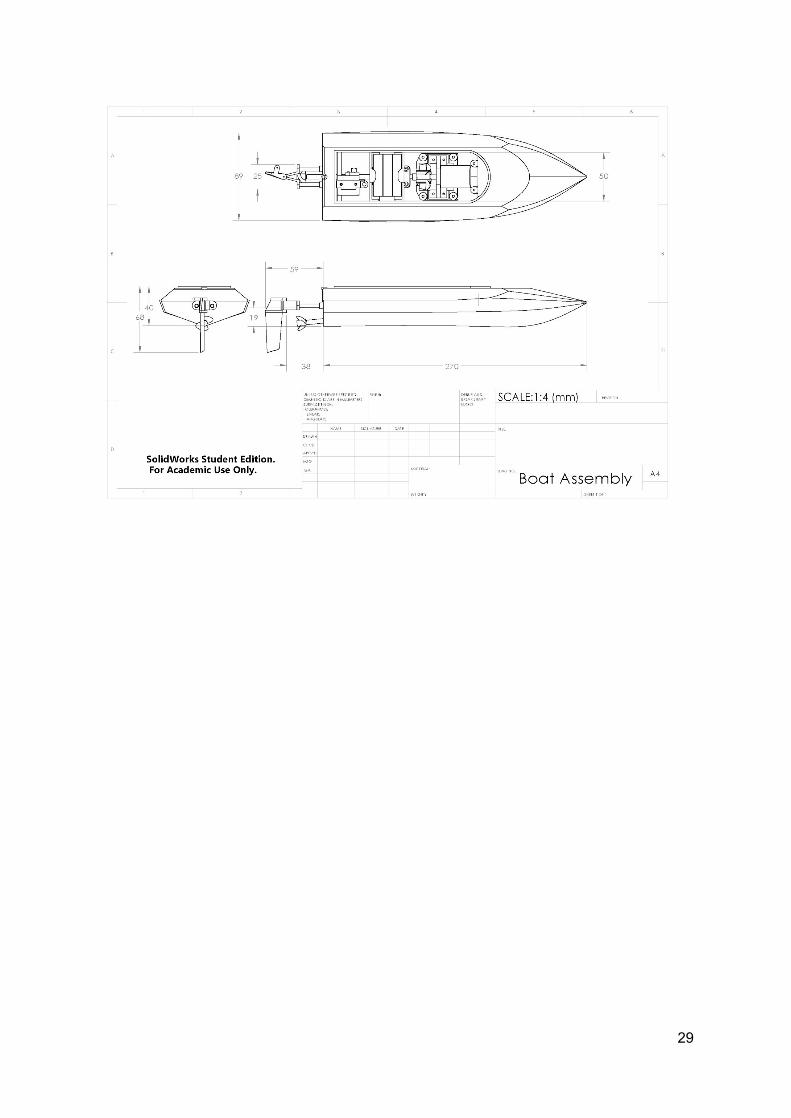
29

30

31

32

33

34

35

36

37

38

39

3. Weekly Reports Week One
● Completed group roles/responsibilities ● Code of ethics ● Gantt Chart completed ● Organised TA meeting time
Week Two ● Raymond Did performance testing, pulling weighted bottles ● Decided metrics for performance testing
Week Three Tuesday
● Group Met with TA and discussed design/manufacturing/performance testing Friday
● Each person in the group to submit three concept designs for meeting Friday Week 4. ● Pugh chart to be completed from concept designs. ● Deconstruction of boat started ● Boat performance tested in pool ● Matt is group leader ● CAD meeting Monday 1012 AM ● Performance testing in Pool, top speed, turning radius
Week Four Tuesday
● Majority of CAD work completed except for body/shaft. ● CAD to be finished by Friday week 4 ● Start preparing documentation for presentation.
Friday ● Divided up responsibilities for the midterm.
Week Five Tuesday
● All CAD work completed ● Each group member drew up three design ideas(total of 15) in which we vote upon.
Friday ● Divided up powerpoint slides objectives to each member ● Discussed midterm roles of each member ● Gathered and organized most of the midterm documents
Week Six Tuesday
● Organized documentation for the midterm review Week Seven Tuesday
● Hamish email lecturer, email molding epoxy expert, EOM analysis ● Kenny Propellor sourcing research ● Raymond Propellor sourcing research ● Matt Research extend rudder mounting
40
● Raymond Prototype the nozzle from pipe Week Eight
● Tested nozzle ● Constructed Deflector
Week Nine ● Start Final Project Report ● Start Final Project Presentation
Week Ten ● Finish Final Project Report ● Finish Final Dynamic Performance Testing
41