
Spectroscopy: Lecture 6 - SOEST K. Sharma HIGP, University of Hawaii, Honolulu, USA Spectroscopy:...
40
Shiv K. Sharma HIGP, University of Hawaii, Honolulu, USA Spectroscopy: Lecture 6 Infrared spectroscopy and Its Applications in Geophysics and Materials Sciences www.soest.hawaii.edu\~zinin GG 711: Advanced Techniques in Geophysics and Materials Science
Transcript of Spectroscopy: Lecture 6 - SOEST K. Sharma HIGP, University of Hawaii, Honolulu, USA Spectroscopy:...

Shiv K. SharmaHIGP, University of Hawaii, Honolulu, USA
Spectroscopy: Lecture 6
Infrared spectroscopy and Its Applications in Geophysics and Materials Sciences
www.soest.hawaii.edu\~zinin
GG 711: Advanced Techniques in Geophysics and Materials Science

Outlines
Infrared Spectroscopy
Absorption Spectroscopy
Near Normal Reflectance Spectroscopy
Diffuse Reflectance Spectroscopy
Thermal Emission Spectroscopy

EM Spectrum in the UV-IR Spectral Range
Infrared refers to that part of the electromagnetic spectrum between the visible and microwave regions. Frequency, ν (nu), is the number of wave cycles that pass through a point in one second.It is measured in Hz, where 1 Hz = 1 cycle/sec. Wavelength, λ (lambda), is thelength of one complete wave cycle. It is often measured in cm (centimeters). Wavelength and frequency are inversely related: and where c is the speed of light, 3 x 1010 cm/sec.
……… (i)
Energy is related to wavelength and frequency by the following formulas:
……… (ii)
Where h = Planck’s constant, 6.6 x 10⁻³⁴ joules-secNote that energy is directly proportional to frequency and inversely proportional to wavelength.
The IR region is divided into three regions: the near, mid, and far IR. IR spectra are sometimes reported in
μm, although another unit, ν (nu bar or wavenumber , cm-1, (1/λ where wavelength is in cm,), is currently preferred.

IR Spectroscopy
• IR Absorption SpectroscopyLaboratory characterization of minerals and materials
• Near Normal Reflectance SpectroscopyLaboratory applications for determining both n and k as a function of λ
• IR Reflectance SpectroscopyDiffuse Reflectance or Bi-directional Reflectance spectroscopy has both laboratory and remote sensing applications
• Thermal IR Emission SpectroscopyHas both laboratory and remote sensing applications

Absorption of infrared light
• Excitation of molecular vibrations, & phonons (quanta of lattice vibrations) in a crystal.Identification of molecular bonds, crystal structures, morphology
Intensity I0(λ) I(λ)
Sample
When photons enter an absorbing medium, they are absorbed according to Beers Law:
I = Io e-kx (i)
where I is the observed intensity, Io is the original light intensity, k is an absorption coefficient and x is the distance traveled through the medium. The absorption coefficient is traditionally expressed in units of 1/cm (inverse cm) and x in cm. Equation (i) holds for a single wavelength. At other wavelengths, the absorption coefficient is different, and the observed intensity varies. The absorption coefficient as a function of wavelength is a fundamental parameter describing the interaction of photons with a material.

Specular & Diffuse Reflection and Thermal Emission
• Near Normal reflection is the mirror-like reflection of light. The Fresnel’s equation for the reflection of normal incident radiation isr = (n - ik -1) / (n + ik + 1) = r eiθ
Where n and k are the real and imaginary part of refractive index, and θ = phase angleReflection R = (r)2
Using Kramer-Kronig analysis1 values of both n and k as a function of λ can be calculated from reflectivity data.
• Diffuse reflectivity or bi-directional reflectivity is measure 10-degree off normal or the light source to avoid back-scattered light and to maximize the intensity of the absorption bands. In diffuse reflection photons may get multiple reflection or scattering in between the grains, some may get absorbed and some escape from the surface. These escaped photons (diffusely reflected) photons carry information about the absorption of the material or the chemical fingerprints. Diffuse reflectance spectroscopy in the visible and near infrared (VNIR) spectral region has been successfully used for remote sensing of minerals.
• Thermal Emission spectroscopy (TES)3 measures thermal radiation emitted from the surface of an object which is due to the object's temperature relative to a blackbody that is at the same temperature as the sample.
1Philipp & E. A Taft, Phys. Rev. 113, 1002-1005 (1959).2Gaffey, S. J., Amer. Mineral. 71, 151-162 (1986).3Ruff, S.W. et al., J. Geophys. Research, 102, (B7), 14,899-14,913 (1997).

Sample Preparation for IR Absorption Spectroscopy
1. LIQUIDS:• Place a small drop of the liquid compound on one of the KBr or NaCl plates. Place
the second plate on top and make a quarter turn to obtain a nice even film. Place the plates into the sample holder and run a spectrum. If the sample is too concentrated, separate the plates and wipe one side clean before putting them back together.
2. SOLIDS• A mull is prepared by grinding the sample with mineral oil and sandwiching the
resultant paste between sodium chloride plates.
• The solid can be dissolved in a solvent and placed in a special cell, called a solution cell, which is made of sodium chloride. This gives what is called a solution spectrum.
• A KBr pellet is prepared by grinding the solid sample with solid potassium bromide (KBr) and applying great pressure to the dry mixture. Again, KBr is chosen because it is transparent to infrared radiation. If the pellet is prepared properly, one can actually see through it, as through a pane of glass.
• Prepare a thin film of the solid samples by compressing powdered samples between diamond anvils of a high pressure diamond anvil cell.

Schematics of the Mao-Bell type diamond anvil cell. The cylinder-piston assembly is labeled (1) and (2) Pressure is generated by tightening the drive screw (7). Other parts include: (3) thrust block, (4) fulcrum, (5) lever, (6) main body and (8) Belleville washers.
Diamond Anvils
Diamond Anvil Cells
Typical the high pressure anvil face is ~0.8 mm diameter, thickness 2 mm, and base ~3 mm diameter.

Ray Path in Diamond Anvil Cell Used for High Pressure Raman Scattering
Diamond Refractive index
ηdiamond = 2.4195 at 589.3nmCritical angle for diamond:θc = Sin-1 (1/ ηdiamond )
θc = 24.4˚If the height of diamond anvil is h and the radius of opening is r
θD = tan-1 (r/h) Typically r = 1 mm and h = 2 mm
θD = 12.7˚ and Ф = 32.1˚NAt = 0.53Only rays with θ < 5.80 will pass directly out of the cell (e.g., ray α) but others (e.g., rays βand γ) with 5.8 < θ <12.70 will be collected after reflection from the walls ofthe support material.
Adams, D. M. et al. Appl. Optics, 16, 2572-2575 (1977).

Diamond Anvil Cell with KBr Lenses for IR Absorption Spectroscopy
The beam condenser: right, the condenser lens (40-mm diam) and left, the collection lens (KBr, 25-mmdiam); .
Adams, D. M. & S. K. Sharma J. Phys. E., 10, 838-842 (1977); Appl. Optics, 18, 594-595 (1979).

Dispersive IR spectroscopy Instrumentation
The δ(NO2) region of KNO2 in a gasketed DAC. Gasket, 0.1-mm thick Inconel; hole, 0.4-mm diam. The reference beam was attenuated with a mask having a 0.4-mm diam hole, and ×20 scale expansion was used. Spectral slit width 3.7 cm-1. Over-all transmission of sample ~0.86%. At ambient pressure the sample is in phase II but has transformed to phase IV by 1.7 GPa (10 kbar = 1GPa).(a) Single scan without beam condenser; (b) Single scan with beam consenser.
Adams & Sharma, Appl. Optics, 18, 594-595 (1979).

IR Spectra of carbonate minerals in KBr pallets
Scheetz, B. E. and White, W. B., American Mineralogist, 62, 36-50 (1977)

Characteristic IR Absorption Frequencies of closed Polyhedra

The limits of characteristic vibrations of "closed" and "open" atomic polyhedra in minerals

FT-IR Spectroscopy Instrumentation
sample
Mercury cadmium telluride (HgCdTe) photoconductive detectors ( 0.8-25 μM)

Normalized IR spectra of MgSiO3 annealed at various temperatures
S. P. Thompson et al. (2002) Astronomy & Astrophysics, 395, 705–717.
Amorphous phase
Crystallites with many differentSi-O stretchingModes around 10 μm, Amorphous state gives broad Si-Oband.
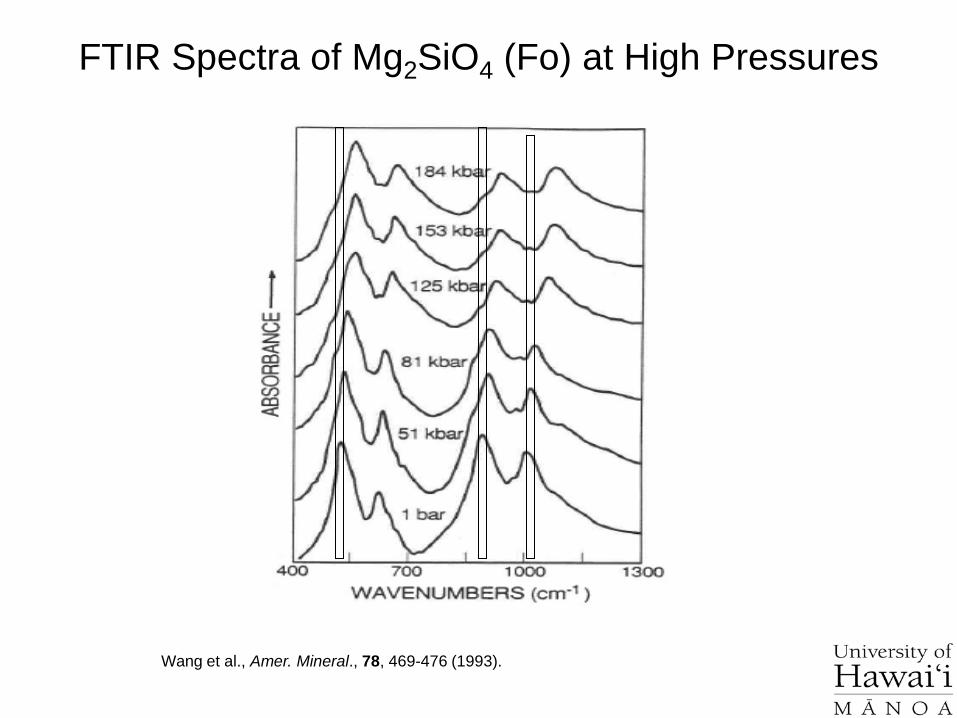
FTIR Spectra of Mg2SiO4 (Fo) at High Pressures
Wang et al., Amer. Mineral., 78, 469-476 (1993).

Reflectance Spectroscopy
• A lot of initial development work in the field of reflectance spectroscopy was done in the Planetary Science Group at UH
• Paul G. Lucey uses reflectance airborne spectroscopy in the 7.5-11.5 microns range
http://www.higp.hawaii.edu/~lucey/
• Roger N. Clark at USGS is one of the leading scientist in the use of reflectance spectroscopy for remote sensing.
http://speclab.cr.usgs.gov/

Atmospheric Transmission of Radiation
The drop in transmission toward the ultraviolet is due to scattering and strong ozone absorption at wavelengths short of 0.35 µm. Ozone also displays an absorption at 9.6 µm. Oxygen absorbs at 0.76 µm in a narrow feature. CO2 absorbs at 2.01, 2.06, and a weak doublet near 1.6 µm. Water causes most of the rest of the absorption throughout the spectrum and hides additional (weaker) absorptions from other gases.
The mid-IR spectrum in shows the effect of doubling CO2, which in this case is small compared to the absorption due to water. While we will see that the spectral region near 1.4 and 3 µm can be diagnostic of OH-bearing minerals, we can't usually use these wavelengths when remotely measuring spectra through the Earth's atmosphere.

Relative Reflectance of Powdered Quartz Sample
The reflection maxima are called the restrahlen bands: the location of fundamental vibrational stretching modes in the near and mid-infrared. The combination of n and K at these wavelengths often results in high reflectance.

Index of Refraction & Extinction Coefficient from Reflectance Spectrum of Quartz
The complex index of refraction in Figure shows important properties of materials. The index of refraction decreases to a minimum just before a sharp rise (e.g. at 8.5 and 12.6 µm). The minimum is often near or even below n = 1. The wavelength where n = 1 is called the Christensen frequency. This reflection maximum is called the restrahlen band: the location of fundamental vibrational stretching modes in the near and mid-infrared. The combination of n and K at these wavelengths often results in high reflectance.
Hapke (1993) Introduction to the Theory of reflectance and Emittance Spectroscopy for details).

IR Normal Reflectance and Absorption Spectra of Stishovite Measured with a FT-IR Spectrometer
Hofmeister, A. M., American Mineralogist 75, 951-955 (1990).
Natural
Synthetic

Raman Spectra of Stishovite
Raman spectra of stishovite. The lower spectrum has been recorded on a sample heated at 800 K and subsequently quenched at room temperature. Note the new bands (NB1 and NB2) superimposed on those of perfect stishovite( S). NB1 and NB2 are characteristic of silica glass with Si in four-fold coordination.Gillet, P. et al. (1990) J. Geophys. Res., 95 (B13), 21,635–21,655
Stishovite tetragonal (rutile-type structure) have two formula units in the primitive cell and the irreducible representation∑op= Alg (R)+A2g(IR)+A2u(IR)+B1g(R)+B2g(R) +2B1u (IR)+
Eg(R)+3Eu (i.a.)

Reflectance Spectra of Carbonates
Calcite powders
Combination and overtone bands of the CO3 fundamentals occur in the near IR. The two strongest are v1 + 2v3 at 2.50-2.55µm (4000-3900 cm-1), and 3v3 at 2.30-2.35 µm (4350-4250 cm-1). Three weaker bands occur near 2.12-2.16 µm (v1 + 2v3 + v4 or 3v1+ 2v4; 4720-4630 cm-1), 1.97-2.00 µm (2v1 + 2v3; 5080-5000 cm-1), and 1.85-1.87 µm (v1 + 3v3; 5400-5350 cm-1). The band positions in carbonates vary with composition.
Gaffey, S.J., J. Geophys. Res. 92, 1429-1440 (1987)

Spectra of three dolomite samples with different iron contents
FeO in wt.% in CaMg(CO3)2 determined by X-ray fluorescence spectroscopy. Feature near 0.45μm in second spectrum due to Fe3+ inthe sample formed by weathering
FeO
Gaffey, S.J., J. Geophys. Res. 92, 1429-1440 (1987)

Reflectance spectra of hectorite, halloysite, kaolinite, chrysotile, lizardite, and antigorite showing vibrational
bands due to OH
The overtones of water are seen in reflectance spectra of H2O-bearing minerals. The first overtones of the OH stretches occur at about 1.4 µm and the combinations of the H-O-H bend with the OH stretches are found near 1.9 µm. Thus, a mineral whose spectrum has a 1.9-µm absorption band contains water (e.g. hectorite and halloysite in Figure, but a spectrum that has a 1.4-µm band but no 1.9-µm band indicates that only hydroxyl is present (e.g. kaolinite in Figure) has only a small amount of water because of the weak 1.9-µm absorption but a large amount of OH).
Hectorite: Na0.4Mg2.7Li0.3Si4O10(OH)2; Halloysite: Al2Si2O5(OH)4 (monoclinic); Kaolinite: Al2Si2O5(OH)4 (Triclinic)
Asbestos
Chrysotile; Lizardite:
Mg3(Si2O5)(OH)4
Antigorite:
Mg2.25Fe2+0.75(Si2O5)(OH)4
Clark, R.N., et al., J. Geophys Res. 95, 12653-12680 (1990).
Clays

Thermal Emission Spectroscopy

Thermal IR Spectrometer

Thermal Emission Spectrum of quartz
Emissivity, ε = εsample (T) / εblackbody (T)

α-Quartz IR Emission, Reflectance and Transmission Spectra
http://minerals.caltech.edu/FILES/Index.html
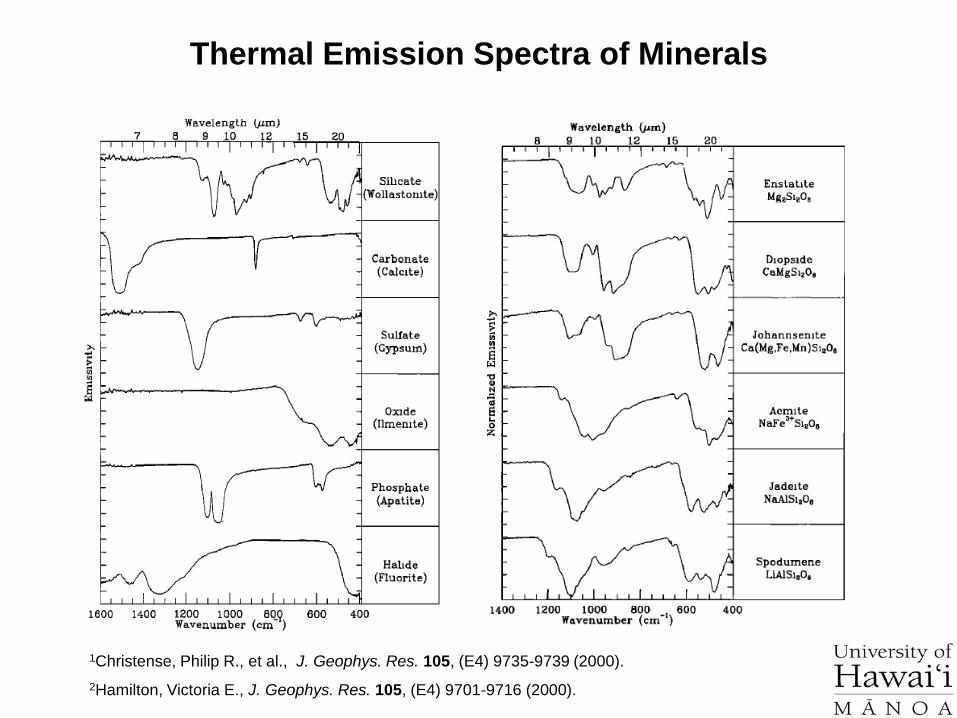
Thermal Emission Spectra of Minerals
1Christense, Philip R., et al., J. Geophys. Res. 105, (E4) 9735-9739 (2000).2Hamilton, Victoria E., J. Geophys. Res. 105, (E4) 9701-9716 (2000).

Thermal Emission Spectra of Carbonate Minerals
CaCO3
MgCO3
MgxFe1-x CO3
FeCO3
MnCO3
ZnCO3
CaMg(CO3)2
Ca(Mn,Mg,Fe2+)(CO3)2

Mars Exploration Rover (MER) Sensing System
http://marsrovers.jpl.nasa.gov/mission/spacecraft_surface_instru.html
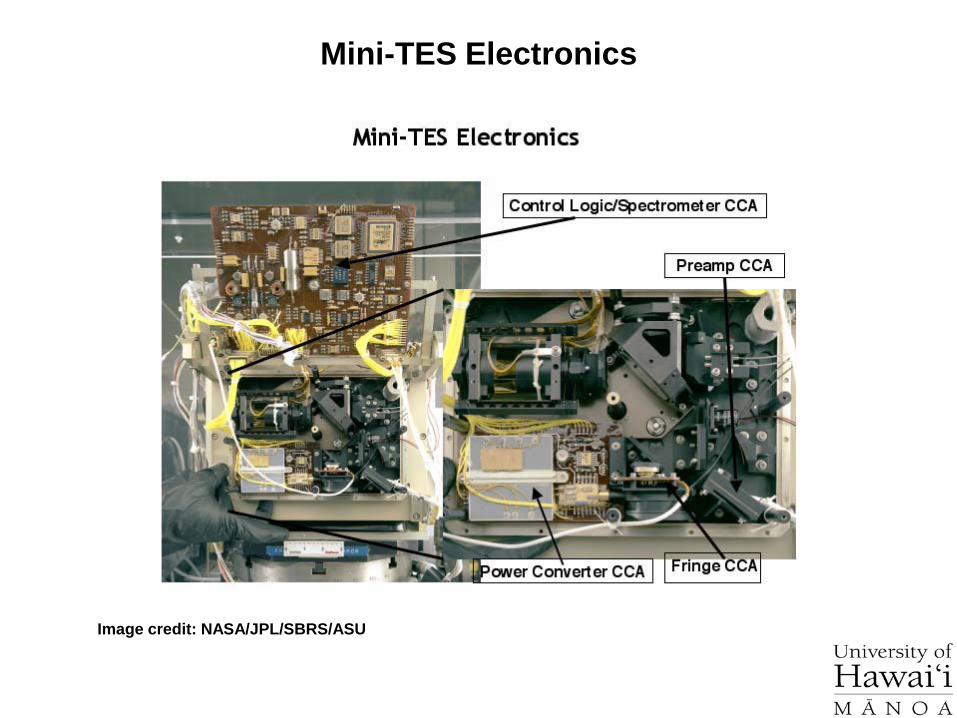
Mini-TES Electronics
Image credit: NASA/JPL/SBRS/ASU

Mini-TES Optical Bench
Image credit: NASA/JPL/SBRS/ASU
Mini-TES is located in the body of the rover at the bottom of the "rover neck," known as the Pancam Mast Assembly (PMA). Scanning mirrors located in the Pancam Mast Assembly act like a periscope to send light down to the instrument. This structure allows Mini-TES to see the terrain around the rover from the same vantage point as Pancam. Mini-TES looks one way, and the Pancams looks the other way. To make observations of the same location from both of the instruments, the Pancam Mast Assembly (the rover's neck) must be commanded to swivel. Mini-TES telescope is a 6.35-cm diameter Cassegrain telescope

Mineral Hematite
Polished Mineral Slice of Banded Hematite Globular Hematite
Speckled Hematite Fe3+2O3 Goethite Fe3+O(OH)
If the hematite on Mars formed under wet conditions, Mini-TES may find Goethite.

Mineral Magnetite (Fe3+2Fe2+O4)
Magnetite granules
If the hematite on Mars formed under dry conditions, Mini-TES may find Magnetite but no Goethite.
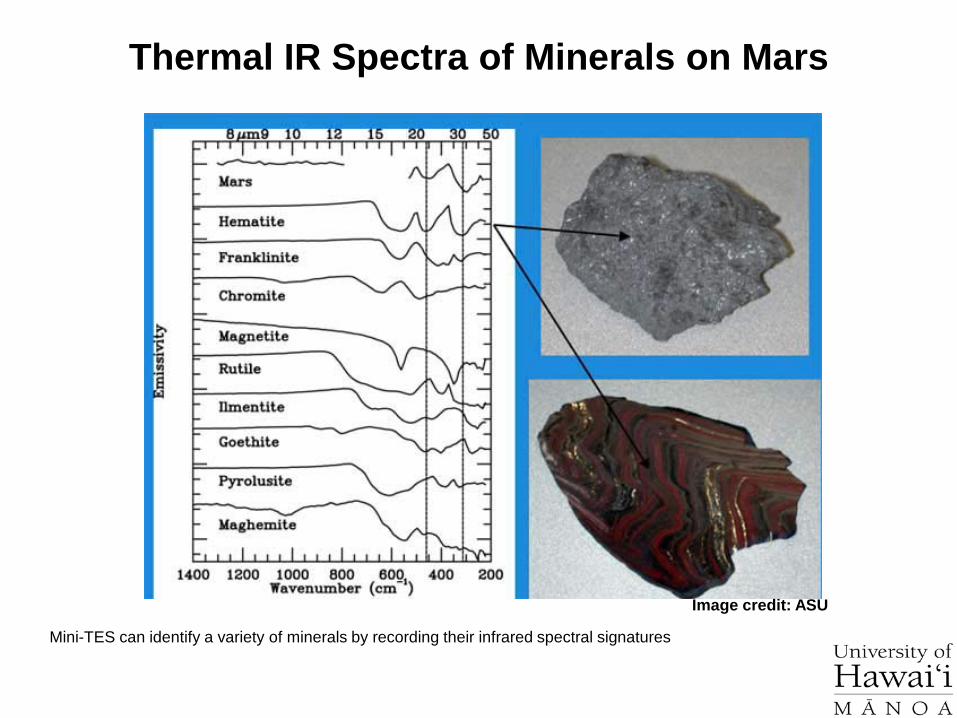
Thermal IR Spectra of Minerals on Mars
Mini-TES can identify a variety of minerals by recording their infrared spectral signatures
Image credit: ASU

Summary
Infrared absorption spectroscopy can be used to identify synthetic and natural minerals and glasses from their IR fingerprints.
Diffuse reflectance in the near and mid-IR can be used in the laboratory and remote sensing of mineral classes.
Thermal emission spectroscopy (TES) in the mid-infrared is being used successfully in the laboratory as well as for remote sensing of minerals.
Reading:• Farmer, V.C., The Infra-Red Spectra of Minerals, (V.C. Farmer, ed.)
Mineralogical Society, London, 539pp (1974). • Burns, R., Mineralogical Applications of Crystal Field Theory, Second
Edition, Cambridge University Press, Cambridge, pp. 551 (1993). • Franc C. Hawthorne (Editor) Spectroscopy Methods in Mineralogy and
Geology. Reviews in Mineralogy, 18, pp.698 (1988).• Hapke, B., Introduction to the theory of reflectance and emittance
spectroscopy, Cambridge University Press, New York (1993).• Clark, R.N., Spectroscopy of rocks and minerals and principles of
spectroscopy, Rencz, A. N. (Editor)., Manual of Remote Sensing, John Wiley and Sons, New York, Chapter 1, pp. 3-58 (1999).
http://speclab.cr.usgs.gov/PAPERS.refl-mrs/refl4.html• USGS Digital Spectral Library (Diffuse Reflectance Spectroscopy)
http://speclab.cr.usgs.gov/spectral-lib.html
• Thermal emission spectra of minerals Databasehttp://speclib.asu.edu/
Home Work


