Spectroscopy Beauchamp 1 - Cal Poly Pomonapsbeauchamp/pdf_book/MS_chapter.pdf · Spectroscopy...
80
Spectroscopy Beauchamp 1 y:\files\classes\Spectroscopy Book home\1 Spectroscopy Workbook, latest MS full chapter.doc Basics of Mass Spectroscopy The roots of mass spectroscopy (MS) trace back to the early part of the 20th century. In 1911 J.J. Thomson used a primitive form of MS to prove the existence of isotopes with neon-20 and neon- 22. Current, easy-to-use, table-top instruments of today are a very recent luxury. In less than a day, you could be running samples on a mass spectrometer. However, it would take you longer to learn the many intricacies of MS, something we cannot pursue in a book such as this. We will mainly look at electron impact mass spectrometry (EI) and briefly mention chemical ionization (CI) as they pertain to determining an organic structure. The technique of MS only requires very small amounts of sample (g-ng) for high quality data. For that reason, it is the preferred method to evaluate product structures in combinatorial chemistry, forensic laboratories and with complicated biological samples. Generally, in these situations, you have some indication of the structure(s) possible. MS can be coupled to separation techniques such as gas chromatography (GC) and high pressure liquid chromatography (HPLC) to make a combination technique (GC-MS and LC-MS). GC can separate components in relatively volatile mixtures and HPLC can separate components in relatively less volatile mixtures. There are also options for direct inlet of solid samples and sampling methods for high molecular weight biomolecules and polymers. But, these are beyond the scope of this book. MS is different from the other spectroscopies (UV-Vis, IR, NMR) in that absorption or emission of electromagnetic radiation is not used. Rather, the sample (molecule) is ionized by some method (often a high energy electron beam = electron impact = EI). An electron is knocked out of a bonding molecular orbital (MO), forming a radical cation. Dications and anions can also be formed, but we will not consider these possibilities. R H e- high energy R H radical cation + + 2 e- EI mass spec The cations formed are accelerated in a high voltage field, focused and separated by mass to charge ratio (m/z or m/e) using a magnetic and/or electric fields. A detector indicates the intensity of each mass signal and the mass data (x axis) are plotted against this intensity (y axis) to produce a spectrum similar to that shown below. It is also possible that this same data can be printed in a tabulated, numerical form (shown in the side box). The most useful information from the MS is the molecular weight (the M+ peak), which can indicate what the formula is. The formula provides the degree of unsaturation, which gives important clues to the possible structures (rings and pi bonds). Fragment peaks that are detected provide hints as to the nature of the carbon skeleton, heteroatoms and functional groups present. The most abundant peak (largest) in the mass spectrum is called the base peak. It is assigned a value of 100% and all other detectable masses are indicated as a percent of the base peak. The molecular weight peak is called the mass peak or molecular ion peak or parent peak and symbolized with an M. Since this peak is a radical cation, it often also has a + or + . (plus sign and a dot) superscript as well. We will use M+. There is often ambiguity in the other fragment peaks because of high energy rearrangements that are possible. It is usually very difficult to assign a structure to a completely unknown molecule based solely on mass spectroscopy. But a mass spectrum can help provide a very important piece of the puzzle, the molecular weight.
Transcript of Spectroscopy Beauchamp 1 - Cal Poly Pomonapsbeauchamp/pdf_book/MS_chapter.pdf · Spectroscopy...

Spectroscopy Beauchamp 1
y:\files\classes\Spectroscopy Book home\1 Spectroscopy Workbook, latest MS full chapter.doc
Basics of Mass Spectroscopy The roots of mass spectroscopy (MS) trace back to the early part of the 20th century. In 1911 J.J. Thomson used a primitive form of MS to prove the existence of isotopes with neon-20 and neon-22. Current, easy-to-use, table-top instruments of today are a very recent luxury. In less than a day, you could be running samples on a mass spectrometer. However, it would take you longer to learn the many intricacies of MS, something we cannot pursue in a book such as this. We will mainly look at electron impact mass spectrometry (EI) and briefly mention chemical ionization (CI) as they pertain to determining an organic structure. The technique of MS only requires very small amounts of sample (g-ng) for high quality data. For that reason, it is the preferred method to evaluate product structures in combinatorial chemistry, forensic laboratories and with complicated biological samples. Generally, in these situations, you have some indication of the structure(s) possible. MS can be coupled to separation techniques such as gas chromatography (GC) and high pressure liquid chromatography (HPLC) to make a combination technique (GC-MS and LC-MS). GC can separate components in relatively volatile mixtures and HPLC can separate components in relatively less volatile mixtures. There are also options for direct inlet of solid samples and sampling methods for high molecular weight biomolecules and polymers. But, these are beyond the scope of this book. MS is different from the other spectroscopies (UV-Vis, IR, NMR) in that absorption or emission of electromagnetic radiation is not used. Rather, the sample (molecule) is ionized by some method (often a high energy electron beam = electron impact = EI). An electron is knocked out of a bonding molecular orbital (MO), forming a radical cation. Dications and anions can also be formed, but we will not consider these possibilities.
R He-
highenergy R H
radical cation
+ + 2 e-EI mass spec
The cations formed are accelerated in a high voltage field, focused and separated by mass to charge ratio (m/z or m/e) using a magnetic and/or electric fields. A detector indicates the intensity of each mass signal and the mass data (x axis) are plotted against this intensity (y axis) to produce a spectrum similar to that shown below. It is also possible that this same data can be printed in a tabulated, numerical form (shown in the side box). The most useful information from the MS is the molecular weight (the M+ peak), which can indicate what the formula is. The formula provides the degree of unsaturation, which gives important clues to the possible structures (rings and pi bonds). Fragment peaks that are detected provide hints as to the nature of the carbon skeleton, heteroatoms and functional groups present. The most abundant peak (largest) in the mass spectrum is called the base peak. It is assigned a value of 100% and all other detectable masses are indicated as a percent of the base peak. The molecular weight peak is called the mass peak or molecular ion peak or parent peak and symbolized with an M. Since this peak is a radical cation, it often also has a + or + . (plus sign and a dot) superscript as well. We will use M+. There is often ambiguity in the other fragment peaks because of high energy rearrangements that are possible. It is usually very difficult to assign a structure to a completely unknown molecule based solely on mass spectroscopy. But a mass spectrum can help provide a very important piece of the puzzle, the molecular weight.

Spectroscopy Beauchamp 2
base peak = largest peak in MS spectrum = 100% peak, other peaks are reported as a percent of this peak molecular ion = M = M+ = M+ = parent peak Only specific isotopic masses are found in the molecular formula. We do not see “average” masses that are listed in the periodic table. Also present will be M+1, M+2, etc. peaks due to other isotopes. On low resolution MS these peaks can help decide what the molecular formula is.
In the MS example below, some of the peaks are very ‘logical’ (57, 85 and 91 are logical) and some are less so (39, 41, 42, 51 and 55). It is also true that peaks that are ‘logical’ are sometimes small or completely missing (119). Many of the other peaks will be explainable with certain assumptions about fragmentations discussed later in this chapter. .
Mass percent
Tabulated Data
0 25 50 75 100 125 150 175 2000
25
50
75
100
percent relative intensity
masscharge
me=
85 = base peak57
29 41
65
91
Many smaller peaks are not shown, but listed in data table to the left.
176
M+ peak
O 1-phenyl-2-hexanoneC12H16O , MW = 176
9185
57
27 58 86 92
119
39
27 628 229 2439 741 2642 143 150 151 355 357 9958 560 163 365 1177 285 10086 689 290 291 3692 6
176 7177 1
(base)
= M+

Spectroscopy Beauchamp 3
y:\files\classes\Spectroscopy Book home\1 Spectroscopy Workbook, latest MS full chapter.doc
Typical MS Instrument Features.
The moving charged cations (R-H+) can be made to curve in their direction of flight in a magnetic or electric field. The amount of curvature is determined by the mass (m) of the ions as shown in the following equations (assuming the charge, e, is constant = +1). The magnetic field (B) and/or accelerator plate voltage (V) can be altered to cause each possible mass to impact the detector. The charged masses must survive about 10-6 to 10-5 seconds to make this journey to the detector. Often there is some rational feature to explain each peak’s special stability that allows it to last long enough to reach the detector, where it becomes part of the data we examine. We will look at some of these features later in this discussion. We will not discuss other possibilities, such as metastable ions or +2 and negatively charged ions. Our main goal in this book is interpretation.
me
B2r2
2V=
r = mVe
1B
m = masse = charge (usually +1)B = size of magnetic fieldr = radius of curvatureV = voltage on accelerator plate
Besides just seeing a positively charged mass at the detector, we must resolve it from nearby mass values. MS instruments can be either low resolution (LRMS) or high resolution (HRMS). Low resolution MS instruments can generally resolve single amu values as high as about 2000 amu’s (e.g. they can distinguish 300 amu from 301 amu). An atomic mass unit is defined as 1/12 the mass of a neutral carbon-12 atom (12C = 12.0000, by definition). High resolution MS instruments can resolve masses as close as the fourth decimal place (XXX.XXXX). With such accuracy, an exact molecular formula can be determined by a computer. A molecular formula can also be obtained from LRMS,

Spectroscopy Beauchamp 4
through a slightly more involved procedure. HRMS instruments tend to be more expensive and less common.
Exact Masses
We need to be precise in our calculation of possible masses for each collection of atoms because the atoms in any cation hitting the detector are specific isotopes. The atomic weights listed in the periodic table are average weights based on the abundance and mass of all of the naturally occurring isotopes of each element. For example, the atomic weight of bromine in the periodic table is 79.9, even though there is no bromine isotope with a mass of 80. The 79.9 atomic weight is a result of an approximate 50/50 mixture of two stable isotopes of mass 78.9 and 80.9. Because of this complication, we will require data on the exact masses and the relative abundance of the common isotopes that we expect to encounter. Those most useful to us in organic chemistry and biochemistry are listed below.
Average Element Atomic Weight Nuclides Exact Mass Relative Abundance* hydrogen 1.00797 1H 1.00783 100.0 2H (D) 2.01410 0.015
carbon 12.01115 12C 12.00000 100.0 13C 13.00336 1.11
nitrogen 14.0067 14N 14.00307 100.0 15N 15.00011 0.37
oxygen 15.9994 16O 15.9949 100.0 17O 16.9991 0.04 18O 17.9992 0.20
fluorine 18.9984 19F 18.9984 100.0
silicon 28.086 28Si 27.9769 100.0 29Si 28.9765 5.06 30Si 29.9738 3.36
phosphorous 30.974 31P 30.9738 100.0
sulfur 32.064 32S 31.9721 100.0 33S 32.9715 0.79 34S 33.9679 4.43
chlorine 35,453 35Cl 34.9689 100.0 37Cl 36.9659 31.98
bromine 79.909 79Br 78.9183 100.0 81Br 80.9163 97.3
iodine 126.904 127I 126.9045 100.0 *The most abundant nuclide is assigned 100% and the others assigned a fractional percent of that value. Coincidently, in the examples listed in the table above with more than one isotope, the lowest mass isotope is the 100% isotope.

Spectroscopy Beauchamp 5
y:\files\classes\Spectroscopy Book home\1 Spectroscopy Workbook, latest MS full chapter.doc
Obtaining a molecular formula from a HRMS is relatively straight forward Each possible molecular mass is unique when calculated to 3-4 decimal places and computers can do the calculations for us. Try the problems below. Unfortunately, here you have to do the calculations yourself.
Problem 1 - A low-resolution mass spectrum of 1,10-phenanthroline showed the molecular weight to be 180. This molecular weight is correct for the molecular formulas C14H12, C13H8O and C12H8N2. A high-resolution mass spectrum provided a molecular weight of 180.0688. Which of the possible molecular formulas is the correct one? What is the degree of unsaturation in 1,10-phenanthroline?
Problem 2 – Isopalhinine A, a natural product was found by low-resolution mass spectrometry to have a molecular weight of 291. Possible molecular formulas include C15H17NO5, C16H21NNO4, and C17H25NO3. High-resolution mass spectrometry indicated that the precise molecular weight was 291.1472. What is the correct molecular formula of isopalhinine? What is the degree of unsaturation?
To obtain a molecular formula from a LRMS requires more sophistication. Various possible formulas can be generated using the molecular ion peak and the rule of 13. The first possible formula assumes that only carbon and hydrogen are present. The molecular mass (M+) is divided by 13 generating an integer (n) and a remainder (r). The number 13 represents the mass of one carbon atom and one hydrogen atom. The CH formula becomes CnHn+r. All molecular hydrocarbons have even mass molecular weights.
CH
H
H
C
H
H
C
H
H
C
H
H
C
H
H
C
H
H
H
Each of these masses = 13 amu = C + H(We assume there are "n" of them if
the unknown was a hydrocarbon.This is our starting point formula.)
These are lef t over hydrogen atoms = r
M13
n +=M = molecular weightn = number of CH units = quotientr = lef t over hydrogens = remainder
Possible hydrocarbon molecular formula = CnHn+r (as a hydrocarbon always an even mass)
r
The degree of unsaturation can be calculated for this formula and possible rings and/or pi bonds can be considered (discussed in the introduction, p 10). If oxygen and/or nitrogen (and other elements) are present, the C/H numbers in the molecular formula must be changed by an amount equal to the new element’s isotopic mass. It is assumed, when substituting atoms, that the major isotope is used in all cases (always the lowest mass isotope, for us), H=1, C=12, N=14, O=16, S=32, Cl=35, Br=79. Since oxygen weighs 16, we can subtract CH4 (= 16) from the formula and substitute in the oxygen atom. If two oxygen atoms were present, we would subtract 2x(CH4) = C2H8 and so forth. Nitrogen-14 would substitute for CH2 and n nitrogen atoms would substitute for (CH2)x(n). If we did not have enough hydrogen atoms for some reason (it happens), we could take away one carbon atom and add in 12 hydrogen atoms, or if there were too many hydrogens, you could do it the other way around and add one carbon and take away 12 hydrogen atoms. Information concerning the possible number of nitrogen atoms in the molecular formula is also available in the molecular mass. If the molecular mass is an even number, then the number of

Spectroscopy Beauchamp 6
nitrogen atoms has to be zero or an even number (= 0, 2, 4......). If the molecular mass is an odd number, then the number of nitrogen atoms has to be odd (= 1, 3, 5.....). Remember, each nitrogen atom in the formula adds an extra bonding position.
C C C C O C C C C N CN C C C N
CnH2n+2Ox CnH2n+3N1CnH2n+4N2
(N is odd) (N is even)C = even massH = even massO = even massMW = even mass
C = even massH = odd massO = even massMW = odd mass
C = even massH = even massO = even massMW = even mass
Problem 3 - An unknown compound produces a molecular weight of 108. What are all possible formulas having only carbon and hydrogen or having carbon, hydrogen and an oxygen atom (…two oxygen atoms) or having carbon hydrogen and nitrogen (what is the minimum of nitrogen atoms that would have to be present)? What is the degree of unsaturation for each of these possibilities? Is it possible that the formula has only a single nitrogen? If so what would the formula be? If not, why not? What if the molecular weight was 107? (Same questions.) To choose among the various formulas generated from the rule of 13, we can consider the other possible isotopes present and their relative abundances to calculate the size of the peaks just one mass unit (M+1) and two mass units (M+2) larger than the molecular ion peak (M+). For each possible formula, percents of the M+1 and M+2 peaks versus the M+ peak are calculated. In this calculation the M+ peak is assumed to be 100% for comparisons with M+1 and M+2, regardless of the base peak. These calculated values are compared to the experimental values to determine the most likely formula. The reason for this is that the relative sizes of the M+1 and M+2 peaks are determined by the number and isotopic abundance of the elements present. The presence of either chlorine, bromine or sulfur significantly changes the M+2 peak. If there are multiple halogens (Cl and Br), the M+2, M+4, M+6 and beyond can be calculated and compared to the experimental mass spectrum. This approach only works if the M+ peak is large enough so that M+1 and M+2 are significant. If the M+ peak is too small, we can’t tell what the relative fractions of M+1 and M+2 are. Let’s take a look at how one could calculate the relative size of these peaks (M+1 and M+2). Sample calculation using M+, M+1, M+2 peaks to identify the molecular formula by LRMS
We will assume an actual formula that is C4H10O. However, we will pretend we don’t know this. How could the M+1 and M+2 lead us to the correct formula? The molecular mass of C4H10O is 74 and that would produce our molecular ion peak, M+. We would have an extra amu in the mass if we had a different isotope one amu higher. We could do this 4 ways with carbon (because there are four 13C atoms) 10 ways with hydrogen (2H = D) and 1 way with oxygen (17O). The probabilities for these possibilities are shown below for the M+1 peak. If we add all of these together we can see the total probability for getting an M+1 peak relative to 1.0000 for getting the M+ peak. Using a similar strategy we can estimate the probability for getting an M+2 peak, which will be considerably lower since we have to get two 13C or two 2H or one 13C and one 2H. The main contribution to the M+2 peak is the 18O isotope. Taken together, these three peaks would predict the indicated distribution for M+, M+1 and M+2 for this collection of atoms (C4H10O).

Spectroscopy Beauchamp 7
y:\files\classes\Spectroscopy Book home\1 Spectroscopy Workbook, latest MS full chapter.doc
molecular ion peak = M+ = 4x(12C) + 10x(1H) + 1x(16O) = 74 amu
as a fraction = 1.000as a percent = 100%
Whatever the size of this peak, it is assumed to be 100% for comparison with the M+1 and M+2 peaks.
M+1 peak - arises from different possibilities of one additional amu = 75 amu
one 13C =1.11
101.11 (4 ways) = 0.0439
one 2H =0.015
100.015 (10 ways) = 0.0015
one 16O =0.04
101.24 (1 ways) = 0.0004
13C12C + 13C
2D1H + 2D
17O16O + 17O+ 18O
sum of possibilities = (0.0439) + (0.0015) + (0.0004) = 0.0458
M+1 peak as a percent of M+ peak = (0.0458)x(100%) = 4.58%
"mini" probability theory
There are 4 ways of picking the first carbon and 3 ways of picking the second carbon (=4x3) and since all carbon is the same, we can't tell what carbon was picked first and second, so we divide by two facorial (2x1).
M+2 peak - arises from different possibilities of two additional amu = 76 amu
two 13C =1.11
101.114 x 32 x 1
two 2H =0.015
100.015
one 18O =0.20
101.24 (1 ways) = 0.0020
sum of possibilities = (0.0007) + (0.0020) + (0.0001) = 0.0028
M+2 peak as a percent of M+ peak = (0.0028)x(100%) = 0.28%
2
= (0.0439)2(6 ways) = 0.0007
2 10 x 92 x 1 = (2.25x10⁻⁸)(45 ways)
= 1 x 10-6 = 0.000001 = too small to consider
one 13C and one 2H =1.11
101.11 (4 ways) x0.015
100.015 (10 ways)
= 1 x 10-6 = 0.000065 = 0.0001
M+ M+1 M+2
100%
4.58%0.28%
M+ = molecular ion peak Exact Mass (M+1) (M+2) (formulas)74
CH2H2O2 74.0117 1.95 0.41CH4N3O 74.0355 2.33 0.22CH6N4 74.0594 2.70 0.03C2H2O3 74.0004 2.31 0.62C2H4NO2 74.0242 2.69 0.42C2H6NO 74.0480 3.06 0.23C3H6O2 74.0368 3.42 0.44C3H10N2 74.0845 4.17 0.07C4H10O 74.0003 4.52 0.28 Here is our compound.
M+ = molecular ion peak Exact Mass (M+1) (M+2) (formulas)75
CH2H2O2 74.9956 1.60 0.61CH4N3O 75.0320 2.70 0.43CH6N4 75.0798 3.45 0.05C2H2O3 75.0684 3.81 0.25
etc.Data tables exist with many values already calculated for comparisons.
Since the molecular weight is even, the number of nitrogens atoms must be even (0,2,4...).Any formulas with an odd number of nitrogen atoms must be part of a fragment.
To find a possible molecular formula using the M+1 and M+2 peaks, we first find the correct molecular weight for our molecule (in this case mass = 74). Then we look through the M+1 and M+2 values for two values that match our mass spec data. In this case we see that C4H10O is a very close match and it becomes our best guess.

Spectroscopy Beauchamp 8
Problem 4 – a. Calculate the relative intensities (as a percent) of M+, M+1 and M+2 for propene
(CH3-CH=CH2) and diazomethane (CH2=N=N). Can these two formulas (C3H6 vs CH2N2) be distinguished on the basis of their M+1 and M+2 peaks? Calculate the exact mass (four decimal places) for both of these formulas. Can they be distinguished on the basis of exact mass? Helpful data are on page 4.
b. Both CHO+ and C2H5+ have fragment masses of approximately 29, yet CHO+ has a M+1 peak of
1.13% and M+2 peak of 0.20%, whereas C2H5+ has a M+1 peak of 2.24% and M+2 peak of
0.01%. High resolution mass spec shows CHO+ to have a different fragment mass than C2H5+.
Explain these observations and show all of your work. Helpful data are on page 4. Chlorine, bromine and sulfur, when present, have very characteristic M+2 peaks (32.6% for Cl, 96.9% for Br and 4.4% for S). If multiple Cl’s and/or Br’s are present M+2, M+4 and beyond are indicative of the number and type of halogen(s) present. The various patterns are available in many references. However, you can calculate these values yourself, as was done above for the M+1 and M+2 peaks above. one Cl – comparison of M+ peak (35Cl) to M+2 peak (37Cl)
M+ peak relative size
probability of 35Cl = 100100 + 32
(1 way) = 0.758
(assigned a referenced value of 100%)
M+2 peak relative size
probability of 37Cl = 32100 + 32
(1 way) = 0.242
percent of M+ peak = 0.2420.758
(100%) = 32% M+ M+1 M+2
100%
32%
one Br – comparison of M+ peak (79Br) to M+2 peak (81Br)
M+ peak relative size
probability of 79Br = 100100 + 97
(1 way) = 0.508
(assigned a referenced value of 100%)
M+2 peak relative size
probability of 81Br = 97100 + 97
(1 way) = 0.492
percent of M+ peak = 0.4920.508
(100%) = 97% M+ M+1 M+2
100% 97%

Spectroscopy Beauchamp 9
y:\files\classes\Spectroscopy Book home\1 Spectroscopy Workbook, latest MS full chapter.doc
one S – comparison of M+ peak to M+1 to M+2 peak
M+ peak relative size
probability of 32S = 100100 + 0.79 + 4.43 (1 way) = 0.950
(assigned a referenced value of 100%)
M+1 peak relative size
probability of 33S =
percent of M+ peak = 0.0080.950
(100%) = 0.8%
M+ M+1 M+2
100%
4.4%
M+2 peak relative size
probability of 34S =
percent of M+ peak = 0.0420.950
(100%) = 4.4%
0.79100 + 0.79 + 4.43 (1 way) = 0.008
4.43100 + 0.79 + 4.43 (1 way) = 0.042
0.8%
one Br and one Cl – comparison of M+ peak to M+2 and M+4 peaks
M+ peak relative size
probability of 79Br = 0.508 (from above) probability of 35Cl = 0.758 (from above)(probability of 79Br)(probability of 35Cl) = (0.508) (0.758)(1 way) = 0.385
(assigned a referenced value of 100%)
M+2 peak relative size
M+ M+2 M+4
100%
31%
129%
probability of 81Br = 0.492 (from above) probability of 37Cl = 0.242 (from above)(probability of 79Br)(probability of 37Cl)(1 way) = (0.508) (0.242)(1) = 0.123(probability of 81Br)(probability of 35Cl)(1 way) = (0.492) (0.758)(1) = 0.373 total = 0.496
percent of M+ peak = (0.496/0.373)x100% = 129%
M+4 peak relative size(probability of 81Br)(probability of 37Cl)(1 way) = (0.492) (0.242)(1) = 0.119
percent of M+ peak = (0.119/0.373)x100% = 31%
two Cl – comparison of M+ peak to M+2 peak to M+4 peaks
M+ peak relative size
probability of two 35Cl = (0.758)2 (1 way) = 0.602
(assigned a referenced value of 100%)
M+2 peak relative size
M+ M+2 M+4
100%
10%
61%probability of 37Cl = 0.242 (from above)(probability of 35Cl)(probability of 37Cl)(2 ways) = (0.758) (0.242)(2) = 0.367
percent of M+ peak = (0.367/0.602)x100% = 61%
M+4 peak relative size(probability of 37Cl)(probability of 37Cl)(1 way) = (0.242)2(1) = 0.059
percent of M+ peak = (0.059/0.602)x100% = 10%

Spectroscopy Beauchamp 10
Problem 5 - Calculate the relative intensities (as a percent) of M+, M+2 and M+4 for Br2. Use the probabilities from above.
Problem 6 - Calculate the relative intensities (as a percent) of M+, M+2, M+4 and M+6 for BrCl2 and Br2Cl. Hint: All of the data you need to perform these calculations are in the examples above. Use the probabilities from above.
Energetics of Fragmentation of simple hydrocarbon patterns
Bonds are broken in fragmentations, forming radicals and/or cations. The energy costs for radicals and cations of common hydrocarbon patterns are worked out in the tables that follow. We first assume a C-H bond is homolytically broken (each atom gets one electron, no charge is formed). Next, we take away the cost of making the hydrogen atom (the same for every C-H bond) to find out what the cost is for forming only the carbon free radical. Lower energy possibilities are favored over higher energy possibilities. A few problems are provided just below the following tables to illustrate these points.
A similar diagram is constructed to estimate the energy costs of forming carbocations. We start out the same, but in this diagram we include the ionization potential of the carbon free radical, a value that can be measured experimentally. We again take away the energy to make the hydrogen free radical and also take away the energy change when the hydrogen atom attracts the extra electron (electron affinity) to become a hydride. What remains is an estimate of the energy to make only the carbocation. This is a considerably larger amount of energy than to make the carbon free radical (because we are stealing away an electron).

Spectroscopy Beauchamp 11
y:\files\classes\Spectroscopy Book home\1 Spectroscopy Workbook, latest MS full chapter.doc
General Energy Cycle for Carbocations - relative energy to form carbocations (all energy values in kcal/mole)
C H
heterolyticbond energy
C H
R-H
R H
homolyticbond
energy
Hfo(H ) = -52 heat of formatio of hydrogen
atom, common to all cycles
H-HH3C-H
CH3CH2-H(CH3)2CH-H
(CH3)3C-HCH2=CHCH2-H
C6H5CH2-H
Compound RadicalH (hydrogen carbocation)H3C (methyl carbocation)CH3CH2 (primary carbocationl)(CH3)2CH (secondary carbocation)(CH3)3C (tertiary carbocation)CH2=CHCH2 (allylcarbocation)C6H5CH2 (benzyl carbocation)
(104) + (313) - (17) - (52) = +348
Hfo(R ) = [BE+IP-EA- Hf
o(H )]
= energy to make R
1041059895
9286
ionizationpotential of R
R He-
HHf
o(H electron affinity) = -17
Hfo(R ) = + value
(see table)
Energy to formcarbocation
88
313227
193169
154186
165
-17-17
-52-52
I.P. E.A.(H) Hfo(H )(BE)
-17-17
-17-17
-17
-52-52
-52-52
-52
(105) + (227) - (17) - (52) = +263
(98) + (193) - (17) - (52) = +222(95) + (169) - (17) - (52) = +195
(92) + (154) - (17) - (52) = +177(86) + (186) - (17) - (52) = +203
(88) + (165) - (17) - (52) = +184
Common arguments for relative stabilities of free radicals and carbocations are inductive effects/hyperconjugation and resonance. Inductive effects and hyperconjugation argue that switching out a hydrogen for a carbon group allows greater electron donation to the electron deficient carbon atom (free radical or carbocation) because of increased pairs of electrons polarized towards the electron deficient centers. Carbocations are much more electron deficient than free radicals and benefit much more from this effect. The resonance argument states that an adjacent pi bond or lone pair can spread electron density through parallel p orbitals, thus reducing the energy to form a cation or free radical.

Spectroscopy Beauchamp 12
The differences in relative carbocation stabilities parallel the trend seen in free radicals, but are greatly enhanced versus the free radical stabilities.
One could also make a steric argument for tertiary being the most stable free radical or carbocation. The geometry changes from 109o (sp3) bond angles to 120o bond angles (sp2). The ground state of a tertiary C-H bond would start at higher potential energy from crowding, which would be relieved somewhat when the fourth group is removed, providing, perhaps, part of the advantage in the tertiary reaction over secondary over primary over methyl when forming tertiary free radicals and carbocations.
C
R
RR
R
more crowded as sp3 center = higher potential energy starting point with 3-4 larger groups around
tetrahedral carbon
less crowded as sp2with 3 groups around trigonal planar carbon is slightly more stable than it
would be if groups were smaller
C RR
R
R
Breaking a bond is a large uphill energy transformation,but less so with a sterically
crowded starting point, so Eais a little smaller than expected.

Spectroscopy Beauchamp 13
y:\files\classes\Spectroscopy Book home\1 Spectroscopy Workbook, latest MS full chapter.doc
Problem 7 – Consider the possible fragmentation of 2-methylbutane (isopentane). There are 3 types of C-C bonds that could break (b,d,f) and 4 types of C-H bonds that could break (a,c,e,g). Only consider breaking the C-C bonds (b,d,f) and the tertiary C-H bond (c). Each bond could break in two ways: either atom could be a cation and either atom could be a free radical. Calculate the energy cost for each possibility (each bonded atom as a radical and each atom as a cation). For each possibility what are the masses that would be observed at the detector (we only see cations)? This problem will require eight calculations for the four bonds considered.
CH3
H2C
H
HC CH2
H HH
a
b
c
d
e
f
g
high energy electron beam
2-methylbutane (isopentane)
CH3
H2C
H
HC CH2
H HH
a
b
c
d
e
f
g
radical cation
Possible fragmentations?
Energy to rupture bonds (eight calculations).
b b c c d d f f
Actual Mass Spectrum – tabulated and graphical.
15 2 26 4 27 43 28 6 29 60 30 1 37 1 38 3 39 30 40 5 41 88 42 95 43 100 44 7 50 2 51 3 53 4 55 10 56 40 57 95 58 6 71 5 72 16
mass percent
= base
= M+
Peaks 15, 29, 43, 57 and 72 are logical. In our discussions of fragmentation we will see how many of the other peaks are explainable.
025 50 75 100
0
25
50
75
100
percentrelativeintensity
masscharge
me
=
29
41,42
43 = base peak
57 Many smallerpeaks not shown.
72
M+peak
isopentaneC5H12
75 eV
CH
CH3
H3C CH2
CH3
5715
4329
39
MW = 72

Spectroscopy Beauchamp 14
Problem 8 – Consider the possible fragmentation of 2,2,4-trimethylpentane. There are four types of C-C bonds that could break (a, b, d, f) and 4 types of C-H bonds that could break (a, c, e, g). Only consider breaking the C-C bonds (a, b, c, d). Each bond could break in two ways: either atom could be a cation and either atom could be a free radical. Calculate the energy cost for each possibility (each bonded atom as a radical and each atom as a cation). For each possibility what are the masses that would be observed at the detector? This problem will require eight calculations for the four bonds considered (we only see cations).
b b c c d d
C
CH3
H3C
CH3
H2C
HC
CH3
a b c d
high energy electron beam
2,2,4-trimethylpentane radical cation
Possible fragmentations?
Energy to rupture bonds (eight calculations).
CH3 C
CH3
H3C
CH3
H2C
HC
CH3
a b c dCH3
a a
Actual Mass Spectrum tabulated and graphical.
mass percent
= base
= M+ (missing)
27 5 29 8 39 5 40 1 41 21 42 1 43 18 53 1 55 3 56 33 57 100 58 4 99 6
114 0

Spectroscopy Beauchamp 15
y:\files\classes\Spectroscopy Book home\1 Spectroscopy Workbook, latest MS full chapter.doc
Problem 9 - Predict reasonable fragmentation patterns for n-octane and where the major ion peaks should appear. Rationalize your predictions on the basis of energetics. The mass spectrum is provided for comparison. Some of the less logical peaks will become explainable after our discussions on fragmentation. Is there a ‘logical’ peak that is missing? Actual Mass Spectrum tabulated and graphical.
mass percent
= base
= M+
27 20 28 4 29 27 39 12 40 2 41 44 42 15 43 100 44 3 53 2 55 11 56 18 57 34 69 2 70 12 71 20 84 7 85 26 86 2
114 6
025 50 75 100
0
25
50
75
100
percent relative intensity
masscharge
mZ
=
basepeak
2971
43
57
Many smaller peaks not shown.
M+ peak
octaneC8H18
75 eV
114
H3C
H2C
CH2
H2C
CH2
H2C
CH2
CH3
120
85
41

Spectroscopy Beauchamp 16
Special patterns of fragmentation from organic functional groups Alkanes - Key Points (see examples above) 1. Lower mass alkyl branch fragments (2-6 C’s, masses = 29, 43, 57, 71, 85) are more intense than
higher mass fragments (6). The loss of the smaller branch as the cation more commonly reaches the detector.
2. The major carbocations that form follow carbocation stabilities (R+ = 3o > 2o > 1o > Me). It is also quite possible that less stable carbocations rearrange to more stable carbocations before they reach the detector. We can’t tell by only observing the mass since they have the same number.
R
proposedfragmentation
R
C4H9
probablerearrangement
C4H9
less stableprimary carbocation
more stabletertiary carbocation
can't tell whichmass = 57 mass = 57
3. Linear alkanes more often have observable molecular ion peaks, while increased branching weakens the molecular ion peak. Fragmentation is more common at branch points. Loss of a methyl from a straight chain is considerably weaker than loss of a methyl at a branch point.
M+ = 114 (6%)base peak = 43
(M - 15) = 99 peak (0%)
M+ = 114 (3%)base peak = 43
(M - 15) = 99 peak (1%)
M+ = 114 (0%)base peak = 57
(M - 15) = 99 peak99 peak (6%)
4. Linear fragments often differ by 14 amu (different size branches split off between carbons in different molecules, CH2 = 14). Take another look at problem 9, just above.
5. There are often clusters of peaks around main peaks. Very large fragment peaks will have a trailing M+1 peak due to 13C isotopes (about 1% for every carbon present). A rough guide for any large peak is that it will have “M+1” peak that is about 1% its size for every carbon in the fragment due to 1% 13C isotopes at each carbon. For example, if a fragment mass had an 80% value in a five carbon fragment, the next mass peak would be expected to be 0.05x80% 4% size based on 13C isotopes. If there were 10 carbons, the next mass peak would be expected to have 0.10x80% 8% size just based on the 13C isotopes (in addition to any real fragments that might come at that value.

Spectroscopy Beauchamp 17
y:\files\classes\Spectroscopy Book home\1 Spectroscopy Workbook, latest MS full chapter.doc
6. Cycloalkanes tend to have stronger molecular ion peaks (two bonds have to break) and their fragment patterns are more complicated to interpret (and we won’t try to interpret every possibility). Alkene fragmentation peaks are often subfeatures of the fragmentation pattern. Loss of “CH2CH2“ (= 28) is common, if present.
M+ = 112 (59%)M-28 = 84 (39%)
M+ = 114 (6%)M-28 = 86 (2%)
7. Two masses that seem to show up in nearly every mass spectrum are 39 and 41. These may arise
from resonance stabilized carbocations formed by rearrangements in the high energy electron beam. Look for peaks that extend those patterns by units of 14 (insertion of a CH2),. which are also commonly observed masses.
8. Even masses of 30, 44, 58, 72, etc. on occasion can be due to “radical-cation alkanes” that form from high energy rearrangements. Some of these masses form from other fragmentations too. But if there is no other logical reason to see one of these masses, this could be a possible explanation.
Common alkane fragmentations occur at branch points; more branches lead to more stable carbocations. However, skeletons can rearrange in almost any conceivable way possible to form more stable carbocations (e.g. 3o R+ > 2o R+ > 1o R+ > H3C+). Also, alkanes can lose H2 or R-H to form alkenes, so we have to consider possible alkene rearrangements for alkanes too (see our next functional group). Smaller masses tend to be more prominent than larger masses in the mass spectrum. Perhaps they don’t have as many options for falling apart as the larger fragments do. Also, when larger fragments fall apart, they make smaller fragments.

Spectroscopy Beauchamp 18
mass %15.0 126.0 127.0 2028.0 429.0 2739.0 1240.0 241.0 4442.0 1543.0 10044.0 351.0 153.0 254.0 155.0 1156.0 1857.0 3458.0 269.0 270.0 1271.0 2072.0 184.0 785.0 2686.0 299.0 none
114.0 6115.0 1
M+ = 114C8H18
8529
7143
57
C8H18 C6H13 C5H11 C4H9 C3H7 C2H5 C1H3
M+ = 114 85 71 57 29 15
991557
C6H13
99
20 30 40 50 60 70 80 90 100 110 120
27
Mostly peaks greater than 4%of the base peak are shown.43 = base
7139
41
M+ = 11485
57
4229
28 5556
70
Only cations reach detector, so only the part with positive charge is observed at the detector. A positive chargeis written on all f ragments to indicate that either part could retain the positive charge (in a rearranged stable form).Often you can see the mass of both cations of a possible fragmentation. It is useful to look for both fragmentmasses in the mass spectrum. Peaks related to alkene fragmentations are discussed in the next functional group.
The typical appearance of a mass spectrum is shown below. Data is also often presented as shown
to the right. The intensity of the peaks tends to decrease as the fragment masses get larger. Larger
fragments are less likely to survive the 10-5 second trip to the detector.
not observedin octane
octane - all alkane fragmentsare observed, except 99.
MW = 114
actual peaksin octane
M+
base
alkanepeaks
43

Spectroscopy Beauchamp 19
y:\files\classes\Spectroscopy Book home\1 Spectroscopy Workbook, latest MS full chapter.doc
(-H2)
Loss of hydrogen (H-H) or an alkane (R-H) fragment generates alkenes so alkene fragmentation patterns are also observed from alkane structures (see on next page).
3,4-dimethylhexane - has branches
15 / 99
29 / 85
43 / 71
57 / 57MW = 114
(-RH)
possible alkylfragments
H 58 (4%)
56 (100%)
elimination reaction similar to -H2O in alcohols to form alkene
The base peak (56) is likely from an alkene, C4H8.
mass % 27.0 10 28.0 1 29.0 26 39.0 7 40.0 1 41.0 43 42.0 2 43.0 58 44.0 2 51.0 1 53.0 2 55.0 8 56.0 100 57.0 81 58.0 4 69.0 3 70.0 1 71.0 1 84.0 7 85.0 41 86.0 3
99.0 none 114.0 2 115.0 0.2
actual peaksin 3,4-dimethylhexane
alkenes(see the next functional group)
M+
20 30 40 50 60 70 80 90 100 110 120
27
Mostly peaks greater than 4%of the base peak are shown.
56 = base
39
41
M+ = 114
130
84
57
43
29 55
MW = 11485
alkanepeaks
the basepeak is not expected
Remarkably, it is the major peak in the spectrum!
It is very common to see alkene fragments in the mass spectra of alkanes, though it is very
surprising to see one as the base peak, as is the case here. In the next functional group, we will compare fragmentations of alkenes and alkanes.
Alkenes - Key Points
1. A pi electron is likely to be ionized first from the HOMO of the alkene as the least tightly held electrons. Alkenes often produce stronger molecular ion peaks than alkanes because of this.
R RRemaining sigma bondholds skeleton together.+ e-
octane, MW =114 (M+ = 6%) oct-1-ene, MW =112 (M+ = 20%)
2. The double bond can migrate through the skeleton (this makes it difficult to distinguish among positional
isomers sharing a common skeleton).
These alkenes all look similar.

Spectroscopy Beauchamp 20
3. Allylic cleavage is common due to resonance stabilization of cation fragment. The mass can vary depending on the groups attached to the allylic part. Look for peaks that extend this pattern by units of 14 (insertion of CH2 x1, x2, …).
resonance stabilized carbocation
R' ionization R'R'
fragmentation
free radicalis sucked away
R R R R
mass = 41 (R = H)55 (R = CH3)69 (R= CH2CH3)83 (R = C3H7)etc.
4. McLafferty-like rearrangements are possible (similar to carbonyl pi bonds). Again, bond migration is
possible. Also look for some of these fragment peaks in alkane mass spectra that have lost H2.
CR
H2CH
CH2R CH2
C
CH
CH2
mass = 42 (R = H)56 (R = CH3)70 (R= CH2CH3)84 (R = C3H7)
C
C
fragmentation
McLafferty-like rearrangement
RR
R R
28 (R = H)42 (1 extra C)56 (2 extra C)70 (3 extra C)
It is possible to see the cation charge on either fragment. Both fragments will be even unless an odd number of nitrogen atoms is present.
even mass
5. Cyclohexenes often undergo retro Diels-Alder reactions.
R1
R2fragmentation is a
retro-Diels-Alder reactionR1
R2
diene dienophile
Only cations reach the detector. Either fragment could be positive, but usually the diene would be the more stable cation. Both
fragments will be even unless an odd number of nitrogen atoms is present.

Spectroscopy Beauchamp 21
y:\files\classes\Spectroscopy Book home\1 Spectroscopy Workbook, latest MS full chapter.doc
Alkenes Fragmentation Patterns (Many of those below can also be found in octane, an alkane.)
Only cations reach detector, so only the part with positive charge is seen at the detector. A positive charge is written on both fragments to indicate that either could retain the positive charge (in a rearranged stable form). Often you can see both as cations from different fragmentations. The following peaks are explained by common alkene fragmentations (data on the right). Many of them are found in fragment peaks of octane, an alkane (see data on the following page). A pi bond can migrate through the skeleton to almost any conceivable position, leading to almost any variation conceivable.
H
70 (12%)42 (15%)
H
56 (18%)
H
42 (15%)43 (100%)69 (2%)
57 (34%)
71 (20%)41 (44%)
55 (11%)
McLafferty rearrangements allylic fragmentations
OR
OR
H
84 (7%)28 (4%)
OR
OR
112 (0%)
OR
OR
OR
OR
ORCH3
83 (0%)
97 (0%)
29 (27%)
15 (0%)
actual peaksfrom octane
mass % 26.0 1
27.0 20 28.0 4 29.0 27 39.0 12 40.0 2 41.0 44 42.0 15 43.0 100 44.0 3 53.0 2 55.0 11 56.0 18 57.0 34 58.0 2 69.0 2 70.0 12 71.0 20 72.0 1 84.0 7 85.0 26 86.0 2 114.0 6
112 (0%)
112 (0%)
112 (0%)
112 (0%)
112 (0%)
112 (0%)
112 (0%)
112 (0%)
70 (12%)
56 (18%)

Spectroscopy Beauchamp 22
Similar fragmentation patterns for C8H16 alkenes. Notice that octane (an alkane) has many of these same fragments.
15.0 1 26.0 1 27.0 25 28.0 5 29.0 35 30.0 - 32.0 1 38.0 1 39.0 28 40.0 5 41.0 82 42.0 66 43.0 100 44.0 3
50.0 - 51.0 2 52.0 1 53.0 8 54.0 9 55.0 99 56.0 87 57.0 19 58.0 -
59.0 -63.0 -
65.0 166.0 -
67.0 6 68.0 7 69.0 44 70.0 86 71.0 12
72.0 -77.0 -79.0 -
81.0 1 82.0 6 83.0 34 84.0 22 85.0 2 86.0 - 97.0 4 112.0 20 113.0 2
15.0 1 26.0 1 27.0 18 28.0 4 29.0 33 30.0 1 32.0 -
38.0 1 39.0 19 40.0 3 41.0 64 42.0 34 43.0 11
44.0 - 50.0 1 51.0 2 52.0 1 53.0 8 54.0 9 55.0 100 56.0 52 57.0 21 58.0 1
59.0 -63.0 -
65.0 166.0 -
67.0 5 68.0 4 69.0 29 70.0 43 71.0 4
72.0 -77.0 -79.0 -
81.0 1 82.0 2 83.0 16 84.0 7 85.0 - 86.0 - 97.0 2 112.0 28 113.0 3
15.0 1 26.0 1 27.0 25 28.0 4 29.0 45 30.0 1
32.0 - 38.0 1 39.0 22 40.0 4 41.0 81 42.0 44 43.0 15 44.0 1 50.0 1 51.0 2 52.0 1 53.0 8 54.0 8 55.0 100 56.0 63 57.0 25 58.0 1
59.0 -63.0 -
65.0 166.0 -
67.0 6 68.0 5 69.0 34 70.0 56 71.0 6
72.0 -77.0 -79.0 -
81.0 1 82.0 3 83.0 22 84.0 10 85.0 1 86.0 - 97.0 2 112.0 36 113.0 3
15.0 2 26.0 2 27.0 25 28.0 4 29.0 19 30.0 -
32.0 - 38.0 2 39.0 26 40.0 5 41.0 100 42.0 38 43.0 18 44.0 1 50.0 2 51.0 4 52.0 2 53.0 11 54.0 8 55.0 95 56.0 54 57.0 16 58.0 1 59.0 1 63.0 1 65.0 2 66.0 1 67.0 10 68.0 7 69.0 47 70.0 48 71.0 6
72.0 - 77.0 2 79.0 2 81.0 3 82.0 2 83.0 24 84.0 7 85.0 2 86.0 - 97.0 2 112.0 36 113.0 3
15.0 1 26.0 2 27.0 23 28.0 3 29.0 17 30.0 -
32.0 - 38.0 2 39.0 24 40.0 4 41.0 93 42.0 29 43.0 15 44.0 - 50.0 2 51.0 3 52.0 2 53.0 9 54.0 9.2 55.0 100 56.0 46 57.0 14 58.0 -
59.0 - 63.0 1 65.0 2 66.0 1 67.0 9 68.0 5 69.0 36 70.0 44 71.0 5
72.0 - 77.0 1 79.0 2 81.0 2 82.0 2 83.0 24 84.0 7 85.0 1 86.0 - 97.0 2 112.0 36 113.0 3
15.0 1 26.0 1 27.0 16 28.0 2 29.0 14 30.0 -
32.0 - 38.0 1 39.0 16 40.0 2 41.0 78 42.0 25 43.0 12 44.0 - 50.0 1 51.0 2 52.0 1 53.0 6 54.0 7 55.0 100 56.0 43 57.0 12 58.0 -
59.0 -63.0 -
65.0 266.0 -
67.0 8 68.0 4 69.0 32 70.0 42 71.0 4
72.0 - 77.0 1 79.0 1 81.0 2 82.0 2 83.0 29 84.0 7 85.0 - 86.0 - 97.0 1 112.0 33 113.0 3
1-octene trans-2-octene cis-2-octene trans-3-octene cis-4-octene trans-4-octenecis-3-octeneoctane
15.0 1 26.0 1 27.0 20 28.0 4 29.0 27 30.0 - 32.0 -
38.0 - 39.0 12 40.0 2 41.0 44 42.0 15 43.0 100 44.0 3
50.0 - 51.0 1
52.0 - 53.0 2 54.0 1 55.0 11 56.0 18 57.0 34 58.0 2
59.0 - 63.0 - 65.0 - 66.0 - 67.0 - 68.0 -
69.0 2 70.0 12 71.0 20 72.0 1
77.0 - 79.0 - 81.0 - 82.0 - 83.0 - 84.0 7 85.0 26 86.0 2 97.0 - 112.0 - 113.0 - 114.0 - 115.0 1
not available
A C E
G
B D F H
H
G
A B C D E F
alkyl branch fragments = 15, 29, 43, 57, 71, 85, 99allylic fragments = 27, 41, 55, 69, 83, 97McLafferty fragments = 28, 42, 56, 70, 84, 98

Spectroscopy Beauchamp 23
y:\files\classes\Spectroscopy Book home\1 Spectroscopy Workbook, latest MS full chapter.doc
Another Alkene Example (C7 alkene)
H
H
H
McLafferty rearrangementsallylic fragmentations
A pi bond can migrate through the skeleton to almost any conceivable position.
15 (1%)29 (56%)43 (16%)57 (31%)71 (3%)85 (0%)
alkenes (1-heptene, 2-heptene, 3-heptene, all of them look similar because the pi bond can migrate through the skeleton)
C7H14 = 98 (14%) 42 (55%) 56 (100%) C7H14 = 98 (14%) 41 (97%)57 (31%)
C7H14 = 98 (14%)
C7H14 = 98 (14%)
56 (100%)42 (55%)
C7H14 = 98 (14%)
C7H14 = 98 (14%)70 (44%) 28 (5%)
55 (68%)
43 (16%)
69 (31%)29 (56%)
alkyl branches
C7H14 = 98 (14%)
CH3 = 15 (1%)
83 (31%)
This example starts with hept-1-ene
15.0 1 18.0 1 26.0 2 27.0 26 28.0 5 29.0 56 30.0 1 38.0 2 39.0 30 40.0 5 41.0 97 42.0 55 43.0 16 50.0 2 51.0 2 52.0 1 53.0 6 54.0 8 55.0 68 56.0 100 57.0 31 58.0 1 67.0 2 68.0 4 69.0 31 70.0 44 71.0 2 83.0 4 98.0 14
allylicfragments
McLaffertyfragments
27 (26%)41 (97%)55 (68%)69 (31%)83 (4%)
28 (5%)42 (55%)56 (100%)70 (44%)
all peaks > 1%

Spectroscopy Beauchamp 24 Alkynes - Key Points
1. Terminal alkynes have weak or missing M+ peaks (they often lose radical hydrogen), though M-1 can be very strong.
R
H H
R
H
H
M+ (M-1)+ 2. The triple bond can migrate through the skeleton (this makes it difficult to distinguish among positional
isomers sharing a common skeleton).
These alkynes all look similar.
3. All alkynes give a reasonably strong m/e = 39 peak from propargylic cleavage (resonance is OK, but more electronegative sp carbocation resonance form reduces contribution). This mass can also be explained by rearrangement to from a very stable aromatic cyclypropenyl carbocation. If you look at a lot of mass spectra, this mass always shows up, even if no alkyne is present. Look for peaks that extend this pattern by units of 14 (insertion of CH2 x1, x2, …).
mass = 39 (R = H)53 (R = CH3)67 (R= CH2CH3)
Ralso
works for
Only cations reach the detector. Mass 39 is in every EI mass spectrum. This could be because the cation is really an aromatic carbocation.
RCH
CC
H
radical cation
fragmentation
R'
CH
CC
H
CH
CC
H
resonanceR R
R'
4. Small peaks at M=26 are probably ethyne (acetylene).
HC
CH
M = 26
5. McLafferty-like rearrangements are possible (similar to the alkene above and a carbonyl pi bond)
R
H
R
radical cation
fragmentation
C
C
CH H
R H
Either fragment can be observed and both show an even mass.
RC
CH
H
H
on one or the other.
even mass
40 (R = H)54 (R = CH3)68 (R= CH2CH3)82 (R= C3H7)
28 (R = H)42 (R = CH3)56 (R= CH2CH3)70 (R= C3H7)

Spectroscopy Beauchamp 25
y:\files\classes\Spectroscopy Book home\1 Spectroscopy Workbook, latest MS full chapter.doc
Example peaks from hept-1-yne:
alkynes (1-heptyne, 2-heptyne, 3-heptyne, all of them look similar because the pi bonds can migrate through the skeleton)
H
H
H
McLafferty rearrangementsallylic fragmentations
A pi bond can migrate through the skeleton to almost any conceivable position.
15 (0.5%)29 (46%)43 (4%)57 (28%)71 (0.2%)85 (0%)
C7H12 = 96 (1%) 40 (12%) 56 (26%) 39 (30%)57 (28%)
54 (35%)42 (8%)
68 (30%) 28 (4%)
53 (18%)
43 (4%)
67 (44%) 29 (46%)
C7H12 = 96 (1%)
C7H12 = 96 (1%)
C7H12 = 96 (1%)
C7H12 = 96 (1%)
C7H12 = 96 (1%)
81 (100%)
15 (0.5%)
C7H12 = 96 (1%)
CH3
C7H12M+ = 96
mass % mass %mass % mass % mass %
1-heptyne
26.0 1 27.0 18 28.0 4 29.0 46 30.0 1 37.0 1 38.0 3 39.0 30
40.0 12 41.0 71 42.0 8 43.0 4 45.0 1 50.0 3 51.0 6 52.0 3
53.0 18 54.0 35 55.0 51 56.0 26 57.0 28 58.0 1 63.0 2 65.0 7
66.0 3 67.0 44 68.0 30 69.0 2 70.0 2 77.0 3 79.0 11 80.0 1
81.0 100 82.0 7 95.0 9 96.0 1
C7H12M+ = 96
mass % mass %mass % mass % mass %
2-heptyne
15.0 1 18.0 2 26.0 3 27.0 40 28.0 7 29.0 9 37.0 2 38.0 4
39.0 51 40.0 8 41.0 68 42.0 7 43.0 26 50.0 6 51.0 12 52.0 9
53.0 47 54.0 82 55.0 22 56.0 8 57.0 1 62.0 2 63.0 3 65.0 10
66.0 6 67.0 43 68.0 42 69.0 4 77.0 5 78.0 1 79.0 14 80.0 3
81.0 100 82.0 8 91.0 1 95.0 5 96.0 18 97.0 2
C7H12M+ = 96
mass % mass %mass % mass %mass %
3-heptyne
39.0 43 40.0 12 41.0 84 42.0 10 43.0 3 50.0 6 51.0 12 52.0 7
15.0 2 18.0 1 26.0 3 27.0 23 28.0 1 29.0 14 37.0 2 38.0 4
53.0 49 54.0 25 55.0 26 56.0 5 61.0 1 62.0 3 63.0 5 64.0 1
65.0 21 66.0 11 67.0 100 68.0 29 69.0 2 74.0 1 77.0 9 78.0 2
79.0 32 80.0 4 81.0 93 82.0 6 91.0 2 93.0 1 95.0 7 96.0 70 97.0 6

Spectroscopy Beauchamp 26
Benzenoid Structures - Key Points
1. Generally, aromatics compounds show a strong M+ peak.
2. A side chain alkyl branch (RCH2-) can fragment at the benzylic position, which is proposed to rearrange to the tropylium ion showing a m/e = 91 peak. Analogous rearrangements are possible in more substituted benzenoid compounds producing different, but predictable, masses.
CH2
R
radical cation
fragmentationCH2
R
lots ofresonance
rearrangement
tropylium ion,an aromatic cation(lots of resonance)
Only cations reach the detector. This mass is 91 (if R = H) and even though it is a very stable cation, it rearranges to a more stable 'tropylium' carbocation. Any branches or heteroatoms would change the '91' mass.
R' R'R'
R' = massH 91CH3 105C2H5 119HO 107H2N 106
3. Isomeric benzenes are difficult to distinguish among, as a group. Even though the structures are
different, the mass spectra of the compounds are pretty much alike due to high energy rearrangements.
These isomers have similar looking mass spectra.
4. McLafferty-like rearrangements are possible, if a simple alkyl chain of three more carbons is present (oxygen can also be in the branch) and a hydrogen atom is on the gama atom. This fragmentation produces an even mass of m/e = 92 for an unsubstituted carbon chain. Substituted rings will have different masses depending on the additional atoms. Remember that part of the 92 peak is C-13 isotopes in the 91 peak (about 7x0.01 = 0.07).
C
C
C
H
H HH
H
H
R
C
C
C
H HH
H
H
RH
Hor
can be on either fragment
R = massH 92CH3 106C2H5 120HO 108H2N 107
R = massH 28CH3 42C2H5 56C3H7 70
Even mass, if there is not an odd number of nitrogen atoms.
Both have even masses, if there is not an odd
number of nitrogen atoms.
R R

Spectroscopy Beauchamp 27
y:\files\classes\Spectroscopy Book home\1 Spectroscopy Workbook, latest MS full chapter.doc
O
C
C
H
H
H
H
H
O
C
C
H
H
H
HH
Hor
can be on either fragment
M+ = 122 (35%) 94.0 = 100% 28.0 = 1% Examples:
H
C11H16 = 148 (27%)
H
H
McLafferty rearrangements benzylic fragmentations
92 (74%) 56 (0.4%) 91 (100%)57 (4%)
15 (0.2%)29 (6%)43 (1%)57 (4%)71 (0%)85 (0.2%)105 (11%)105 (11%)
bridging phenyl group
43 (1%)
65 (9%)77 (4%)
C12H18M+ = 162
mass % mass %mass % mass % mass %
hexylbenzene
27.0 5 29.0 6 39.0 6 41.0 8 42.0 1 43.0 17 50.0 1 51.0 3
52.0 1 55.0 4 56.0 1 63.0 2 65.0 9 71.0 2 77.0 5 78.0 6
79.0 4 82.0 1 83.0 2 89.0 1 91.0 100 92.0 95 93.0 8
103.0 2
104.0 3 105.0 11 106.0 2 115.0 1 117.0 1 119.0 3 133.0 5 162.0 33
163.0 5
*
* Only about 7% is due to 13C isotopes.
162.0 21 163.0 3
27.0 1 29.0 2 39.0 2 41.0 6 51.0 2 53.0 1 57.0 1 63.0 1
64.0 2 65.0 4 66.0 1 77.0 4 78.0 2 79.0 6 89.0 1 91.0 14
92.0 1 103.0 2 104.0 1 105.0 4 107.0 2 115.0 5 116.0 2 117.0 4
119.0 21 120.0 2 128.0 2 129.0 1 131.0 3 133.0 1 147.0 100 148.0 12
C12H18M+ = 162
mass % mass %mass % mass % mass %
1-t-butyl-3-ethylbenzene
Notice that "91" is not logical, but it shows up.
27.0 2 39.0 3 41.0 2 51.0 2 53.0 1 63.0 1 65.0 2 77.0 6
C10H14M+ = 135
mass % mass %mass % mass % mass %
p-propyltoluene
78.0 2 79.0 5 91.0 6 92.0 2 103.0 3 104.0 2 105.0 100 106.0 9
115.0 1 117.0 1 119.0 1 134.0 23 135.0 2.6

Spectroscopy Beauchamp 28
Halogenated Compounds - Key Points 1. Fluorine (mass = 19) and iodine (mass = 127) have only one naturally occurring isotope, loss of
either of these masses is informative (M-19, M-127). Fluorine compounds tend to show weak M+ peaks (or none at all). When iodine is lost, there can be a big hole (= 127) in the middle of the mass spectrum.
2. Chlorine has two isotopes (35 and 37) which occur in a 3:1 ratio; this is easily observed when there is a molecular ion and in any fragments that retain the chlorine. An M-35 peak is informative, and M-36 corresponds to loss of HCl.
3. Bromine has two isotopes (79 and 81) which occur in a 1:1 ratio; this is easily observed when there is a molecular ion and in any fragments that retain the bromine. An M-79 peak is informative, and M-80 corresponds to loss of HBr.
4. Loss of “X” is common (see above) and loss of HX can occur with fluorine (M-20), chlorine (M-36), bromine (M-80).
5. Loss of an alkyl radical and formation of a five atom ring or three atom ring is possible with chains of C5 and longer with bridging chlorine, bromine or iodine (also true for sulfur).
X XR
fragmentation R
Free radicals are sucked away by the vacuum pump.
X = massCl 91Br 135I 183
X
R
fragmentationX R
Cations reach the detector, will see this mass.
Free radicals are sucked away by the vacuum pump.
Cations reach the detector, will see this mass.
X = massCl 63Br 107I 155

Spectroscopy Beauchamp 29
y:\files\classes\Spectroscopy Book home\1 Spectroscopy Workbook, latest MS full chapter.doc
Examples
15.0 1 26.0 2 27.0 27 28.0 5 29.0 32 39.0 17 40.0 3 41.0 59 42.0 45 43.0 72 44.0 2 49.0 3 53.0 4 54.0 4
Clalkyl branches 15 (1%) 29 (32%) 43 (72%) 57 (15%) 71 (3%) 85 (0.7%)
Cl
91 (100%)
Cl
63 (5%)
84 (4%), minus HCl
other alkene fragmentsMcLafferty allylic
27 (27%)41 (59%)63 (81%)
28 (5%)42 (45%)56 (56%)70 (3%)84 (1%)
C6H13Cl = 120
1-chlorhexane
mass %
55.0 81 56.0 56 57.0 15 63.0 5 65.0 2 67.0 3 69.0 22 70.0 2 71.0 3 84.0 4 91.0 100 92.0 4 93.0 32 94.0 1
mass %
91.0 10093.0 32 35Cl and 37Cl
15.0 1 26.0 1 27.0 16 28.0 3 29.0 21 39.0 11 40.0 2 41.0 42 42.0 10 43.0 66 44.0 2 53.0 2 54.0 1 55.0 6 56.0 5 57.0 100
58.0 4.9 69.0 .5 70.0 3 71.0 3 81.0 1 83.0 1.5 84.0 1 85.0 18 86.0 1 99.0 14
100.0 1 107.0 1 109.0 1 135.0 8 137.0 8
mass % mass %Br
alkyl branches 15 (1%) 29 (21%) 43 (66%) 57 (100%) 71 (3%) 85 (18%)
Br
135 (8%)
Br
107 (1%)
84 (4%), minus HBr
other alkene fragmentsMcLafferty allylic
27 (16%)41 (42%)63 (0%)
28 (3%)42 (10%)56 (5%)70 (3%)84 (1%)
C6H13Br = 165
1-bromorhexane
91.0 10093.0 32 35Cl and 37Cl
91.0 10093.0 32 35Cl and 37Cl
mass % mass %
Ialkyl branches 15 (1%) 29 (15%) 43 (100%) 57 (11%) 71 (0%) 85 (50%)
I
183 (0%)
I
107 (2%)
84 (4%), minus HI
other alkene fragmentsMcLafferty allylic
27 (14%)41 (25%)63 (0%)
28 (3%)42 (3%)56 (2%)70 (0%)84 (0%)
C6H13I = 212
1-iodohexane 27.0 14 28.0 3 29.0 15 39.0 7 40.0 1 41.0 25 42.0 3 43.0 100 44.0 3 53.0 1 55.0 6 56.0 2 57.0 11 85.0 50 86.0 3
155.0 2 212.0 4
mass % mass %I
15 (2%) (1%) 29 (0%) (0%) 43 (100%) (100%) 57 (0%) (0%) 71 (0%) (0%) 85 (0%) (0%)
I
not possible
I
155 (0%)
42, minus HI
other alkene fragmentsMcLafferty allylic
27 (32%) (28%)41 (37%) (36%)63 (0%) (0%)
28 (3%) (2%) 42 (3%) (4%)56 (0%) (0%)70 (0%) (0%)84 (0%) (0%)
C3H7I = 170
1-iodopropane
15.0 2 26.0 2 27.0 32 28.0 2 38.0 2 39.0 11 40.0 2 41.0 37 42.0 3 43.0 100 44.0 3
127.0 5 128.0 1 170.0 24
15.0 1 26.0 1 27.0 28 28.0 2 38.0 2 39.0 12 40.0 2 41.0 36 42.0 4 43.0 100 44.0 3
127.0 6 128.0 2 170.0 24
I2-iodopropaneC3H7I = 170
1-iodopropane 2-iodopropane
alkyl branches
I = 127.0 (5%) (6%)HI = 128.0 (1%) (2%)
Almost identical mass spectra.

Spectroscopy Beauchamp 30
Alcohols - Key Points
1. Alcohols generally have weak M+ peaks. Tertiary alcohols often do not have an M+ peak. However, if you had an IR, you would know an alcohol was present from the OH and CO bands. Additional evidence would be present in the proton and carbon 13 NMR spectra, if available.
2. Loss of water (M-18) is common; more so with straight chains and less so with branched alcohols.
R'
H
OH
fragmentationR' O
HH
M-18
This can lead to alkene fragmentations.
OH OHOH
OH
15.0 3 26.0 3 27.0 33 28.0 12 29.0 16 31.0 83 39.0 11 40.0 4 41.0 66 42.0 32 43.0 59 45.0 7 53.0 1 55.0 14 56.0 100 57.0 6 59.0 0.3 74.0 0.6
15.0 2 26.0 2 27.0 10 28.0 52 29.0 6 31.0 17 39.0 3 40.0 1 41.0 12 42.0 1 43.0 9 45.0 100 53.0 1 55.0 2 56.0 2 57.0 2 59.0 20 74.0 0.2
15.0 3 26.0 1 27.0 4 28.0 1 29.0 6 31.0 27 39.0 6 40.0 1 41.0 21 42.0 1 43.0 9 45.0 1 53.0 1 55.0 2 56.0 3 57.0 8 59.0 100 74.0 0
15.0 2 26.0 2 27.0 23 28.0 12 29.0 8 31.0 40 39.0 14 40.0 3 41.0 57 42.0 59 43.0 100 45.0 4 53.0 1 55.0 6 56.0 5 57.0 3 59.0 6 74.0 13
linear has branch has branch has branch
(M-18) = H2O
M+ peak(M-15) = CH3
(M-29) = C2H5
The base peak is bolded in each example.
H2C=OH
3. “Alpha” cleavage is common because a resonance stabilized carbocation can form three possible ways in tertiary alcohols where R1 ≠ R2 ≠ R3. (two ways with 2o alcohols). Often all are observed, when present.
OH C
R1
R2
R3
fragmentationOH C
R1
R2
R3
OH C R2
R3
"X" lone pair electrons fill in loss of electrons at carbocation site. This is a common fragmentation pattern for any atom that has a lone pair of electrons (oxygen = alcohol, ether, ester; nitrogen = amine, amide; sulfur and halogens). Loss of R1, R2 or R3 is possible.
radical cation
Spectroscopy Beauchamp 31
y:\files\classes\Spectroscopy Book home\1 Spectroscopy Workbook, latest MS full chapter.doc
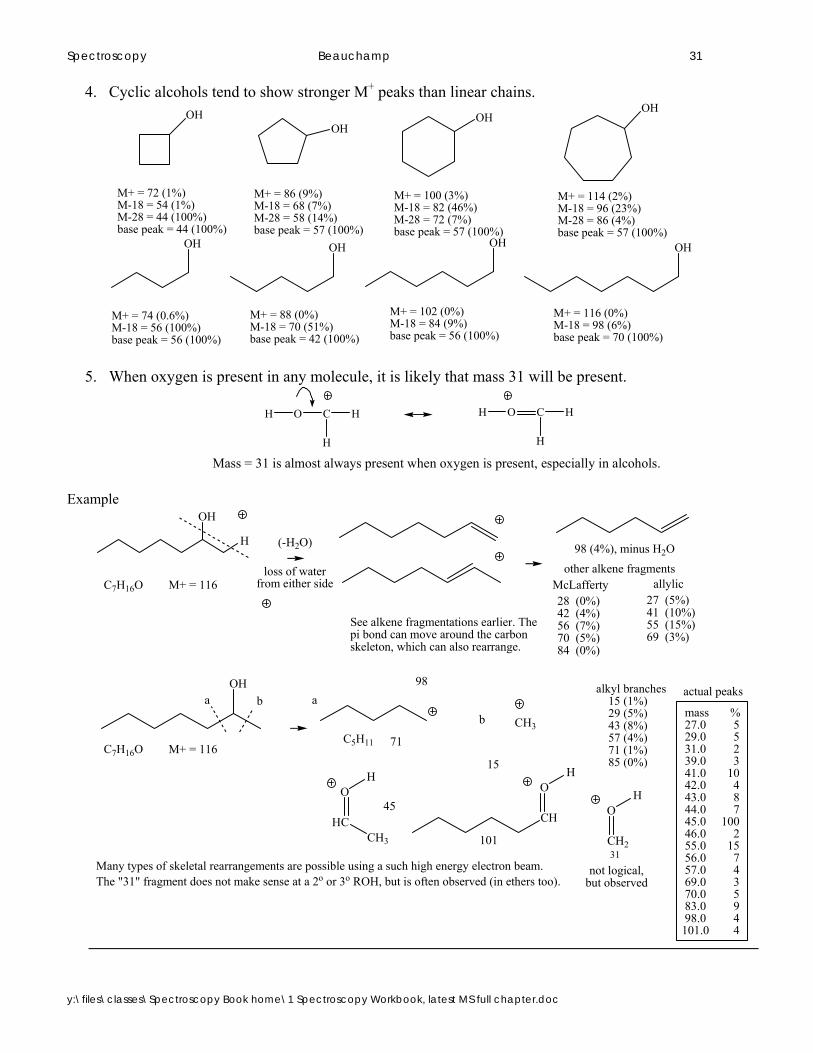
4. Cyclic alcohols tend to show stronger M+ peaks than linear chains.
OHOH
OH
M+ = 100 (3%)M-18 = 82 (46%)M-28 = 72 (7%)base peak = 57 (100%)
M+ = 86 (9%)M-18 = 68 (7%)M-28 = 58 (14%)base peak = 57 (100%)
M+ = 72 (1%)M-18 = 54 (1%)M-28 = 44 (100%)base peak = 44 (100%)
OH
M+ = 114 (2%)M-18 = 96 (23%)M-28 = 86 (4%)base peak = 57 (100%)
OH OH OH OH
M+ = 74 (0.6%)M-18 = 56 (100%)base peak = 56 (100%)
M+ = 88 (0%)M-18 = 70 (51%)base peak = 42 (100%)
M+ = 102 (0%)M-18 = 84 (9%)base peak = 56 (100%)
M+ = 116 (0%)M-18 = 98 (6%)base peak = 70 (100%)
5. When oxygen is present in any molecule, it is likely that mass 31 will be present.
OH C H
H
OH C H
H
Mass = 31 is almost always present when oxygen is present, especially in alcohols. Example
not logical, but observed
(-H2O)
See alkene fragmentations earlier. The pi bond can move around the carbon skeleton, which can also rearrange.
CH2
OH
M+ = 116C7H16O
98
31
71C5H11
HC
OH
45CH
OH
Many types of skeletal rearrangements are possible using a such high energy electron beam. The "31" fragment does not make sense at a 2o or 3o ROH, but is often observed (in ethers too).
OH
CH3 101
M+ = 116C7H16O
OHa b
CH3
15
a
b
H
loss of water from either side
mass % 27.0 5 29.0 5 31.0 2 39.0 3 41.0 10 42.0 4 43.0 8 44.0 7 45.0 100 46.0 2 55.0 15 56.0 7 57.0 4 69.0 3 70.0 5 83.0 9 98.0 4 101.0 4
actual peaks
98 (4%), minus H2O
other alkene fragmentsMcLafferty allylic
27 (5%)41 (10%)55 (15%)69 (3%)
28 (0%)42 (4%)56 (7%)70 (5%)84 (0%)
alkyl branches 15 (1%) 29 (5%) 43 (8%) 57 (4%) 71 (1%) 85 (0%)

Spectroscopy Beauchamp 32
Ethers - Key Points
1. Ethers tend to have stronger M+ peaks than alcohols, but still can lose ROH the way that alcohols lose H2O.
R'H
OR
fragmentationR' O
RH
R = massH 18CH3 32C2H5 46C3H7 60
from either side
2. Alpha cleavage is common from either side and further loss of the carbonyl fragment is possible.
OR' C
R1
R2
R3
fragmentationOR' C
R1
R2
R3
OR' C R2
R3
"X" lone pair electrons fill in loss of electrons at carbocation site. This is a common fragmentation pattern for any atom that has a lone pair of electrons (oxygen = alcohol, ether, ester; nitrogen = amine, amide; sulfur and halogens). Loss of R1, R2 or R3 is possible.
radical cation
3. Loss of an oxygen carbon branch is also possible (from either side).
OR' C
R1
R2
R3
fragmentation
We only see the cations. The fragmentation could potentially occur from either side.radical cation
OR'C
R1
R2
R3
loss of alcoholfrom either side
15 (1%)
CH3
O
(-ROH) OH2
OO
C6H14O
46 (0%) 56 (24%)
59 (100%)87 (2%)
H2C
H2C
CH3
O
c d c
43 (6%)
d
O
C6H14O
e f
O O
e f
29 (27%) 73 (8%) 45 (10%) 57 (31%)
M+ = 102 (4%)HH
HO
28 (4%) 74 (0%)
15.0 1 18.0 3 26.0 1 27.0 12 28.0 4 29.0 27 31.0 57 39.0 5 41.0 26 42.0 3 43.0 6 44.0 1 45.0 10 47.0 1 55.0 6 56.0 24 57.0 31 58.0 1 59.0 100 60.0 3 73.0 8 87.0 2 101.0 1 102.0 4
O
CH2
H
31 (57%)
not logical, but observed
ab
b
amass %
56 (24%), minus ROH28 (4%), minus ROHother alkene fragments
McLafferty allylic27 (12%)41 (26%)55 (6%)69 (0%)
28 (4%)42 (3%)56 (24%)70 (0%)84 (0%)
M+ = 102 (4%)
M+ = 102 (4%)

Spectroscopy Beauchamp 33
y:\files\classes\Spectroscopy Book home\1 Spectroscopy Workbook, latest MS full chapter.doc
Thiols and Thioethers - Key Points
1. The M+2 peak with a single sulfur adds an extra 4.4% to this peak relative to the M+ peak (in addition to other M+2 contributions). Other than chlorine and bromine, this is the most significant M+2 contributor to common organic molecules.
2. Loss of H2S (M-34) is possible for thiols and RSH for sulfides (loss of CH3SH = (M-48)).
R'H
SR
fragmentationR' S
HR
R = massH 34CH3 48C2H5 62C3H7 76
M - (RSH mass)
This can lead to alkene fragmentations.
3. “Alpha” cleavage is possible because a resonance stabilized carbocation can form three possible ways. Often all are observed, when present.
SR C
R1
R2
R3
fragmentationSR C
R1
R2
R3
SR C R2
R3
"X" lone pair electrons fill in loss of electrons at carbocation site. This is a common fragmentation pattern for any atom that has a lone pair of electrons (oxygen = alcohol, ether, ester; nitrogen = amine, amide; sulfur and halogens). Loss of R1, R2 or R3 is possible.
radical cation
4. If a side chain has five or more atoms then cleavage is possible with ring formation (see the
halogens). Beta (β) cleavage is also reasonable.
R = massH 89CH3 103C2H5 117
S SR
fragmentation R
Free radicals are sucked away by the vacuum pump.
S
R
fragmentationS R
Cations reach the detector, will see this mass.
Free radicals are sucked away by the vacuum pump.
Cations reach the detector, will see this mass.
R R
RR
R = massH 61CH3 75C2H5 89

Spectroscopy Beauchamp 34
Example mass % mass %
SHalkyl branches 15 (1%) 29 (15%) 43 (48%) 57 (7%) 71 (0%) 85 (2%)
S
89 (3%)
S
61 (10%)
84 (16%), minus H2S
other alkene fragmentsMcLafferty allylic
27 (16%)41 (35%)55 (35%)69 (25%)83 (1%)
28 (4%)42 (32%)56 (100%)70 (2%)84 (16%)
C6H14S = 118 120 (5.3%)
1-hexanethiol 26.0 1 27.0 16 28.0 4 29.0 15 35.0 2 39.0 9 40.0 2 41.0 35 42.0 32 43.0 48 44.0 2 45.0 4 46.0 2 47.0 15 48.0 1 53.0 2 54.0 3
55.0 35 56.0 100 57.0 7 59.0 2 60.0 2 61.0 10 62.0 1 69.0 25 70.0 2 83.0 1 84.0 16 85.0 2 89.0 3
118.0 30 119.0 2 120.0 1.6
HH
mass % mass %
Salkyl branches 15 (1%) 29 (50%) 43 (4%) 57 (0%) 71 (0%) 85 (0%)
S
89 (25%)
S
61 (38%)
56 (68%), minus H2S
other alkene fragmentsMcLafferty allylic
27 (36%)41 (49%)55 (17%)69 (0%)83 (0%)
28 (9%)42 (4%)56 (68%)70 (0%)84 (0%)
C6H14S = 118 120 (4.8%)
butyl ethyl sulfide
HH 15.0 1 26.0 3 27.0 36 28.0 9 29.0 50 34.0 1 35.0 9 39.0 11 40.0 2 41.0 49 42.0 4 43.0 4 45.0 12 46.0 12 47.0 48 48.0 6 53.0 2 54.0 1
= M+
= M+2
55.0 17 56.0 68 57.0 17 58.0 3 59.0 6 60.0 6 61.0 38 62.0 47 63.0 20 75.0 100 76.0 8 77.0 5 89.0 25 90.0 3
103.0 2 118.0 56.4 119.0 4 120.0 2.7
H2S = 34 (1%)S
75 (100%)
CH3
S S(M-29) = 89 (25%)(M-57) = 89 (38%)
Phenols - Key Points 1. Phenols tend to have intense M+ peaks. (See below = 100% and 36%.)
2. Loss of CO with extensive rearrangement is common.
ROH
radical cation
fragmentationO
R
loss of carbon monoxide...?
R
C OR = massH 65CH3 79C2H5 93
R1
3. A hydroxy tropylium ion with no other substituents has a m/e = 107.
ROH
radical cation
fragmentationR = massCH3 107C2H5 121etc.
R1
O
HR'
Lots of resonance.

Spectroscopy Beauchamp 35
y:\files\classes\Spectroscopy Book home\1 Spectroscopy Workbook, latest MS full chapter.doc
Examples mass % mass %
alkyl branches 15 (0%) 29 (0.8%) 43 (0.4%) 57 (0%) 71 (0%) 85 (0%)
65 (17%) 39 (14%)
C6H60 = 94 (100%) M+1 = (7%)
phenol
27.0 2 37.0 2 38.0 4 39.0 14 40.0 9 47.0 4 50.0 3 51.0 3 53.0 2 55.0 7 61.0 1
62.0 2 63.0 4 64.0 1 65.0 17 66.0 23
67.0 2 74.0 1 93.0 2 94.0 100 95.0 7
OH
mass % mass %
alkyl branches 15 (0.4%) 29 (0.4%) 43 (0.4%) 57 (0%) 71 (0%) 85 (0%)
39 (6%)
allylic R
27 (3%)41 (1%)55 (3%)69 (0%)83 (0%)
C6H60 = 122 (36%) M+1 = (3%)
p-ethylphenol
OH
27.0 3 38.0 1 39.0 6 41.0 1 50.0 3 51.0 5 52.0 3 53.0 2 55.0 3 62.0 1 63.0 2
65.0 3 77.0 13 78.0 3 79.0 2 91.0 4 94.0 1
103.0 2 107.0 100 108.0 8 121.0 3 122.0 36 123.0 3
R
R=H 65 (3%)R=CH3 79 (2%)R=C2H5 93 (1%)
OH
107 (100%)
OH
121 (3%)
Amines - Key Points
1. Amines often have weak or absent M+ peaks. An odd number of nitrogen atoms produces an odd
molecular ion peak.
H3C
H2C
NH
H
H3C
H2C
OH
Molecules made with C, H, S, O, halogens and an even number of nitrogen
atoms have even molecular masses.
Molecules made with an odd number of nitrogen atoms have odd molecular masses
because they have an odd number of hydrogens.
CnH2n+2OmCnH2n+2+NOm
2. Alpha cleavage is usually a major fragmentation pattern in a manner similar to alcohols and ethers.
NR' C
R1
R2
R3
fragmentation NR' C
R1
R2
R3
NR' C R2
R3
radical cation
R" R" R"resonance
The fragment mass depends on what is present in the "R" groups. If all R groups are "H" (H2N=CH2 ) then the mass will be 30, which shows up in almost every amine compound examined, even tertiary amines.
all R = H 30one CH3 44 C2H5 58etc.
mass

Spectroscopy Beauchamp 36
3. Loss of a branch at nitrogen is also possible in a manner similar to alcohols and ethers.
NR' C
R1
R2
R3
fragmentation NR' C R2
R3
radical cation
R" R"
The fragment mass depends on what is present in the "R" groups and which fragment retains the cation charge.
R1
4. Aromatic amines generally show intense M+ peaks.
NH2
radical cationodd mass
1. fragmentation2. rearrangement
R' = massH 106CH3 120C2H5 134etc.
R1
N
HR'
Lots of resonance.
R
HR' even mass
odd mass
Examples
n-isobutyl-sec-butylamineloss of amine
from either side
29 (18%)
CH3
NH
(-ROH)
NH
C8H19N
56
100 (18%)
N
ce
c
e
M+ = 129 (1%)
HH
NH2
CH2
30 (100%)
not logical, but observedand is even the base peak
ab
ba
mass %56 (6%), minus RNH2
other alkene fragmentsMcLafferty allylic
27 (7%)41 (18%)55 (7%)69 (0%)
28 (8%)42 (4%)56 (6%)70 (2%)84 (2%)
H56
15.0 1 18.0 2 27.0 7 28.0 8 29.0 18 30.0 100 31.0 1 39.0 5 41.0 18 42.0 4 43.0 2 44.0 53 45.0 1 55.0 7 56.0 6 57.0 24 58.0 20 70.0 2 72.0 6 84.0 2 86.0 66 87.0 4
100.0 67 101.0 5 114.0 8 128.0 1 129.0 1
C2H5d
NH
114 (8%)
d
M+ = 129 (1%)
NH
C3H7
15 (1%)
86 (66%) 43 (2%)
29 (18%)43 (2%)57 (24%)71 (0%)85 (0%)
alkyl branches
n-isobutyl-sec-butylamine

Spectroscopy Beauchamp 37
y:\files\classes\Spectroscopy Book home\1 Spectroscopy Workbook, latest MS full chapter.doc
15 (1%)
CH3NH
(-ROH)NH2 See alkene
fragmentations above.
NH
NH
C6H15N
45 (0%) 56 (3%)
58 (100%)
86 (2%)
H2C
H2C
CH3
c d c
43 (2%)
d
NH
e f
HN
NH
e
f
29 (8%) 72 (0%)
44 (10%) 57 (3%)
NH
M+ = 101 (9%) H
C6H15NCH2
NH2
30 (33%)
mass % 15.0 1 18.0 1 27.0 5 28.0 5 29.0 8 30.0 33 39.0 2 41.0 4 42.0 3 43.0 2 44.0 10 56.0 3 57.0 3 58.0 100 59.0 4 86.0 2 100.0 2 101.0 9
HH2N
28 (5%) 73 (0%)
NH4
18 (1%)
abb
a
butylethylamine
butylethylamine
butylethylamine
M+ = 101 (9%)
M+ = 101 (9%)
Carbonyl Compounds (aldehydes, ketones, esters, acids, amides, acid chlorides) - Key Points
1. M+ peaks are often observable (though they can be weak or absent). Several examples are provided below.
2. Alpha cleavage is possible from either side. Usually the more stable cation forms in greater amount. It is best to look for both possibilities.
radical cation
CR1
O
R2
R1 or R2 can be lost from aldehydes, ketones, acids, esters, amides, acid chlorides,etc.
CR1 O
C R2O
CR1 O
C R2O
An oxygen lone pair paritally fills in the loss of electrons at the carbocation site via resonance. This is a common fragmentation pattern for any carbonyl compound and can occur from either side, though some are more common than others.

Spectroscopy Beauchamp 38
3. Alpha cleavage can be followed by loss of CO (another -28). That would leave the side branches as observable peaks, plus any further fragment branches from those peaks.
CR1 O
C R2O
CR1 O
C R2O
loss of
C O
R1
R2
Subsequent loss of CO is possible after fragmentation, so not only can you see loss of an branch you can also see the mass of an branch.
4. McLafferty rearrangements are common with at least three carbons in a side chain. Cleavage occurs
between Cα and Cβ.
radical cation
CR1
O
C
C
C
H R
R
R
R
RR
CR1
O
C C
C
R
R
R
RRR
H Positive charge can be on either fragment, which typically has an even mass.
This is another common fragmentation pattern for carbonyl compounds (and other pi systems as well: alkenes, alkynes, aromatics, nitriles, etc.). If the pi bond has at least 3 additional nonhydrogen atoms attached and a hydrogen on the "gamma" atom, the branch can curve around to a comfortable 6 atom arrangement and the pi bond can pick up a hydrgen atom and cut off a fragment between the C and C positions. The positive charge can be seen on either fragment and usually the fragments have an even mass (unless there is an odd number of nitrogen atoms). The mass of either fragment depends on what "R"s are.
= alpha position = beta position = gamma position
The bottom line is there are several ways that carbonyl (C=O) functionality can fall apart. It is best to look for all possibilities. See the last example in this example list below (ketone).
Carbonyl Examples
Carboxylic Acids
OH
O
56 (8%)
28 (4%)42 (7%)70 (3%)
HO
H
60 (100%)
McLafferty
Loss of side chain, then CO (?)
17 (0.4%)99 (0.8%)
O
HO45 (100%)
a b
b
a
OOH
C
O
71 (2%)
15 (0.9%)29 (14%)43 (14%)57 (12%)71 (2%)85 (0.4%)99 (0.8%)
HO
OH
HO
71 (2%)
C6H12O2 = 116 (0%)
C6H12O2 = 116 (0%)
28 (5%)*
hexanoic acid
*28 could also be ethene
18.0 2 26.0 2 27.0 17 28.0 4 29.0 14 30.0 1 31.0 2 39.0 10 40.0 2 41.0 26 42.0 7 43.0 14 45.0 9 53.0 1 55.0 10 56.0 8 57.0 12 58.0 6 59.0 3 60.0 100 61.0 9 69.0 3 70.0 3 71.0 2 73.0 44 74.0 7 83.0 1 87.0 11
mass %
McLaffertyallylic
41 (26%)55 (10%)69 (3%)83 (1%)
alkyl branches
alkenes
OHO
(M-29) = 87 (11%)

Spectroscopy Beauchamp 39
y:\files\classes\Spectroscopy Book home\1 Spectroscopy Workbook, latest MS full chapter.doc
Esters
28 (2%)*
OH
O
CH3O
H
74 (100%)
McLafferty
Loss of side chain, then CO (?)
31 (2%)99 (19%)
O
CH3O59 (15%)
a b
b
aOH3CO
C
O
71 (10%)
15 (10%)29 (12%)43 (31%)57 (4%)71 (10%)85 (0.1%)99 (19%)
H3CO
71 (10%)
C7H14O2 = 130 (0.4%)
C7H14O2 = 130 (0.4%)
O
CH3O
methyl hexanoate
*28 could also be ethene
56 (2%)
28 (2%)42 (6%)70 (3%)
mass %
15.0 10 18.0 1 26.0 1 27.0 11 28.0 2 29.0 12 31.0 2 39.0 7 40.0 1 41.0 17 42.0 6 43.0 31 44.0 2 45.0 2 53.0 1 55.0 9 56.0 2 57.0 4 59.0 15 69.0 2 70.0 3 71.0 10 73.0 1 74.0 100 75.0 5 87.0 32 88.0 4 99.0 19
100.0 1 101.0 8
allylic
41 (17%)55 (9%)69 (2%)83 (0%)
McLafferty
alkyl branches
alkenes
OCH3O
(M-29) = 101 (8%)
Aldehyde
15.0 2 18.0 1 26.0 3 27.0 34 28.0 8 29.0 33 30.0 2 31.0 2 38.0 2 39.0 20 40.0 4 41.0 69 42.0 11 43.0 55 44.0 100
45.0 20 50.0 1 51.0 1 53.0 3 54.0 2 55.0 15 56.0 82 57.0 38 58.0 9 60.0 4 67.0 8 69.0 1 71.0 7 72.0 17 73.0 2 81.0 1 82.0 13 83.0 1
mass %
OH
O
H
H
C6H12O = 100 (0.4%) 44 (100%)
McLafferty
Loss of side chain, then CO (?)
OH
H
1 (?)99 (0.4%)
O
H29 (33%)
a b
b
a OH
C
O
71 (7%)
C6H12O = 100 (0.4%)
15 (2%)29 (33%)43 (55%)57 (38%)71 (7%)85 (0.3%)99 (0.4%)
71 (7%)
hexanal
28 (8%)*
*28 could also be ethene
56 (82%)
28 (8%)42 (11%)70 (0%)
hexanal
alkyl branches
McLaffertyallylic
41 (69%)55 (15%)69 (1%)83 (1%)
alkenes
OH
(M-29) = 71 (7%)

Spectroscopy Beauchamp 40
Ketone
OH
OH
C7H14O = 114 (10%) 58 (91%)
McLafferty
Loss of side chain, then CO (?)
15 (4%)99 (4%)
O
43 (100%)
a b
b
aO
CH3
C
O
71 (14%)
15 (4%)29 (9%)43 (100%)57 (2%)71 (14%)85 (3%)99 (4%)
OH
C7H14O = 114 (10%)
71 (14%)
2-heptanone
*28 could also be ethene
56 (2%)
28 (2%)42 (3%)70 (0%)
28 (2%)*
2-heptanone
mass %
alkyl branches
McLaffertyallylic
41 (12%)55 (5%)69 (0%)83 (0%)
15.0 4 18.0 2 27.0 9 28.0 2 29.0 9 39.0 7 40.0 1 41.0 12 42.0 3 43.0 100 44.0 2 45.0 1 53.0 1 55.0 5 56.0 2 57.0 2 58.0 91 59.0 15 71.0 14 72.0 4 85.0 3 99.0 4
113.0 2 114.0 10 115.0 1
alkenes
O
(M-29) = 85 (3%)
Amide
McLafferty
Loss of side chain, then CO (?)
18 (2%)=NH4
99 (1%)98 (0.2%)
O
H2N44 (29%)
a b
b
a
ONH4
C
O
71 (2%)
15 (0%)29 (8%)43 (26%)57 (2%)71 (2%)85 (0%)99 (1%)
71 (2%)
O
H2N
OH
O
H2N
H
C6H13NO = 115 (0.6%)
H2N
59 (100%)
C6H13NO = 115 (0.6%)
hexanamide
56 (0%)
28 (2%)42 (4%)70 (0%)
28 (2%)*
*28 could also be ethenehexanamide
18.0 2 27.0 9 28.0 2 29.0 8 39.0 6 41.0 12 42.0 4 43.0 26 44.0 28 45.0 1 55.0 4 57.0 2 59.0 100 60.0 3 71.0 2 72.0 19 73.0 4 86.0 9 99.0 1
mass %alkyl branches
McLaffertyallylic
41 (12%)55 (4%)69 (0%)83 (0%)
18 could be NH4 or H2O
alkenes
OH2N
(M-29) = 86 (9%)

Spectroscopy Beauchamp 41
y:\files\classes\Spectroscopy Book home\1 Spectroscopy Workbook, latest MS full chapter.doc
Full example for 2-methyl-4-heptanone
20 30 40 50 60 70 80 90 100 110 120
27
Mostly peaks greater than 5%of the base peak are shown.
57 = base
71
39
41M+ = 128
O
58
2-methylheptan-4-one
130
113100
86
43
42
29
28
57.0 100 58.0 27 59.0 1 69.0 2 70.0 1 71.0 70 72.0 3 85.0 72 86.0 11 113.0 6 128.0 23 129.0 2
27.0 17 28.0 2 29.0 17 39.0 11 40.0 2 41.0 36 42.0 5 43.0 73 44.0 3 53.0 1 55.0 2 56.0 1
C8H16OMW = 128
OHH
2 McLafferty possibilities
ba
C8H16O = 128 (23%)
O
28 (2%)
H
100 (0.4%)
OH
86 (11%)42 (5%)
a = only see the fragment that retains the positive charge
b = only see the fragment that retains the positive charge
a and b
a b
OLose left
branch
CO
c
c = only see the fragment that retains the positive charge
Lose CO
CO
57 (100%) 71 (70%)43 (73%)
C8H16O = 128 (23%)
c
28 (2%)
OLose right
branchC
Od
d = only see the fragment that retains the positive charge
Lose CO
CO
85 (72%)
reasonablemass peaks 128 100 86 85 71 57 43 42 28
C8H16O = 128 (23%)
d
43 (73%)57 (100%) 28 (2%)

Spectroscopy Beauchamp 42
Nitriles - Key Points
1. Usually have weak M+ peaks. An odd number of nitrogen atoms produces an odd molecular ion peak.
H3C
H2C
C
Alkynes made with C and H have even molecular masses.
Nitriles made with an odd number of nitrogen atoms have odd molecular masses
because they have an odd number of hydrogens.
CnH2n-2CnH2n-2+N
CH
H3C
H2C
CN
Compare.
C3H5NMW = 55
C4H6MW = 54
2. With side chains of three carbons or longer McLafferty rearrangements are possible.
CHC
CH
N
CCH
HNH
mass = 41 (R = H)55 (R = CH3)69 (R= CH2CH3)83 (R = C3H7)
C
C
RR
oddmass
oddmass
radical cation
fragmentation
R R
R R
mass = 28 (all H)42 (1R = CH3)56 (1R= CH2CH3)70 (1R = C3H7)
evenmass
Nitrile McLafferty can cut off a fragment between the C and C positions. Either fragment can be observed (if the cation) and the one with the nitrogen atom will show an odd mass.
...or...
3. Alpha cleavage is possible.
CC
NR
radical cation
oddmass
fragmentation CC
N
R
The detector sees cations. Radicals are pumped away.
oddmass
evenmass

Spectroscopy Beauchamp 43
y:\files\classes\Spectroscopy Book home\1 Spectroscopy Workbook, latest MS full chapter.doc
Example
McLafferty
Loss of side chain, then CN (?)
26 (5%)a
a
71 (1%)
15 (2%)29 (43%)43 (32%)57 (28%)71 (1%)85 (0%)
NH
NH
C6H11N = 97 (0.8%) 41 (100%)
NH
C6H11N = 97 (0.8%)
C
N
NH
Hperhaps...?
b 54 (82%)55 (42%)56 (4%)
43 (32%)42 (14%)41 (100%)
NHH
hexanenitrile
56 (4%)
28 (9%)42 (14%)70 (4%)
b
hexanenitrile
15.0 2 26.0 4 27.0 33 28.0 9 29.0 43 30.0 1.6 37.0 1 38.0 3 39.0 22 40.0 5 41.0 100 42.0 14 43.0 28 50.0 1 51.0 2 52.0 3 53.0 4 54.0 82 55.0 42 56.0 4 57.0 32 58.0 1 66.0 1 67.0 1 68.0 30 69.0 23 70.0 4 71.0 1 82.0 24 83.0 1 96.0 12 97.0 1
mass %
alkenes
allylic
41 (100%)55 (42%)69 (23%)83 (1%)
McLafferty
alkyl branches
27 (33%)
H2C CH
HCNH
or
similar masses
These are some of the more common organic functional group fragmentation patterns in EI mass spectroscopy. Most of the examples presented here are very simple monofunctional compounds. When more functional groups are present, more complexity is expected and it gets increasingly difficult to make definitive conclusions on the basis of mass spectroscopy. Even with simple monofunctional group compounds, we have seen that functional groups can change through rearrangements possible due to the high energy of ionization (e.g. alkanes alkenes). If you specialize in other specific patterns of functionality in your work, you will become familiar with useful mass spectral features of those groups. For us, the molecular weight is the primary information we seek from a mass spectrum, assisting us toward our main goal of determining organic structures from the available spectra.
A one page summary sheet showing many of the fragmentation patterns above is provided on the next page, and the following page shows common fragments and their extended variations. These two pages will explain most of what you will encounter as a burgeoning mass spectroscopist.

Spectroscopy Beauchamp 44
Common fragmentation patterns in mass spectroscopy (only cations are observed) 1. Fragment a branch next to a pi bond (α cleavage)
C C C
R
radical cation
pi bond of an alkene,alkyne or aromatic
C C C C C C
Pi electrons partially fill in loss of electrons at carbocation site via resonance. This is a common fragmentation pattern for alkenes, alkynes and aromatics.
Characteristic carbocation stability also applies.
3o R > 2o R > 1o R > CH3
We only see the cationic fragments. The radical fragments are lost to the vacuum.
R
2. Fragment a branch next to an atom with a lone pair of electrons
X C
R
radical cationadjacent lone pair ofan
oxygen or nitrogen atom
X C X C
X lone pair partially fills in loss of electrons at carbocation site via resonance. This is a common fragmentation pattern for any atom that has a lone pair of electrons (oxygen = alcohol, ether, ester; nitrogen = amine, amide; sulfur = thiol, sulfide, etc.) Alcohols often lose water (M-18), ethers can lose ROH, primary amines can lose ammonia (M-17), etc.
R
3. Fragment a branch next to a carbonyl (C=O) bond…and possible subsequent loss of carbon monoxide, CO
CR1 R2
O
CR1 O
C R2O
CR1 O
C R2O
CO
loss of
CO
loss of
R1
R2
R1 or R2 can be lost from aldehydes, ketones, acids, esters, amides...etc.
An oxygen lone pair partially fills in the loss of electrons at the carbocation site via resonance. This is a common fragmentation pattern for any carbonyl compound and can occur from either side, though some are more common than others.
Subsequent loss of CO is possible after fragmentation, so not only can you see loss of an a branch, you can also see the mass of an branch.
ab
b
a
4. McLafferty Rearrangement
This is another common fragmentation pattern for carbonyl compounds (and other pi systems as well: alkenes, aromatics, alkynes, nitriles, etc). If the pi bond has at least 3 additional nonhydrogen atoms attached and a hydrogen on the "gama" atom, the branch can curve around to a comfortable 6 atom arrangement and the pi bond can pick up a hydrogen atom and cut off a fragment between the C and C positions. The positive charge can be seen on either fragment and usually the fragments have an even mass (unless there is an odd number of nitrogen atoms in the observed fragment).
CR1 C
O
C
C
H
CR1 C
O
C
C
H The positive charge can be on either fragment, which typically have even masses (unless an odd number of N is present).
radical cation
= alpha position = beta position = gama positioncation fragment OR cation fragment
Knowing these few fragmentation patterns will allow you to make many useful predictions and interpretations in mass spectroscopy. Also loss of small molecules is common, producing an even mass if no nitrogen is present: H2O = 18, H2S = 34, CH3OH = 32, C2H5OH = 46, NH3 = 17, CH3CO2H = 62, HF = 20, HCl = 36/38, HBr = 80/82, etc. This can even include loss of an alkane equivalent (R branch plus H, 16, 30, 44, etc.) to leave behind an alkene cation that can also generate alkene fragments, which is shown later in the notes (McLafferty & allylic). Certain atoms generate characteristic M+2 peak patterns: 35Cl/37Cl = 75/25 ration, 79Br/81Br = 50/50 ratio, 32S/34S = 95/5 ratio. Any peak 1 amu larger than the one in front of it shows about 1% of the front peak for every carbon atom in the formula (e.g. C6 = M+ / M+1 ratio of 100% / 6%).

Spectroscopy Beauchamp 45
y:\files\classes\Spectroscopy Book home\1 Spectroscopy Workbook, latest MS full chapter.doc
mass = 39 (R = H)53 (R = CH3)67 (R= CH2CH3)
RCH
R
mass = 41 (R = H)55 (R = CH3)69 (R= CH2CH3)83 (R=C3H7)
mass = 65 (R = H)79 (R = CH3)93 (R= CH2CH3)
R R
mass = 91 (R = H)105 (R = CH3)119 (R= CH2CH3)
CH3 = 15CH3CH2 = 29C3H7 = 43C4H9 = 57C5H11 = 71C6H13 = 85
CH2
HH
H
R
mass = 27
mass = 42 (R = H)56 (R = CH3)70 (R= CH2CH3)84 (R=C3H7)
CO R
mass = 29 (R = H)43 (R = CH3)57 (R= CH2CH3)71 (R = C3H7)85 (R = C4H9)99 (R = C5H11)105 (R = C6H5)45 (R= OH)59 (R= OCH3)44 (R= NH2)
C OH2N
C ORO
mass = 44
Loss of small molecules via elimination reactions.
H2O CH3OH C2H5OH NH3 CH3CO2HH2S HF HCl HBr
mass = 18 34 32 46 17 62 2036 (75%)38 (25%)
80 (50%)82 (50%)
A sampling of common and/or miscellaneous peaks that are often seen, (even when they don't make sense). Whatever the initial mass is, a series of masses increased by increments of 14 (CH2)n reveals additional "logical" fragment masses. Remember,we only see the cationic fragments.
CR
OH
CH2
McLafferty
mass =
44 (R = H)58 (R = CH3)72 (R = CH2CH3)86 (R = C3H7)
R CH2
R1
R2
HO R2
R1
variable mass,
(can sometimes see this fragment if it retains the cation charge)
Notice!even masses(without N)
McLafferty Rearrangement Possibilities
CR
H2CH
CH2
R CH2
R1
R2
HCH2
CH2
R1
R2
HC
H
CH2
R1
R2
HN
45 (R = H)59 (R = CH3)73 (R = CH2CH3)87 (R = C3H7)
mass =
CH2
R1
R2
H
H
H
CCH2
CHH
CCH2
NH
also works for
R CH2
mass = 77
mass = 42 (R = H)56 (R = CH3)70 (R= CH2CH3)84 (R = C3H7)
mass =
R
92 (R = H)106 (R = CH3)120 (R= CH2CH3)134 (R = C3H7)
mass = 40 (R = H)54 (R = CH3)68 (R= CH2CH3)82 (R = C3H7)
mass = 41 (R = H)55 (R = CH3)69 (R= CH2CH3)83 (R = C3H7)
Similar Patterns - positive charge is written on both fragments to show that either fragment might be seen at the detector
=
HC
CH2
R
28 (R = H)42 (R = CH3)56 (R= CH2CH3)70 (R = C3H7)84 (R = C4H9)
mass =
R2
R1
R2
R1
R2
R1
R2
R1
60 (R = OH)74 (R = OCH3)59 (R = NH2)78 (R = Cl)

Spectroscopy Beauchamp 46
Very Brief Description of Various Mass Spec Techniques – There are other techniques others besides those mentioned below. If you need practical knowledge of the theory and instrumentation of these experimental techniques, you will need to consult specialty references or textbooks.
1. In electron impact (EI), vaporized sample is bombarded with a very high energy beam of
electrons at about 70 eV (1600 kcal/mole) knocking an electron out of a bonding orbital, forming a radical cation. EI is relatively inexpensive and additional information can be obtained from fragmentation patterns. However fragmentation can prevent seeing the molecular ion peak (parent peak), which may necessitate using another approach, such as CI (next).
2. Chemical ionization (CI) introduces a reagent gas in the source at higher concentration and the gas is ionized by electrons at 500 eV. The reagent gas acts as a strong acid to protonate a basic site in the molecule of interest (at much lower energy to minimize fragmentation). This adds some mass to the sample, such as +1 (proton) or +(mass of gas). The protonated reagent gas can also abstract a proton (forming M-1). Generally, one can see the molecular mass peak (+1) much more clearly using CI. However, the sample must be vaporized and thermally stable which limits many biological samples or high molecular weight samples. If EI-MS does not produce an M+ peak, we will provide a hypothetical CI mass peak (and always assume it represents M+1). If we have access to a proton and 13C NMR we can use those spectra to provide a proton and carbon count. Both IR and 13C can provide information about the functional groups that are present which will give us a clue about how many oxygen and nitrogen atoms are present. If any larger than expected M+2 peaks show up (molecular ion or in a fragment) we might gain information about chlorine, bromine or sulfur. Using such a combination approach could also lead us to a molecular formula.
3. In fast atom bombardment (FAB), a solution of the sample in a matrix of low volatility is bombarded with neutral fast heavy atoms (Xe, Ar at 7 kev). It is a good method for molecules up to 20 KDa (biological molecules), and one can sequence some proteins. However the matrix usually produces background peaks at nearly every mass. One can usually see ions at M+1 or M-1.
4. In electrospray (ES), a solution of the sample is sprayed at atmospheric pressure through a 2-5 kV potential and the resulting droplets are electrostatically charged. There is no matrix background, multicharged species, molecules up to 200 kDa can be analyzed. However the method is susceptible to contamination of ions in the mist solution and nonpolar molecules are not detected.
5. In matrix assisted laser desorption ionization (MALDI), ions are accelerated to an energy of 3kV for mass analysis. A matrix absorbs energy produced by a laser and there is minimal fragmentation with better resolution than ES and FAB, especially at high mass.
6. In field desorption (FD), a sample is deposited directly onto anode where a high electric field produces desorption and ionization. There are very few fragmentations and is a preferred method for synthetic polymers. However samples may begin to decompose before inserted to the direct inlet. It is not good for high sensitivity and biological samples and has poor reproducibility.

Spectroscopy Beauchamp 47
y:\files\classes\Spectroscopy Book home\1 Spectroscopy Workbook, latest MS full chapter.doc
Mass Spec Problem Set Name ___________________________________ 1. If the molecular ion peak is 142, what molecular formula does the rule of 13 predict if the structure is a
hydrocarbon? What formula is predicted if there is one oxygen atom? Two oxygen atoms? Two nitrogen atoms? What is the degree of unsaturation for each possibility above (4 calculations)? Draw one structure for each possibility. What if the molecular ion peak is 143 (same questions)?
2. Both CHO+ and C2H5+ have fragment masses of approximately 29, yet CHO+ has a M+1 peak of 1.13%
and M+2 peak of 0.20%, whereas C2H5+ has a M+1 peak of 2.24% and M+2 peak of 0.01%. High
resolution mass spec shows CHO+ to have a different fragment mass than C2H5+. Explain these
observations and show all of your work. Helpful data follow.
Average NuclideElement Atomic Mass (Relative Abundance) Mass H 1.00797 1H (100) 1.00783 H 2H (0.016) 2.01410 C 12.01115 12C (100) 12.00000 C 13C (1.08) 13.00336 O 15.9994 16O (100) 15.9949 O 17O (0.04) 16.9991 O 18O (0.20) 17.9992
3. What relative abundance would the characteristic M (let M be 100%), M+2, M+4, M+6 mass peaks have for: (a) tribromo, Br3 substituted alkane, (b) trichloro, Cl3, substituted alkane and (c) bromodichloro, BrCl2 substituted alkane? Show your work. You can use these approximate probabilities (P): P35Cl = 0.75, P37Cl = 0.25, P79Br = 0.50, P81Br = 0.50
4. Radical cations of the following molecules (e- + M M.+ + 2e-) will fragment to yield the indicated masses as major peaks. The molecular ion peak is given under each structure. The base peak is listed as 100%. Other values listed represent some relatively stable possibilities (hence higher relative abundance), or common fragmentations (expected), even if in low amount. For the fragments with arrows pointing at them, show what the fragment is and how it could form from the parent ion. This may be as easy as drawing a line between two atoms of a bond, or it may require drawing curved arrows to show how electrons move (e.g. McLafferty). Explain why each fragment is reasonable. This may involve drawing resonance structures or indicating special substitution patterns (3o R+ > 2oR+ > 1oR+ > CH3
+). If a fragment has an even mass and there is a pi bond, think McLafferty (unless an odd number of nitrogen atoms are present). Even masses can also be formed by elimination of a small molecule such as loss of water from an alcohol or loss of an alcohol from an ether or a retro-Diels-Alder reaction, etc. Make sure you show this. Peaks with arrows are expected from the functional group shown. Most of the other peaks should be explainable using the examples in the prior discussions. See how many you can explain.

Spectroscopy Beauchamp 48
M+ = 86
a.
H3C
C
CH2
CH3
m/e % base
CH3
H3C
27.0 17.2 29.0 33.6 41.0 49.1 42.0 5.6 43.0 100.0 55.0 11.3 56.0 28.0 57.0 98.3 71.0 76.7 72.0 4.5 86.0 <1.0
M+ = 114
b.
H3C
H2C
CH2
H2C
CH2
H2C
CH2
CH3
27.0 20.1 29.0 27.4 41.0 43.8 42.0 15.3 43.0 100.0 55.0 11.4 56.0 18.4 57.0 33.5 70.0 12.1 71.0 20.4 85.0 26.5 114.0 6.0
m/e % base
Is there a logical peak that is missing?
M+ = 84
m/e % basec.
27.0 10.0 41.0 49.5 42.0 24.7 43.0 11.2 56.0 100.0 69.0 35.4 84.0 17.5
No easy explanation for 56, but if ring opens and forms alkene, McLafferty might work.
H
?
27.0 20.8 41.0 68.2 42.0 31.4 43.0 100.0 56.0 49.8 69.0 16.9 84.0 11.7
M+ = 84
m/e % base
d.
M+ = 68
e. m/e % base
C
CH
CH2
H2C
H3C
27.0 32.9 29.0 24.4 39.0 54.9 40.0 61.2 41.0 22.7 42.0 22.3 53.0 44.0 67.0 100.0 68.0 15.3
Don't remove the sp C-H, there is a better spot to lose an H atom (resonance).
You might have to move the C=C around.
M+ = 120
f.
m/e % base
65.0 7.2 77.0 2.7 91.0 100.0 92.0 10.8 105.0 3.8 120.0 25.9
H2C
CH2
CH3
M+ = 74
g. m/e % base
27.0 32.7 29.0 16.1 31.0 83.4 41.0 65.6 42.0 31.6 43.0 59.3 55.0 14.1 56.0 100.0 57.0 5.9 74.0 <1.0
H3C
H2C
CH2
H2C
OH
56 is an even mass, but not McLafferty. A small molecule might help explain it.Use a bridging ring to make 105.

Spectroscopy Beauchamp 49
y:\files\classes\Spectroscopy Book home\1 Spectroscopy Workbook, latest MS full chapter.doc
M+ = 74
h. m/e % base
H3C
CH
CH2
CH3
OH 27.0 9.8 28.0 51.5 29.0 6.0 31.0 16.8 41.0 11.7 43.0 9.2 45.0 100.0 56.0 1.5 59.0 20.5 74.0 <1.0
M+ = 88
i. m/e % base
H3C
H2C
CH2
O
CH2
CH3
27.0 23.0 28.0 7.9 29.0 34.9 31.0 100.0 42.0 4.1 43.0 39.8 59.0 98.3 73.0 3.3 88.0 25.7
28 and 42 are even, but not McLafferty. Think like "g", but "organic" water. 31 requires some drastic rearrangements.
Peak 31 is harder to explain, but common.
M+ = 73
j.
m/e % baseH3C
H2C
CH2
H2C
NH2
27.0 3.5 29.0 2.1 30.0 100.0 43.0 1.2 56.0 1.2 73.0 7.3
M+ = 100
k.m/e % base
H3C
C
O
CH2
H2C
CH2
CH3 27.0 8.2 29.0 14.8 43.0 100.0 57.0 15.8 58.0 49.8 85.0 6.4 100.0 8.0 43 is different than C3H7
+
Peak 30 dominates. Think of a small molecule elimination for peak 56.
M+ = 72
l.m/e % base
H
C
O
CH2
H2C
CH3
29 is different than C2H5+
27.0 73.5 29.0 54.8 41.0 69.1 43.0 75.3 44.0 100.0 57.0 23.3 72.0 53.6
M+ = 102
m. m/e % base
O
C
O
CH2
H2C
CH3
H3C
27.0 47.0 29.0 9.2 41.0 45.3 43.0 100.0 59.0 22.2 71.0 49.9 74.0 64.2 87.0 16.4 102.0 1.444 is an even mass, so...
74 is an even mass.
M+ = 88
n.m/e % base
HO
C
O
CH2
H2C
CH3
27.0 13.6 29.0 8.1 41.0 16.3 43.0 14.1 45.0 9.9 60.0 100.0 73.0 32.5 88.0 2.6
M+ = 87
o. m/e % base
H2N
C
O
CH2
H2C
CH3
27.0 26.6 29.0 26.1 41.0 53.4 43.0 32.2 44.0 66.3 59.0 100.0 71.0 8.0 72.0 19.2 87.0 2.9
Normally 59 would be even, but there is nitrogen present.
An even mass strikes again at 60 and 45 is not common,but expected here.
M+ = 69
p.m/e % base
C
CH2
H2C
CH3
N
27.0 28.6 29.0 66.3 40.0 3.8 41.0 100.0 42.0 4.0 54.0 1.2 69.0 0.2
Normally 41 would be even, but there is nitrogen present.
27.0 9.3 41.0 19.3 68.0 100.0 91.0 12.7 92.0 18.8 95.0 7.6 121.0 19.5 136.0 22.6
q.
M+ = 136
m/e % base
Two famous names goes with 68.

Spectroscopy Beauchamp 50
Problem 11 – On the following pages are 22 compounds (these are lettered A-V) from the 22 functional groups numbered below. Try to match each spectrum (A-V) to the class of functional group numbered 1-22, and then try to solve the exact structure of each compound. These are simple monofunctional group compounds. Explain the major peaks that helped decide on your structure. Why are these peaks formed in preference to others (what is the reason for their special stability)?
Classes of compounds
1. alkane 2. branched alkane 3. cycloalkane
4. alkene 5. alkyne 6. aromatic
7. fluorinated alkane 8. chlorinated alkane 9. brominated alkane
10. iodinated alkane 11. alcohol 12. ether
13. phenol 14. aldehyde 15. ketone
16. ester 17. acid 18. amine
19. amide 20. acid chloride 21. sulfide
22. thiol
A few hints are given with some of the spectra to help you match structures with the functional groups mentioned above. The mass of each peak is listed with its percent of the base peak. The IR spectra should also give you some functional group hints. Remember, not every wave number is interpretable.
Hint: No N or O. Explain peaks at 67, 53 and 39. Peak 54 associated with McLafferty.
M+ peak = 82 (very small)
10090
67 = base peak
Mass Spec - Only larger and/or significant peaks are shown.
20 30 80706050
40
8153
39
40
54
100
0
4000 500
= wavenumber = cm-1
3000 2000 1500 1000
1470
1385
25003500
50
%T
1375
2960-2850
2120
725
3310
650
m/e
mass percent
26 328 529 639 36 40 25 41 64 42 16 43 4950 651 852 4 53 15 54 27 55 365 5 67 100 (base)68 6 81 10 82 = M+
Major peaksSample A
0%
25%
50%
75%
100%
110
answer (remove) oct-1-yne
41
42
43

Spectroscopy Beauchamp 51
y:\files\classes\Spectroscopy Book home\1 Spectroscopy Workbook, latest MS full chapter.doc
M+ = 96
10090
81 = base peak
Mass Spec - Only larger and/or significant peaks are shown.
20 30 80706050
5339
40
54
mass percent
Major peaksSample B
0%
25%
50%
75%
100%
110
41
67
me
27 629 439 1240 441 11 53 13 54 16 55 2865 467 42 68 36 77 579 11 81 100 (base)82 795 896 41 = M+97 4
100
0
4000 500
= wavenumber = cm-1
3000 2000 1500 1000
1470
1385
25003500
50
%T
1375
2960-2850
1685838
Hint: Strong M+ peak, easily lost branch explains 81 and two famous names are associated with 68.
1-methylcyclohexeneMW = 96
55 68
79
(remove)
180160
43 = base peak
Mass Spec - Only larger and/or significant peaks are shown.
20 40 1401201008060
mass percent
Major peaksSample C
0%
25%
50%
75%
100%
200me
(remove in book)
100
0
4000 500
= wavenumber = cm-1
3000 2000 1500 1000
1470
1385
25003500
50
%T
1250
2960-2850
640
MW = 164
560
4-methyl-1-bromopentane
Hint: (M+2) is helpful, as are 151/149, 109/107. Explain 85, 57 and 43. 15.0 1 27.0 13 28.0 1 29.0 8 38.0 1 39.0 11 40.0 2 41.0 44 42.0 42 43.0 100 44.0 3 53.0 2 55.0 5 56.0 12 57.0 9 69.0 31 70.0 2 83.0 1 84.0 2
(base)
= M+= M+2
mass percent
Major peaks
85.0 59 86.0 4 107.0 3 109.0 2 149.0 3 151.0 3 164.0 2 166.0 2
4142
5657
69
85
107109
149151
164166
= M+= M+2

Spectroscopy Beauchamp 52
180160
105 = base peak
Mass Spec - Only larger and/or significant peaks are shown.
20 40 1401201008060
mass percent
Major peaksSample D
0%
25%
50%
75%
100%
200me
(remove in book)
= M+
mass percent
Major peaksp-thiomethyltolueneMW = 138
100
0
4000 500
= wavenumber = cm-1
3000 2000 1500 1000
1440
1385
25003500
50
%T
1375
2960-2850 820
3050
3550
1520
Hint: (M+2) is helpful. There is no major peak at 91 for a reason, but 105 will substitute. 27.0 3 39.0 4 45.0 6 50.0 2 51.0 4 52.0 1 53.0 2 63.0 2 65.0 3 68.0 2 77.0 11 78.0 4 79.0 11 89.0 1 91.0 5 93.0 1 103.0 8 104.0 6 105.0 100
= M+2 (5.8%)
(base)
106.0 10 135.0 2 137.0 2 138.0 15.5 139.0 2 140.0 0.9
77 79138 = M+
140 = M+2
180160
94 = base peak
Mass Spec - Only larger and/or significant peaks are shown.
20 40 1401201008060
mass percent
Major peaksSample E
0%
25%
50%
75%
100%
200me
(remove in book) mass percent
Major peaks
77150 = M+
(base)
= M+
butoxybenzeneMW = 150
27.0 4.1 29.0 11.2 39.0 7.1 40.0 1.4 41.0 8.3 50.0 1.2 51.0 4.4 55.0 1.5 56.0 1.1 57.0 3.9 63.0 1.1 65.0 5.3 66.0 5.5 77.0 7.4 94.0 100.0 95.0 7.0 107.0 1.6 150.0 18.4 151.0 2.1
Hint: McLafferty can explain 94, though there is no carbonyl group, but there is an xygen. 107 is small, but more like what you would expect for this functional group. Regular peaks at 29 and 57.The IR peak at 1220 is important.
= wavenumber = cm-1
100
0
4000 5003000 2000 1500 1000
1380
25003500
50
%T
2960-2850 760
3040
1600 1500 6901250
5729 41 69 107

Spectroscopy Beauchamp 53
y:\files\classes\Spectroscopy Book home\1 Spectroscopy Workbook, latest MS full chapter.doc
180160
91 = base peak
Mass Spec - Only larger and/or significant peaks are shown.
20 40 1401201008060
mass percent
Major peaksSample F
0%
25%
50%
75%
100%
200me
(remove in book) mass percent
Major peaks
78
120 = M+
29 41 65 103105
(base)
= M+
27.0 2 39.0 4 41.0 2 50.0 1 51.0 4 63.0 2 65.0 7 77.0 3 78.0 6 79.0 1 89.0 1 91.0 100 92.0 12 103.0 1 105.0 4 120.0 26 121.0 3
100
0
4000 500
= wavenumber = cm-1
3000 2000 1500 100025003500
50
%T
2960-2850 740
30301610
1500
7001450
propylbenzeneMW = 120
Hint: The big base peak is a big clue.
160
Mass Spec - Only larger and/or significant peaks are shown.
20 40 1401201008060
mass percent
Major peaksSample G
0%
25%
50%
me
(remove in book) mass percent
Major peaks
128 = M+
43 = base peak
100
0
4000 500
= wavenumber = cm-1
3000 2000 1500 100025003500
50
%T
2960-2850
1460 14101380
1720
3420
octan-3-oneMW = 128
Hint: There are a lot of peaks that could be explained, both large and small. Try 100, 86, 85, 71, 57, 43 and 29. McLafferty might help on some of these.
15.0 1 18.0 1 26.0 2 27.0 21 28.0 4 29.0 58 30.0 1 39.0 8 40.0 1 41.0 17 42.0 4 43.0 100 44.0 4 53.0 2 55.0 9 56.0 3 57.0 92 58.0 5 71.0 52
72.0 67 73.0 8 81.0 1 85.0 10 86.0 3 99.0 52 100.0 4 128.0 12 129.0 1
(base)
= M+
29
57
7172
85
99
180 200

Spectroscopy Beauchamp 54
160
72 = base peak
Mass Spec - Only larger and/or significant peaks are shown.
20 40 1401201008060
mass percent
Major peaksSample H
0%
25%
50%
75%
100%
me
(remove in book) mass percent
Major peaks
128 = M+5515
100
0
4000 500
= wavenumber = cm-1
3000 2000 1500 100025003500
50
%T
2960-2850
1460 1340
1730
3420
2-ethylhexanalMW = 128
Hint: There are a lot of peaks that could be explained, both large and small. Try 100, 72, 57, 43 and 29. McLafferty might help on some of these.
28102700
27.0 15 28.0 1 29.0 24 39.0 9 40.0 1 41.0 34 42.0 4 43.0 40 44.0 2 53.0 2 54.0 3 55.0 11 56.0 4 57.0 82 58.0 4 67.0 2 68.0 1 69.0 2 70.0 1
71.0 5 72.0 100 73.0 5 81.0 1 82.0 3 85.0 3
100.0 1 128.0 1 = M+
(base)
27 29
41 43
57
180 200
160
Mass Spec - Only larger and/or significant peaks are shown.
20 40 1401201008060
mass percent
Major peaksSample I
0%
25%
50%
me
(remove in book) mass percent
Major peaks
87 = M+
30 = base peak
100
0
4000 500
= wavenumber = cm-1
3000 2000 1500 100025003500
50
%T
2960-2850
1470 13801610
33703290
18.0 2 27.0 3 28.0 33 29.0 2 30.0 100 31.0 2 39.0 2 41.0 3 42.0 2 43.0 1 44.0 2 45.0 3 87.0 4
820
pentylamineMW = 87
Hint: Notice the odd mass peak and the really big peak at 30. Though small 29 and 43 are obvious.
= M+
(base)
27
180 200

Spectroscopy Beauchamp 55
y:\files\classes\Spectroscopy Book home\1 Spectroscopy Workbook, latest MS full chapter.doc
160
Mass Spec - Only larger and/or significant peaks are shown.
20 40 1401201008060
mass percent
Major peaksSample J
0%
25%
50%
me
(remove in book) mass percent
Major peaks
100 = M+
43 = base peak
(base)
= M+
29
57
71
72 85
99
100
0
4000 500
= wavenumber = cm-1
3000 2000 1500 100025003500
50
%T
2960-2850
14701380 720
heptaneMW = 100
Hint: Look how regular the peaks are. What is lost in each fragment…100, 85, 71, 57, 43, 29? 15.0 1 26.0 1 27.0 18 28.0 3 29.0 31 39.0 11 40.0 2 41.0 45 42.0 20 43.0 100 44.0 3 53.0 1 55.0 10 56.0 25 57.0 47 58.0 2 70.0 18 71.0 46
72.0 2 85.0 2 100.0 11
56
4142
70
180 200
160
Mass Spec - Only larger and/or significant peaks are shown.
20 40 1401201008060
mass percent
Major peaksSample K
0%
25%
50%
(remove in book) mass percent
Major peaks
100 = M+
43 = base peak
(base)
= M+
2757
71
7255
4142 70
100
0
4000 500
= wavenumber = cm-1
3000 2000 1500 100025003500
50
%T
2960-2850
1460
1380 770
890
2-ethylpentaneMW = 100
Hint: You can barely see the M+ peak because…? 43 is big and 71, 57 and 29 are all there too.27.0 10
29.0 14 39.0 6 41.0 16 42.0 7 43.0 100 44.0 4 53.0 1 55.0 15 56.0 4 57.0 4 70.0 48 71.0 51 72.0 3
100.0 2
29
me
200180

Spectroscopy Beauchamp 56
160
Mass Spec - Only larger and/or significant peaks are shown.
20 40 1401201008060
mass percent
Major peaksSample L
0%
25%
50%
(remove in book) mass percent
Major peaks
118 = M+
43 = base peak
(base)
me
200180
= wavenumber = cm-1
100
04000 5003000 2000 1500 1000
1380
25003500
50
%T
2960-2850 1470
15.0 2 27.0 25 29.0 6 39.0 16 41.0 2 42.0 65 43.0 100 47.0 47 61.0 35 75.0 13 76.0 50 89.0 92 103.0 4 118.0 63 119.0 5 120.0 3
= M+
= M+2 (4.8%)
47
61
76
89
103
dipropylsulfideMW = 118
Hint: The (M+2) at 120 is helpful, as are 103, 89, 43 and 29. Why is 89 so big and 103 so small?
120 = M+2 (4.8%)75
42
27
29
160
Mass Spec - Only larger and/or significant peaks are shown.
20 40 1401201008060
mass percent
Major peaksSample M
0%
25%
50%
(remove in book) mass percent
Major peaks
43 = base peak
me
200180
212 = M+
= wavenumber = cm-1
100
04000 5003000 2000 1500 1000
1420
25003500
50
%T
2960-2850 1460
85
29
27.0 14 28.0 4 29.0 15 39.0 7 40.0 1 41.0 25 42.0 3 43.0 100 44.0 3 53.0 1 55.0 6 56.0 2 57.0 11 85.0 50 86.0 3 155.0 2 212.0 4
1370
57 155
1-iodohexaneMW = 212
Hint: Look at that big hole in the middle…then there's 85, 57, 43, 29.
(base)
= M+
86

Spectroscopy Beauchamp 57
y:\files\classes\Spectroscopy Book home\1 Spectroscopy Workbook, latest MS full chapter.doc
160
Mass Spec - Only larger and/or significant peaks are shown.
20 40 1401201008060
mass percentMajor peaksSample N
0%
25%
50%
(remove in book) mass percentMajor peaks
56 = base peak
me
200180
= wavenumber = cm-1
29 M+ = 102is missing
15.0 1 18.0 3 27.0 15 28.0 3 29.0 20 31.0 24 39.0 8 41.0 36 42.0 43 43.0 59 45.0 3 53.0 2 55.0 49 56.0 100 57.0 7 69.0 25 70.0 3 71.0 2 73.0 1 83.0 2
84.0 9 102.0 0 M+ (missing)
43
4241
55
69
7071
84
100
0
4000 5003000 2000 1500 1000
1470
25003500
50
%T
1380
2960-2850 1060
3320
660
hexan-1-olMW = 102
Hint: If you look hard there is a tiny peak at 102 (=M+)…and then a gap of 18. Some familiar peaks at 57, 43 and 29 are helpful. There's a special reason that 31 is there…why?
1527
31
160
Mass Spec - Only larger and/or significant peaks are shown.
20 40 1401201008060
mass percentMajor peaksSample O
0%
25%
50%
(remove in book) mass percentMajor peaks
88 = base peak
me
200180
29
M+ = 102is missing
4341 55
31
(base)
= M+
= wavenumber = cm-1
15.0 1 18.0 4 29.0 22 31.0 1 39.0 10 41.0 32 42.0 5 43.0 20 45.0 7 53.0 2 55.0 17 56.0 5 57.0 38 59.0 3 60.0 2 69.0 6 70.0 4 71.0 1
57
567071
101 115116
144 = M+
100
0
4000 5003000 2000 1500 100025003500
50
%T
12301710
3300-2500
29252864
1460
1380
940
73.0 92 74.0 5 87.0 21 88.0 100 89.0 5 101.0 18 115.0 11 116.0 14 144.0 0.5
hexanoic acidMW = 144
Hint: 144 is tiny, but important. (M-56) is big for a reason (McLafferty). Other helpful peaks are 73, 71, 57, 56, 45, 43, 29.
45
73
87

Spectroscopy Beauchamp 58
160
Mass Spec - Only larger and/or significant peaks are shown.
20 40 1401201008060
mass percentMajor peaksSample P
0%
25%
50%
(remove in book) mass percentMajor peaks
85 = base peak
me
200180
(base)
73
= wavenumber = cm-1
100
0
4000 5003000 2000 1500 100025003500
50
%T
1250
17402850-2960
1460
1380
1180
15.0 2 27.0 24 28.0 8 29.0 29 31.0 4 39.0 10 41.0 38 42.0 19 43.0 40 55.0 7 56.0 5 57.0 57 59.0 7 60.0 34 61.0 29 73.0 19 84.0 1 85.0 100
1090
103
104 115
6061
57
43404129
27
M+ = 144is missing
propyl pentanoateMW = 144
.Hint: McLafferty can occur two ways, at 116 and 88. Other useful peaks are at 57, 43, 29 and 45 is there for a reason. By the way, the M+ peak is missing at 144
86.0 6 87.0 3 102.0 10 103.0 60 104.0 4 115.0 4
M+ = 144is missing15 31
160
Mass Spec - Only larger and/or significant peaks are shown.
20 40 1401201008060
mass percentMajor peaksSample Q
0%
25%
50%
(remove in book) mass percentMajor peaks
me
200180
.
18
59 = base peak
(base)
= wavenumber = cm-1
M+ = 143
100
0
4000 5003000 2000 1500 100025003500
50
%T
16502850-2960
1460
1380
= M+
1005557
72
4142
4344
29
3360
3190
1630
720
640
heptanamideMW = 143
Hint: Has an odd M+ peak at 143. McLafferty can explain the base peak at 59 and other familiar peaks are 43 and 29. The peak at 44 can be explained too.
18.0 2 27.0 5 28.0 2 29.0 7 39.0 4 41.0 13 42.0 4 43.0 16 44.0 19 53.0 1 54.0 1 55.0 8 56.0 2 57.0 10 59.0 100 60.0 7 69.0 2 72.0 34
73.0 6 82.0 2 83.0 2 84.0 1 86.0 10 96.0 1 97.0 1 100.0 6 114.0 5 143.0 6

Spectroscopy Beauchamp 59
y:\files\classes\Spectroscopy Book home\1 Spectroscopy Workbook, latest MS full chapter.doc
160
Mass Spec - Only larger and/or significant peaks are shown.
20 40 1401201008060
mass percentMajor peaksSample R
0%
25%
50%
(remove in book) mass percentMajor peaks
me
200180
.
15
43 = base peak
(base)
= wavenumber = cm-1
M+ = 112
100
0
4000 5003000 2000 1500 100025003500
50
%T
1640
2850-2960
1470
1380
= M+
3080
910
990
15.0 1 27.0 25 28.0 5 29.0 35 39.0 28 41.0 82 42.0 66 43.0 100 53.0 8 55.0 99 56.0 87 57.0 19 69.0 44 70.0 86 71.0 12 83.0 34 84.0 22 85.0 2 112.0 20
84
69
5556
57
4142
7185
1-octeneMW = 112
Hint: Some important peaks are M+ at 112 and 41 has a special reason as does 56 (McLafferty-like, but there is no oxygen). Other familiar peaks are at 71, 57, 43 and 29.
293927
53
70
83
160
Mass Spec - Only larger and/or significant peaks are shown.
20 40 1401201008060
mass percentMajor peaksSample S
0%
25%
50%
(remove in book)
= M+
mass percentMajor peaks
me
200180
.
107 = base peak
3927
= wavenumber = cm-1
M+ = 122
100
0
4000 5003000 2000 1500 100025003500
50
%T
1620
2850-2960 1510
1450
3020
8301240
3330
121108
77
6555
p-ethylphenolMW = 122
Hint: The M+ peak is solid at 122…and look at that peak at 107 (think "91" plus a really good something extra). That's almost all there is.
27.0 3 38.0 1 39.0 6 41.0 1 50.0 2 51.0 4 52.0 2 53.0 2 55.0 2 62.0 1 63.0 2 65.0 3 77.0 13 78.0 3 79.0 2 91.0 4 94.0 1
103.0 2 107.0 100 108.0 8 121.0 3 122.0 36 123.0 3
(base)
91

Spectroscopy Beauchamp 60
160
Mass Spec - Only larger and/or significant peaks are shown.
20 40 1401201008060
mass percentMajor peaksSample T
0%
25%
50%
(remove in book) mass percentMajor peaks
me
200180
.
42 = base peak
27
(base)
= wavenumber = cm-1
= M+2
M+ = 106M+2 = 108
100
0
4000 5003000 2000 1500 100025003500
50
%T
2850-2960 1470
1350
= M+
750
15.0 1 27.0 27 28.0 6 29.0 38 39.0 19 41.0 70 42.0 100 43.0 39 53.0 3 55.0 93 56.0 6 57.0 22 63.0 5 69.0 3 70.0 95 71.0 6 91.0 3 93.0 0.9 106.0 1.0 108.0 0.3
660
29 43
55
57
70
9193
1-chloropentaneMW = 106
Hint: The M+ peak barely shows at 106 (and 108 is 1/3 its size). 70 is really big because it lost a small molecule of… (36)? 71, 57, 43 and 29 are old familiar friends.
15
39
160
Mass Spec - Only larger and/or significant peaks are shown.
20 40 1401201008060
mass percentMajor peaksSample U
0%
25%
50%
(remove in book) mass percentMajor peaks
me
200180
.
2729 5739
109 = base peak
(base)
= wavenumber = cm-1
100
0
4000 5003000 2000 1500 100025003500
50
%T
2850-2960
1510
1470
= M+
740 700
3080-30301380
980
110 = M+
918365 77
benzylfluorideMW = 110
Hint: M+ is big, but M-1 is bigger and that's unusual. However, it has lots of stabilization. There is a halogen present, but M+2 is not important. What does 91 remind you of?
27.0 2 28.0 2 31.0 1 39.0 8 44.0 1 45.0 2 50.0 5 51.0 8 57.0 5 62.0 3 63.0 6 65.0 4 77.0 2 81.0 2 83.0 12 89.0 4
91.0 8 92.0 1 107.0 2 108.0 1 109.0 100 110.0 55 111.0 4
314445
51

Spectroscopy Beauchamp 61
y:\files\classes\Spectroscopy Book home\1 Spectroscopy Workbook, latest MS full chapter.doc
160
Mass Spec - Only larger and/or significant peaks are shown.
20 40 1401201008060
mass percentMajor peaksSample V
0%
25%
50%
(remove in book) mass percentMajor peaks
me
200180
.
55 = base peak
benzoyl chorideMW = 134.6
(base)
= wavenumber = cm-1
= mass+2
100
0
4000 5003000 2000 1500 100025003500
50
%T
2860-2960
11301470
730
580
1380
960
99
91
15.0 4 27.0 59 29.0 44 39.0 36 41.0 84 42.0 43 43.0 97 53.0 5 55.0 100 56.0 27 57.0 45 60.0 13 65.0 2 69.0 10 70.0 23 71.0 40 77.0 4 78.0 34
= mass+2
1800
440
29
27
39
4142
43
53
5657
60 6970
71 78
80
105106107108
Hint: Peaks at 105 and 106 have M+2 about 1/3 their size. There is a really helpful band in the IR spectrum. There are the usual peaks at 29, 43, 57 and 71.
80.0 11 91.0 12 92.0 1 98.0 24 99.0 84
105.0 6 106.0 6 107.0 2 108.0 2
134.0 0 M+ (missing)
134.0 0 M+ (missing)
15 65
What Happens When There is More Than One Functional Group?
We have mostly looked at monofunctional groups to learn the main clues provided by each functional group toward our goal of determining organic structures. What if more than one functional group is present? We can pit two strongly stabilizing groups against one another and see what happens. Both benzyl (91 mass) and methyliminium (30 mass) carbocations are strongly stabilized and generate easily recognizable MS peaks. We have seen both individually earlier, but we will repeat them below for comparison.
H2N
H
HCH2
H2CNH2
15.0 1 18.0 3 26.0 1 27.0 4 28.0 8 29.0 2 30.0 100.0 31.0 2 39.0 2 41.0 5 42.0 3 43.0 2 44.0 1 56.0 1 58.0 2 59.0 9
M+ = 59 mass = 30mass = 91M+ = 120basepeak
27.0 2 39.0 4 41.0 2 50.0 1 51.0 4 63.0 2 65.0 7 77.0 3 78.0 6 79.0 1 89.0 1 91.0 100 92.0 11 103.0 1 105.0 4 120.0 26
basepeak
(M-29) (M-29)

Spectroscopy Beauchamp 62
One way we could pit these two groups against one another would be to look at the mass spectrum of benzyl amine. Do we lose the amine group, NH2, or do we lose the phenyl group, C6H5? Not surprisingly, we don’t lose either. Instead they work together to make an even more stable carbocation with mass of 106 (M-1).
NH2
M+ = 107
H2CNH2
mass = 30 (27%)
CH2
mass = 91 (15%)
27.0 2 28.0 11 29.0 5 30.0 27 32.0 1 38.0 2 39.0 6 41.0 1 50.0 6 51.0 11 52.0 4 52.5 2 53.0 3 62.0 1 63.0 3 65.0 5
74.0 2 75.0 1 76.0 2 77.0 19 78.0 12 79.0 35 80.0 3 89.0 4 90.0 2 91.0 15 92.0 2
103.0 2 104.0 5 105.0 1 106.0 100 107.0 60
basepeak
NH2
HH H
mass = 106 (100%)
imminiumion
benzylcarbocation
(tropylium ion)
both stabilizing
groups
(M-29) (M-16) (M-77)
Another way to compare these two groups would be to look at the spectrum of 2-phenylethylamine (phenethylamine). Do we lose benzyl or do we lose methylimminium? Here we find the methylimminium group is the preferred method of fragmentation, but the benzyl carbocation is still observable. As molecules get more complicated, so will their mass spectra. We will not emphasize such examples because there are other methods much more helpful to our goal of determining organic structures, namely 1H and 13C NMR spectroscopy.
NH2
H
H
H2CNH2
CH2
M+ = 121
mass = 30 (100%)mass = 30 (15%)
28.0 2 30.0 100 31.0 1 39.0 3 50.0 1 51.0 3 63.0 2 65.0 6 77.0 2 89.0 1 91.0 15 92.0 6 103.0 2 120.0 1 121.0 6
basepeak
benzylcarbocation
(tropylium ion)
imminiumion
NH2
H
H
mass = 120 (1%)(M-29) (M-91)(M-1)
Problem – Discuss the MS of the following compounds. How do they compare to those in the examples above?
HO
OH OH
M+ = 120basepeak
27.0 2 39.0 4 41.0 2 50.0 1 51.0 4 63.0 2 65.0 7 77.0 3 78.0 6 79.0 1 89.0 1 91.0 100 92.0 11
103.0 1 105.0 4 120.0 26
basepeak
basepeak(very
unusual) basepeak
15.0 1 26.0 2 27.0 10 28.0 4 29.0 7 30.0 2 31.0 100 32.0 2 33.0 1 39.0 4 41.0 7 42.0 12 43.0 2 45.0 2 57.0 1 59.0 16 60.0 10
18.0 1 26.0 1 27.0 6 28.0 2 29.0 4 31.0 3 37.0 2 38.0 3 39.0 11 40.0 1 41.0 1 43.0 1 49.0 1
62.0 3 63.0 6 64.0 2 65.0 7 74.0 3 75.0 2
74.0 1 77.0 5 78.0 4 79.0 1 89.0 3 90.0 1 91.0 100 92.0 60 93.0 4 103.0 4 104.0 4 122.0 30 123.0 3
27.0 1 31.0 4 38.0 1 39.0 8 41.0 1 50.0 3 51.0 6 52.0 2 62.0 1 63.0 4 64.0 1 65.0 15 66.0 1
50.0 10 51.0 21 52.0 6 53.0 6 53.5 2 54.0 1 61.0 1
76.0 2 77.0 49 78.0 11 79.0 100 80.0 10 89.0 6 90.0 9 91.0 17 92.0 2 105.0 4 107.0 68 108.0 99 109.0 8
M+ = 60
M+ = 108M+ = 122

Spectroscopy Beauchamp 63
y:\files\classes\Spectroscopy Book home\1 Spectroscopy Workbook, latest MS full chapter.doc
Problem – Major peaks in mass spectra representing most organic groups are provided below. Explain as many peaks as seems reasonable. There is plenty of opportunity to practice your new mass spec skills. Alkanes (Also look for alkene fragments too.)
72.0 3 85.0 2 100.0 11
mass % mass %
C7H16M+ = 100
27.0 19 28.0 3 29.0 31 39.0 11 40.0 2 41.0 45 42.0 20 43.0 100
44.0 3 53.0 2 55.0 10 56.0 25 57.0 48 58.0 2 70.0 18 71.0 46
mass % mass % mass %
heptane
2-methylhexane
mass % mass %
C7H16M+ = 100
mass % mass % mass % 84.0 5 85.0 37 86.0 3 100.0 3
27.0 11 29.0 15 39.0 8 40.0 1 41.0 31 42.0 35 43.0 100 44.0 3
53.0 1 55.0 5 56.0 21 57.0 29 58.0 1 69.0 1 70.0 2 71.0 2
3-methylhexane
mass % mass %
C7H16M+ = 100
mass % mass % mass % 72.0 3.1 84.0 1.1 85.0 5.7 100.0 4.0
27.0 12.8 29.0 24.7 39.0 9.1 40.0 1.5 41.0 36.7 42.0 9.2 43.0 100.0 44.0 3.5
53.0 1.8 55.0 15.0 56.0 39.3 57.0 52.8 58.0 2.3 69.0 2.0 70.0 46.5 71.0 58.3
3-ethylpentane
mass % mass %
C7H16M+ = 100
mass % mass % mass % 55.0 14.9 56.0 3.6 57.0 4.5 70.0 48.4 71.0 50.6 72.0 2.8 100.0 1.7
27.0 9.9 29.0 14.3 39.0 6.4 41.0 16.1 42.0 6.8 43.0 100.0 44.0 3.5 53.0 1.4
2,3-dimethylpentane
mass % mass %
C7H16M+ = 100
mass % mass % mass % 71.0 38.2 72.0 2.2 84.0 1.0 85.0 12.6 100.0 3.0
27.0 14.8 28.0 1.3 29.0 27.0 39.0 10.8 40.0 2.0 41.0 52.5 42.0 26.0 43.0 100.0
44.0 3.4 53.0 2.2 55.0 9.8 56.0 99.8 57.0 76.2 58.0 3.3 69.0 1.9 70.0 10.8
3,3-dimethylpentane
mass % mass %
C7H16M+ = 100
mass % mass % mass % 86.0 1.3 100.0 0.0
27.0 9.3 29.0 11.5 39.0 6.4 41.0 15.7 42.0 2.7 43.0 100.0 44.0 3.4 53.0 1.8
55.0 11.2 56.0 1.3 57.0 6.1 69.0 1.4 70.0 18.0 71.0 69.7 72.0 4.1 85.0 19.3

Spectroscopy Beauchamp 64
2,4-dimethylpentane
mass % mass %
C7H16M+ = 100
mass % mass % mass % 85.0 18.5 86.0 1.3 100.0 0.0
15.0 1.0 27.0 10.6 29.0 14.0 39.0 7.6 40.0 1.4 41.0 33.5 42.0 23.9 43.0 100.0
44.0 3.3 53.0 1.0 55.0 3.2 56.0 35.3 57.0 71.7 58.0 3.2 69.0 2.4 71.0 1.1
2,2,3-trimethylbutane
mass % mass %
C7H16M+ = 100
mass % mass % mass % 83.0 1.0 85.0 34.4 86.0 2.3 100.0 0.0
15.0 1.5 27.0 8.4 29.0 15.6 39.0 9.3 40.0 1.6 41.0 42.1 42.0 2.7 43.0 62.6
44.0 2.1 53.0 1.6 55.0 5.1 56.0 58.3 57.0 100.0 58.0 4.6 59.0 2.8 69.0 2.4
C6H14M+ = 86hexane
mass % mass %mass % mass % mass % 86.0 10.0 15.0 1.3
26.0 1.7 27.0 22.7 28.0 4.7 29.0 42.5 30.0 1.0 38.0 1.2 39.0 14.8
40.0 3.1 41.0 72.5 42.0 42.4 43.0 80.9 44.0 2.8 51.0 1.2 53.0 2.2 54.0 1.2
55.0 12.1 56.0 70.5 57.0 100.0 58.0 4.7 69.0 8.5 70.0 2.6 71.0 11.0 84.0 3.2
C6H14M+ = 86
2-methylpentane
mass % mass %mass % mass % mass % 72.0 2.2 78.0 1.0 85.0 1.5 86.0 6.1
27.0 12.6 28.0 1.3 29.0 11.3 39.0 9.6 40.0 1.5 41.0 29.5 42.0 52.6 43.0 100.0
44.0 3.2 53.0 1.2 55.0 6.7 56.0 9.4 57.0 17.0 69.0 1.3 70.0 10.2 71.0 39.5
C6H14M+ = 86
3-methylpentane
mass % mass %mass % mass % mass % 86.0 3.0 26.0 1.0
27.0 13.3 28.0 2.2 29.0 39.1 39.0 9.2 40.0 1.2 41.0 53.4 42.0 3.6
43.0 25.4 53.0 1.8 55.0 6.7 56.0 76.7 57.0 100.0 58.0 4.5 70.0 1.6 71.0 5.7
C6H14M+ = 86
2,2-dimethylbutane
mass % mass %mass % mass % mass % 57.0 98.3 58.0 4.7 70.0 3.3 71.0 76.7 72.0 4.5 86.0 0.1
15.0 1.6 26.0 1.1 27.0 17.2 28.0 2.6 29.0 33.6 38.0 1.0 39.0 13.6 40.0 1.8
41.0 49.1 42.0 5.6 43.0 100.0 44.0 3.1 51.0 1.1 53.0 2.5 55.0 11.3 56.0 28.0
C6H14M+ = 86
2,3-dimethylbutane
mass % mass %mass % mass % mass % 86.0 3.6 15.0 1.4
27.0 13.7 28.0 1.9 29.0 7.5 39.0 9.0 40.0 1.5 41.0 27.4 42.0 87.0
43.0 100.0 44.0 3.5 53.0 1.4 55.0 5.2 56.0 1.5 57.0 2.3 71.0 19.2 72.0 1.1

Spectroscopy Beauchamp 65
y:\files\classes\Spectroscopy Book home\1 Spectroscopy Workbook, latest MS full chapter.doc
Alkenes & Cycloalkanes
C7H14M+ = 98
mass % mass %mass % mass % mass %
1-heptene
69.0 31.1 70.0 44.2 71.0 2.5 83.0 4.2 98.0 13.8 99.0 1.1
15.0 1.1 18.0 1.2 26.0 2.0 27.0 25.7 28.0 4.9 29.0 55.9 30.0 1.2 38.0 1.8
39.0 30.5 40.0 4.9 41.0 96.8 42.0 54.9 43.0 15.9 50.0 1.5 51.0 2.3 52.0 1.0
53.0 6.5 54.0 7.6 55.0 67.6 56.0 100.0 57.0 30.7 58.0 1.3 67.0 2.3 68.0 3.6
C7H14M+ = 98
mass % mass %mass % mass % mass %
trans-2-heptene
71.0 1.1 81.0 1.2 83.0 4.2 98.0 43.4 99.0 3.6
15.0 1.4 26.0 2.2 27.0 26.3 28.0 3.7 29.0 22.0 38.0 2.1 39.0 27.6 40.0 4.8
41.0 74.3 42.0 19.3 43.0 20.5 50.0 1.8 51.0 3.1 52.0 1.4 53.0 9.9 54.0 11.6
55.0 100.0 56.0 90.4 57.0 9.9 65.0 1.3 67.0 5.0 68.0 3.6 69.0 48.1 70.0 16.9
C7H14M+ = 98
mass % mass %mass % mass % mass %
trans-3-heptene
79.0 1.3 81.0 1.7 83.0 8.3 97.0 2.0 98.0 80.2 99.0 6.1
27.0 13.5 28.0 3.1 29.0 12.8 38.0 1.1 39.0 18.4 40.0 3.7 41.0 95.3 42.0 23.7
43.0 18.0 50.0 1.2 51.0 2.4 52.0 1.0 53.0 7.7 54.0 8.3 55.0 82.5 56.0 98.8
57.0 14.2 65.0 1.8 67.0 8.5 68.0 5.2 69.0 100.0 70.0 28.3 71.0 1.6 77.0 1.0
C7H14M+ = 98
mass % mass %mass % mass % mass %
cis-2-heptene
69.0 49.4 70.0 17.6 71.0 2.6 81.0 1.2 83.0 4.5 98.0 43.3 99.0 3.9
15.0 1.4 26.0 1.7 27.0 24.8 28.0 4.9 29.0 23.4 38.0 1.6 39.0 23.0 40.0 4.3
41.0 87.8 42.0 22.8 43.0 27.5 44.0 1.0 45.0 1.1 50.0 1.5 51.0 2.4 52.0 1.0
53.0 7.6 54.0 9.7 55.0 79.3 56.0 100.0 57.0 18.4 65.0 1.0 67.0 4.0 68.0 3.6
C7H14M+ = 98
mass % mass %mass % mass % mass %
2-methy l-1-hexene
83.0 1.1 98.0 3.1
27.0 11.7 28.0 3.1 29.0 8.9 39.0 10.5 40.0 2.9 41.0 46.6 42.0 5.6 43.0 11.5
53.0 3.2 54.0 1.6 55.0 17.7 56.0 100.0 57.0 10.5 67.0 1.5 69.0 9.9 70.0 12.4
C7H14M+ = 98
mass % mass %mass % mass % mass %
3-methy l-3-hexene
98.0 35.9 99.0 3.2
15.0 1.4 26.0 1.1 27.0 15.5 28.0 3.3 29.0 12.2 38.0 1.5 39.0 18.9 40.0 3.4
41.0 82.1 42.0 6.1 43.0 8.2 50.0 1.7 51.0 3.2 52.0 1.4 53.0 8.2 54.0 2.2
55.0 69 56.0 19 57.0 2 65.0 2 67.0 7 68.0 3 69.0 100 70.0 13
72.0 1.2 73.0 1.0 77.0 1.0 79.0 1.4 81.0 2.5 83.0 14.9 84.0 1.1 85.0 1.5
C7H14M+ = 98
mass % mass %mass % mass % mass %
2,3-dimethy l-2-pentene
83.0 82.9 84.0 5.7 85.0 4.8 98.0 37.8 99.0 4.1
15.0 2.2 18.0 1.0 27.0 14.1 28.0 2.3 29.0 12.8 31.0 1.3 38.0 1.1 39.0 17.9
40.0 3.4 41.0 65.3 42.0 5.1 43.0 18.9 50.0 1.3 51.0 2.5 52.0 1.2 53.0 7.6
54.0 2.3 55.0 100.0 56.0 13.7 57.0 4.6 58.0 1.8 59.0 8.9 65.0 1.7 67.0 7.3
68.0 1.6 69.0 21.1 70.0 4.5 71.0 1.0 72.0 5.2 73.0 3.5 79.0 1.5 81.0 4.2

Spectroscopy Beauchamp 66
C7H14M+ = 98
mass % mass %mass % mass % mass %
cycloheptane
84.0 3.7 91.0 2.0 92.0 1.4 95.0 1.1 96.0 3.4 97.0 1.7 98.0 62.9 99.0 5.0
15.0 1.7 26.0 2.4 27.0 23.2 28.0 4.8 29.0 23.9 38.0 2.2 39.0 30.9 40.0 6.2
41.0 77.6 42.0 75.4 43.0 14.1 50.0 1.6 51.0 2.9 52.0 1.3 53.0 8.5 54.0 18.4
55.0 96.8 56.0 100.0 57.0 17.9 63.0 1.0 65.0 2.0 66.0 1.7 67.0 13.2 68.0 27.2
69.0 61.7 70.0 85.7 71.0 5.1 77.0 1.1 79.0 1.5 81.0 7.5 82.0 4.6 83.0 48.6
C7H14M+ = 98
mass % mass %mass % mass % mass %
methylcyclohexane
84.0 7.0 97.0 2.8 98.0 36.9 99.0 3.1
26.0 1.0 27.0 12.9 28.0 3.2 29.0 11.1 38.0 1.0 39.0 15.6 40.0 2.9 41.0 41.1
42.0 28.6 43.0 6.9 51.0 1.9 53.0 4.6 54.0 4.5 55.0 76.3 56.0 28.5 57.0 5.0
67.0 4.5 68.0 9.3 69.0 22.5 70.0 21.8 71.0 1.4 81.0 1.4 82.0 14.5 83.0 100.0
C7H14M+ = 98
mass % mass %mass % mass % mass %
ethylcyclopentane
83.0 8.2 98.0 12.3 99.0 1.0
15.0 1.0 26.0 1.4 27.0 13.7 28.0 2.6 29.0 12.5 38.0 1.2 39.0 18.6 40.0 3.5
41.0 63.7 42.0 41.3 43.0 7.0 50.0 1.0 51.0 1.7 53.0 5.1 54.0 5.3 55.0 47.9
56.0 44.7 57.0 7.4 65.0 1.2 67.0 10.0 68.0 66.4 69.0 100.0 70.0 56.1 71.0 3.2
C7H14M+ = 98
mass % mass %mass % mass % mass %
1,1,2,2-tet ramethylcyclopropane
69.0 2.4 81.0 1.4 83.0 88.4 84.0 6.0 98.0 18.4 99.0 1.4
27.0 9.6 28.0 2.3 29.0 8.3 38.0 1.1 39.0 18.0 40.0 3.0 41.0 48.6 42.0 2.7
43.0 17.4 51.0 1.6 53.0 3.9 55.0 100.0 56.0 11.2 57.0 2.0 65.0 1.1 67.0 3.7
Alcohols and ethers
C7H16OM+ = 116
mass % mass %mass % mass % mass %
1-heptanol
OH
73.0 2.0 83.0 7.4 98.0 5.6 116.0 0.0
15.0 1.3 18.0 3.2 26.0 1.2 27.0 20.2 28.0 4.6 29.0 27.2 31.0 25.6 39.0 11.3
40.0 2.4 41.0 62.6 42.0 48.5 43.0 66.7 44.0 2.7 45.0 3.6 53.0 2.5 54.0 5.6
55.0 65.7 56.0 95.5 57.0 23.4 67.0 1.8 68.0 13.3 69.0 51.6 70.0 100.0 71.0 6.3
C7H16OM+ = 116
mass % mass %mass % mass % mass %OH
2-heptanol
98.0 4.0 101.0 3.7 116.0 0.0
27.0 5.1 29.0 5.4 31.0 1.5 39.0 3.2 41.0 10.0 42.0 3.6 43.0 8.1 44.0 6.9
45.0 100.0 46.0 2.3 55.0 14.9 56.0 6.8 57.0 3.5 69.0 2.7 70.0 4.8 83.0 8.9
C7H16OM+ = 116
mass % mass %mass % mass % mass %
3-heptanol
OH
98.0 2.9 116.0 0.0
27.0 9.8 28.0 2.1 29.0 11.1 30.0 1.1 31.0 22.1 39.0 5.3 41.0 34.9 42.0 2.9
43.0 11.4 44.0 2.9 45.0 8.1 53.0 1.1 55.0 8.0 56.0 5.8 57.0 8.1 58.0 8.0
59.0 100.0 60.0 3.3 69.0 70.2 70.0 5.4 73.0 1.0 86.0 2.7 87.0 31.3 88.0 1.8

Spectroscopy Beauchamp 67
y:\files\classes\Spectroscopy Book home\1 Spectroscopy Workbook, latest MS full chapter.doc
C7H16OM+ = 116
mass % mass %mass % mass % mass %
4-heptanol
OH 69.0 4.0 70.0 1.3 71.0 3.2 72.0 6.3 73.0 71.4 74.0 3.4 98.0 2.0 116.0 0.0
18.0 1.1 19.0 1.1 27.0 9.8 28.0 1.1 29.0 6.9 31.0 11.1 39.0 5.4 41.0 13.1
42.0 2.5 43.0 33.4 44.0 5.4 45.0 4.6 53.0 1.2 55.0 100.0 56.0 9.2 57.0 4.4
C7H16OM+ = 116
mass % mass %mass % mass % mass %
3-ethy l-3-pentanol
OH 67.0 1.2 69.0 28.1 70.0 2.7 83.0 1.6 87.0 100.0 88.0 5.4 98.0 2.8 116.0 0.0
18.0 1.7 27.0 8.5 28.0 1.5 29.0 13.9 31.0 6.1 39.0 4.2 41.0 24.9 42.0 1.5
43.0 12.5 45.0 73.7 46.0 1.7 53.0 1.9 55.0 8.2 56.0 2.3 57.0 11.2 59.0 2.5
C7H16OM+ = 116
mass % mass %mass % mass % mass %
1-methoxyhexane
O
57.0 3.4 69.0 13.2 70.0 2.4 83.0 1.3 84.0 19.4 85.0 1.8 116.0 0.0
15.0 2.0 27.0 5.9 28.0 1.9 29.0 8.2 31.0 1.8 33.0 5.2 39.0 4.5 41.0 14.1
42.0 13.1 43.0 13.3 45.0 100.0 46.0 2.4 47.0 1.3 54.0 1.3 55.0 16.4 56.0 53.7
C7H14OM+ = 114
mass % mass %mass % mass % mass %OH
cycloheptanol
85.0 5.6 86.0 4.1 95.0 2.9 96.0 22.6 97.0 2.0 113.0 1.1 114.0 2.1
15.0 1.3 18.0 1.4 26.0 1.0 27.0 11.9 28.0 2.8 29.0 12.0 30.0 1.1 31.0 5.4
39.0 12.7 40.0 2.8 41.0 25.0 42.0 14.8 43.0 10.3 44.0 22.5 45.0 5.3 51.0 1.1
53.0 4.8 54.0 15.9 55.0 23.1 56.0 4.4 57.0 100.0 58.0 9.1 66.0 2.0 67.0 19.8
68.0 38.6 69.0 4.0 70.0 13.0 71.0 14.9 72.0 6.3 81.0 34.2 82.0 2.5 83.0 1.4
113.0 1.4 114.0 2.8
C7H14OM+ = 114
mass % mass %mass % mass % mass %
4-methylcyclohexanol
OH 15.0 1.5 18.0 2.4 26.0 1.1 27.0 13.5 28.0 3.7 29.0 19.8 30.0 1.7 31.0 5.7
39.0 12.7 40.0 2.6 41.0 34.8 42.0 9.9 43.0 7.8 44.0 17.0 45.0 3.3 51.0 1.5
53.0 5.5 54.0 7.7 55.0 31.1 56.0 12.0 57.0 100.0 58.0 52.8 59.0 2.7 65.0 1.0
67.0 10.7 68.0 11.8 69.0 3.1 70.0 34.1 71.0 12.6 73.0 1.7 77.0 1.0 79.0 2.0
81.0 47.2 82.0 3.7 83.0 2.2 85.0 3.8 86.0 3.1 95.0 6.0 96.0 35.0 97.0 3.1
mass %
C7H14OM+ = 114
mass % mass %mass % mass % mass %
2-cyclopentylethanol
OH 71.0 1.9 79.0 1.5 81.0 23.9 82.0 2.2 83.0 7.5 95.0 3.0 96.0 4.0 114.0 0.0
18.0 1.3 27.0 10.6 28.0 2.5 29.0 8.4 31.0 11.0 39.0 13.4 40.0 3.8 41.0 40.7
42.0 9.6 43.0 4.8 44.0 5.8 45.0 2.4 51.0 1.2 53.0 7.5 54.0 12.3 55.0 36.9
56.0 7.0 57.0 7.3 58.0 1.0 65.0 1.2 66.0 7.6 67.0 99.6 68.0 100.0 69.0 15.4
C7H14OM+ = 114
mass % mass %mass % mass % mass %
3-butoxypropene
56.0 13.3 57.0 42.9 58.0 72.2 59.0 3.8 71.0 10.7 72.0 1.8 73.0 2.8 85.0 1.9
O 15.0 1.4 18.0 1.3 26.0 1.8 27.0 9.9 28.0 4.0 29.0 24.7 30.0 3.2 31.0 3.2
38.0 1.1 39.0 13.4 40.0 3.0 41.0 100.0 42.0 7.6 43.0 16.0 44.0 1.9 55.0 10.4
114.0 0.0

Spectroscopy Beauchamp 68
C8H18OM+ = 130
mass % mass %mass % mass % mass %
di-sec-butyl ether
O 112.0 1.0 115.0 1.0 130.0 0.2
15.0 1.2 27.0 8.0 28.0 2.0 29.0 23.8 31.0 2.9 39.0 5.2 41.0 28.8 42.0 1.7
43.0 4.7 44.0 1.3 45.0 100.0 46.0 2.2 53.0 1.0 55.0 8.3 56.0 6.8 57.0 84.5
58.0 3.8 59.0 29.5 60.0 1.0 73.0 5.4 83.0 9.7 97.0 1.1 101.0 39.1 102.0 2.6
C8H18OM+ = 130
mass % mass %mass % mass % mass %
di-isobutyl ether
O
55.0 2.0 56.0 4.7 57.0 100.0 58.0 4.6 59.0 1.7 73.0 1.0 87.0 8.2 130.0 2.6
27.0 4.0 29.0 12.4 31.0 1.0 39.0 4.2 41.0 19.3 42.0 2.2 43.0 3.6 45.0 2.0
Amines

Spectroscopy Beauchamp 69
y:\files\classes\Spectroscopy Book home\1 Spectroscopy Workbook, latest MS full chapter.doc
Haloalkanes
mass % mass %mass % mass % mass %
1-chloropropane
Cl
C3H7ClM+ = 78.5(78 & 80)
63.0 4.7 65.0 1.4 78.0 2.7 80.0 0.8
15.0 1.3 18.0 1.3 26.0 3.9 27.0 31.9 28.0 12.9 29.0 40.6 36.0 1.2 37.0 2.3
38.0 3.1 39.0 11.4 40.0 3.1 41.0 23.2 42.0 100.0 43.0 13.7 49.0 4.2 51.0 1.3
mass % mass %mass % mass % mass %
2-chloropropane
Cl
78.0 9.0 80.0 3.1
C3H7ClM+ = 78.5(78 & 80)
15.0 1.7 26.0 2.4 27.0 29.3 36.0 1.2 37.0 1.5 38.0 2.4 39.0 8.5 40.0 2.1
41.0 21.8 42.0 6.6 43.0 100.0 44.0 3.6 62.0 1.8 63.0 17.0 65.0 5.7
mass % mass %mass % mass % mass %
1-chlorobutane
Cl
C3H7ClM+ = 92.6(78 & 80)
55.0 7.5 56.0 100.0 57.0 5.8 62.0 1.3 63.0 4.8 65.0 1.4
18.0 1.4 26.0 3.7 27.0 26.3 28.0 15.0 29.0 16.7 38.0 1.4 39.0 10.0 40.0 2.2
41.0 57.5 42.0 5.0 43.0 36.6 44.0 1.1 49.0 2.8 51.0 1.1 53.0 1.2

Spectroscopy Beauchamp 70
mass % mass %mass % mass % mass %
2-chloro-2-methylpropane
Cl
C3H7ClM+ = 92.6(90 & 92)
55.0 3.9 56.0 8.1 57.0 100.0 58.0 4.3 76.0 3.1 77.0 38.3 79.0 12.2
15.0 1.9 26.0 1.9 27.0 10.4 28.0 1.4 29.0 22.3 36.0 3.1 37.0 1.4 38.0 2.6
39.0 17.9 40.0 2.6 41.0 66.8 42.0 3.2 49.0 2.2 51.0 1.3 53.0 1.3
mass % mass %mass % mass % mass %
C6H13ClM+ = 120.6(120 & 122)
1-chlorohexane
Cl
91.0 100.0 93.0 32.0
15.0 1.3 18.0 3.2 26.0 2.2 27.0 27.0 28.0 5.0 29.0 32.0 31.0 1.4 38.0 1.2
39.0 16.7 40.0 2.9 41.0 59.0 42.0 44.7 43.0 72.0 44.0 2.5 49.0 3.0 51.0 1.4
53.0 3.7 54.0 3.9 55.0 81.1 56.0 56.5 57.0 14.7 62.0 1.2 63.0 4.7 65.0 1.5
67.0 2.7 69.0 22.1 70.0 2.1 71.0 2.8 82.0 1.2 83.0 1.3 84.0 4.2
mass % mass %mass % mass % mass %
C3H7BrM+ = 123
(122 & 124)
1-bromohexane
Br
107.0 1.5 109.0 1.2 122.0 8.6 124.0 8.3
15.0 1.6 26.0 2.4 27.0 25.6 28.0 1.6 29.0 4.0 37.0 1.2 38.0 2.2 39.0 9.0
40.0 2.1 41.0 31.0 42.0 7.7 43.0 100.0 44.0 3.5 93.0 1.1 95.0 1.0
mass % mass %mass % mass % mass %
C3H7BrM+ = 123
(122 & 124)
2-bromohexane
Br
41.0 31.9 42.0 4.0 43.0 100.0 44.0 3.6 107.0 1.1 109.0 1.0 122.0 5.9 124.0 5.7
15.0 1.4 26.0 2.2 27.0 27.4 28.0 1.1 37.0 1.2 38.0 2.1 39.0 9.9 40.0 1.9
mass % mass %mass % mass % mass %
C4H9BrM+ = 137
(136 & 138)
1-bromobutane
Br
136.0 7.9 138.0 7.8
15.0 1.5 26.0 5.7 27.0 29.4 28.0 13.3 29.0 40.9 38.0 2.0 39.0 14.8 40.0 2.2
41.0 64.5 42.0 3.2 43.0 3.9 50.0 1.6 51.0 1.4 53.0 1.5 55.0 7.2 56.0 16.4
57.0 100.0 58.0 4.6 79.0 1.0 81.0 1.0 93.0 1.4 95.0 1.3 107.0 3.7 109.0 3.6
mass % mass %mass % mass % mass %
C4H9BrM+ = 137
(136 & 138)
2-bromobutane
Br
58.0 4.4 107.0 1.2 109.0 1.0 136.0 0.6 138.0 0.6
15.0 1.4 26.0 3.9 27.0 18.6 28.0 5.3 29.0 40.9 38.0 1.8 39.0 14.3 40.0 1.7
41.0 53.2 42.0 2.9 50.0 1.6 51.0 1.5 53.0 1.6 55.0 4.9 56.0 8.0 57.0 100.0

Spectroscopy Beauchamp 71
y:\files\classes\Spectroscopy Book home\1 Spectroscopy Workbook, latest MS full chapter.doc
mass % mass %mass % mass % mass %
C6H13BrM+ = 165.1(164 & 166)
1-bromohexane
Br
164.0 0.4 166.0 0.4
26.0 1.2 27.0 16.5 28.0 2.7 29.0 20.7 39.0 10.8 40.0 1.9 41.0 41.8 42.0 10.3
43.0 66.4 44.0 2.2 53.0 2.4 54.0 1.3 55.0 25.7 56.0 14.6 57.0 100.0 58.0 4.9
69.0 7.5 70.0 3.2 71.0 2.8 81.0 1.0 83.0 1.5 84.0 1.2 85.0 18.2 86.0 1.3
99.0 14.5 100.0 1.2 107.0 1.2 109.0 1.0 135.0 8.3 137.0 8.0
mass % mass %mass % mass % mass %
C3H7IM+ = 170.0
1-iodopropane
I
42.0 3.3 43.0 100.0 44.0 3.3 127.0 4.9 128.0 1.2 170.0 23.3
15.0 1.7 26.0 1.7 27.0 31.7 28.0 1.7 38.0 1.5 39.0 10.7 40.0 2.0 41.0 36.8
I+ = 127
HI+ = 128
mass % mass %mass % mass % mass %
C3H7IM+ = 170.0
2-iodopropane
I
42.0 3.6 43.0 100.0 44.0 3.4 127.0 5.8 128.0 1.7 170.0 24.3
15.0 1.1 26.0 1.4 27.0 27.7 28.0 1.6 38.0 1.6 39.0 11.5 40.0 2.0 41.0 35.8
I+ = 127
HI+ = 128
mass % mass %mass % mass % mass %
C5H11IM+ = 198.0
1-iodopentane
I
141.0 1.2 155.0 2.3 198.0 9.5
26.0 1.2 27.0 18.8 28.0 2.5 29.0 23.1 39.0 10.6 40.0 2.0 41.0 30.1 42.0 8.3
43.0 100.0 44.0 3.4 53.0 1.3 55.0 9.9 71.0 73.2 72.0 4.3 127.0 2.1 128.0 0.6
I+ = 127
HI+ = 128

Spectroscopy Beauchamp 72 Aldehydes and ketones
mass % mass %mass % mass % mass %O
H
propanal
58.0 85.0 59.0 12.1
14.0 2.0 15.0 4.7 18.0 5.2 25.0 2.4 26.0 16.4 27.0 59.0 28.0 90.8 29.0 100.0
30.0 7.8 31.0 5.6 37.0 2.4 38.0 2.3 39.0 4.0 40.0 1.7 56.0 1.7 57.0 7.3
C3H6OM+ = 58
C3H6OM+ = 58
mass % mass %mass % mass % mass %O
propanone
59.0 3.1 14.0 2.9 15.0 23.1 26.0 3.5 27.0 5.7 28.0 1.2 29.0 3.1 37.0 1.8 38.0 2.2
39.0 4.2 40.0 1.0 41.0 2.0 42.0 9.1 43.0 100.0 44.0 3.4 57.0 1.7 58.0 63.8
C4H8OM+ = 72
mass % mass %mass % mass % mass %O
H
butanal
60.0 2.7 71.0 5.4 72.0 53.6 73.0 2.7
14.0 1.7 15.0 5.9 18.0 1.2 26.0 8.2 27.0 73.5 28.0 19.6 29.0 54.8 30.0 1.2
31.0 2.6 32.0 1.3 37.0 3.1 38.0 5.3 39.0 27.3 40.0 3.5 41.0 69.1 42.0 9.4
43.0 75.3 44.0 100.0 45.0 3.2 50.0 1.1 53.0 1.1 54.0 2.3 55.0 1.5 57.0 23.3
C4H8OM+ = 72
mass % mass %mass % mass % mass %O
H
pentanal
15.0 2.4 26.0 5.6 27.0 54.9 28.0 13.1 29.0 31.5 31.0 1.5 37.0 3.4
38.0 5.7 39.0 28.7 40.0 3.9 41.0 86.7 42.0 14.0 43.0 100.0 44.0 7.4 45.0 1.1
50.0 1.0 53.0 1.5 55.0 3.3 56.0 1.8 57.0 6.9 71.0 4.4 72.0 92.3 73.0 5.9
C4H8OM+ = 72
mass % mass %mass % mass % mass %O
butanone
41.0 1.1 42.0 4.1 43.0 100.0 44.0 2.6 57.0 8.0 72.0 22.1 73.0 1.0
14.0 1.2 15.0 6.6 18.0 1.3 26.0 2.6 27.0 8.9 28.0 1.3 29.0 18.8 39.0 1.6
mass % mass %mass % mass % mass %
C5H10OM+ = 86
O
H
pentanal
71.0 1.8 73.0 1.1 85.0 1.2 86.0 1.1
15.0 3.9 26.0 3.4 27.0 28.2 28.0 10.5 29.0 52.3 30.0 2.2 31.0 1.9 38.0 1.3
39.0 12.3 40.0 2.2 41.0 41.0 42.0 11.1 43.0 18.7 44.0 100.0 45.0 12.2 53.0 1.6
55.0 4.4 56.0 2.2 57.0 19.8 58.0 31.4 59.0 1.3 60.0 2.9 67.0 1.1 68.0 1.0
mass % mass %mass % mass % mass %
C5H10OM+ = 86
O
H
3-methylbutanal
87.0 1.2 15.0 4.2 26.0 2.8 27.0 41.9 28.0 4.0 29.0 46.3 30.0 1.0 31.0 1.3 37.0 2.3
38.0 5.0 39.0 38.7 40.0 5.7 41.0 89.8 42.0 24.6 43.0 93.4 44.0 100.0 45.0 19.6
50.0 2.5 51.0 2.4 53.0 5.7 55.0 6.2 56.0 3.6 57.0 37.0 58.0 81.4 59.0 3.1
60.0 2.7 67.0 1.9 68.0 2.3 69.0 2.6 71.0 36.0 72.0 1.7 85.0 2.8 86.0 11.7

Spectroscopy Beauchamp 73
y:\files\classes\Spectroscopy Book home\1 Spectroscopy Workbook, latest MS full chapter.doc
mass % mass %mass % mass % mass %
C5H10OM+ = 86
O
H
3-methylbutanal
86.0 6.3 87.0 3.2
15.0 2.3 18.0 2.3 26.0 4.5 27.0 31.1 28.0 9.4 29.0 100.0 30.0 4.0 31.0 1.7
37.0 1.1 38.0 1.9 39.0 18.4 40.0 2.7 41.0 92.4 42.0 5.8 43.0 11.9 44.0 3.8
45.0 3.0 50.0 1.4 51.0 1.5 53.0 3.6 55.0 9.4 56.0 7.8 57.0 95.8 58.0 60.0
59.0 2.7 67.0 1.1 69.0 1.3 70.0 2.3 71.0 4.9 73.0 1.8 74.0 11.1 85.0 1.8
mass % mass %mass % mass % mass %
C5H10OM+ = 86
O
H
2,2-dimethylpropanal
86.0 18.1 87.0 3.1
15.0 2.3 18.0 3.0 26.0 1.7 27.0 16.4 28.0 3.2 29.0 51.5 30.0 1.1 32.0 1.0
37.0 1.1 38.0 2.5 39.0 19.4 40.0 2.6 41.0 83.5 42.0 8.8 43.0 26.6 50.0 1.2
51.0 1.3 53.0 2.1 55.0 5.5 56.0 2.8 57.0 100.0 58.0 5.2 59.0 1.5 71.0 1.6
mass % mass %mass % mass % mass %
C5H10OM+ = 86
O
2-pentanone
42.0 4.0 43.0 100.0 44.0 2.3 58.0 10.3 71.0 11.0 86.0 20.2 87.0 1.2
15.0 4.8 26.0 1.3 27.0 10.5 28.0 1.3 29.0 1.9 38.0 1.2 39.0 6.3 41.0 11.9
mass % mass %mass % mass % mass %
C5H10OM+ = 86
O
3-pentanone
43.0 1.6 55.0 1.3 56.0 3.7 57.0 100.0 58.0 3.4 86.0 21.2 87.0 1.2
26.0 2.5 27.0 12.4 28.0 4.3 29.0 59.4 30.0 1.4 39.0 1.8 41.0 2.0 42.0 1.8
mass % mass %mass % mass % mass %
C5H10OM+ = 86
O
3-methyl-2-butanone
51.0 1.1 57.0 3.7 71.0 6.9 86.0 22.6 87.0 1.0
14.0 1.6 15.0 9.8 26.0 3.1 27.0 19.3 28.0 3.1 29.0 3.5 37.0 1.4 38.0 2.9
39.0 16.3 40.0 2.1 41.0 26.2 42.0 4.9 43.0 100.0 44.0 2.4 45.0 1.3 50.0 1.3
mass % mass %mass % mass % mass %O
H
hexanal
C6H12OM+ = 100
83.0 1.0 100.0 0.4
15.0 2.2 18.0 1.0 26.0 2.7 27.0 33.9 28.0 8.1 29.0 33.0 30.0 1.6 31.0 1.8
38.0 1.9 39.0 20.1 40.0 3.8 41.0 69.1 42.0 10.8 43.0 55.1 44.0 100.0 45.0 19.5
50.0 1.0 51.0 1.3 53.0 2.9 54.0 2.3 55.0 15.3 56.0 82.0 57.0 38.1 58.0 9.0
60.0 3.6 67.0 8.1 69.0 1.4 71.0 6.7 72.0 16.7 73.0 1.8 81.0 1.2 82.0 12.8
mass % mass %mass % mass % mass %O
H
2-methylpentanal
C6H12OM+ = 100
72.0 1.0 74.0 1.7 100.0 2.0
15.0 1.0 18.0 1.0 26.0 1.5 27.0 17.6 28.0 2.1 29.0 21.4 30.0 2.5 38.0 1.0
39.0 11.4 40.0 1.9 41.0 27.2 42.0 5.2 43.0 100.0 44.0 3.4 53.0 1.9 55.0 10.3
56.0 1.7 57.0 12.1 58.0 90.1 59.0 3.4 67.0 1.3 69.0 1.3 70.0 1.2 71.0 15.3

Spectroscopy Beauchamp 74
mass % mass %mass % mass % mass %
C6H12OM+ = 100
O
H
2-ethylbutanal
88.0 1.5 100.0 3.1
26.0 1.2 27.0 14.9 28.0 2.0 29.0 22.2 39.0 10.9 40.0 1.3 41.0 27.5 42.0 4.9
43.0 100.0 44.0 5.5 53.0 2.7 54.0 1.6 55.0 12.6 56.0 2.9 57.0 15.3 58.0 3.8
59.0 1.2 67.0 2.6 69.0 1.7 70.0 2.9 71.0 34.2 72.0 48.1 73.0 3.1 82.0 4.9
mass % mass %mass % mass % mass %
C6H12OM+ = 100
O
2-hexanone
85.0 6.4 100.0 8.0
15.0 3.6 18.0 1.9 26.0 1.1 27.0 8.2 28.0 2.0 29.0 14.8 39.0 5.6 41.0 14.1
42.0 3.1 43.0 100.0 44.0 2.4 55.0 1.4 57.0 15.8 58.0 49.8 59.0 3.1 71.0 5.4
mass % mass %mass % mass % mass %
C6H12OM+ = 100
O
3-hexanone
101.0 2.0 15.0 2.4 18.0 1.8 26.0 2.9 27.0 27.6 28.0 7.5 29.0 53.0 30.0 1.1 32.0 1.6
38.0 1.0 39.0 7.9 40.0 1.2 41.0 20.3 42.0 3.6 43.0 100.0 44.0 3.4 53.0 1.0
55.0 2.4 56.0 1.8 57.0 84.9 58.0 3.1 71.0 54.0 72.0 6.1 85.0 2.9 100.0 28.6
mass % mass %mass % mass % mass %
C6H12OM+ = 100
O
4-methyl-2-pentanone
67.0 1.9 72.0 1.3 85.0 17.7 86.0 1.0 100.0 19.0 101.0 1.4
15.0 5.1 27.0 7.2 28.0 1.7 29.0 11.0 31.0 1.1 39.0 8.3 40.0 1.3 41.0 19.2
42.0 3.1 43.0 100.0 44.0 2.6 55.0 1.4 56.0 1.4 57.0 24.9 58.0 42.6 59.0 3.5
mass % mass %mass % mass % mass %
C6H12OM+ = 100
O
3-methyl-2-pentanone
67.0 1.6 71.0 2.4 72.0 50.7 73.0 2.2 85.0 8.3 100.0 17.6 101.0 2.4
15.0 2.9 26.0 1.0 27.0 8.0 28.0 2.2 29.0 33.6 39.0 7.1 41.0 41.8 42.0 4.0
43.0 100.0 44.0 4.4 45.0 2.5 53.0 1.6 55.0 5.1 56.0 23.5 57.0 67.9 58.0 3.3
mass % mass %mass % mass % mass %
heptanal
O
H
C7H14OM+ = 114
97.0 2.1 114.0 1.5
15.0 2.0 26.0 2.1 27.0 30.7 28.0 7.4 29.0 40.2 30.0 1.5 31.0 1.9 38.0 1.2
39.0 19.2 40.0 3.3 41.0 66.7 42.0 53.0 43.0 84.0 44.0 100.0 45.0 21.9 51.0 1.5
53.0 4.0 54.0 7.6 55.0 58.6 56.0 9.7 57.0 46.5 58.0 6.4 59.0 1.0 60.0 1.1
67.0 8.8 68.0 17.5 69.0 7.1 70.0 93.7 71.0 23.7 72.0 8.5 74.0 2.0 81.0 19.2
82.0 2.2 83.0 3.2 84.0 1.2 85.0 4.1 86.0 15.4 87.0 1.3 95.0 2.2 96.0 14.4
mass %
mass % mass %mass % mass % mass %
2,3-dimethylpentanal
O
H
C7H14OM+ = 114
mass % 59.0 4.3 69.0 1.5 70.0 1.5 74.0 2.5 85.0 9.9 91.0 1.3 97.0 1.5
27.0 9.8 28.0 3.4 29.0 25.0 30.0 2.7 39.0 6.9 40.0 1.2 41.0 31.1 42.0 1.9
43.0 70.9 44.0 2.4 45.0 1.2 53.0 1.9 55.0 7.2 56.0 7.9 57.0 31.8 58.0 100.0

Spectroscopy Beauchamp 75
y:\files\classes\Spectroscopy Book home\1 Spectroscopy Workbook, latest MS full chapter.doc
mass % mass %mass % mass % mass %
2-heptanone
O
C7H14OM+ = 114
115.0 1.0 15.0 4.2 18.0 1.5 27.0 8.9 28.0 2.0 29.0 8.7 39.0 6.7 40.0 1.0 41.0 11.6
42.0 3.0 43.0 100.0 44.0 2.4 45.0 1.4 53.0 1.0 55.0 5.1 56.0 1.5 57.0 1.6
58.0 90.6 59.0 14.8 71.0 14.0 72.0 3.9 85.0 3.3 99.0 4.1 113.0 1.7 114.0 9.5
mass % mass %mass % mass % mass %O
3-heptanone
C7H14OM+ = 114
59.0 1.2 71.0 5.6 72.0 32.9 73.0 2.0 85.0 43.3 86.0 2.6 114.0 14.0 115.0 1.1
15.0 1.2 26.0 2.5 27.0 22.8 28.0 8.2 29.0 79.1 30.0 1.8 39.0 8.8 40.0 1.0
41.0 33.7 42.0 2.8 43.0 15.2 53.0 1.5 55.0 3.6 56.0 2.8 57.0 100.0 58.0 4.4
mass % mass %mass % mass % mass %O
4-heptanone
C7H14OM+ = 114
72.0 3.8 86.0 1.4 99.0 2.0 114.0 14.4 115.0 1.2
15.0 1.5 26.0 1.0 27.0 15.9 28.0 1.1 29.0 2.9 39.0 6.3 40.0 1.0 41.0 17.5
42.0 2.6 43.0 100.0 44.0 3.5 55.0 2.2 57.0 1.4 58.0 6.7 70.0 1.2 71.0 84.7
mass % mass %mass % mass % mass %O
5-methyl-3-hexanone
C7H14OM+ = 114
115.0 1.5 15.0 1.4 26.0 1.3 27.0 13.3 28.0 2.6 29.0 44.8 30.0 1.0 39.0 8.0 40.0 1.2
41.0 25.7 42.0 3.0 43.0 15.1 53.0 1.0 55.0 1.6 56.0 1.7 57.0 100.0 58.0 5.0
69.0 1.2 71.0 1.5 72.0 14.0 73.0 1.0 85.0 41.3 86.0 2.8 99.0 4.3 114.0 20.4
mass % mass %mass % mass % mass %O
5-methyl-2-hexanone
C7H14OM+ = 114
59.0 12.4 71.0 9.6 72.0 1.2 81.0 4.8 85.0 1.4 86.0 1.2 99.0 2.3 114.0 4.3
15.0 4.6 18.0 1.0 27.0 9.3 28.0 1.6 29.0 7.1 39.0 7.0 40.0 1.0 41.0 13.3
42.0 2.1 43.0 100.0 44.0 2.4 53.0 1.3 55.0 4.1 56.0 3.8 57.0 14.8 58.0 50.2
mass % mass %mass % mass % mass %O
4-nonanone
C9H18OM+ = 142
71.0 59.5 72.0 3.4 86.0 15.3 87.0 2.5 99.0 34.3 100.0 3.4 142.0 5.2
15.0 1.1 27.0 16.0 28.0 1.7 29.0 11.5 39.0 7.0 40.0 1.4 41.0 18.7 42.0 4.2
43.0 100.0 44.0 3.8 53.0 1.2 55.0 5.5 57.0 2.5 58.0 34.4 59.0 1.5 70.0 1.5

Spectroscopy Beauchamp 76 Esters
mass % mass %mass % mass % mass %
C8H16O2
M+ = 144
ethyl hexanoate
O
O 98.0 1.399.0 51.9
100.0 3.5101.0 25.8102.0 3.6115.0 8.0116.0 1.0117.0 5.0144.0 1.6
15.0 1.926.0 1.827.0 22.328.0 4.029.0 49.830.0 1.431.0 1.539.0 8.7
40.0 1.741.0 22.342.0 10.143.0 61.044.0 2.245.0 17.453.0 1.355.0 12.4
56.0 2.657.0 2.559.0 1.060.0 38.961.0 23.669.0 5.570.0 22.971.0 26.1
72.0 1.573.0 23.374.0 4.183.0 1.387.0 6.888.0 100.089.0 5.897.0 2.0

Spectroscopy Beauchamp 77
y:\files\classes\Spectroscopy Book home\1 Spectroscopy Workbook, latest MS full chapter.doc
mass % mass %mass % mass % mass %
C8H16O2
M+ = 144
isopropyl 2-methylbutanoate
O
O144.0 0.615.0 1.0
26.0 1.127.0 13.028.0 5.729.0 15.731.0 1.038.0 1.339.0 12.0
40.0 2.741.0 43.442.0 9.643.0 100.044.0 3.345.0 5.053.0 1.055.0 4.2
56.0 12.457.0 92.658.0 4.159.0 10.069.0 1.473.0 2.674.0 19.585.0 66.8
86.0 3.787.0 11.0102.0 10.5103.0 32.0104.0 1.8116.0 21.3117.0 1.4129.0 5.0
Carboxylic acids

Spectroscopy Beauchamp 78
mass % mass %mass % mass % mass %
144.0 0.1O
OH
2,2-dimethylhexanoic acid
C8H16O2
M+ = 144
18.0 1.527.0 8.928.0 1.029.0 11.931.0 1.139.0 8.440.0 1.441.0 27.3
42.0 3.443.0 25.244.0 1.145.0 2.553.0 2.255.0 11.556.0 4.157.0 100.0
58.0 4.459.0 5.560.0 1.069.0 3.370.0 3.871.0 1.273.0 19.274.0 1.3
83.0 2.887.0 7.388.0 67.989.0 3.199.0 28.5100.0 2.2101.0 6.2115.0 2.0
Alkynes Acid chlorides Nitriles Anhydrides Amides
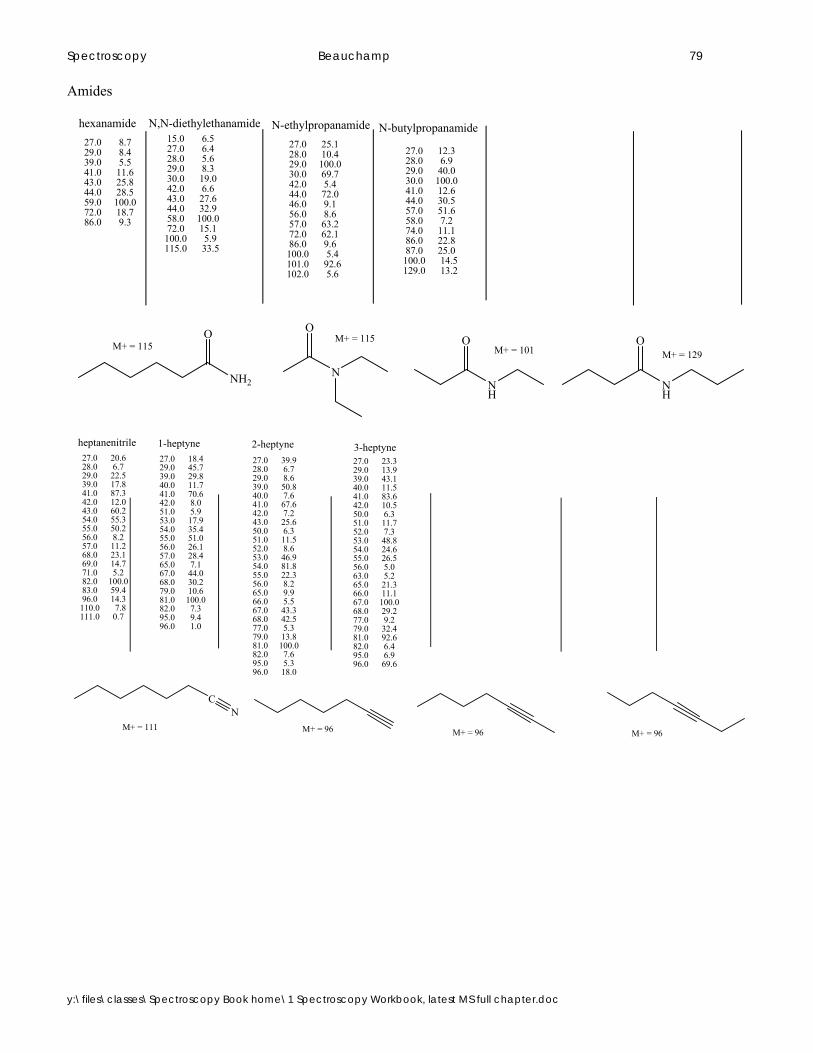
Spectroscopy Beauchamp 79
y:\files\classes\Spectroscopy Book home\1 Spectroscopy Workbook, latest MS full chapter.doc
Amides
27.0 8.7 29.0 8.4 39.0 5.5 41.0 11.6 43.0 25.8 44.0 28.5 59.0 100.0 72.0 18.7 86.0 9.3
hexanamide
NH2
15.0 6.5 27.0 6.4 28.0 5.6 29.0 8.3 30.0 19.0 42.0 6.6 43.0 27.6 44.0 32.9 58.0 100.0 72.0 15.1 100.0 5.9 115.0 33.5
N,N-diethylethanamide
27.0 12.3 28.0 6.9 29.0 40.0 30.0 100.0 41.0 12.6 44.0 30.5 57.0 51.6 58.0 7.2 74.0 11.1 86.0 22.8 87.0 25.0 100.0 14.5 129.0 13.2
N-butylpropanamide
M+ = 115M+ = 115
M+ = 129
27.0 25.1 28.0 10.4 29.0 100.0 30.0 69.7 42.0 5.4 44.0 72.0 46.0 9.1 56.0 8.6 57.0 63.2 72.0 62.1 86.0 9.6 100.0 5.4 101.0 92.6 102.0 5.6
N-ethylpropanamide
M+ = 101
O
N
O
NH
O
NH
O
C
M+ = 111
heptanenitrile 1-heptyne 27.0 20.6 28.0 6.7 29.0 22.5 39.0 17.8 41.0 87.3 42.0 12.0 43.0 60.2 54.0 55.3 55.0 50.2 56.0 8.2 57.0 11.2 68.0 23.1 69.0 14.7 71.0 5.2 82.0 100.0 83.0 59.4 96.0 14.3 110.0 7.8 111.0 0.7
N
27.0 18.4 29.0 45.7 39.0 29.8 40.0 11.7 41.0 70.6 42.0 8.0 51.0 5.9 53.0 17.9 54.0 35.4 55.0 51.0 56.0 26.1 57.0 28.4 65.0 7.1 67.0 44.0 68.0 30.2 79.0 10.6 81.0 100.0 82.0 7.3 95.0 9.4 96.0 1.0
2-heptyne 3-heptyne 27.0 39.9 28.0 6.7 29.0 8.6 39.0 50.8 40.0 7.6 41.0 67.6 42.0 7.2 43.0 25.6 50.0 6.3 51.0 11.5 52.0 8.6 53.0 46.9 54.0 81.8 55.0 22.3 56.0 8.2 65.0 9.9 66.0 5.5 67.0 43.3 68.0 42.5 77.0 5.3 79.0 13.8 81.0 100.0 82.0 7.6 95.0 5.3 96.0 18.0
M+ = 96 M+ = 96 M+ = 96
27.0 23.3 29.0 13.9 39.0 43.1 40.0 11.5 41.0 83.6 42.0 10.5 50.0 6.3 51.0 11.7 52.0 7.3 53.0 48.8 54.0 24.6 55.0 26.5 56.0 5.0 63.0 5.2 65.0 21.3 66.0 11.1 67.0 100.0 68.0 29.2 77.0 9.2 79.0 32.4 81.0 92.6 82.0 6.4 95.0 6.9 96.0 69.6

Spectroscopy Beauchamp 80 Aromatics
M+ = 162
hexylbenzene
27.0 5.2 29.0 5.6 39.0 5.5 41.0 7.6 43.0 16.6 65.0 8.8 78.0 6.4 91.0 100.0 92.0 95.1 93.0 7.7 105.0 11.2 133.0 5.4 162.0 33.2
27.0 6.0 39.0 5.4 41.0 13.1 43.0 33.4 65.0 5.2 66.0 5.2 77.0 7.2 79.0 5.6 91.0 25.7 105.0 30.2 119.0 41.8 133.0 6.5 147.0 100.0 148.0 14.4 162.0 36.4
m-diisopropylbenzene p-diisopropylbenzene
41.0 9.3 43.0 19.2 77.0 5.5 91.0 19.2 105.0 21.8 117.0 7.5 119.0 30.8 131.0 5.0 147.0 100.0 148.0 12.4 162.0 33.1
M+ = 162
M+ = 162