Spectroscopic properties and design of highly … Chemistry Reviews 196 (2000) 165–195...
31
Coordination Chemistry Reviews 196 (2000) 165–195 Spectroscopic properties and design of highly luminescent lanthanide coordination complexes G.F. de Sa ´ a, *, O.L. Malta a , C. de Mello Donega ´ a , A.M. Simas a , R.L. Longo a , P.A. Santa-Cruz a , E.F. da Silva Jr. b a Departamento de Quı ´mica Fundamental, Uni6ersidade Federal de Pernambuco, Cidade Uni6ersita ´ria, 50670 -901, Recife -PE, Brazil b Departamento de Fı ´sica, Uni6ersidade Federal de Pernambuco, Cidade Uni6ersita ´ria, 50670 -901, Recife -PE, Brazil Received 11 September 1998; received in revised form 7 January 1999; accepted 20 January 1999 Contents Abstract .................................................... 166 1. Introduction ................................................ 166 2. Preparation of new luminescent complexes, their thin films and devices ............. 167 2.1 Fluorinated b-diketonates .................................... 167 2.2 Thin film and device processing ................................. 168 3. Spectroscopic measurements ...................................... 169 3.1 Electronic absorption, luminescence and lifetimes ....................... 169 3.2 Quantum yield measurements .................................. 171 4. Modeling of lanthanide complexes .................................. 172 4.1 Structural optimization: the sparkle model for the calculation of lanthanide complexes Austin model 1 .......................................... 172 4.2 Theoretical model for the electronic spectra of the organic part of the complexes — INDO/S–CI method ....................................... 175 4.3 f – 4f intensities ........................................... 178 4.4 Intramolecular energy transfer rates............................... 182 4.5 Rate equations and luminescence quantum yields: theory and experiment ......... 184 5. Device applications and future developments ............................ 188 Acknowledgements ............................................. 192 References .................................................. 192 www.elsevier.com/locate/ccr * Corresponding author. Tel.: +55-81-271-8441; fax: +55-81-271-8442. E-mail address: [email protected] (G.F. de Sa ´) 0010-8545/00/$ - see front matter © 2000 Elsevier Science S.A. All rights reserved. PII:S0010-8545(99)00054-5
Transcript of Spectroscopic properties and design of highly … Chemistry Reviews 196 (2000) 165–195...
Coordination Chemistry Reviews196 (2000) 165–195
Spectroscopic properties and design of highlyluminescent lanthanide coordination complexes
G.F. de Sa a,*, O.L. Malta a, C. de Mello Donega a,A.M. Simas a, R.L. Longo a, P.A. Santa-Cruz a,
E.F. da Silva Jr. b
a Departamento de Quımica Fundamental, Uni6ersidade Federal de Pernambuco, Cidade Uni6ersitaria,50670-901, Recife-PE, Brazil
b Departamento de Fısica, Uni6ersidade Federal de Pernambuco, Cidade Uni6ersitaria, 50670-901,Recife-PE, Brazil
Received 11 September 1998; received in revised form 7 January 1999; accepted 20 January 1999
Contents
Abstract. . . . . . . . . . . . . . . . . . . . . . . . . . . . . . . . . . . . . . . . . . . . . . . . . . . . 1661. Introduction . . . . . . . . . . . . . . . . . . . . . . . . . . . . . . . . . . . . . . . . . . . . . . . . 1662. Preparation of new luminescent complexes, their thin films and devices . . . . . . . . . . . . . 167
2.1 Fluorinated b-diketonates . . . . . . . . . . . . . . . . . . . . . . . . . . . . . . . . . . . . 1672.2 Thin film and device processing . . . . . . . . . . . . . . . . . . . . . . . . . . . . . . . . . 168
3. Spectroscopic measurements . . . . . . . . . . . . . . . . . . . . . . . . . . . . . . . . . . . . . . 1693.1 Electronic absorption, luminescence and lifetimes . . . . . . . . . . . . . . . . . . . . . . . 1693.2 Quantum yield measurements . . . . . . . . . . . . . . . . . . . . . . . . . . . . . . . . . . 171
4. Modeling of lanthanide complexes . . . . . . . . . . . . . . . . . . . . . . . . . . . . . . . . . . 1724.1 Structural optimization: the sparkle model for the calculation of lanthanide complexes
Austin model 1 . . . . . . . . . . . . . . . . . . . . . . . . . . . . . . . . . . . . . . . . . . 1724.2 Theoretical model for the electronic spectra of the organic part of the complexes—
INDO/S–CI method . . . . . . . . . . . . . . . . . . . . . . . . . . . . . . . . . . . . . . . 1754.3 f–4f intensities . . . . . . . . . . . . . . . . . . . . . . . . . . . . . . . . . . . . . . . . . . . 1784.4 Intramolecular energy transfer rates. . . . . . . . . . . . . . . . . . . . . . . . . . . . . . . 1824.5 Rate equations and luminescence quantum yields: theory and experiment. . . . . . . . . 184
5. Device applications and future developments . . . . . . . . . . . . . . . . . . . . . . . . . . . . 188Acknowledgements . . . . . . . . . . . . . . . . . . . . . . . . . . . . . . . . . . . . . . . . . . . . . 192References . . . . . . . . . . . . . . . . . . . . . . . . . . . . . . . . . . . . . . . . . . . . . . . . . . 192
www.elsevier.com/locate/ccr
* Corresponding author. Tel.: +55-81-271-8441; fax: +55-81-271-8442.E-mail address: [email protected] (G.F. de Sa)
0010-8545/00/$ - see front matter © 2000 Elsevier Science S.A. All rights reserved.PII: S0010 -8545 (99 )00054 -5
166 G.F. de Sa et al. / Coordination Chemistry Re6iews 196 (2000) 165–195
Abstract
In this paper recent advances in the development of efficient light conversion moleculardevices (LCMD) based on lanthanide complexes are reviewed, with emphasis on the work ofour group. We have adopted a strategy based upon both theoretical and experimental(synthesis and methodological) investigations. The theoretical aspects are described in termsof the well known theory of 4f–4f transitions and a recently developed model of intramolec-ular energy transfer processes in lanthanide coordination compounds. The necessary struc-tural data (coordination geometries and electronic structures of the organic parts of thecompounds) are obtained from a sparkle model also recently developed. The results lead usto achieve a better understanding of the factors determining the quantum yields and otherrelevant properties of these complexes, establishing the basis of a framework for themodeling of new complexes which are promising LCMDs. In addition, the fluorinatedcompounds, which are sufficiently volatile and thermodynamically stable, are candidates fora number of applications. We illustrate their use as LCMDs devices for sensing UV radiation(dosimeter) and as antireflection coatings (ARC) on silicon solar cells with beneficial effectson device performance. © 2000 Elsevier Science S.A. All rights reserved.
Keywords: Lanthanide coordination; Light conversion molecular devices; Fluorinated compounds
1. Introduction
Interest in the photophysical properties of lanthanide ion complexes has grownconsiderably since Lehn [1] proposed that such complexes could be seen as lightconversion molecular devices (LCMDs), coining the term ‘antenna effect’ to denotethe absorption, energy-transfer, emission sequence involving distinct absorbing (theligand) and emitting (the lanthanide ion) components, thus overcoming the verysmall absorption coefficients of the lanthanide ions. The design of efficient lan-thanide complexes has become an important research goal, being pursued byseveral groups [2–37,90,94–96,101,105–115], working with many different classesof ligands (e.g. cryptands [4,16], podands [3,4,115], calixarenes [4,13,15,114], macro-cyclic ligands [2,3,106–108], b-diketones [12,20,21,27–29,112,113], heterobiaryl lig-ands [9,10,105], carboxylic acid derivatives [105], terphenyl ligands [90,111],proteins [109], etc.). Most of the complexes investigated emit red or green light(Eu3+ and Tb3+ luminescence, respectively), but there are also complexes ofdifferent Ln3+ ions that luminesce in other spectral regions: near-IR (Yb3+, Nd3+,Er3+ [18,19,107–109,111,113]), orange (Sm3+ [111,112,114]), yellow (Dy3+
[111,112,114]), blue (Tm3+ [20,21,111]) or near-UV (Ce3+ [16], Gd3+ [16,17]).Efficient LCMDs may find several applications, such as luminescent probes in
biomedical assays [2–12] and time-resolved microscopy [9], fluorescent lighting [38],luminescent sensors for chemical species (H+, O2, halide ions, OH−) [106], electro-luminescent devices [39], UV dosimeters [37], or antireflection coatings for solarcells [36]. Besides the quantum yield of a LCMD, other aspects, such as lightoutput, solubility, volatility, and photo-, thermal- and thermodynamic stabilities,may be critical to many applications, and must also be controlled.
167G.F. de Sa et al. / Coordination Chemistry Re6iews 196 (2000) 165–195
In order to gain insight into the factors which determine the quantum yield andother relevant properties of lanthanide complexes our group has adopted anapproach based upon both theoretical and experimental work, analysing qualitativeand quantitative aspects [22–35]. Therefore, besides the synthesis and experimentalinvestigation of the photophysical properties of a number of new lanthanidecomplexes, our group has been successfully developing theoretical models todetermine the coordination geometry of a lanthanide complex [31,32,34], theposition and nature of the ligand excited states in the complex [31,32,34], the 4f–4fintensity parameters [32], the ligand-to-lanthanide ion energy transfer rates [32], andthe luminescence quantum yields [33].
The variety of b-diketones and adducting molecules which are available allowedthe study of varying steric and electronic effects on the structure, luminescence, andefficiency of luminescence, which are of particular importance in the context ofconnecting modern theoretical ideas to discrete complexes. For example, theavailability of complexes of known structure has enabled the theories related toband intensities and crystal field parameters to be tested and extended.
The molecular structure determination is the first step in the rationalization andprediction of the luminescent properties of these lanthanide compounds. Thecombination of the SMLC/AM1 (sparkle model for lanthanide complexes based onAustin model 1) method [50,52] for obtaining molecular structure with semi-empir-ical methods for electronic spectra calculations, such as the INDO/S–CI (interme-diate neglect of differential overlap/spectroscopic–configuration interaction)method [54], has provided a valuable theoretical tool to study the effects of theligands on the luminescent properties. The energy levels and transition moments, aswell as other electronic properties determined by these combined methodologies,have been used to estimate the energy transfer rates between the ligands and theLn(III) ion, allowing the calculation of the quantum yield for the luminescenceprocesses [57].
Experimental and theoretical results have shown that the quantum yield of alanthanide complex arises from a balance among the rates of several processes (e.g.ligand�Ln3+ energy transfer, multiphonon relaxation, back-transfer andcrossover to charge-transfer states). The control of these rates, as well as of otherrelevant physical properties, has been accomplished by a thorough selection ofligands, allowing us to develop some promising LCMDs [24,27–29,33], with highroom temperature quantum yields, leading to new applications [36,37].
2. Preparation of new luminescent complexes, their thin films and devices
2.1. Fluorinated b-diketonates
We have investigated a large number of mixed complexes with general formulaeLn(L)3B, where Ln is Eu3+ or Gd3+, L is a b-diketone [24,27,28,32–34] (e.g.bzac=1-phenyl-1,3-butanedione; btfa=4,4,4-trifluoro-1-phenyl-1,3-butanedione)and B is a Lewis base such as 1,10-phenanthroline (phen), 2,2%-bipyridine (bipy),
168 G.F. de Sa et al. / Coordination Chemistry Re6iews 196 (2000) 165–195
2,2%:6%,2%%-terpyridine (terpy), and their N-oxide derivatives in the expectation thatthey would be kinetically more stable than their pyridine analogs and possiblypresent improved luminescence [89]. The hydrated compounds, where watermolecules substitute for the B ligands, are also synthesised for comparison. TheGd3+ complexes were prepared in order to allow the determination of the ligandsenergy levels.
The synthetic procedure can be summarized as described below, although it mayvary slightly depending on the ligands. Typically, the complexes Ln(L)3B wereprepared by adding 40 ml of a warm ethanolic solution of ligand B (1 mmol) to anethanolic solution containing 1 mmol of Ln(L)32H2O. The precipitate was filtered,washed with ethanol and dried at 80°C over P2O5 under reduced pressure (less than1 mmHg). The hydrated complexes were prepared by adding 20 ml of an ethanolicsolution of L (1 mmol) to 20 ml of a warm (ca. 70°C) aqueous ethanolic solutionof Ln(ClO4)3 (1 mmol) at pH 4–5. The pH was then adjusted to 6.5 with dilutedNaOH aqueous solution. After refluxing for 4 h a precipitate was filtered, recrystal-lized in ethanol and dried at 80°C over P2O5 under reduced pressure. Thecomplexes were characterized by elemental analysis and IR vibrational spec-troscopy and, in some cases, also by thermogravimetric analysis. The IR vibrationalabsorption spectra were measured on a Bruker IF566 FTIR spectro-photometer, using KBr pellet and Nujol mull techniques. The analytical and vibra-tional data are consistent with the proposed formulae. The vibrational spectraprovide evidence that the metal ion is coordinated to the ligands via the C�O andN�O groups.
2.2. Thin film and de6ice processing
The Eu(btfa)3bipy thin films used in the absorption, luminescence and lifetimemeasurements were prepared by the deposition of the complex on a slide of quartzsubstrate previously cleaned and degreased to assure proper film adhesion. Filmswith thickness ca. 30–90 nm were thermally co-evaporated from an aluminacrucible onto the quartz substrate surface and photolithographically defined toform rectangular structures with an area of ca. 1 cm2. The thickness of the films wasmonitored during deposition by a quartz crystal thickness meter and by posteriorellipsometry measurements at several wavelengths to assure film quality anduniformity. The refractive index of the Eu(btfa)3bipy thin films was determined byellipsometry to be 1.6190.04 at 632.8 nm.
To further test the optical properties of the Eu(btfa)3bipy thin films as poten-tial candidate for use in silicon devices as antireflection coatings of solar cells,p-n junctions were fabricated using simple fabrication techniques [36]. Siliconwafers (100) p-type oriented (2 in. diameter) of 1 Vcm resistivity were cleanedfollowing a standard cleaning process [36], except for the last step, where thewafers were immersed in a 3% HF dip solution, prior to furnace loading. Thep-n junctions were formed (after diffusion of a high concentration phosphorussilica glass spun onto specific regions of the wafer surface) in a Thermco MB-80furnace at 1000°C for 70 min to a depth of ca. 1 m. Aluminum films ca. 200 nm
169G.F. de Sa et al. / Coordination Chemistry Re6iews 196 (2000) 165–195
thick were thermally evaporated from a W boat on to the wafer surface, andphotolithographically defined to form circular gates with area of 1×10⁻⁴
cm2, within the effective solar cell area of 1×10⁻² cm2. After backside metalliza-tion, the wafers were annealed in forming gas at 400°C for 30 min. The solar cellswere characterized in a HP 4155A Semiconductor Parameter Analyser, before andafter the Eu(btfa)3bipy ARC deposition. After initial characterization some solarcells were covered by an appropriate Eu(btfa)3bipy complex thin film deposited bythermal evaporation.
3. Spectroscopic measurements
3.1. Electronic absorption, luminescence and lifetimes
The UV–Vis absorption spectra were recorded with a Perkin–Elmer UV–Visspectrophotometer Lambda 6 Model 2688–002, using 10−4 M ethanolic solutionsof the complexes. The bands observed in the absorption spectra of the complexesare ascribed to ligand-centered transitions. UV absorption spectra of the fluorinatedcomplexes were also obtained in the solid state from thin films of thickness rangingfrom 400 to 600 nm.
The solid state photophysical properties of the complexes (viz. Eu3+ quantumyields, luminescence and excited state lifetimes at 300, 77, and in some cases, 4.2 K)were investigated for all the complexes. The luminescence spectra of europium andgadolinium complexes were obtained by scanning a 1 m double-grating Jobin-YvonU-1000 monochromator. The excitation wavelengths were selected by a 0.25 mJobin-Yvon H-10 monochromator, using a 150 W Xe–Hg lamp as the excitationsource. The light detection was performed by a water-cooled RCA C31034 photo-multiplier tube, the photocurrent signal being acquired through a EG&G discrimi-nator model 1182 and digitally stored by a Jobin-Yvon Spectralink interface and apersonal computer. This set-up allows for measurements at room temperature (298K) and 77 K.
The excitation and luminescence spectra of some complexes were also obtainedby using a SPEX Fluorolog DM3000F Spectrofluorometer with double-grating 0.22m SPEX 1680 monochromators, and a 450 W Xe Lamp as the excitation source.This set-up is equipped with an Oxford LF205 liquid Helium flow cryostat,allowing for measurements down to 4.2 K. The spectra are corrected for theinstrumental response. Excited state decay time and rise time measurements wereperformed at 298 K using a pulsed N2 laser as the excitation source. Theluminescence was detected with a modified 1P28 photomultiplier tube, after disper-sion through a 0.25 m monochromator. The signal was then analyzed on a fastoscilloscope. The temporal resolution of the overall system is ca. 50 ns.
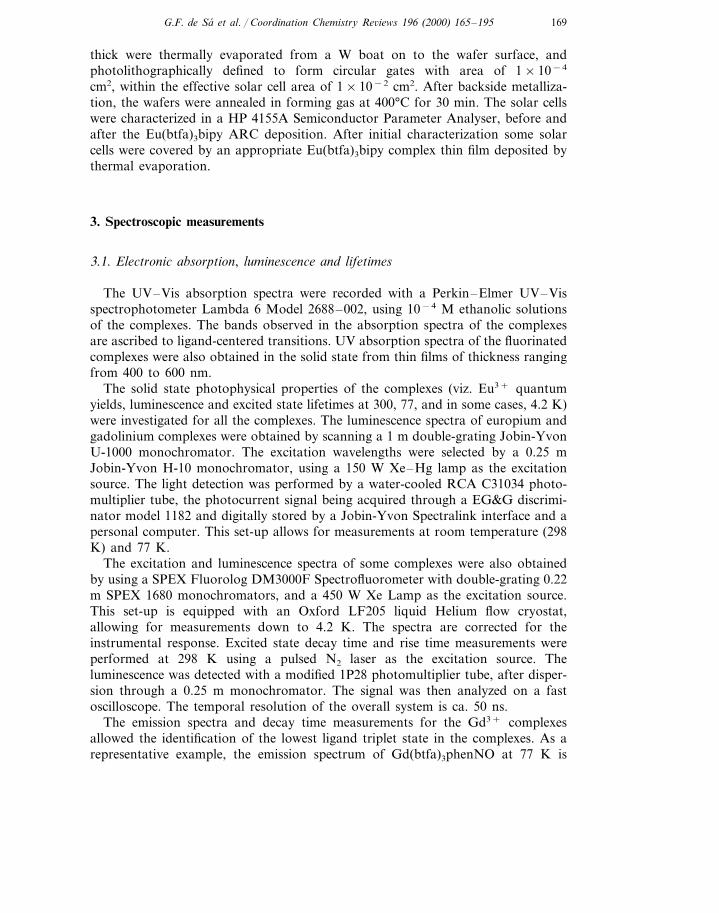
The emission spectra and decay time measurements for the Gd3+ complexesallowed the identification of the lowest ligand triplet state in the complexes. As arepresentative example, the emission spectrum of Gd(btfa)3phenNO at 77 K is
170 G.F. de Sa et al. / Coordination Chemistry Re6iews 196 (2000) 165–195
Fig. 1. The emission spectrum of Gd(btfa)3phenNO at 77 K, upon ligand excitation (lexc=370 nm).
shown in Fig. 1. The ligand phosphorescence is completely quenched at roomtemperature.
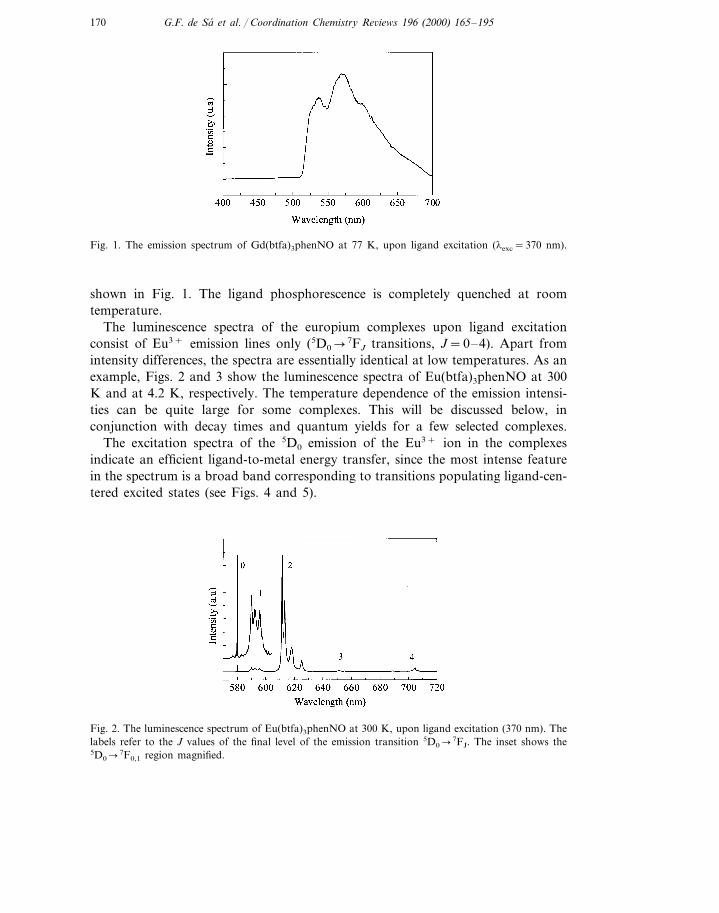
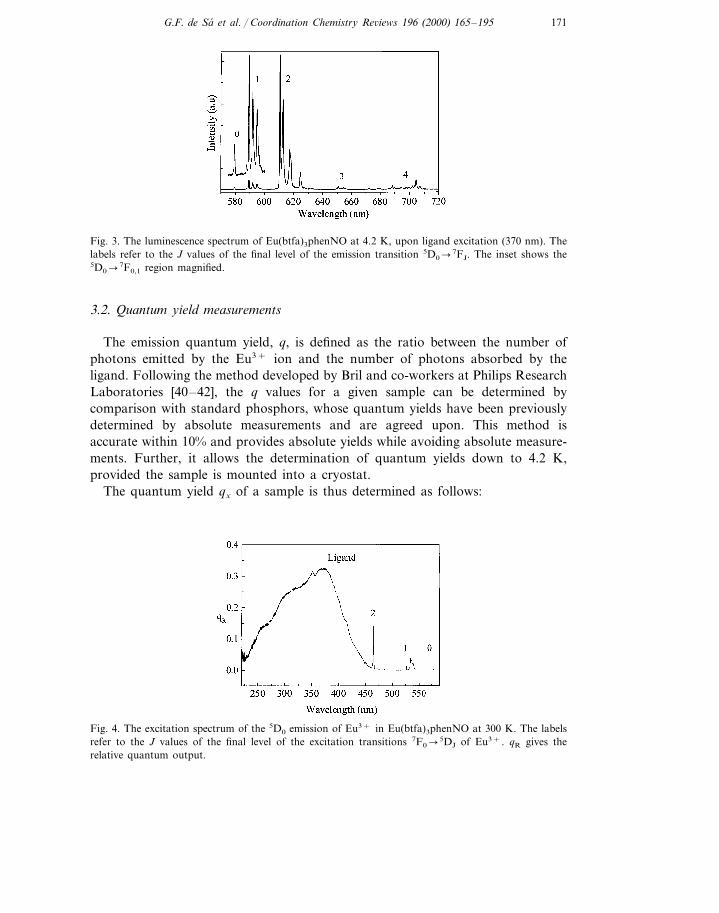
The luminescence spectra of the europium complexes upon ligand excitationconsist of Eu3+ emission lines only (5D0�7FJ transitions, J=0–4). Apart fromintensity differences, the spectra are essentially identical at low temperatures. As anexample, Figs. 2 and 3 show the luminescence spectra of Eu(btfa)3phenNO at 300K and at 4.2 K, respectively. The temperature dependence of the emission intensi-ties can be quite large for some complexes. This will be discussed below, inconjunction with decay times and quantum yields for a few selected complexes.
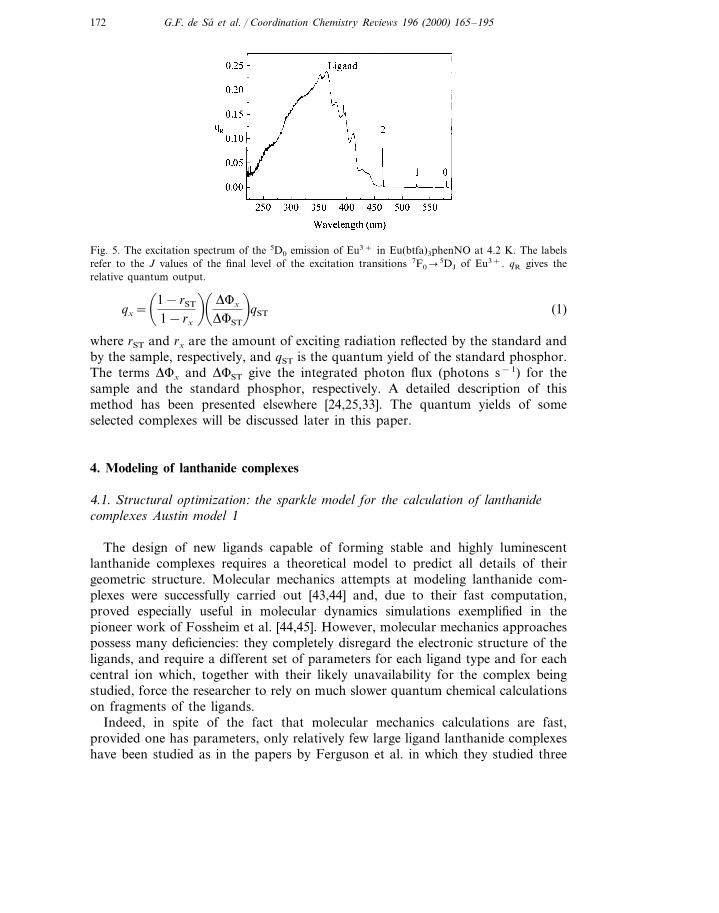
The excitation spectra of the 5D0 emission of the Eu3+ ion in the complexesindicate an efficient ligand-to-metal energy transfer, since the most intense featurein the spectrum is a broad band corresponding to transitions populating ligand-cen-tered excited states (see Figs. 4 and 5).
Fig. 2. The luminescence spectrum of Eu(btfa)3phenNO at 300 K, upon ligand excitation (370 nm). Thelabels refer to the J values of the final level of the emission transition 5D0�
7FJ. The inset shows the5D0�
7F0,1 region magnified.
171G.F. de Sa et al. / Coordination Chemistry Re6iews 196 (2000) 165–195
Fig. 3. The luminescence spectrum of Eu(btfa)3phenNO at 4.2 K, upon ligand excitation (370 nm). Thelabels refer to the J values of the final level of the emission transition 5D0�
7FJ. The inset shows the5D0�
7F0,1 region magnified.
3.2. Quantum yield measurements
The emission quantum yield, q, is defined as the ratio between the number ofphotons emitted by the Eu3+ ion and the number of photons absorbed by theligand. Following the method developed by Bril and co-workers at Philips ResearchLaboratories [40–42], the q values for a given sample can be determined bycomparison with standard phosphors, whose quantum yields have been previouslydetermined by absolute measurements and are agreed upon. This method isaccurate within 10% and provides absolute yields while avoiding absolute measure-ments. Further, it allows the determination of quantum yields down to 4.2 K,provided the sample is mounted into a cryostat.
The quantum yield qx of a sample is thus determined as follows:
Fig. 4. The excitation spectrum of the 5D0 emission of Eu3+ in Eu(btfa)3phenNO at 300 K. The labelsrefer to the J values of the final level of the excitation transitions 7F0�
5DJ of Eu3+. qR gives therelative quantum output.
172 G.F. de Sa et al. / Coordination Chemistry Re6iews 196 (2000) 165–195
Fig. 5. The excitation spectrum of the 5D0 emission of Eu3+ in Eu(btfa)3phenNO at 4.2 K. The labelsrefer to the J values of the final level of the excitation transitions 7F0�
5DJ of Eu3+. qR gives therelative quantum output.
qx=�1−rST
1−rx
�� DFx
DFST
�qST (1)
where rST and rx are the amount of exciting radiation reflected by the standard andby the sample, respectively, and qST is the quantum yield of the standard phosphor.The terms DFx and DFST give the integrated photon flux (photons s−1) for thesample and the standard phosphor, respectively. A detailed description of thismethod has been presented elsewhere [24,25,33]. The quantum yields of someselected complexes will be discussed later in this paper.
4. Modeling of lanthanide complexes
4.1. Structural optimization: the sparkle model for the calculation of lanthanidecomplexes Austin model 1
The design of new ligands capable of forming stable and highly luminescentlanthanide complexes requires a theoretical model to predict all details of theirgeometric structure. Molecular mechanics attempts at modeling lanthanide com-plexes were successfully carried out [43,44] and, due to their fast computation,proved especially useful in molecular dynamics simulations exemplified in thepioneer work of Fossheim et al. [44,45]. However, molecular mechanics approachespossess many deficiencies: they completely disregard the electronic structure of theligands, and require a different set of parameters for each ligand type and for eachcentral ion which, together with their likely unavailability for the complex beingstudied, force the researcher to rely on much slower quantum chemical calculationson fragments of the ligands.
Indeed, in spite of the fact that molecular mechanics calculations are fast,provided one has parameters, only relatively few large ligand lanthanide complexeshave been studied as in the papers by Ferguson et al. in which they studied three
173G.F. de Sa et al. / Coordination Chemistry Re6iews 196 (2000) 165–195
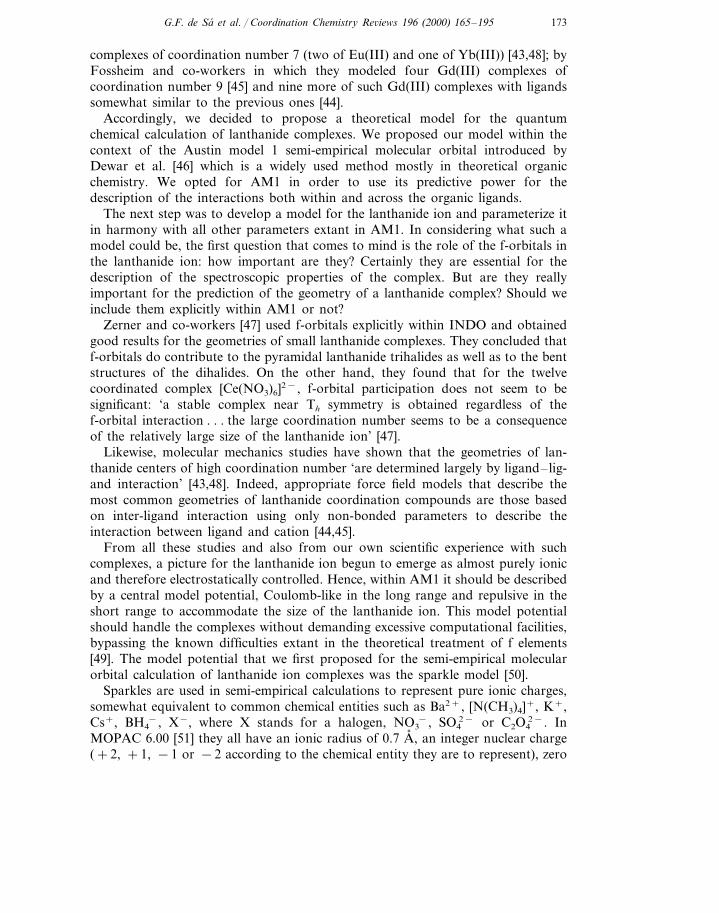
complexes of coordination number 7 (two of Eu(III) and one of Yb(III)) [43,48]; byFossheim and co-workers in which they modeled four Gd(III) complexes ofcoordination number 9 [45] and nine more of such Gd(III) complexes with ligandssomewhat similar to the previous ones [44].
Accordingly, we decided to propose a theoretical model for the quantumchemical calculation of lanthanide complexes. We proposed our model within thecontext of the Austin model 1 semi-empirical molecular orbital introduced byDewar et al. [46] which is a widely used method mostly in theoretical organicchemistry. We opted for AM1 in order to use its predictive power for thedescription of the interactions both within and across the organic ligands.
The next step was to develop a model for the lanthanide ion and parameterize itin harmony with all other parameters extant in AM1. In considering what such amodel could be, the first question that comes to mind is the role of the f-orbitals inthe lanthanide ion: how important are they? Certainly they are essential for thedescription of the spectroscopic properties of the complex. But are they reallyimportant for the prediction of the geometry of a lanthanide complex? Should weinclude them explicitly within AM1 or not?
Zerner and co-workers [47] used f-orbitals explicitly within INDO and obtainedgood results for the geometries of small lanthanide complexes. They concluded thatf-orbitals do contribute to the pyramidal lanthanide trihalides as well as to the bentstructures of the dihalides. On the other hand, they found that for the twelvecoordinated complex [Ce(NO3)6]2−, f-orbital participation does not seem to besignificant: ‘a stable complex near Th symmetry is obtained regardless of thef-orbital interaction . . . the large coordination number seems to be a consequenceof the relatively large size of the lanthanide ion’ [47].
Likewise, molecular mechanics studies have shown that the geometries of lan-thanide centers of high coordination number ‘are determined largely by ligand–lig-and interaction’ [43,48]. Indeed, appropriate force field models that describe themost common geometries of lanthanide coordination compounds are those basedon inter-ligand interaction using only non-bonded parameters to describe theinteraction between ligand and cation [44,45].
From all these studies and also from our own scientific experience with suchcomplexes, a picture for the lanthanide ion begun to emerge as almost purely ionicand therefore electrostatically controlled. Hence, within AM1 it should be describedby a central model potential, Coulomb-like in the long range and repulsive in theshort range to accommodate the size of the lanthanide ion. This model potentialshould handle the complexes without demanding excessive computational facilities,bypassing the known difficulties extant in the theoretical treatment of f elements[49]. The model potential that we first proposed for the semi-empirical molecularorbital calculation of lanthanide ion complexes was the sparkle model [50].
Sparkles are used in semi-empirical calculations to represent pure ionic charges,somewhat equivalent to common chemical entities such as Ba2+, [N(CH3)4]+, K+,Cs+, BH4
−, X−, where X stands for a halogen, NO3−, SO4
2− or C2O42−. In
MOPAC 6.00 [51] they all have an ionic radius of 0.7 A, , an integer nuclear charge(+2, +1, −1 or −2 according to the chemical entity they are to represent), zero
174 G.F. de Sa et al. / Coordination Chemistry Re6iews 196 (2000) 165–195
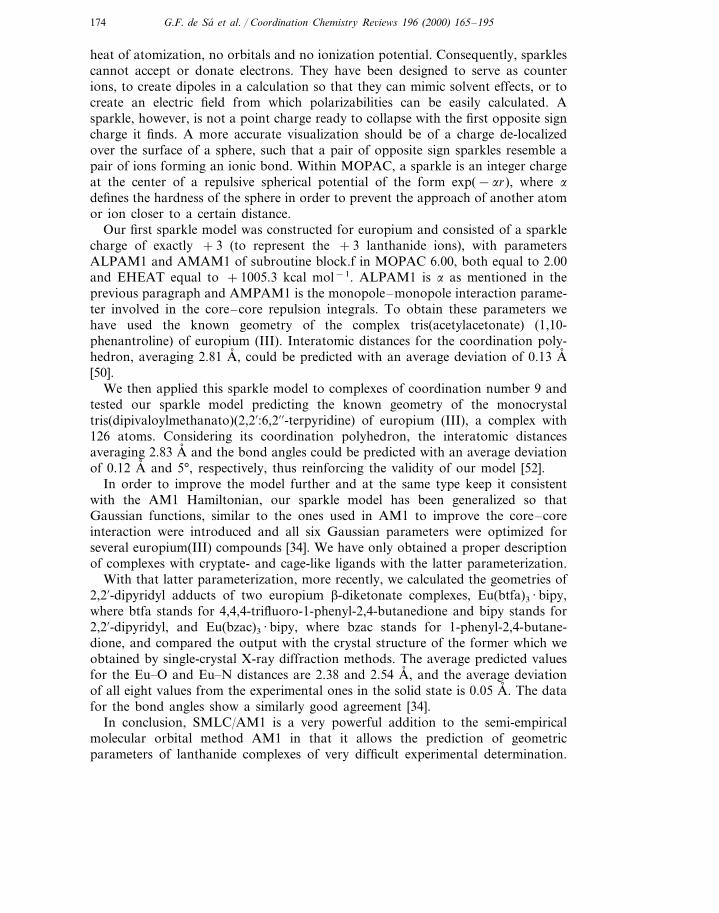
heat of atomization, no orbitals and no ionization potential. Consequently, sparklescannot accept or donate electrons. They have been designed to serve as counterions, to create dipoles in a calculation so that they can mimic solvent effects, or tocreate an electric field from which polarizabilities can be easily calculated. Asparkle, however, is not a point charge ready to collapse with the first opposite signcharge it finds. A more accurate visualization should be of a charge de-localizedover the surface of a sphere, such that a pair of opposite sign sparkles resemble apair of ions forming an ionic bond. Within MOPAC, a sparkle is an integer chargeat the center of a repulsive spherical potential of the form exp(−ar), where a
defines the hardness of the sphere in order to prevent the approach of another atomor ion closer to a certain distance.
Our first sparkle model was constructed for europium and consisted of a sparklecharge of exactly +3 (to represent the +3 lanthanide ions), with parametersALPAM1 and AMAM1 of subroutine block.f in MOPAC 6.00, both equal to 2.00and EHEAT equal to +1005.3 kcal mol−1. ALPAM1 is a as mentioned in theprevious paragraph and AMPAM1 is the monopole–monopole interaction parame-ter involved in the core–core repulsion integrals. To obtain these parameters wehave used the known geometry of the complex tris(acetylacetonate) (1,10-phenantroline) of europium (III). Interatomic distances for the coordination poly-hedron, averaging 2.81 A, , could be predicted with an average deviation of 0.13 A,[50].
We then applied this sparkle model to complexes of coordination number 9 andtested our sparkle model predicting the known geometry of the monocrystaltris(dipivaloylmethanato)(2,2%:6,2%%-terpyridine) of europium (III), a complex with126 atoms. Considering its coordination polyhedron, the interatomic distancesaveraging 2.83 A, and the bond angles could be predicted with an average deviationof 0.12 A, and 5°, respectively, thus reinforcing the validity of our model [52].
In order to improve the model further and at the same type keep it consistentwith the AM1 Hamiltonian, our sparkle model has been generalized so thatGaussian functions, similar to the ones used in AM1 to improve the core–coreinteraction were introduced and all six Gaussian parameters were optimized forseveral europium(III) compounds [34]. We have only obtained a proper descriptionof complexes with cryptate- and cage-like ligands with the latter parameterization.
With that latter parameterization, more recently, we calculated the geometries of2,2%-dipyridyl adducts of two europium b-diketonate complexes, Eu(btfa)3 · bipy,where btfa stands for 4,4,4-trifluoro-1-phenyl-2,4-butanedione and bipy stands for2,2%-dipyridyl, and Eu(bzac)3 · bipy, where bzac stands for 1-phenyl-2,4-butane-dione, and compared the output with the crystal structure of the former which weobtained by single-crystal X-ray diffraction methods. The average predicted valuesfor the Eu�O and Eu�N distances are 2.38 and 2.54 A, , and the average deviationof all eight values from the experimental ones in the solid state is 0.05 A, . The datafor the bond angles show a similarly good agreement [34].
In conclusion, SMLC/AM1 is a very powerful addition to the semi-empiricalmolecular orbital method AM1 in that it allows the prediction of geometricparameters of lanthanide complexes of very difficult experimental determination.
175G.F. de Sa et al. / Coordination Chemistry Re6iews 196 (2000) 165–195
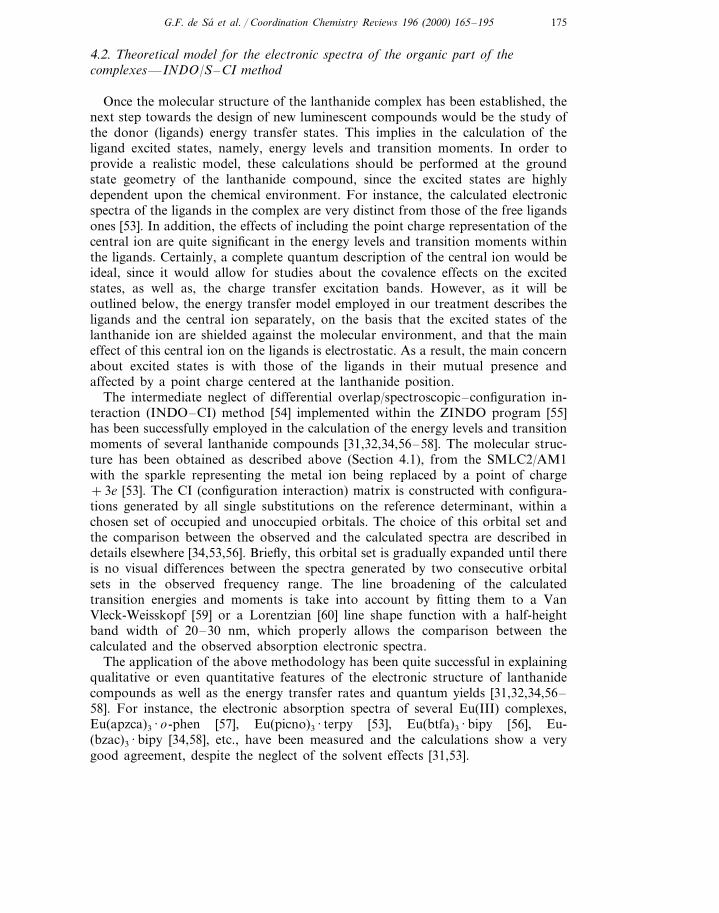
4.2. Theoretical model for the electronic spectra of the organic part of thecomplexes—INDO/S–CI method
Once the molecular structure of the lanthanide complex has been established, thenext step towards the design of new luminescent compounds would be the study ofthe donor (ligands) energy transfer states. This implies in the calculation of theligand excited states, namely, energy levels and transition moments. In order toprovide a realistic model, these calculations should be performed at the groundstate geometry of the lanthanide compound, since the excited states are highlydependent upon the chemical environment. For instance, the calculated electronicspectra of the ligands in the complex are very distinct from those of the free ligandsones [53]. In addition, the effects of including the point charge representation of thecentral ion are quite significant in the energy levels and transition moments withinthe ligands. Certainly, a complete quantum description of the central ion would beideal, since it would allow for studies about the covalence effects on the excitedstates, as well as, the charge transfer excitation bands. However, as it will beoutlined below, the energy transfer model employed in our treatment describes theligands and the central ion separately, on the basis that the excited states of thelanthanide ion are shielded against the molecular environment, and that the maineffect of this central ion on the ligands is electrostatic. As a result, the main concernabout excited states is with those of the ligands in their mutual presence andaffected by a point charge centered at the lanthanide position.
The intermediate neglect of differential overlap/spectroscopic–configuration in-teraction (INDO–CI) method [54] implemented within the ZINDO program [55]has been successfully employed in the calculation of the energy levels and transitionmoments of several lanthanide compounds [31,32,34,56–58]. The molecular struc-ture has been obtained as described above (Section 4.1), from the SMLC2/AM1with the sparkle representing the metal ion being replaced by a point of charge+3e [53]. The CI (configuration interaction) matrix is constructed with configura-tions generated by all single substitutions on the reference determinant, within achosen set of occupied and unoccupied orbitals. The choice of this orbital set andthe comparison between the observed and the calculated spectra are described indetails elsewhere [34,53,56]. Briefly, this orbital set is gradually expanded until thereis no visual differences between the spectra generated by two consecutive orbitalsets in the observed frequency range. The line broadening of the calculatedtransition energies and moments is take into account by fitting them to a VanVleck-Weisskopf [59] or a Lorentzian [60] line shape function with a half-heightband width of 20–30 nm, which properly allows the comparison between thecalculated and the observed absorption electronic spectra.
The application of the above methodology has been quite successful in explainingqualitative or even quantitative features of the electronic structure of lanthanidecompounds as well as the energy transfer rates and quantum yields [31,32,34,56–58]. For instance, the electronic absorption spectra of several Eu(III) complexes,Eu(apzca)3 · o-phen [57], Eu(picno)3 · terpy [53], Eu(btfa)3 · bipy [56], Eu-(bzac)3 · bipy [34,58], etc., have been measured and the calculations show a verygood agreement, despite the neglect of the solvent effects [31,53].
176 G.F. de Sa et al. / Coordination Chemistry Re6iews 196 (2000) 165–195
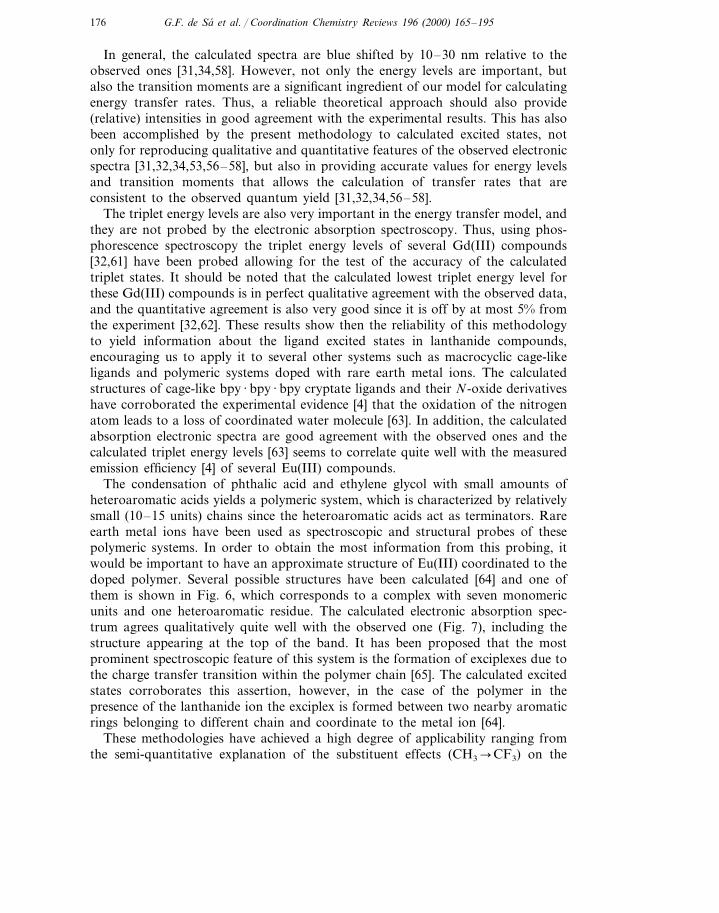
In general, the calculated spectra are blue shifted by 10–30 nm relative to theobserved ones [31,34,58]. However, not only the energy levels are important, butalso the transition moments are a significant ingredient of our model for calculatingenergy transfer rates. Thus, a reliable theoretical approach should also provide(relative) intensities in good agreement with the experimental results. This has alsobeen accomplished by the present methodology to calculated excited states, notonly for reproducing qualitative and quantitative features of the observed electronicspectra [31,32,34,53,56–58], but also in providing accurate values for energy levelsand transition moments that allows the calculation of transfer rates that areconsistent to the observed quantum yield [31,32,34,56–58].
The triplet energy levels are also very important in the energy transfer model, andthey are not probed by the electronic absorption spectroscopy. Thus, using phos-phorescence spectroscopy the triplet energy levels of several Gd(III) compounds[32,61] have been probed allowing for the test of the accuracy of the calculatedtriplet states. It should be noted that the calculated lowest triplet energy level forthese Gd(III) compounds is in perfect qualitative agreement with the observed data,and the quantitative agreement is also very good since it is off by at most 5% fromthe experiment [32,62]. These results show then the reliability of this methodologyto yield information about the ligand excited states in lanthanide compounds,encouraging us to apply it to several other systems such as macrocyclic cage-likeligands and polymeric systems doped with rare earth metal ions. The calculatedstructures of cage-like bpy · bpy · bpy cryptate ligands and their N-oxide derivativeshave corroborated the experimental evidence [4] that the oxidation of the nitrogenatom leads to a loss of coordinated water molecule [63]. In addition, the calculatedabsorption electronic spectra are good agreement with the observed ones and thecalculated triplet energy levels [63] seems to correlate quite well with the measuredemission efficiency [4] of several Eu(III) compounds.
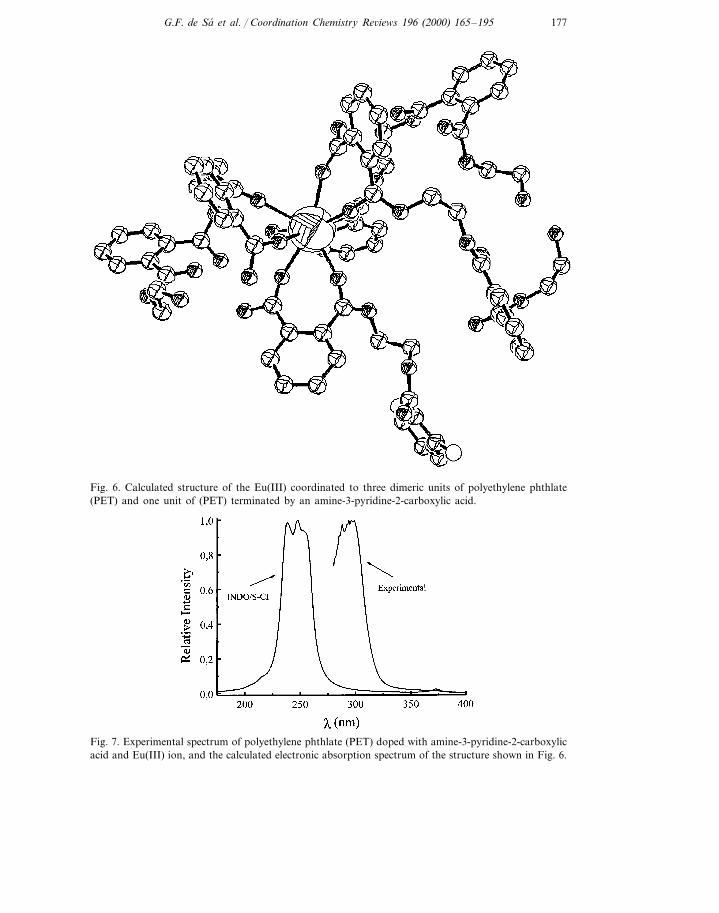
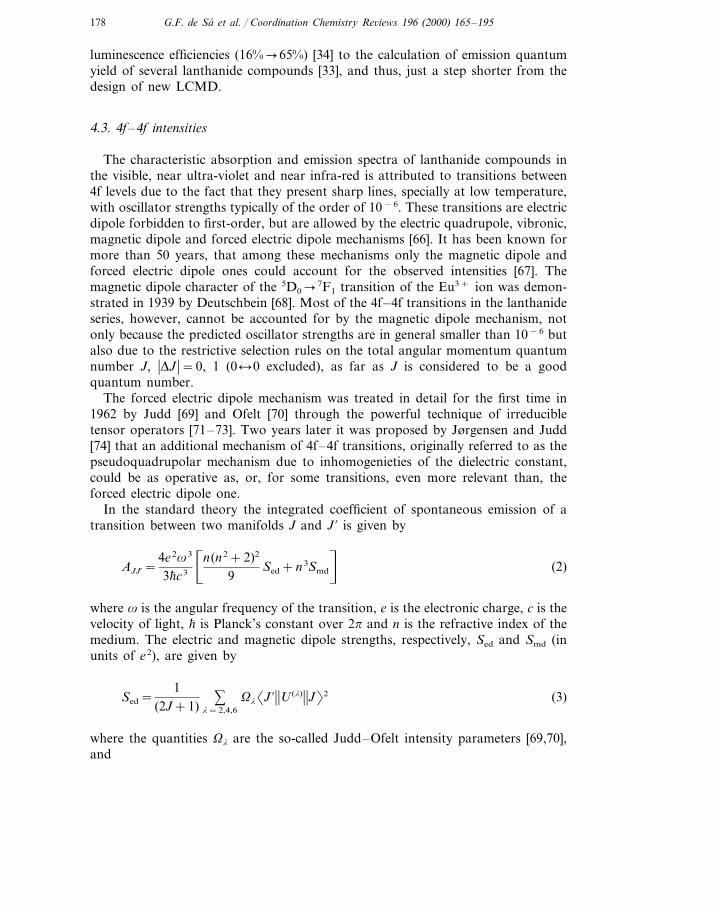
The condensation of phthalic acid and ethylene glycol with small amounts ofheteroaromatic acids yields a polymeric system, which is characterized by relativelysmall (10–15 units) chains since the heteroaromatic acids act as terminators. Rareearth metal ions have been used as spectroscopic and structural probes of thesepolymeric systems. In order to obtain the most information from this probing, itwould be important to have an approximate structure of Eu(III) coordinated to thedoped polymer. Several possible structures have been calculated [64] and one ofthem is shown in Fig. 6, which corresponds to a complex with seven monomericunits and one heteroaromatic residue. The calculated electronic absorption spec-trum agrees qualitatively quite well with the observed one (Fig. 7), including thestructure appearing at the top of the band. It has been proposed that the mostprominent spectroscopic feature of this system is the formation of exciplexes due tothe charge transfer transition within the polymer chain [65]. The calculated excitedstates corroborates this assertion, however, in the case of the polymer in thepresence of the lanthanide ion the exciplex is formed between two nearby aromaticrings belonging to different chain and coordinate to the metal ion [64].
These methodologies have achieved a high degree of applicability ranging fromthe semi-quantitative explanation of the substituent effects (CH3�CF3) on the
177G.F. de Sa et al. / Coordination Chemistry Re6iews 196 (2000) 165–195
Fig. 6. Calculated structure of the Eu(III) coordinated to three dimeric units of polyethylene phthlate(PET) and one unit of (PET) terminated by an amine-3-pyridine-2-carboxylic acid.
Fig. 7. Experimental spectrum of polyethylene phthlate (PET) doped with amine-3-pyridine-2-carboxylicacid and Eu(III) ion, and the calculated electronic absorption spectrum of the structure shown in Fig. 6.
178 G.F. de Sa et al. / Coordination Chemistry Re6iews 196 (2000) 165–195
luminescence efficiencies (16%�65%) [34] to the calculation of emission quantumyield of several lanthanide compounds [33], and thus, just a step shorter from thedesign of new LCMD.
4.3. 4f–4f intensities
The characteristic absorption and emission spectra of lanthanide compounds inthe visible, near ultra-violet and near infra-red is attributed to transitions between4f levels due to the fact that they present sharp lines, specially at low temperature,with oscillator strengths typically of the order of 10−6. These transitions are electricdipole forbidden to first-order, but are allowed by the electric quadrupole, vibronic,magnetic dipole and forced electric dipole mechanisms [66]. It has been known formore than 50 years, that among these mechanisms only the magnetic dipole andforced electric dipole ones could account for the observed intensities [67]. Themagnetic dipole character of the 5D0�7F1 transition of the Eu3+ ion was demon-strated in 1939 by Deutschbein [68]. Most of the 4f–4f transitions in the lanthanideseries, however, cannot be accounted for by the magnetic dipole mechanism, notonly because the predicted oscillator strengths are in general smaller than 10−6 butalso due to the restrictive selection rules on the total angular momentum quantumnumber J, �DJ �=0, 1 (0l0 excluded), as far as J is considered to be a goodquantum number.
The forced electric dipole mechanism was treated in detail for the first time in1962 by Judd [69] and Ofelt [70] through the powerful technique of irreducibletensor operators [71–73]. Two years later it was proposed by Jørgensen and Judd[74] that an additional mechanism of 4f–4f transitions, originally referred to as thepseudoquadrupolar mechanism due to inhomogenieties of the dielectric constant,could be as operative as, or, for some transitions, even more relevant than, theforced electric dipole one.
In the standard theory the integrated coefficient of spontaneous emission of atransition between two manifolds J and J % is given by
AJJ%=4e2v3
3'c3
�n(n2+2)2
9Sed+n3Smd
n(2)
where v is the angular frequency of the transition, e is the electronic charge, c is thevelocity of light, ' is Planck’s constant over 2p and n is the refractive index of themedium. The electric and magnetic dipole strengths, respectively, Sed and Smd (inunits of e2), are given by
Sed=1
(2J+1)%
l=2,4,6
Vl�J %��U (l)��J�2 (3)
where the quantities Vl are the so-called Judd–Ofelt intensity parameters [69,70],and
179G.F. de Sa et al. / Coordination Chemistry Re6iews 196 (2000) 165–195
Smd='2
4mc2 �J %��L+2S ��J�2 (4)
where m is the electron mass. The reduced matrix elements appearing in Eqs. (3)and (4) are evaluated in the intermediate coupling scheme [66], and the angularmomentum operators L and S are in units of '. The corresponding expression forthe oscillator strength may be obtained from the relation
PJ%J=2J+12J %+1
mc2
2v2e2n2 AJJ% (5)
The intensity parameters Vl depend on both the chemical environment and thelanthanide ion, and theoretically they are given by
Vl= (2l+1) %t,p
�Bltp �2(2t+1)
(6)
where the quantities Bltp, which have been described in detail elsewhere [75,76], maybe expressed as
Bltp=2
DE�r t+1�u(t, l)gp
t
−�(l+1)(2l+3)
(2l+1)n1/2
�rl�(1−sl)�3��C (l)��3�Gpt dt,l+1 (7)
where DE is the energy difference between the barycenters of the excited 4fN−1 5dand ground 4fN configurations, �rx� is a radial expectation value, u(t, l) is anumerical factor, sl is a screening factor, C (l) is a Racah tensor operator of rankl and dt,l+1 is the Kronecker delta function. The first term in the right-hand-sideof Eq. (7) corresponds to the forced electric dipole mechanism, as expressed by theaverage energy denominator method, and the second term corresponds to thedynamic coupling mechanism within the point dipole isotropic ligand polarizabilityapproximation.
The sums-over-ligands gpt , the so-called odd-rank ligand field parameters, and Gp
t
(t=1, 3, 5 and 7) contain the dependence on the coordination geometry and on thenature of the chemical environment around the lanthanide ion. The latter one isgiven by
Gpt =
� 4p
2t+1�1/2
%j
aj
Rjt+1 Yp
t*(uj, 8j) (8)
where aj is the isotropic polarizability of the jth ligand atom, or group of atoms, atposition Rjb and Yp
t is a spherical harmonic of rank t. Anisotropic corrections to Eq.(8) have been discussed in ref. [77]. Among the existing ligand field models in theliterature we have systematically applied the simple overlap model developed in ourgroup [78]. According to this model the ligand field parameters gp
t are expressed as
gpt =
� 4p
2t+1�1/2
e2 %j
rj(2bj)t+1 gj
Rjt+1 Yp
t*(uj, 8j) (9)
180 G.F. de Sa et al. / Coordination Chemistry Re6iews 196 (2000) 165–195
where rj is the magnitude of the total overlap between 4f and ligand wavefunctionsand bj=1/(1+rj). Eq. (9) should be interpreted as a ligand field parameterproduced by effective charges—rjgje located around the mid-points of the lan-thanide–ligand chemical bonds. Thus, the charge factors gj are more appropriatelytreated as parameters which no longer have to be given by the valencies of theligand atoms. The overlap rj has been assumed to vary as
rj=r0�R0
Rj
�n
(10)
where R0 is the smallest among the Rjs, r0=0.05 and n=3.5 [76]. The even rankligand field parameters, which give the Stark splitting of the J manifolds, are givenby their usual expression Bq
k=�rk�gqk.
It might be useful to consider the heat of formation, Q, of a coordinationcompound, associated with the reaction
Ln ion+xL1+yL2�Ln(L1)x(L2)y
According to the simple overlap model this is given by [32]
Q= −3e2 %j
gjrj
2bj
Rj
(11)
where the sum runs over the xL1 and yL2 ligating atoms. The value of Q givesinformation on the stabilization energy of the compound.
In the theoretical analysis of 4f–4f intensities two procedures may be adopted.One is to take the charge factors gj as the valencies of the ligating atoms, and thepolarizabilities aj from data available in the literature [79]. The other one is to takethese quantities as variable parameters within ranges of physically acceptable values[32,76]. The usefulness of a theoretical analysis is that it allows one to distinguishbetween the forced electric dipole and dynamic coupling mechanisms, and as aconsequence one may in principle get detailed information on the chemical environ-ment around the lanthanide ion. Moreover, it also allows the rationalization ofcertain features of the 4f–4f spectra as, for example, in the case of the behavior ofthe so-called hypersensitive transitions, which has been interpreted in terms of thedependence of the dynamic coupling mechanism on the coordination geometry andon the polarizabilities of the ligands [80].
As the site occupied by the lanthanide ion becomes more symmetric, the lowerrank gp
t and Gpt tend to vanish more rapidly than the higher rank ones, or in a more
general way, the former quantities are more sensitive to changes in symmetry thanthe latter ones, though the higher rank gp
t and Gpt are more sensitive to changes in
distances. This goes in the correct sense towards the understanding of the behaviorof the hypersensitive transitions, which are in general those dominated by theeffective operator V2U
(2). However, it has been observed that symmetry alonecannot account for the enormous variation sometimes observed in the intensities ofthese transitions for different chemical environments. Theoretical estimates haveshown that the dynamic coupling contribution is able to account for this enormousintensity variation through the polarizabilities of the ligating atoms, or groups of
181G.F. de Sa et al. / Coordination Chemistry Re6iews 196 (2000) 165–195
atoms. Thus, for example, in going from the gaseous compound NdF3 to gaseousNdI3, there is a change in polarizability, from the ion F− to the ion I−, of almostone order of magnitude. This might produce a change of almost two orders ofmagnitude in the intensities dominated by V2U (2). Abnormal changes in theintensities dominated by V4U (4) and V6U (6) may not occur since for these cases theconsiderable increase in the distance Nd�L (L=F and I) may compensate for theincrease in the polarizability value.
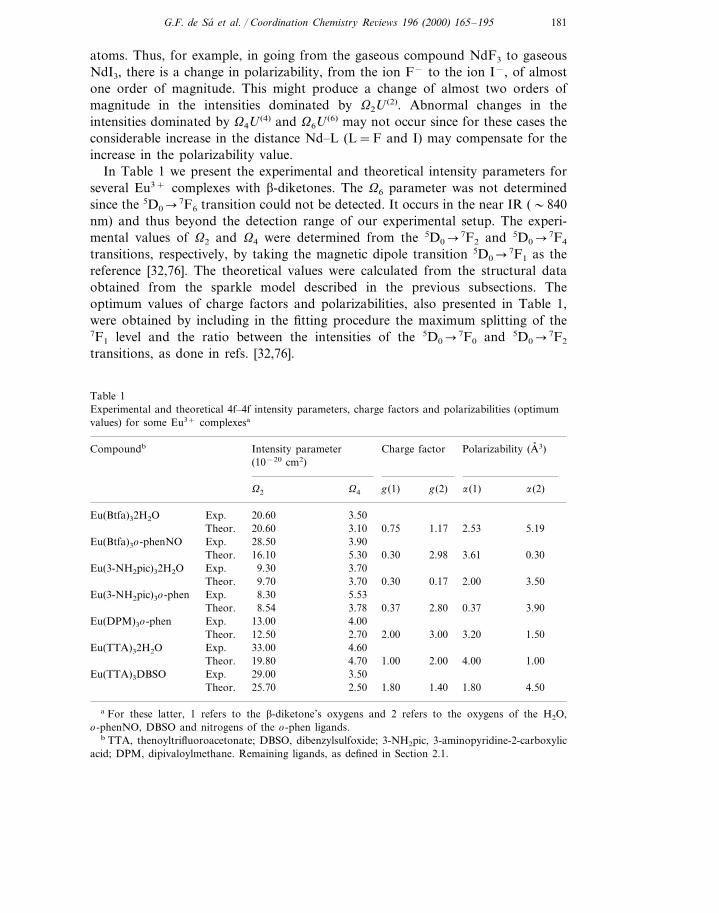
In Table 1 we present the experimental and theoretical intensity parameters forseveral Eu3+ complexes with b-diketones. The V6 parameter was not determinedsince the 5D0�7F6 transition could not be detected. It occurs in the near IR (�840nm) and thus beyond the detection range of our experimental setup. The experi-mental values of V2 and V4 were determined from the 5D0�7F2 and 5D0�7F4
transitions, respectively, by taking the magnetic dipole transition 5D0�7F1 as thereference [32,76]. The theoretical values were calculated from the structural dataobtained from the sparkle model described in the previous subsections. Theoptimum values of charge factors and polarizabilities, also presented in Table 1,were obtained by including in the fitting procedure the maximum splitting of the7F1 level and the ratio between the intensities of the 5D0�7F0 and 5D0�7F2
transitions, as done in refs. [32,76].
Table 1Experimental and theoretical 4f–4f intensity parameters, charge factors and polarizabilities (optimumvalues) for some Eu3+ complexesa
Intensity parameterCompoundb Charge factor Polarizability (A, 3)(10−20 cm2)
g(1) g(2) a(1) a(2)V2 V4
Exp. 20.60Eu(Btfa)32H2O 3.505.192.531.170.753.1020.60Theor.
Exp. 28.50Eu(Btfa)3o-phenNO 3.90Theor. 16.10 5.30 0.30 2.98 3.61 0.30
Eu(3-NH2pic)32H2O 3.709.30Exp.Theor. 9.70 3.70 0.30 3.502.000.17
Eu(3-NH2pic)3o-phen Exp. 8.30 5.538.54 3.78 0.37 3.900.37Theor. 2.80
Eu(DPM)3o-phen Exp. 13.00 4.001.503.203.002.002.7012.50Theor.
4.6033.00Exp.Eu(TTA)32H2O2.00 4.00 1.00Theor. 19.80 4.70 1.00
Exp. 29.00 3.50Eu(TTA)3DBSOTheor. 1.80 1.40 1.80 4.5025.70 2.50
a For these latter, 1 refers to the b-diketone’s oxygens and 2 refers to the oxygens of the H2O,o-phenNO, DBSO and nitrogens of the o-phen ligands.
b TTA, thenoyltrifluoroacetonate; DBSO, dibenzylsulfoxide; 3-NH2pic, 3-aminopyridine-2-carboxylicacid; DPM, dipivaloylmethane. Remaining ligands, as defined in Section 2.1.
182 G.F. de Sa et al. / Coordination Chemistry Re6iews 196 (2000) 165–195
A point to be noted is the uncommonly high values of the V2 intensity parameter,reflecting the hypersensitive behavior of the 5D0�7F2 transition when compared tothe case of the Eu3+ ion in inorganic materials. According to the dynamic couplingmechanism, this indicates that, in these compounds, the Eu3+ ion is in a highlypolarizable chemical environment, which explains some rather high values ofpolarizabilities (within a physically acceptable range) presented in Table 1. A moresystematic analysis of the trends in the g and a values, including a larger numberof compounds, is in progress.
4.4. Intramolecular energy transfer rates
In order to optimize the quantum yield and light output of a LCMD, severalprocesses must be controled: (i) the ligand absorption and internal decay processes;(ii) the efficiency of the ligand-to-metal energy transfer; and (iii) the luminescenceefficiency of the metal ion. Step (ii), which is crucial in determining the 4f–4femission quantum yield, was firstly identified by Weissman in the study of thestrong luminescence presented by certain organoeuropium compounds [81]. In spiteof the experimental difficulties, a few estimates of transfer rates have been made[82–84]. However, to our notice, no detailed investigation on the ligand–lanthanideion energy transfer mechanisms, and their associated selection rules, has beencarried out. This problem was recently analyzed in refs. [85,86], where both thedirect and exchange Coulomb interactions have been taken into account, leading toanalytical expressions for the energy transfer rates from which selection rules couldbe derived.
According to Fermi’s golden rule, within the Born–Oppenheimer approximation,the energy transfer rate, WET, is given by
WET=2p
'��c %f �H �cf %��2F (12)
where c and f % are the initial electronic states of the lanthanide ion and of theligand, respectively. After energy transfer takes place these are found in theelectronic states c % and f. The temperature dependent factor F contains a sum overFranck–Condon factors and the energy mismatch condition for the transferprocess. An approximate expression has been proposed for this factor, which is
F=1'gL
�ln 2p
�1/2
exp�
−� D'gL
�2
ln 2n
(13)
where gL is the ligand state band width at half-height and D is the differencebetween the donor and acceptor transition energies involved in the transfer process.In this expression it is assumed that donor and acceptor transitions have gaussianband shapes and that gL is much larger than the lanthanide state band width athalf-height.
The following expressions for the transfer rate have been obtained in refs. [85,86]
183G.F. de Sa et al. / Coordination Chemistry Re6iews 196 (2000) 165–195
WET=2p
'
e2SL
(2J+1)GF %
l
gl�a %J %��U (l)��aJ�2 (14)
which corresponds to the dipole–2l pole mechanism, with l=2, 4 and 6,
WET=4p
'
e2SL
(2J+1)GRL6 F %
l
Vled�a %J %��U (l)��aJ�2 (15)
corresponding to the dipole–dipole mechanism, also with l=2, 4 and 6, and
WET=8p
3'e2(1−s0)2
(2J+1)GRL4 F�a %J %��S ��aJ�2 %
m
)#f)%
k
mz(k)sm(k))f %$)2 (16)
corresponding to the exchange mechanism.In the above equations J is the total angular momentum quantum number of the
lanthanide ion and a specifies the 4f spectroscopic term. G is the multiplicity of theligand initial state and SL is the dipole strength associated with the transitionf�f % in the ligand. U (l) is the same unit tensor operator which appears in Eq. (3),the reduced matrix elements of which are given in the intermediate coupling scheme[87], and RL is the distance from the lanthanide ion to the region of the ligandmolecule in which the ligand donor (acceptor) state is localized [32]. The quantitiesVl
ed are the well-known Judd–Ofelt intensity parameters (forced electric dipolecontribution only), and the gls are given by
gl= (l+1)�rl�2
(RLl+2)2 �3��C (l)��3�2(1−sl)2 (17)
In Eq. (16), S is the total spin operator of the lanthanide ion, mz is thez-component of the electric dipole operator, sm (m=0, 91) is a spherical compo-nent of the spin operator and the index k runs over the electrons of the ligand. s0
is a screening factor of the same nature as those appearing in Eqs. (7) and (17) [32].The matrix element involving the coupled operators mz and sm can be treated byquantum chemical methods in the same way as the spin–orbit interaction isevaluated in molecular systems [32,88]. It has been calculated, in our case, from themolecular orbital wavefunctions obtained with the sparkle model described inSections 4.1 and 4.2. These ligand wavefunctions also leads to the followingdefinition of RL
RL=%i
c i2RL(i)
%i
c i2
(18)
where ci is the molecular orbital coefficient of atom i contributing to the liganddonor (or acceptor) state and RL(i ) is the distance from atom i to the lanthanideion.
The selection rules for the transfer process may be derived from the reducedmatrix elements in the above equations. Thus, one finds that �J−J %�5l5J+J %(J %=J=0 excluded), for the multipolar (dipole–2l pole and dipole–dipole) mecha-nisms, and DJ=0, 91 ( J %=J=0 excluded) for the exchange mechanism. It may,
184 G.F. de Sa et al. / Coordination Chemistry Re6iews 196 (2000) 165–195
therefore, be noted that these selections rules are complementary. From the ligandside the selection rules are taken into account through the values of SL and of theligand matrix element in Eq. (16). Since in this latter the electric dipole operator iscoupled with the spin operator, the usual selection rule on the multiplicities of thestates f and f % no longer applies. According to these selection rules, in the case ofthe Eu3+ ion, direct energy transfer to the 5D0 level is not allowed. This rule is,however, relaxed due to J-mixing effects and thermal population of the 7F1 level.On the other hand, quenching of emission from this level is allowed provided theEu3+ ion ends up in the 7F6, 7F4,
7F2 or 7F1 levels. Through the multipolarmechanisms, for this ion, good candidates to be involved with the transfer processwould be the 5D2, 5L6, 5G6 and 5D4 levels, while through the exchange mechanisma strong candidate would be the 5D1 manifold.
4.5. Rate equations and luminescence quantum yields: theory and experiment
The luminescence quantum yield of a given lanthanide complex is determined bya balance between radiative and non-radiative processes in the compound, and canbe estimated by solving a set of appropriate rate equations, involving the transitionand energy transfer rates, as well as the populations of the energy levels of both thelanthanide ion and the ligand [33].
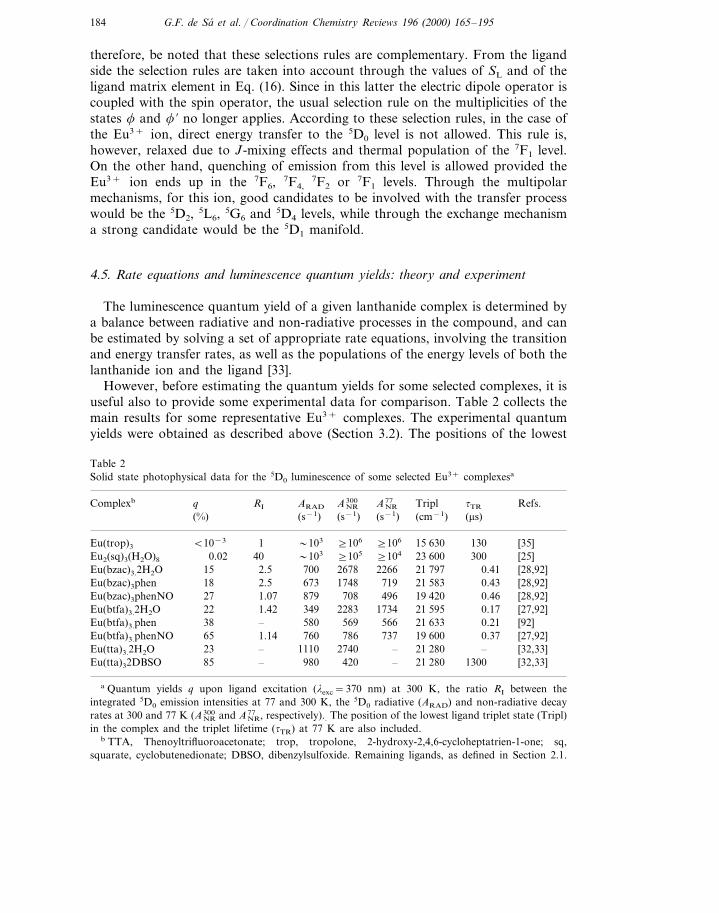
However, before estimating the quantum yields for some selected complexes, it isuseful also to provide some experimental data for comparison. Table 2 collects themain results for some representative Eu3+ complexes. The experimental quantumyields were obtained as described above (Section 3.2). The positions of the lowest
Table 2Solid state photophysical data for the 5D0 luminescence of some selected Eu3+ complexesa
ANR300ARAD Refs.RIqComplexb tTRTriplANR
77
(cm−1) (ms)(%) (s−1) (s−1) (s−1)
15 630Eu(trop)3 130B10−3 [35]1 �103 ]106 ]106
[25]30023 600]104]105Eu2(sq)3(H2O)8 �103400.022678 2266 21 797 0.41 [28,92]Eu(bzac)3.2H2O 2.515 700
Eu(bzac)3phen [28,92]0.4321 58371917486732.5180.4619 420496708 [28,92]8791.0727Eu(bzac)3phenNO
2283 1734 21 595 0.17 [27,92]Eu(btfa)3.2H2O 1.4222 34938 – 580 569Eu(btfa)3.phen 566 21 633 0.21 [92]
Eu(btfa)3.phenNO [27,92]65 1.14 760 786 737 19 600 0.3721 28027401110– –23Eu(tta)3.2H2O [32,33]–
85 [32,33]130021 280–420980–Eu(tta)32DBSO
a Quantum yields q upon ligand excitation (lexc=370 nm) at 300 K, the ratio RI between theintegrated 5D0 emission intensities at 77 and 300 K, the 5D0 radiative (ARAD) and non-radiative decayrates at 300 and 77 K (ANR
300 and ANR77 , respectively).. The position of the lowest ligand triplet state (Tripl)
in the complex and the triplet lifetime (tTR) at 77 K are also included.b TTA, Thenoyltrifluoroacetonate; trop, tropolone, 2-hydroxy-2,4,6-cycloheptatrien-1-one; sq,
squarate, cyclobutenedionate; DBSO, dibenzylsulfoxide. Remaining ligands, as defined in Section 2.1.
185G.F. de Sa et al. / Coordination Chemistry Re6iews 196 (2000) 165–195
ligand triplet states in the complexes correspond to the onset of the highest energytail of the low temperature emission spectra for the Gd3+ complexes (see Fig. 1 fora representative example). The 5D0 radiative decay rates (ARAD) for the Eu3+
complexes are obtained by summing over the radiative rates A0J for each 5D0�7FJ
emission transition. The A0J rates were calculated from the intensity ratios betweenthe 5D0�7FJ and the 5D0�7F1 emission transitions (I0J and I01, respectively) andthe magnetic–dipole transition rate A01, as described in [27]:
A0J=A01
I0J
I01
n01
n0J
(19)
The magnetic–dipole transition rate A01 is estimated to be 50 s−1, following
A01=10−42n3n3 (L+2S)2
gJ
(20)
Here the terms (L+2S)2 are the squared matrix elements, taken from ref. [90], gJ
is the statistical weight (2J %+1) of the excited state [91], n is the refractive index,and n is the transition frequency.
The non-radiative rates ANRT can be obtained from the calculated ARAD rates and
the experimental decay rates by [27]:
1/tT=ATOTT =ARAD+ANR
T ; (21)
where tT is the 5D0 decay time at temperature T.The luminescence spectra of the Eu3+ complexes are temperature-independent
from 300 to 4.2 K, apart from intensity differences. In all cases shown in Table 2,the ligand phosphorescence is observed for the Gd3+ complexes, but not for theEu3+ complexes, indicating that energy transfer from the ligand triplet states toEu3+ excited states is quite efficient. Nevertheless, the quantum yields vary fromremarkably high to extremely low values (or even total quenching). The reasons forthis behaviour will be discussed below.
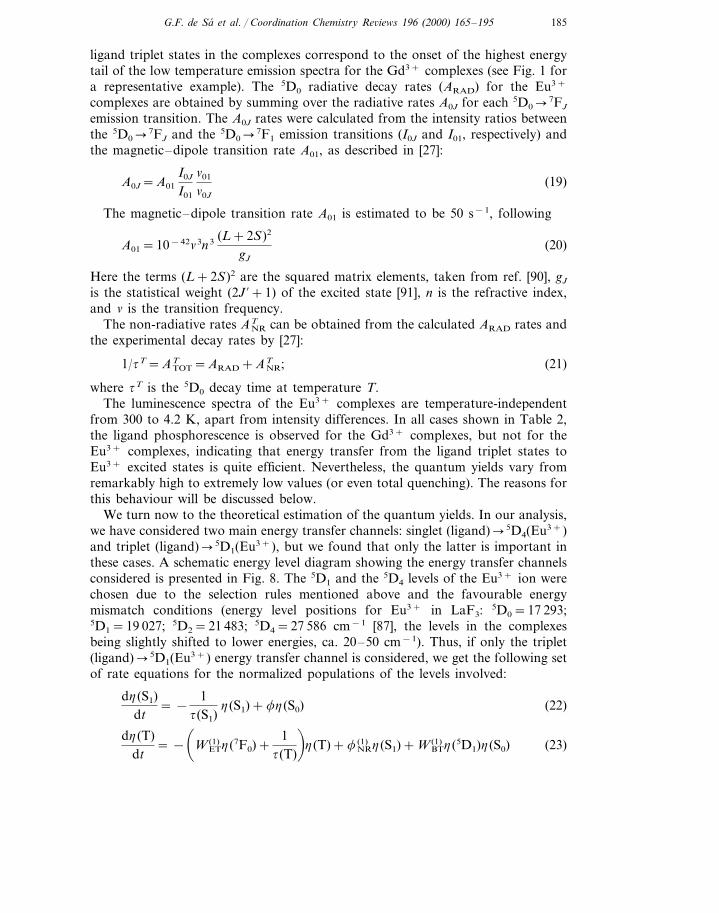
We turn now to the theoretical estimation of the quantum yields. In our analysis,we have considered two main energy transfer channels: singlet (ligand)�5D4(Eu3+)and triplet (ligand)�5D1(Eu3+), but we found that only the latter is important inthese cases. A schematic energy level diagram showing the energy transfer channelsconsidered is presented in Fig. 8. The 5D1 and the 5D4 levels of the Eu3+ ion werechosen due to the selection rules mentioned above and the favourable energymismatch conditions (energy level positions for Eu3+ in LaF3: 5D0=17 293;5D1=19 027; 5D2=21 483; 5D4=27 586 cm−1 [87], the levels in the complexesbeing slightly shifted to lower energies, ca. 20–50 cm−1). Thus, if only the triplet(ligand)�5D1(Eu3+) energy transfer channel is considered, we get the following setof rate equations for the normalized populations of the levels involved:
dh(S1)dt
= −1
t(S1)h(S1)+fh(S0) (22)
dh(T)dt
= −�
WET(1) h(7F0)+
1t(T)
�h(T)+fNR
(1) h(S1)+WBT(1) h(5D1)h(S0) (23)
186 G.F. de Sa et al. / Coordination Chemistry Re6iews 196 (2000) 165–195
dh(5D1)dt
= − (WBT(1) h(S0)+W2)h(5D1)+WET
(1) h(7F0)h(T) (24)
dh(5D0)dt
= −1
t(5D0)h(5D0)+W2h(5D1) (25)
h(5D0)+h(5D1)+h(5F1)=1 (26)
h(S1)+h(S0)+h(T)=1 (27)
where the term h represents the normalized level populations and t is the levellifetime in the absence of energy transfer. Internal conversion from S1 to S0 isassumed here to be much less important than the intersystem crossing from S1 to Tand is not taken into account in the above equations. Under this assumption wehave fNR
(1) $1/t(S1). These rate equations can be solved either numerically oranalytically. The emission quantum yield q (the ratio between the numbers ofemitted and absorbed photons) is given by
q=Af
h(5D0)h(S0)
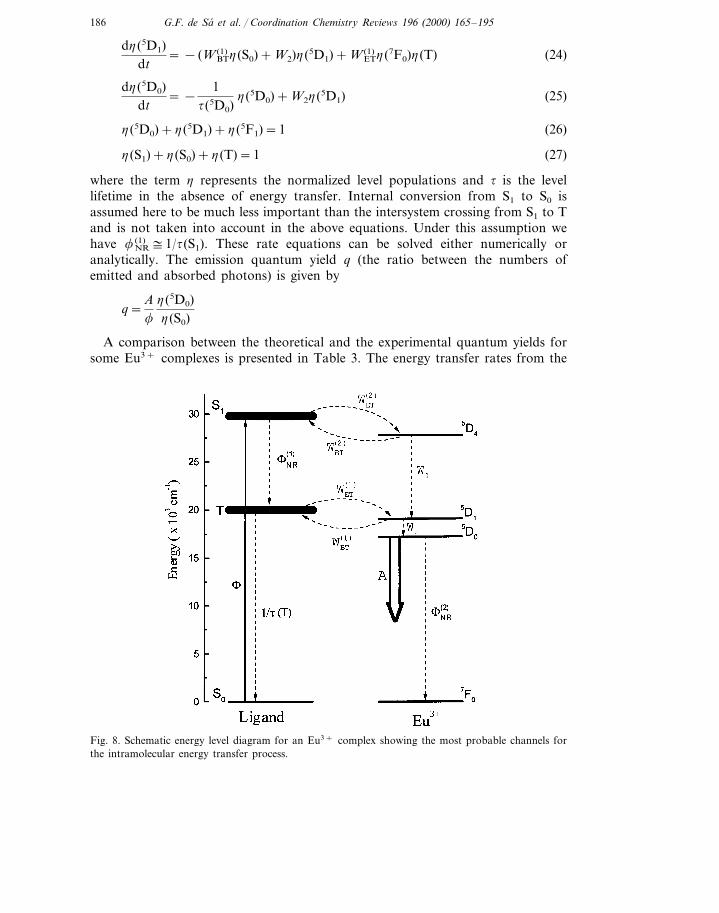
A comparison between the theoretical and the experimental quantum yields forsome Eu3+ complexes is presented in Table 3. The energy transfer rates from the
Fig. 8. Schematic energy level diagram for an Eu3+ complex showing the most probable channels forthe intramolecular energy transfer process.
187G.F. de Sa et al. / Coordination Chemistry Re6iews 196 (2000) 165–195
Table 3Experimental (qEXP) and theoretical (qTH) quantum yields upon ligand excitation at 300 K for the 5D0
luminescence of some selected Eu3+ complexesa
A t−1(5D0) qEXPWBT qTHComplex Ref.WET
(s−1) (s−1)(s−1) (%) (%)(s−1)
625 3571 229.9×10⁹ 19Eu(btfa)32H2O [92]8.1×10⁹
Eu(btfa)3phenNO 7.4×10¹⁰ 830 1492 65 56 [92]2.2×10¹¹
1110 3840Eu(tta)32H2O 231.3×10⁹ 29 [33]3.1×10⁸
980 1400 851.9×10⁸ 707.7×10⁸ [33]Eu(tta)32DBSO
a The rates for the ligand to Eu3+ ion energy transfer (WET) and Eu3+ to ligand energy back-transfer(WBT), the Eu3+ spontaneous emission coefficients A, and the total decay rates for the 5D0 level of theEu3+ ion (t−1(5D0)) are also included.
ligand triplet state T to the 5D1 level of the Eu3+ ion, the back-transfer rates(5D1�T), the Eu3+ spontaneous emission coefficient (equivalent to the ARAD rate),and the total 5D0 decay rates are also given. We assumed a singlet� tripletintersystem crossing rate of 108 s−1, a triplet state decay rate of 105 s−1, and a5D1�5D0 non-radiative decay rate of 106 s−1 [33]. The experimental observation of5D0 rise-times for many Eu3+ complexes (e.g. refs. [27,29]) clearly indicates that theenergy transfer from the ligand occurs to the 5D1 level or to levels above it, sincethe observed rise times correspond to the 5D1 lifetime (i.e. �4 ms).
As mentioned above, the quantum yields upon ligand excitation result from abalance between the ligand to Eu3+ energy transfer rates, the 5D0 radiative decayrates ARAD, and the 5D0 non-radiative decay rates ANR. The non-radiative decayrates may have contributions from several non-radiative processes [4,93,95,101]:multiphonon relaxation, energy back-transfer from the lanthanide ion to ligandexcited levels, relaxation to the ground state via crossover to another excited state(e.g. the ligand to metal charge-transfer state of the Eu3+ ion), or energy transferbetween the lanthanide ions themselves. The latter process is usually hampered incomplexes, especially between Eu3+ ions, due to the rather long Ln�Ln distances(\5 A, ), and can be neglected in our analysis. It must be kept in mind, however,that energy transfer between lanthanide ions can be relevant in many complexes[4,16], particularly for those ions which have longer critical distances for energytransfer (i.e. rc\6 A, ), such as Tb3+ or Ce3+ [93]. The contribution of themultiphonon relaxation process is essentially temperature independent in the tem-perature range usually investigated (viz. 4.2–300 K), whereas the rates due toback-transfer or crossover to the Eu3+ charge-transfer state are strongly tempera-ture dependent, since these processes are usually phonon-assisted [4,93].
Table 2 presents some examples where the nature of the dominating non-radia-tive processes can be clearly defined. For instance, the total lack of Eu3+ lumines-cence, even at 4.2 K, in the Eu(trop)3 complex is ascribed to an energyback-transfer to the ligand triplet states, since they are at lower energies than the5D0 state [30,35]. For the same reason, the Tb(trop)3 complex does not show anyluminescence at all [30,35]. Conversely, the strong quenching of the Eu3+ emission
188 G.F. de Sa et al. / Coordination Chemistry Re6iews 196 (2000) 165–195
in Eu2(sq)3(H2O)8 cannot be due to back-transfer because the ligand states are atmuch higher energies, and neither can it be due to multiphonon relaxation bycoupling to the O�H vibrations since the quenching is strongly temperaturedependent [25]. Moreover, the Tb2(sq)3(H2O)8 complex shows a temperature-inde-pendent quantum yield of 50% [25]. Therefore, the 5D0 quenching is ascribed to anon-radiative relaxation via the charge transfer (CT) state of Eu3+, which is atrather low energies in the squarate complexes (viz. ca. 20 000 cm−1) [25]. Quench-ing of the 5D0 emission of Eu3+ via a low-lying CT state has also been observed insome cryptates and calixarene complexes [4,12].
A comparison between the complexes of the b-diketones bzac and btfa isworthwhile, since these two ligands are very similar. The btfa complexes havehigher quantum yields than bzac complexes and Table 2 clearly indicates that thisis due to the lower non-radiative decay rates of the btfa complexes. Consideringthat the ANR rates are temperature dependent, it can be argued that, besides themultiphonon relaxation by coupling to O�H and C�H vibrations, phonon-assistedback-transfer and/or crossover to the Eu3+CT state are also operative. This latterprocess probably gives a larger contribution, because the positions of the tripletstates for the two classes of complexes seem to be too similar to explain theobserved differences. Since the temperature dependence is more pronounced for thebzac complexes, the additional non-radiative process has a larger contribution inthis case. The differences between btfa and bzac complexes can be ascribed to thepresence of the electron-withdrawing CF3 group in btfa and the electron-donor CH3
group in bzac, which would shift the CT state of Eu3+ to higher energies. Further,the multiphonon relaxation rates can be reduced (coupling with C�F versus C�Hoscillators).
The quantum yields also increase in the sequence H2O�phen�phenNO. Table2 shows that this effect can be ascribed to at least three factors: the ARAD ratesincrease (probably due to the larger opposite parity admixing induced by the higherpolarisability of the ligands), the ANR rates decrease (both the multiphononrelaxation and the temperature dependent rates), and the energy transfer ratesincrease (due to the lowering of the triplet states leading to better energy mismatchconditions). Table 3 shows that the higher quantum yields of the tta complexes, incomparison with the btfa complexes, are not due to higher energy transfer rates,but rather to larger spontaneous emission coefficients, lower non-radiative rates,and a better balance between energy transfer and back-transfer rates. Finally, it isalso important to point out that there is a good agreement between the experimen-tal and the theoretical quantum yields, showing that the theoretical estimation ofquantum yields can be a valuable tool for developing efficient LCMDs.
5. Device applications and future developments
In the past decade, luminescent lanthanide complexes have been intensivelystudied with particular interest towards applications to high efficient LCMDs [94].A great concern has been the design and successful synthesis of complexes with high
189G.F. de Sa et al. / Coordination Chemistry Re6iews 196 (2000) 165–195
quantum yields, which would also be thermodynamically stable, volatile andcompatible with advanced microelectronic technologies for thin film production.
The lanthanide complexes studied in this work embrace a class of new materialsthat present some of these characteristics, which make them of potential applicationto a wide range of processes and new technologies. In this section we present thefirst experimental results on Eu3+ and Tb3+-based thin film device structures ofgreat potential for some applications, such as sensors for UV radiation and anantireflection coating (ARC) on silicon solar cells. To our knowledge this is the firsttime that these complexes are produced as thin films and its optical and photonconversion properties are used to demonstrate the beneficial effects on microelec-tronic device characteristics. We emphasize here that beyond the high quantumyield of these materials, some new interesting features are obtained, on one handdue to the volatility of most fluorinated b-diketonate complexes and, on the otherhand because the control of degradation of some of these complexes, which allowsfor enlarging the range of applications into electroluminescence devices, dosimetersand advanced microelectronic processes such as photolithography and passivationcoatings.
We have produced thin films of Eu3+ and Tb3+-based complexes by thermo-evaporation techniques, attaining highly homogeneous films of thickness up to afew hundred Angstroms. For the device applications we have recently envisaged, weused a fluorinated b-diketone, namely btfa (4,4,4-trifluoro-1-phenyl-2,4-butane-dione) with 2,2%-bipyridine and 1,10-phenanthroline as heterobiaryl ligands [61].Two complexes synthesized in recent work [37], Eu(btfa)3bipy and Tb(btfa)3phenare very efficient light converters under UV excitation (where the ligands act asexcellent antennas, absorbing UV radiation, and efficiently transferring energy tothe Ln3+ emitters) with a remarkable luminescence quantum yield at roomtemperature. For instance, the quantum yield for Eu(btfa)3bipy thin film, measuredwith an integration sphere, was found to be 64%. The chemical and physicalproperties of these materials such as thermodynamical stability allow their favor-able use comparatively to other volatile ones [102]. In this way, it is possible tothermally evaporate, under low vacuum, fluorinated -diketonate complexes, inorder to obtain a highly uniform and stable thin film with strong luminescencecomparable to their powder [103] giving it a potential technological applicability.
Using these complexes as UV sensors, the Eu3+ red (5D0�7F2) and Tb3+ green(5D4�7F5) emissions were monitored as a function of UV excitation/exposure timefor the complex thin films. For the europium species, the red luminescencecontinuously decreases under UV radiation exposure, which is associated to acontrolled ablation of the complex, recently confirmed by ellipsometric measure-ments [37]. This process is irreversible and was quantified in absolute dose measure-ments; the luminescence quenching is precisely related to the amount of UV energyper area. In this way, we correlate this ablative process to the UV time exposureand intensity in order to dose, for instance, the cumulative effect of sunlight onhuman skin. For the Eu(btfa)3bipy in the powder form, the same behavior isobserved, but with a much slower time constant for the luminescence decrease,allowing dosimetric sensitivity control.
190 G.F. de Sa et al. / Coordination Chemistry Re6iews 196 (2000) 165–195
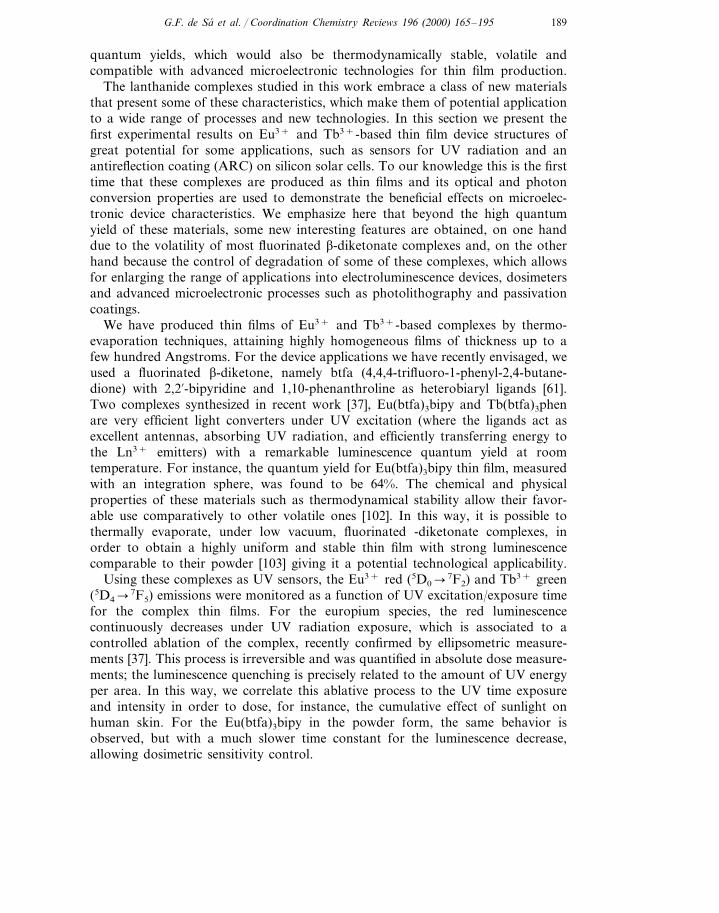
Fig. 9. Dosimetric curves for the device using a 600 A, film for UVA,B and a 150 A, film for UVC.
For the Tb3+ 5D4�7F5 emission, the behavior is opposite for several minutes. Aluminescence raise is observed for this green emission, which returns to the initialvalue afterwards. The system act as a UV dosimeter [104] at a molecular level, andis very selective and sensitive to UV radiation, and may be controlled by varyingthe film thickness according to the application needs and aims, the source to bemeasured or the exposed material. The dosimeter was calibrated by an integrationsphere coupled to a radiometer.
A curve of energy per unit area (J/cm2) at the three UV regions regarding skindamage as a function of luminescence quenching is shown in Fig. 9. We maydetermine the energy per unit area received by the exposed material just by knowingits percentage quenching of luminescence. The dosimeter measurement is done bycomparing an UV irradiated sample to a non-irratiated one, therefore, this figurecorresponds to the UV dosimeter calibration curve, which may be used to calculatehow much UV radiation the material was exposed.
This new kind of UV dosimeter is based on the luminescence decrease of thecomplexes by UV degradation, and is monitored and correlated to the amount ofUV exposure, as shown in the Fig. 9. The effect of the Eu(III) luminescencequenching is reproducible, and is accurately associated with the amount of UVenergy per unit area. The greatest advantage of this molecular dosimeter is its widerange of sensitivity that may be adjusted by varying the film thickness allowing usto adjust it to the kind of source to be dosed (artificial or sunlight). The systemstudied detects the UV radiation in a cumulative way giving it a memory effect,allowing highly reliable dosimetric measurements.
The long-term stability of the Eu(btfa)3bipy complex in the thin film form hasbeen observed over a 6 month period, exposed to atmospheric pressure, and nonoticeable change in its properties was found. All the above characteristics, allied tothe compatibility with standard device processing techniques (for thin film produc-tion) suggests the possibility of using the material in device applications.
Another simple approach would be its use as antireflection coating (ARC) ofphotovoltaic devices such as solar cells and photo detectors or sensors associated
191G.F. de Sa et al. / Coordination Chemistry Re6iews 196 (2000) 165–195
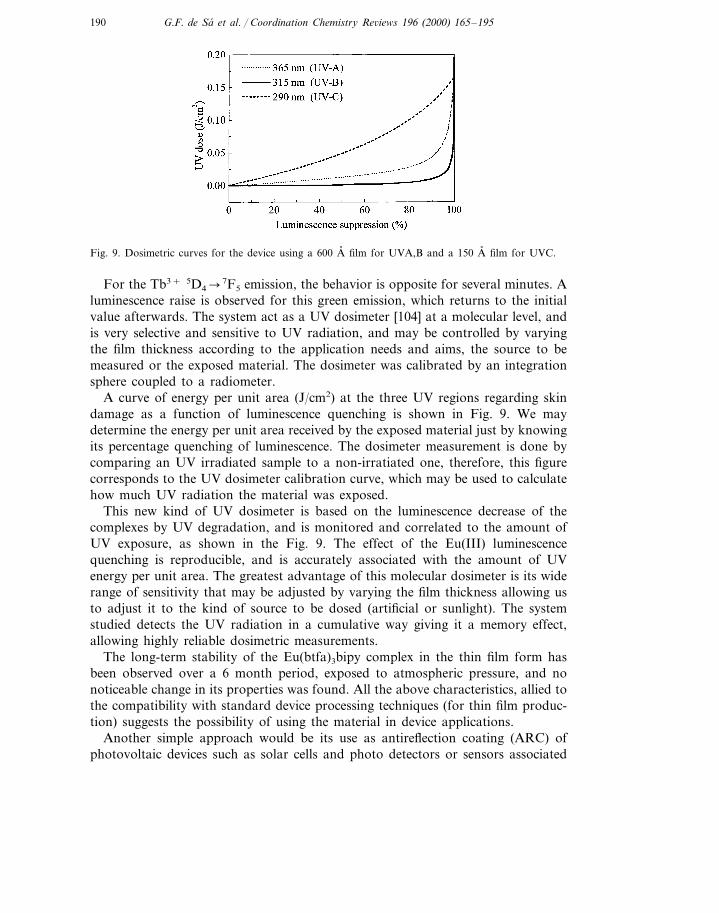
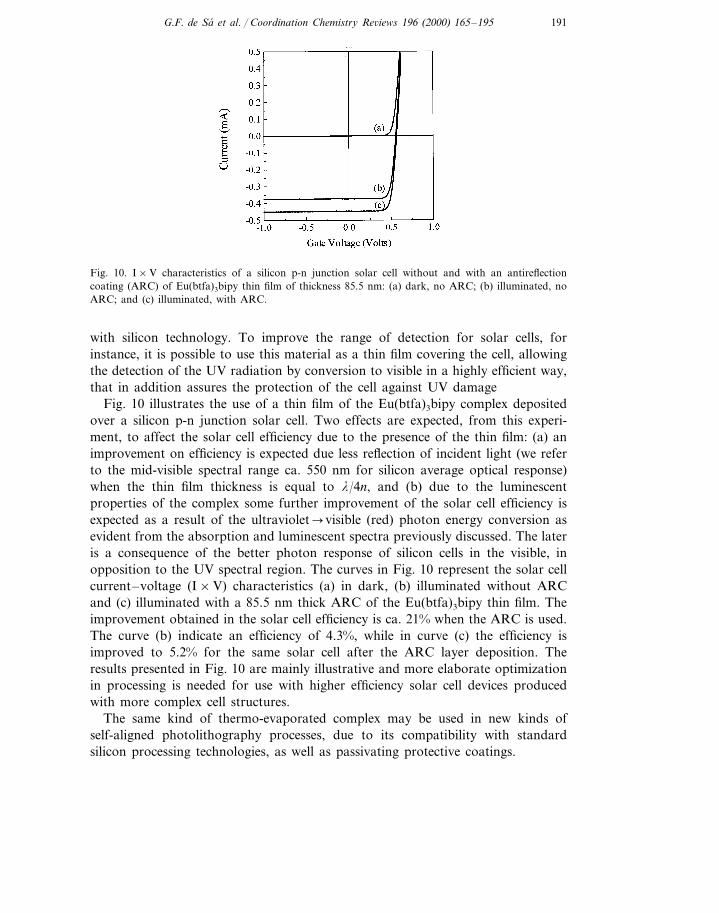
Fig. 10. I×V characteristics of a silicon p-n junction solar cell without and with an antireflectioncoating (ARC) of Eu(btfa)3bipy thin film of thickness 85.5 nm: (a) dark, no ARC; (b) illuminated, noARC; and (c) illuminated, with ARC.
with silicon technology. To improve the range of detection for solar cells, forinstance, it is possible to use this material as a thin film covering the cell, allowingthe detection of the UV radiation by conversion to visible in a highly efficient way,that in addition assures the protection of the cell against UV damage
Fig. 10 illustrates the use of a thin film of the Eu(btfa)3bipy complex depositedover a silicon p-n junction solar cell. Two effects are expected, from this experi-ment, to affect the solar cell efficiency due to the presence of the thin film: (a) animprovement on efficiency is expected due less reflection of incident light (we referto the mid-visible spectral range ca. 550 nm for silicon average optical response)when the thin film thickness is equal to l/4n, and (b) due to the luminescentproperties of the complex some further improvement of the solar cell efficiency isexpected as a result of the ultraviolet�visible (red) photon energy conversion asevident from the absorption and luminescent spectra previously discussed. The lateris a consequence of the better photon response of silicon cells in the visible, inopposition to the UV spectral region. The curves in Fig. 10 represent the solar cellcurrent–voltage (I×V) characteristics (a) in dark, (b) illuminated without ARCand (c) illuminated with a 85.5 nm thick ARC of the Eu(btfa)3bipy thin film. Theimprovement obtained in the solar cell efficiency is ca. 21% when the ARC is used.The curve (b) indicate an efficiency of 4.3%, while in curve (c) the efficiency isimproved to 5.2% for the same solar cell after the ARC layer deposition. Theresults presented in Fig. 10 are mainly illustrative and more elaborate optimizationin processing is needed for use with higher efficiency solar cell devices producedwith more complex cell structures.
The same kind of thermo-evaporated complex may be used in new kinds ofself-aligned photolithography processes, due to its compatibility with standardsilicon processing technologies, as well as passivating protective coatings.
192 G.F. de Sa et al. / Coordination Chemistry Re6iews 196 (2000) 165–195
High efficiency organic electroluminescence devices have recently been importantto the development of a new large-size display technologies: 10 years ago, Tang andSlyke demonstrated the viability of low-voltage electroluminescent diodes [97],allowing one to envisage tunability of color in electroluminescent LEDs (lightemitting diodes).
The rare earth ions exhibit very sharp emission bands (sharper than usualluminescent organic dyes), allowing a precise color coordinate control, as shown ina new optical material, namely the full color glass, where the three primary lightcolors are produced only by 4f–4f rare earth emissions [98–100]. The volatility ofhighly efficient rare earth b-diketonates makes it possible to attain the same processof color control with very narrow emission lines of primary color in mixed thinfilms or in a multi-layer sandwich of thin films produced by the thermo-evaporationtechnique.
The new devices obtained by using thin films of fluorinated b-diketonates oflanthanides may improve the quality of color generation for large area displays andsolid state microsources of white light. Therefore great interest lies in the possibilityof designing dedicated structures for these applications.
Another application of these materials in the film thin form, which we arepresently working on, is as electroluminescent LCMDs made of multilayers ofdifferent Ln3+ complexes. With the use of appropriate metal-contacting carrierinjectors, under relatively low biases, could emit light possibly sweeping the fullvisible range. This would be possible by using multilayer structures of thesematerials containing Eu3+ (red emission), Tb3+ (green emission) and Tm3+ (blueemission) and taking advantage of the high quantum yield and stability of thecomplexes in the thin film form.
Acknowledgements
The authors are grateful to CNPq, PADCT, CAPES, FACEPE, and FINEP(Brazilian Agencies) for partially supporting this work, to Dr S. Alves Jr. forspectroscopic measurements, B.J.P. da Silva for technical assistance on the thin filmdeposition and, Mr Gerd B. da Rocha for providing the calculated triplet resultsprior to publication.
References
[1] J.-M. Lehn, Angew. Chem. Int. Ed. Engl. 29 (1990) 1304.[2] M. Pietraszkiewicz, J. Karpiuk, A.K. Rout, Pure Appl. Chem. 65 (1993) 563.[3] N. Sabbatini, M. Guardigli, I. Manet, R. Ungaro, A. Casnati, R. Ziessel, G. Ulrich, Z. Asfari,
J.-M. Lehn, Pure Appl. Chem. 67 (1995) 135.[4] N. Sabbatini, M. Guardigli, J.-M. Lehn, Coord. Chem. Rev. 123 (1993) 201.[5] B. Alpha, V. Balzani, J.-M. Lehn, S. Perathoner, N. Sabbatini, Angew. Chem. Int. Ed. Engl. 26
(1987) 1266.[6] G. Mathis, Clin. Chem. 41 (1995) 1391.
193G.F. de Sa et al. / Coordination Chemistry Re6iews 196 (2000) 165–195
[7] B. Alpha, J.-M. Lehn, G. Mathis, Angew. Chem. Int. Ed. Engl. 26 (1987) 266.[8] I.A. Hemmila, Applications of Fluorescence in Immunoassays, Wiley, New York, 1991.[9] H. Mikola, H. Takkalo, I. Hemmila, Bioconj. Chem. 6 (1995) 235.
[10] H. Takkalo, V.M. Mukkala, L. Merio, J.C. Rodriguez-Ubis, R. Sedano, O. Juanes, E. Brunet,Helv. Chim. Acta 80 (1997) 372.
[11] V.M. Mukkala, J.J. Kankare, Helv. Chim. Acta 75 (1992) 1578.[12] J.-C.G. Bunzli, F. Ihringer, Inorg. Chim. Acta 246 (1996) 195.[13] J.-C.G. Bunzli, E. Moret, V. Foiret, K.J. Schenk, W. Mingzhao, J. Linpei, J. Alloys Comp.
207/208 (1994) 107.[14] C. Piguet, G. Bernardinelli, G. Hopfgartner, Chem. Rev. 97 (1997) 2005.[15] J.-C.G. Bunzli, P. Froidevaux, J.M. Harrowfield, Inorg. Chem. 32 (1993) 3306.[16] G. Blasse, G.J. Dirksen, N. Sabbatini, S. Perathoner, Inorg. Chim. Acta 133 (1987) 167.[17] G. Blasse, L.H. Brixner, Recl. Trav. Chim. Pays-Bas 109 (1990) 172.[18] M.H.V. Werts, J.W. Hofstraat, F.A.J. Geurts, J.W. Verhoeven, Chem. Phys. Lett. 276 (1997) 196.[19] D.B. Bol’shoi, S.B. Meshkova, Z.M. Topilova, M.O. Lozinskii, Yu.E. Shapiro, Opt. Spectrosc. 83
(1997) 627.[20] P.K. Sharma, A.R. van Doorn, A.G.J. Staring, J. Lumin. 62 (1994) 219.[21] E.J. Nassar, P.S. Calefi, I.L.V. Rosa, O.A. Serra, J. Alloys Comp. 275/277 (1998) 838.[22] G.F. de Sa, W.M. de Azevedo, A.S.L. Gomes, J. Chem. Res. (S) (1994) 234.[23] G.F. de Sa, F.R.G. e Silva, O.L. Malta, J. Alloys Comp. 207/208 (1994) 457.[24] C. de Mello Donega, S. Alves Jr., G.F. de Sa, Chem. Commun. (1996) 1199.[25] C. de Mello Donega, S.J.L. Ribeiro, R.R. Goncalves, G. Blasse, J. Phys. Chem. Solids 57 (1996)
1727.[26] M.E. Mesquita, G.F. de Sa, M.A.B. Lopes, O.L. Malta, J. Chem. Res. (S) (1996) 120.[27] C. de Mello Donega, S. Alves Jr., G.F. de Sa, J. Alloys Comp. 250 (1997) 422.[28] S. Alves Jr., F.V. Almeida, G.F. de Sa, C. de Mello Donega, J. Lumin. 72/74 (1997) 478.[29] M.E. Mesquita, G.F. de Sa, O.L. Malta, J. Alloys Comp. 250 (1997) 417.[30] B.S. Santos, C. de Mello Donega, G.F. de Sa, J. Lumin. 72/74 (1997) 535.[31] A.V.M. de Andrade, N.B. da Costa Jr., R.L. Longo, O.L. Malta, A.M. Simas, G.F. de Sa, Mol.
Eng. 7 (1997) 293.[32] O.L. Malta, H.F. Brito, J.F.S. Menezes, F.R. Goncalves e Silva, S. Alves Jr., F.S. Farias Jr.,
A.V.M. de Andrade, J. Lumin. 75 (1997) 255.[33] O.L. Malta, H.F. Brito, J.F.S. Menezes, F.R. Goncalves e Silva, C. de Mello Donega, S. Alves Jr.,
Chem. Phys. Lett. 282 (1998) 233.[34] H.J. Batista, A.V.M de Andrade, R.L. Longo, A.M. Simas, G.F. de Sa, N.K. Ito, L.C. Thompson,
Inorg. Chem. 37 (1998) 3542.[35] B.S. Santos, C. de Mello Donega, G.F. de Sa, L.F.C. de Oliveira, P.S. Santos, Spectrochim. Acta
A 54 (1998) 2237.[36] G.F. de Sa, S. Alves Jr., B.J.P. da Silva, E.F. da Silva Jr., Opt. Mater. 11 (1998) 23.[37] C.G. Gameiro, E.F. da Silva Jr., S. Alves Jr., G.F. de Sa, P.A. Santa-Cruz, Mater. Sci. Forum
(1999) in press.[38] C.R. Ronda, J. Alloys Comp. 225 (1995) 534.[39] J. Kido, W. Ikeda, M. Kimura, K. Nagai, Jpn. J. Appl. Phys. 35 (1996) L394.[40] A. Bril, W. De Jager-Veenis, J. Res. Nat. Bureau Stand. 80A (1976) 401.[41] A. Bril, W. De Jager-Veenis, J. Electrochem. Soc. 123 (1976) 396.[42] W. De Jager-Veenis, A. Bril, Philips J. Res. 33 (1978) 124.[43] D.J. Brecknell, D.J. Raber, D.M. Ferguson, J. Mol. Struct. 124 (1985) 343.[44] R. Fossheim, H. Dugstad, S.G. Dahl, J. Med. Chem. 34 (1991) 819.[45] R. Fossheim, S.G. Dahl, Acta Chem. Scand. 44 (1990) 698.[46] M.J.S. Dewar, E.G. Zoebisch, E.F. Healy, J.J.P. Stewart, J. Am. Chem. Soc. 107 (1985) 3902.[47] J.C. Culberson, P. Knappe, N. Rosch, M.C. Zerner, Theoret. Chim. Acta 71 (1987) 21.[48] D.M. Ferguson, D.J. Raber, J. Comp. Chem. 11 (1990) 1061.[49] D.R. Salahub, M.C. Zerner (Eds.), The Challenge of d and f Electrons. Theory and Computation,
American Chemical Society, Washington, 1989.
194 G.F. de Sa et al. / Coordination Chemistry Re6iews 196 (2000) 165–195
[50] A.V.M. Andrade, N.B. Costa Jr., A.M. Simas, G.F. de Sa, Chem. Phys. Lett. 227 (1994) 349.[51] (a) J.J.P. Stewart, J. Comp.-Aided Mol. Des. 4 (1990) 1. (b) M.B. Coolidge, J.J.P. Stewart,
MOPAC Manual, Frank J. Seiler Research Laboratory, US Air Force Academy, CO 80840, 1990.[52] A.V.M. de Andrade, N.B. da Costa Jr., A.M. Simas, G.F. de Sa, J. Alloys Comp. 225 (1995) 55.[53] A.V.M. de Andrade, R.L. Longo, A.M. Simas, G.F. de Sa, J. Chem. Soc. Faraday Trans. 92
(1996) 1835.[54] (a) J.E. Ridley, M.C. Zerner, Theor. Chim. Acta 32 (1973) 111; 42 (1976) 223. (b) M.C. Zerner,
G.H. Loew, R.F. Kirchner, U.T. Mueller-Westerhoff, J. Am. Chem. Soc. 102 (1980) 589.[55] M.C. Zerner, ZINDO Manual, QTP, University of Florida, Gainesville, FL 32611, 1990.[56] H.J. Batista, A.V.M. de Andrade, R.L. Longo, A.M. Simas, G.F. de Sa, L.C. Thompson, J.
Lumin. 72/74 (1997) 159.[57] A.V.M. de Andrade, N.V. da Costa Jr., O.L. Malta, R.L. Longo, A.M. Simas, G.F. de Sa, J.
Alloys Comp. 250 (1997) 412.[58] A.V.M. de Andrade, N.B. da Costa Jr., A.M. Simas, R.L. Longo, O.L. Malta e, G.F. de Sa,
Quımica Nova 21 (1998) 51.[59] J.H. Van Vleck, V.F. Weisskopf, Rev. Mod. Phys. 17 (1945) 227.[60] H. Townes, A.L. Schawlow, Microwave Spectroscopy, Dover, New York, 1975.[61] S. Alves Jr., Ph.D. Thesis, Departamento de Quımica Fundamental, UFPE, Brazil, 1998.[62] G.B. da Rocha, Masters Dissertation, Departamento de Quımica Fundamental, UFPE, Brazil,
1998.[63] R.L. Longo, IX Brazilian Symp. Theoretical Chemistry, 5, Caxambu, Brazil, 1997.[64] E.M. Lucena, P.N.M. dos Anjos, R.L. Longo, in preparation.[65] P.N.M. dos Anjos, W.M. Azevedo, G.F. de Sa, O.L. Malta, J. Lumin. 72/74 (1997) 487.[66] R.D. Peacock, Struct. Bond. 22 (1975) 83.[67] L.J.F. Broer, C.J. Gorter, J. Hoogschagen, Physica 11 (1945) 231.[68] O. Deutschbein, Ann. Phys. 36 (1939) 183.[69] B.R. Judd, Phys. Rev. 127 (1962) 750.[70] G.S. Ofelt, J. Chem. Phys. 37 (1962) 511.[71] B.R. Judd, Operator Techniques in Atomic Spectroscopy, McGraw-Hill Book Company, New
York, 1963.[72] B.L. Silver, Irreducible Tensor Methods: An Introduction for Chemists, Academic Press, London,
1976.[73] E.U. Condon, H. Odabasi, Atomic Structure, Cambridge University Press, Cambridge, 1980.[74] C.K. Jørgensen, B.R. Judd, Mol. Phys. 8 (1964) 281.[75] O.L. Malta, S.J.L. Ribeiro, M. Faucher, P. Porcher, J. Phys. Chem. Solids 52 (1991) 587.[76] O.L. Malta, M.A. Couto dos Santos, L.C. Thompson, N.K. Ito, J. Lumin. 69 (1996) 77.[77] J.J. Dallara, M.F. Reid, F.S. Richardson, J. Phys. Chem. 88 (1984) 3587.[78] O.L. Malta, Chem. Phys. Lett. 88 (1982) 353.[79] M. Faucher, D. Garcia, Phys. Rev. B 26 (1982) 5451.[80] B.R. Judd, J. Chem. Phys. 70 (1979) 4830.[81] S.I. Weissman, J. Chem. Phys. 10 (1942) 214.[82] G.A. Crosby, Mol. Cryst. 1 (1966) 37.[83] G.F. Buono-Core, H. Li, B. Marciniak, Coord. Chem. Rev. 99 (1990) 55.[84] I.M. Alaoui, J. Phys. Chem. 99 (1995) 13280.[85] O.L. Malta, J. Lumin. 71 (1997) 229.[86] F.R. Goncalves e Silva, O.L. Malta, J. Alloys Comp. 250 (1997) 427.[87] W.T. Carnall, H. Crosswhite and H.M. Crosswhite, Energy level structure and transition probabil-
ities of the trivalent lanthanides in LaF3, Argonne National Laboratory Report, unnumbered,1977.
[88] J.T. Yardley, Introduction to Molecular Energy Transfer, Academic Press, New York, 1980,Chap. 7.
[89] A.V.M. de Andrade, M.A. de Brito, A.L. Coelho, G.F. de Sa, Inorg. Chim. Acta 19 (1976) 20.[90] S. Petoud, J.-C.G. Bunzli, K.J. Schenk, C. Piguet, Inorg. Chem. 36 (1997) 1345.[91] J.A. Detrio, Phys. Rev. B 4 (1971) 1422.
195G.F. de Sa et al. / Coordination Chemistry Re6iews 196 (2000) 165–195
[92] C. de Mello Donega, S. Alves Jr., O.L. Malta, G.F. de Sa, Mater. Sci. Forum (1998) in press.[93] B. Henderson, G.F. Imbusch, Optical Spectroscopy of Inorganic Solids, Clarendon Press, Oxford,
1989.[94] J.-C Bunzli, G.R Choppin (Eds.), Lanthanides Probes in Life, Medical and Environmental
Science, Elsevier, Amsterdam, 1989.[95] W.W. De Horrocks Jr., D.R. Sudnick, J. Am. Chem. Soc. 101 (1979) 334.[96] M.P.O. Wolbers, F.C.J.M. Van Veggel, B.H.M. Snellink-Ruel, J.W. Hofstraat, F.A.J. Geurts,
D.N. Reinhoudt, J. Am. Chem. Soc. 119 (1997) 138.[97] C.W. Tang, S.A. Van Slyke, Appl. Phys. Lett. 51 (1987) 913.[98] J.E.C. da Silva, O.L. Malta, G.F. de Sa, P.A. Santa-Cruz, J. Lumin. 72/73 (1997) 270.[99] J.E.C. da Silva, O.L. Malta, G.F. de Sa, P.A. Santa-Cruz, Quımica Nova 21 (1998) 372.
[100] J.E.C. da Silva, O.L. Malta, G.F. de Sa, P.A. Santa-Cruz, Proc. 3rd. Int. Conf. on the Science andTechnology of Display Phosphor, CA, November, 3–5, 1997, p. 163.
[101] S.T. Frey, M.L. Gong, W.W. Horrocks De Jr., Inorg. Chem. 33 (1994) 3229.[102] E.A. Mazurenko, A.I. Gerasimchuk, J. Phys. 4/5 (1995) 547.[103] K.Z. Wang, Solid State Comm. 98 (1996) 1075.[104] P.A. Santa-Cruz, C.G. Gameiro, Patent No. PI9705743-6, March, 1998.[105] G.F. de Sa, L.H.A. Nunes, Z.-M. Wang, G.R. Choppin, J. Alloys Comp. 196 (1993) 17.[106] D. Parker, P. Kanthi-Senanayake, J.A.G. Williams, J. Chem. Soc, Perkin Trans. 2 (1998) 2129.[107] A. Beeby, R.S. Dickins, S. Faulkner, D. Parker, J.A.G. Williams, Chem. Commun. (1997) 1401.[108] A. Beeby, S. Faulkner, Chem. Phys. Lett. 266 (1997) 116.[109] W.W. Horrocks De Jr., P. Bolender, W.D. Smith, R.M. Supkowski, J. Am. Chem. Soc. 119 (1997)
5972.[110] S.T. Frey, C. Allen Chang, J.F. Carvalho, A. Varadarajan, L.M. Schultze, K.L. Pounds, W.W. De
Horrocks Jr., Inorg. Chem. 33 (1994) 2882.[111] M.P. Oude Wolbers, F.C.J.M. Van Veggel, B.H.M. Snellink-Ruel, J.W. Hofstraat, F.A.J. Geurts,
D.N. Reinhoudt, J. Chem. Soc. Perkin Trans. 2 (1998) 2141.[112] D.J. Qian, H. Nakahara, K. Fukuda, K.-Z. Yang, Langmuir 11 (1995) 4491.[113] M. Inamura, Y. Hasegawa, Y. Wada, K. Murakoshi, T. Kitamura, N. Nakashima, T. Yamanaka,
S. Yanagida, Chem. Lett. (1997) 1067.[114] R. Ludwig, H. Matsumoto, M. Takeshita, K. Ueda, S. Shinkai, Supramol. Chem. 4 (1995) 319.[115] P.L. Jones, A.J. Amoroso, J.C. Jeffery, J.A. McCleverty, E. Psillakis, L.H. Rees, M.D. Ward,
Inorg. Chem. 36 (1997) 10.
.