
Spectroscopic FTIR imaging of water species in silicic ...Tani_JVolcGeotherm_2006... ·...
13
Spectroscopic FTIR imaging of water species in silicic volcanic glasses and melt inclusions: An example from the Izu-Bonin arc Richard Wysoczanski ⁎ , Kenichiro Tani Institute for Research on Earth Evolution, Japan Agency for Marine–Earth Science and Technology, 2–15 Natsushima-cho, Yokosuka, Kanagawa 237-0061, Japan Received 8 April 2005; accepted 2 March 2006 Available online 9 May 2006 Abstract Recent advances in FTIR spectroscopic imaging allow images of elements or molecules such as water to be constructed on samples over a large (sub mm) area. The imaging detector consists of 64×64 channels providing 4096 individual spectra simultaneously collected over a spectral range of 4000–900 cm − 1 . The wavelength range includes measurable peaks for water and carbon species, making it ideal for the analysis of volcanic glasses, particularly melt inclusions. Advantages of spectroscopic imaging include high spatial resolution (∼ 5 μm), allowing the analysis of melt inclusions too small to be analysed by other micro-FTIR techniques, and the acquisition of high definition in situ images of the materials analysed. The technique is applied to the analysis of water species concentrations and distribution in silicic volcanic glasses from Sumisu Caldera and Torishima Volcano in the Izu-Bonin arc to test the application of imaging to geologic samples. Results obtained are found to be comparable to analyses by conventional micro-FTIR techniques, with similar precision, but greater spatial resolution. Groundmass glasses from Sumisu Caldera dacites contain 1.2–1.4 wt.% H 2 O and an obsidian sample from Torishima Volcano contains 0.2 wt.% H 2 O, consistent with water saturation at their respective pressures of eruption. Melt inclusions in honeycomb plagioclase from Sumisu Caldera have higher water contents (1.02–1.38 wt.% H 2 O) than inclusions from Torishima Volcano plagioclase (0.22–0.41 wt.% H 2 O). Despite evidence for many inclusions being trapped wholly within honeycomb plagioclase, low water contents similar to those of the groundmass glasses suggest that the inclusions underwent water loss by degassing and/or diffusion. Alternatively, if low water contents of the melt inclusions reflect the composition of the magma at the time of entrapment, then the magma can be constrained as having originated from a water-poor source. Despite the ambiguity in initial water contents of the magma, the anhydrous mineral assemblage of all Sumisu Caldera and Torishima silicic rocks indicates an origin from a water-poor source, consistent with models for partial melting of water-poor mafic lower-mid crust, rather than melting of wet lower-mid crust or differentiation from basaltic magmas. © 2006 Elsevier B.V. All rights reserved. Keywords: FTIR spectroscopic imaging; Izu–Bonin arc; crustal growth; glass water contents; honeycomb plagioclase; melt inclusions 1. Introduction Fourier Transform Infra-Red (FTIR) absorption spectroscopy is an analytical technique based on the frequency at which chemical bonds vibrate when subjected to electromagnetic radiation passed through (transmission mode), or reflected off (reflection mode), a subject of interest. As functional groups and polar bonds of elements (e.g. Si, O, H, C and N) absorb radiation at specific wavelengths, FTIR spectroscopy can be used to both qualitatively and quantitatively measure these elements. FTIR analyses of geologic materials, particu- Journal of Volcanology and Geothermal Research 156 (2006) 302 – 314 www.elsevier.com/locate/jvolgeores ⁎ Corresponding author. Tel.: +81 468 67 9631; fax: +81 468 67 9625. E-mail address: [email protected] (R. Wysoczanski). 0377-0273/$ - see front matter © 2006 Elsevier B.V. All rights reserved. doi:10.1016/j.jvolgeores.2006.03.024
-
Upload
hoangthien -
Category
Documents
-
view
218 -
download
0
Transcript of Spectroscopic FTIR imaging of water species in silicic ...Tani_JVolcGeotherm_2006... ·...
al Research 156 (2006) 302–314www.elsevier.com/locate/jvolgeores
Journal of Volcanology and Geotherm
Spectroscopic FTIR imaging of water species in silicic volcanicglasses and melt inclusions: An example from the Izu-Bonin arc
Richard Wysoczanski ⁎, Kenichiro Tani
Institute for Research on Earth Evolution, Japan Agency for Marine–Earth Science and Technology, 2–15 Natsushima-cho,Yokosuka, Kanagawa 237-0061, Japan
Received 8 April 2005; accepted 2 March 2006Available online 9 May 2006
Abstract
Recent advances in FTIR spectroscopic imaging allow images of elements or molecules such as water to be constructed on samplesover a large (sub mm) area. The imaging detector consists of 64×64 channels providing 4096 individual spectra simultaneouslycollected over a spectral range of 4000–900 cm−1. The wavelength range includes measurable peaks for water and carbon species,making it ideal for the analysis of volcanic glasses, particularly melt inclusions. Advantages of spectroscopic imaging include highspatial resolution (∼ 5 μm), allowing the analysis of melt inclusions too small to be analysed by other micro-FTIR techniques, and theacquisition of high definition in situ images of the materials analysed. The technique is applied to the analysis of water speciesconcentrations and distribution in silicic volcanic glasses from Sumisu Caldera and Torishima Volcano in the Izu-Bonin arc to test theapplication of imaging to geologic samples. Results obtained are found to be comparable to analyses by conventional micro-FTIRtechniques,with similar precision, but greater spatial resolution. Groundmass glasses fromSumisuCaldera dacites contain 1.2–1.4wt.%H2O and an obsidian sample from Torishima Volcano contains 0.2 wt.% H2O, consistent with water saturation at their respectivepressures of eruption. Melt inclusions in honeycomb plagioclase from Sumisu Caldera have higher water contents (1.02–1.38 wt.%H2O) than inclusions from Torishima Volcano plagioclase (0.22–0.41 wt.% H2O). Despite evidence for many inclusions being trappedwholly within honeycomb plagioclase, low water contents similar to those of the groundmass glasses suggest that the inclusionsunderwent water loss by degassing and/or diffusion. Alternatively, if lowwater contents of themelt inclusions reflect the composition ofthe magma at the time of entrapment, then the magma can be constrained as having originated from a water-poor source. Despite theambiguity in initial water contents of the magma, the anhydrous mineral assemblage of all Sumisu Caldera and Torishima silicic rocksindicates an origin from a water-poor source, consistent with models for partial melting of water-poor mafic lower-mid crust, rather thanmelting of wet lower-mid crust or differentiation from basaltic magmas.© 2006 Elsevier B.V. All rights reserved.
Keywords: FTIR spectroscopic imaging; Izu–Bonin arc; crustal growth; glass water contents; honeycomb plagioclase; melt inclusions
1. Introduction
Fourier Transform Infra-Red (FTIR) absorptionspectroscopy is an analytical technique based on the
⁎ Corresponding author. Tel.: +81 468 67 9631; fax: +81 468 679625.
E-mail address: [email protected] (R. Wysoczanski).
0377-0273/$ - see front matter © 2006 Elsevier B.V. All rights reserved.doi:10.1016/j.jvolgeores.2006.03.024
frequency at which chemical bonds vibrate whensubjected to electromagnetic radiation passed through(transmission mode), or reflected off (reflection mode), asubject of interest. As functional groups and polar bondsof elements (e.g. Si, O, H, C and N) absorb radiation atspecific wavelengths, FTIR spectroscopy can be used toboth qualitatively and quantitatively measure theseelements. FTIR analyses of geologic materials, particu-
303R. Wysoczanski, K. Tani / Journal of Volcanology and Geothermal Research 156 (2006) 302–314
larly natural and experimental glasses, minerals and meltinclusions, have been undertaken for many years (seeIhinger et al., 1994 for a review). An essential area ofresearch is the analysis of water in volcanic glasses fromsubduction zones, spreading ridges and hotspots, toexamine its critical role in magmatic processes and
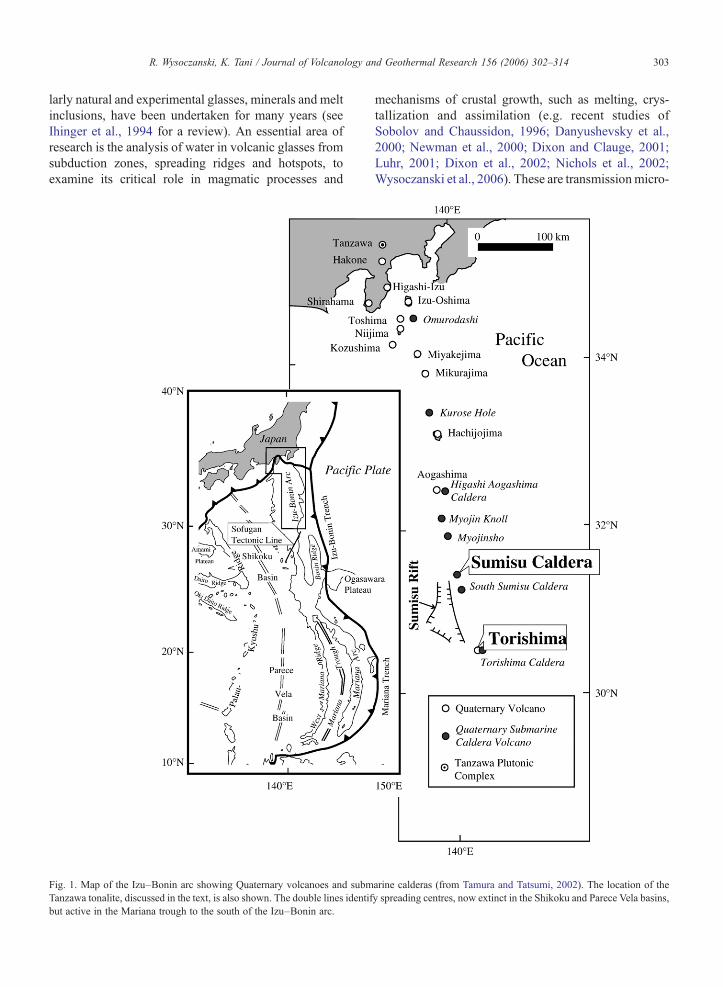
Fig. 1. Map of the Izu–Bonin arc showing Quaternary volcanoes and submTanzawa tonalite, discussed in the text, is also shown. The double lines identifbut active in the Mariana trough to the south of the Izu–Bonin arc.
mechanisms of crustal growth, such as melting, crys-tallization and assimilation (e.g. recent studies ofSobolov and Chaussidon, 1996; Danyushevsky et al.,2000; Newman et al., 2000; Dixon and Clauge, 2001;Luhr, 2001; Dixon et al., 2002; Nichols et al., 2002;Wysoczanski et al., 2006). These are transmissionmicro-
arine calderas (from Tamura and Tatsumi, 2002). The location of they spreading centres, now extinct in the Shikoku and Parece Vela basins,
304 R. Wysoczanski, K. Tani / Journal of Volcanology and Geothermal Research 156 (2006) 302–314
FTIR studies that utilise an attached microscope toanalyse small areas (typically b200 μm) of a sample. Theresult is a single high-resolution infra-red spectrum,providing an average water species content for the areaanalysed, with limited spatial resolution.
An important advance in FTIR spectroscopy in thepast decade has been the advent of spectroscopic ima-ging (e.g. Lewis et al., 1995), a technique that allows amap of an element or molecule of interest to be cons-tructed over a large (sub mm) area from multiple spectracollected by transmission or reflection mode. More re-cent developments by Varian Inc. allow optical maps of aband of interest to be constructed from 4096 simulta-neously collected high-resolution spectra, with a spatialresolution of just 5 μm. As well as improved spatialresolution, the simultaneous collection of spectra dis-tinguishes this technique from image maps, which are acomposite of individual spectra collected sequentially toform a large composite image.
An increasing number of studies have utilised thespectroscopic imaging technique, however, with theexception of one study on cherts from Kanto Mountain,Japan (Ito and Nakashima, 2002), these studies havelargely been restricted to the materials and biologicalsciences, and geologic materials have not been analysed.The objective of this study is to examine the applicationof spectroscopic imaging to volatile species analysis ofvolcanic materials. The technique and sample prepara-tion are described, and silicic volcanic rocks from theIzu–Bonin volcanic arc are analysed for water speciescontents, and the data compared with analyses acquiredusing conventional micro-FTIR data spectroscopy. Therelevance of the results to existing models of silicicmagma genesis and crustal growth for the Izu–Bonin arcis then discussed.
2. Models for crustal growth in the Izu–Bonin arcand sample description
The Izu–Bonin arc, which lies between latitudes of35°N and 30°N, contains a number of Quaternary islandvolcanoes and submarine silicic calderas (Nagaoka et al.,1991; Yuasa et al., 1991), such as Torishima Volcano andSumisu Caldera in the central Izu–Bonin arc. Thedominant composition of the Izu–Bonin arc was thoughtto be basaltic (Aramaki and Ui, 1978). Recent studies,however, have identified a number of rhyolitic submarinecalderas (e.g. Fiske et al., 2001) and the arc is nowconsidered bimodal in composition (Tamura and Tat-sumi, 2002). Seismic transects have identified a middlecrust (6 km/s P-wave velocity layer) up to 5 km thick(Takahashi et al., 1998), interpreted to be similar in
composition to the Tanzawa tonalite pluton accreted on toHonshu arc (Kawate and Arima, 1998). Over the lengthof the Izu–Bonin arc, the composition of the middle crustmay vary, and include more water-rich amphibolite, ordry, perhaps restitic, crust. (Fig. 1).
An origin for silicic magmas in this intra-oceanic arcsystem may be from fractionation of basaltic magmas(e.g. Vogel et al., 2004). More recently, partial melting ofwater-poor andesitic middle crust represented by theTanzawa pluton (Tamura and Tatsumi, 2002; Shukuno etal., 2006-this issue), or water-rich amphibolitic lowercrust (Nakajima andArima, 1998) have been proposed asthe source of Izu–Bonin silicic magmas. Determining thewater content of silicic rocks may help distinguish be-tween these models, as water content is dependent on theprocess of magma generation and source composition.Differentiation of basaltic magmas will result in water-rich silicic magmas. Partial melting of lower or middlecrust will generate silicic magmas with water contentsthat reflect the composition of the protolith: high and lowwater contents for magmas sourced from amphibolite anddry andesitic crust, respectively.
Twodacites fromSumisuCaldera and a non-vesiculatedobsidian from Torishima Volcano were selected for ana-lysis of water contents to compare the imaging-FTIRtechnique to the conventional micro-FTIR method, and toprovide important constraints on the genesis of silicicrocks in the Izu–Bonin arc. The Sumisu samples, 1391-R2and 1394-R2A, were collected at water depths of 923 and915 m, respectively, on separate dives by the mannedsubmersible Shinkai 2000 as part the R/V NatsushimaNT02-10 cruise. They consist of 90% groundmass and10% phenocrysts (75% plagioclase, with minor amountsof clinopyroxene, orthopyroxene and opaque minerals).The Torishima Volcano sample (TS27-48) was collectedfrom a subaerial tuff breccia. The sample consists ofrhyolitic glass and has a phenocryst assemblage of pla-gioclase, olivine, clinopyroxene, orthopyroxene and tita-nomagnetite. Plagioclase from all samples occurs as cleareuhedral plagioclase and as honeycomb plagioclase withresorbed and sieve textures. Importantly, the honeycombplagioclases contain abundant melt inclusions in theirinteriors, providing direct samples of the magma, andtherefore the magma water content, at the time they wereentrapped.
3. Analytical techniques
3.1. Sample preparation
To prepare a sample for transmission FTIR spectros-copy, the sides of the sample must be parallel and both
305R. Wysoczanski, K. Tani / Journal of Volcanology and Geothermal Research 156 (2006) 302–314
polished to allow the IR beam to pass through the sam-ple without scattering. A chip of each sample was cut asa thin section domino block and ground and polishedusing silicon carbide grit and 1 μm diamond paste toprovide a flat highly polished surface. The sample wasthen adhered to a glass slide, polished side down, usingcrystal bond epoxy. The exposed surface was groundand polished as for the previous side, before remov-ing the wafer from the glass slide by immersing it inacetone, which dissolves epoxy. Several further immer-sions in acetone were required to remove residual epoxyfrom the samples. The result was a thin (approximately20–50 μm thick) freestanding doubly polished waferfree of any epoxy or binding agent, and suitable formicro-FTIR analysis. One concern with thin wafers,such as the 22–26 μm Torishima wafer, is their sus-ceptibility to breakage. The thicker (40–50 μm) Sumisusample wafers analysed here, however, were more man-ageable, with only minor splintering of the wafers intosmaller pieces.
3.2. FTIR spectrometry
FTIR analyses were performed on a Varian FTSStingray 7000Micro Image Analyser spectrometer at theInstitute for Research on Earth Evolution (IFREE). Infra-Red spectra, which consisted of 512 scans at a resolutionof 4 cm−1, were collected using a water-cooled ceramicsource and a Ge-coated KBr beamsplitter. The beam path
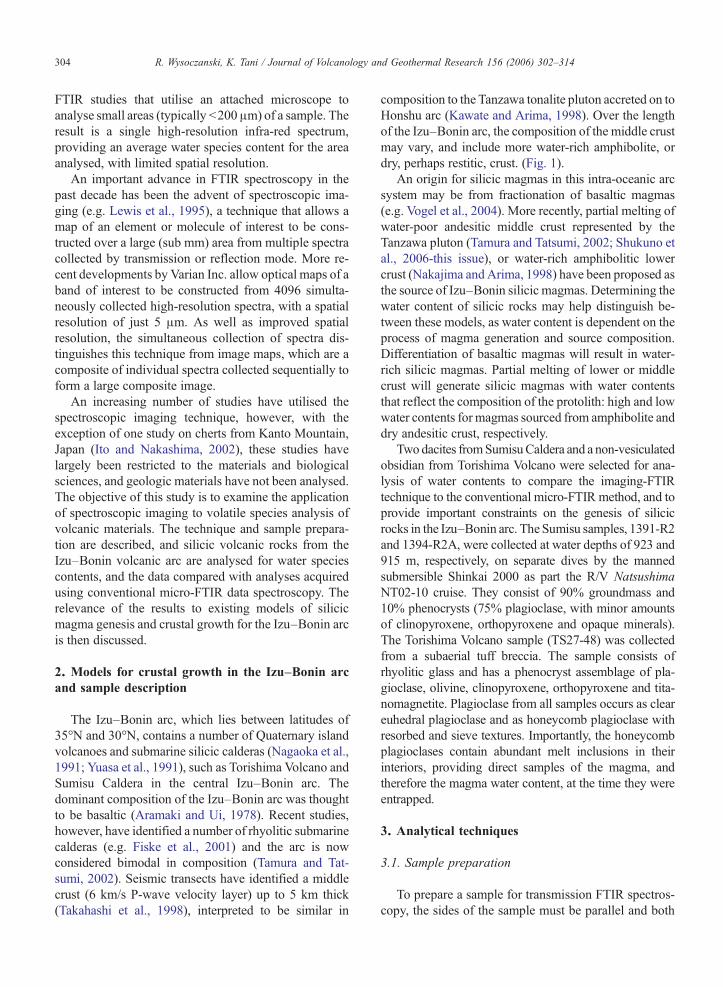
Fig. 2. Representative spectra of Sumisu Caldera glass and mineral phases. (Aand transmission mode. Reflection spectra are used to determine thicknessTransmission spectra acquired from individual channels of spectroscopic im1630 cm−1peak is difficult to determine, and can be selected as any of the daspectra. The baseline selected here, after King et al. (2002), is the thick dashextremes. The uncertainty in this baseline position can impart a significant e
was continuously purged with N2 gas to minimize theinterference of atmospheric water on the measured spec-tra. The sample was placed on a water-free KBr base forsupport, and the background scan and sample analyseswere taken through the KBr base under the same ana-lytical conditions.
Conventional micro-FTIR analyses (hereafter termed‘micro-FTIR’) using an attached UMA 600 microscopewere obtained over a wavelength range of v=7000–700 cm−1, with a liquid-nitrogen cooled HgCdTe2(MCT) detector and an aperture set at 20 μm square.This provided a strong intensity and detector response forthe mid-IR water absorbance bands.
Spectroscopic imaging (‘imaging-FTIR’) analyseswere performed using an attached Varian Inc. LancerFocal Plane Array (FPA) camera, which is an infraredphotovoltaic MCT array detector consisting of 64×64channels, providing 4096 individual spectra over thespectral range 4000–900 cm−1. Each channel has a spa-tial resolution of 5 μm, resulting in a single 350×350 μmimage. The FPA detector is highly sensitive with eachchannel equal to a single point MCT detector, as usedwith micro-FTIR analyses. Each 512-scan analysis tookapproximately 12 min to complete. With every analysis,some channels become saturated due to electronic diffi-culties. The number of these ‘bad pixels’ is typically 6–8;b0.2% of all channels. The noise level of IR spectra isapproximately 0.2% transmission. However, this errorcan be higher for water absorption peaks due to
) Micro-FTIR spectra of groundmass glass acquired in both reflectionof the sample from the spacing of interference patterns (see text). (B)ages (spatial resolution of 5 μm). The position of the baseline for theshed lines shown on this peak on melt inclusion and groundmass glassed line shown on the melt inclusion spectra, intermediate to the otherrror on molecular water determinations.
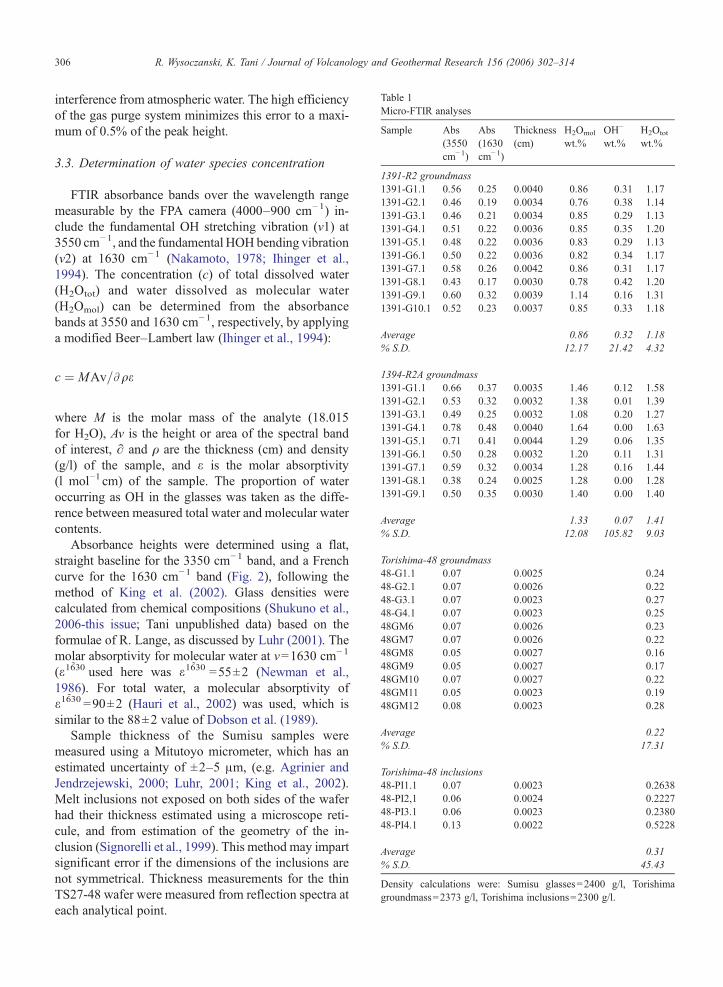
Table 1Micro-FTIR analyses
Sample Abs(3550cm−1)
Abs(1630cm−1)
Thickness(cm)
H2Omol
wt.%OH−
wt.%H2Otot
wt.%
1391-R2 groundmass1391-G1.1 0.56 0.25 0.0040 0.86 0.31 1.171391-G2.1 0.46 0.19 0.0034 0.76 0.38 1.141391-G3.1 0.46 0.21 0.0034 0.85 0.29 1.131391-G4.1 0.51 0.22 0.0036 0.85 0.35 1.201391-G5.1 0.48 0.22 0.0036 0.83 0.29 1.131391-G6.1 0.50 0.22 0.0036 0.82 0.34 1.171391-G7.1 0.58 0.26 0.0042 0.86 0.31 1.171391-G8.1 0.43 0.17 0.0030 0.78 0.42 1.201391-G9.1 0.60 0.32 0.0039 1.14 0.16 1.311391-G10.1 0.52 0.23 0.0037 0.85 0.33 1.18
Average 0.86 0.32 1.18% S.D. 12.17 21.42 4.32
1394-R2A groundmass1391-G1.1 0.66 0.37 0.0035 1.46 0.12 1.581391-G2.1 0.53 0.32 0.0032 1.38 0.01 1.391391-G3.1 0.49 0.25 0.0032 1.08 0.20 1.271391-G4.1 0.78 0.48 0.0040 1.64 0.00 1.631391-G5.1 0.71 0.41 0.0044 1.29 0.06 1.351391-G6.1 0.50 0.28 0.0032 1.20 0.11 1.311391-G7.1 0.59 0.32 0.0034 1.28 0.16 1.441391-G8.1 0.38 0.24 0.0025 1.28 0.00 1.281391-G9.1 0.50 0.35 0.0030 1.40 0.00 1.40
Average 1.33 0.07 1.41% S.D. 12.08 105.82 9.03
Torishima-48 groundmass48-G1.1 0.07 0.0025 0.2448-G2.1 0.07 0.0026 0.2248-G3.1 0.07 0.0023 0.2748-G4.1 0.07 0.0023 0.2548GM6 0.07 0.0026 0.2348GM7 0.07 0.0026 0.2248GM8 0.05 0.0027 0.1648GM9 0.05 0.0027 0.1748GM10 0.07 0.0027 0.2248GM11 0.05 0.0023 0.1948GM12 0.08 0.0023 0.28
Average 0.22% S.D. 17.31
Torishima-48 inclusions48-PI1.1 0.07 0.0023 0.263848-PI2,1 0.06 0.0024 0.222748-PI3.1 0.06 0.0023 0.238048-PI4.1 0.13 0.0022 0.5228
Average 0.31% S.D. 45.43
Density calculations were: Sumisu glasses=2400 g/l, Torishimagroundmass=2373 g/l, Torishima inclusions=2300 g/l.
306 R. Wysoczanski, K. Tani / Journal of Volcanology and Geothermal Research 156 (2006) 302–314
interference from atmospheric water. The high efficiencyof the gas purge system minimizes this error to a maxi-mum of 0.5% of the peak height.
3.3. Determination of water species concentration
FTIR absorbance bands over the wavelength rangemeasurable by the FPA camera (4000–900 cm−1) in-clude the fundamental OH stretching vibration (v1) at3550 cm−1, and the fundamental HOH bending vibration(v2) at 1630 cm−1 (Nakamoto, 1978; Ihinger et al.,1994). The concentration (c) of total dissolved water(H2Otot) and water dissolved as molecular water(H2Omol) can be determined from the absorbancebands at 3550 and 1630 cm−1, respectively, by applyinga modified Beer–Lambert law (Ihinger et al., 1994):
c ¼ MAv=Aqe
where M is the molar mass of the analyte (18.015for H2O), Av is the height or area of the spectral bandof interest, ∂ and ρ are the thickness (cm) and density(g/l) of the sample, and ε is the molar absorptivity(l mol−1 cm) of the sample. The proportion of wateroccurring as OH in the glasses was taken as the diffe-rence between measured total water and molecular watercontents.
Absorbance heights were determined using a flat,straight baseline for the 3350 cm−1 band, and a Frenchcurve for the 1630 cm−1 band (Fig. 2), following themethod of King et al. (2002). Glass densities werecalculated from chemical compositions (Shukuno et al.,2006-this issue; Tani unpublished data) based on theformulae of R. Lange, as discussed by Luhr (2001). Themolar absorptivity for molecular water at v=1630 cm−1
(ε1630˜
used here was ε1630˜
=55±2 (Newman et al.,1986). For total water, a molecular absorptivity ofε1630
˜=90±2 (Hauri et al., 2002) was used, which is
similar to the 88±2 value of Dobson et al. (1989).Sample thickness of the Sumisu samples were
measured using a Mitutoyo micrometer, which has anestimated uncertainty of ±2–5 μm, (e.g. Agrinier andJendrzejewski, 2000; Luhr, 2001; King et al., 2002).Melt inclusions not exposed on both sides of the waferhad their thickness estimated using a microscope reti-cule, and from estimation of the geometry of the in-clusion (Signorelli et al., 1999). This method may impartsignificant error if the dimensions of the inclusions arenot symmetrical. Thickness measurements for the thinTS27-48 wafer were measured from reflection spectra ateach analytical point.
307R. Wysoczanski, K. Tani / Journal of Volcanology and Geothermal Research 156 (2006) 302–314
3.4. Sample thickness measurements from reflectionspectra
Interference fringes form on reflection spectra ofsamples that have parallel surfaces, such as the doublypolished wafers studied here. Nishikida et al. (1996)noted, from a study of a thin silica film (3.5 μm) on athick silica wafer, that the wavelength of the interferencefringe pattern is directly proportional to the thicknessand refractive index of the sample. Thus, thicknesscorresponds to the number of waves over any wave-number interval, in the relationship:
A ¼ m=2nðv1−v2Þ
wherem is the number ofwaves in a selectedwavenumberrange, n= refractive index of the sample, and v1 and v2 arethe highest and lowest wavenumbers over the selectedinterval. The wavelength of the interference pattern does,however, increase at higher wavenumbers, but measure-ments made near v=2000 cm−1were found to be withinerror of the micrometer measurements (Fig. 2A).
There are several advantages to using reflection spec-tra to determine thickness measurements over microm-eter measurements. First, the method is non-destructivewhereas micrometer needles may break or crush thesample. Second, precision is high, as thickness is depen-dant on the wavenumber position, which is known tobb1%, compared to substantial errors on thin samplesmeasured by micrometer (e.g. a 2 μm uncertainty on theapproximately 25 μm TS27-48 wafer results in an 8%error!). Third, reflection spectra measurements can bemade immediately prior to, or after, transmission mea-surements used for analyte concentration determination.This allows the exact analytical area to be analysed,whereas micrometer nibs are difficult to place accurately,particularly on wafers with non-uniform thickness.
3.5. Errors for micro-FTIR and imaging-FTIR analysis
The error on analyte concentrations determined bymicro- and imaging-FTIR analysis includes errorspropagated from all variables of the Beer–Lambertlaw. For total water content, this was estimated at ± 10%,which is similar to previous studies (e.g. Dixon et al.,1988; Dixon et al., 1995; Macpherson et al., 1999;Agrinier and Jendrzejewski, 2000; Danyushevsky et al.,2000; Wysoczanski et al., 2006). For molecular watercontents, the error may be significantly higher as somemeasured peak heights were small (only just detectable),and the position of the baseline for the 1630 cm−1 band(Fig. 2) is poorly constrained (King et al., 2002).
4. Results
Water species concentrations were measured bymicro-FTIR in the centre of small (10–30 μm) patchesof glass in the groundmass (Table 1). With the exceptionof 4 plagioclase-hosted melt inclusions in TS27-48, meltinclusions could not be analysed by micro-FTIR due totheir small size. Groundmass glasses and melt inclusionswere also analysed by imaging-FTIR to produce 24spectrographic images, constructed from absorbancebands of total and molecular water (e.g. Fig. 3), and todetermine water concentrations (Table 2). As absor-bance is proportionally dependant to molar absorptivity,thickness and concentration, the intensity of the imagesreflects a combination of these variables. For homog-enous substances of similar thickness, such as rhyoliticglasses analysed here, absorbance intensity will directlyreflect differences in analyte concentration.
For the TS27-48 images, which contain large areas ofgroundmass glass, peak heights of the total water bandwere extracted from all 4096 spectra of the image, andsubjected to a Chi-square test to determine the meanpeak height of the total water band. Extracting peakheights for all spectra at any given absorbance band canbe performed quickly and efficiently utilising spectra-manipulation software. The use of a Chi-squarestatistical test to determine mean values of a large dataset is routinely used in Ion Microprobe dating of zircon(e.g. Sircombe, 2004; Wysoczanski and Allibone,2004), and provides a weighted mean of the data at a95% confidence level. This method utilises all of thedata acquired in an image, as opposed to simply selec-ting an individual spectrum from an image that is con-sidered to be representative of a sample.
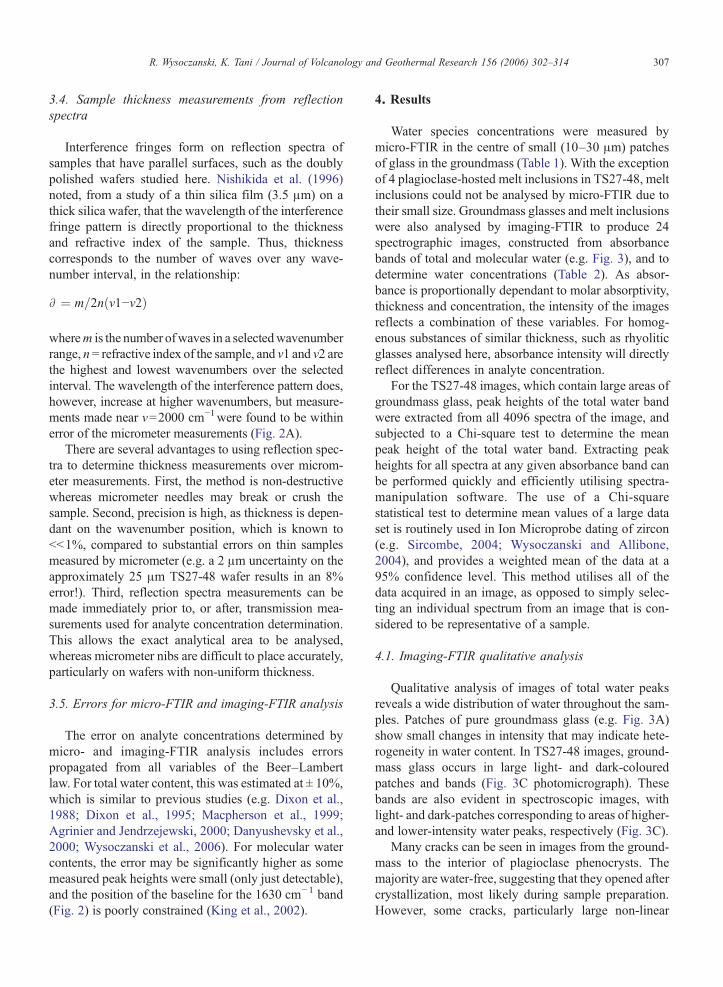
4.1. Imaging-FTIR qualitative analysis
Qualitative analysis of images of total water peaksreveals a wide distribution of water throughout the sam-ples. Patches of pure groundmass glass (e.g. Fig. 3A)show small changes in intensity that may indicate hete-rogeneity in water content. In TS27-48 images, ground-mass glass occurs in large light- and dark-colouredpatches and bands (Fig. 3C photomicrograph). Thesebands are also evident in spectroscopic images, withlight- and dark-patches corresponding to areas of higher-and lower-intensity water peaks, respectively (Fig. 3C).
Many cracks can be seen in images from the ground-mass to the interior of plagioclase phenocrysts. Themajority are water-free, suggesting that they opened aftercrystallization, most likely during sample preparation.However, some cracks, particularly large non-linear
308 R. Wysoczanski, K. Tani / Journal of Volcanology and Geothermal Research 156 (2006) 302–314
309R. Wysoczanski, K. Tani / Journal of Volcanology and Geothermal Research 156 (2006) 302–314
cracks, do contain traces of water (Fig. 3A). Water-bearing fractures also occur parallel and perpendicular toplagioclase cleavage planes. These connect long elon-gate melt inclusions, resulting in an open system networkof inclusions and fractures, which in some cases intersectfractures extending from the groundmass to the edge ofthe phenocryst (Fig. 3A). By contrast, many smaller,spherical melt inclusions in resorbed honeycombplagioclase do not have any apparent connection toother inclusions or to the groundmass (Fig. 3B). Manymelt inclusions also contain vapour bubbles, formedfrom re-equilibration of the melt to lower pressures onthe ascent of the magma. The presence of bubbles in theinclusions suggests that the inclusions remained closedsince bubble formation, as the bubbles would haveescaped open inclusions. FTIR imaging and analysis ofindividual spectra from the bubbles indicate that watercontents of the bubbles are not noticeably different toareas of pure glass.
4.2. Water species concentrations and comparisonbetween imaging-FTIR and micro-FTIR analysis
Total water contents of Sumisu groundmass glasses,determined by imaging-FTIR, range from 1.12–1.33 wt.% H2Otot (average 1.24 wt.%) in sample 1391-R2, and1.25–1.61 wt.% H2Otot (average 1.44 wt.%) in sample1394-R2A (Table 2, Fig. 4). Total water contents ofTS27-48 groundmass glasses range from 0.17–0.26 wt.% H2Otot (average 0.20 wt.%). Water contents deter-mined by micro-FTIR average 1.18, 1.41 and 0.22 wt.%H2Otot for samples 1391-R2, 1394-R2A and TS27-48,respectively (Table 1). These values are within analyticaluncertainty of the imaging-FTIR analyses (Fig. 4).
Sumisu groundmass glasses have total water contentshigher than expected for melts solidifying at magmatictemperatures (900–1000 °C; Shukuno et al., 2006-thisissue) and their pressure of eruption (Fig. 5). However, thesolubility of water in silicic melts is inversely proportionalto temperature (Yamashita, 1999), and water contents ofthe glasses are consistent with temperatures of 700–800 °C for sample 1391-R2, and 600–700 °C for 1394-R2A (with two exceptions at 500–550 °C) at their
Fig. 3. Representative spectroscopic images of the total water absorbanceintensity and height in 3-D images reflects the height of the water peak and noof sample and molar absorptivity. Photomicrographs at top left of each imagpixels of high intensity resulting from saturated signals in individual FPA chapatches of glass in microcrystalline groundmass and a large plagioclase pfractures. (B) Resorbed honeycomb plagioclase phenocryst from sample Sumsystem (connected) and others appear closed (isolated inclusions). (C) Torishirich band at top left, which is residual epoxy not dissolved from a fracture of thslightly higher (light coloured glass in photomicrograph) and lower water co
eruption pressure, using current water solubility models(Newman and Lowenstern, 2002) (Fig. 5). The low totalwater contents measured in TS27-48 groundmass glassesare consistent with eruption at or near atmosphericpressure (Newman and Lowenstern, 2002).
Molecular water is the dominant water species inSumisu groundmass glasses (Tables 1 and 2). Imaging-FTIR andmicro-FTIR analyses indicate approx. 65–75%of water in sample 1391-R2 is H2Omol. The proportion ofwater species in sample 1394-R2A differs between thetechniques, with imaging-FTIR indicating an average of74% of water is H2Omol, whereas micro-FTIR indicatesthat nearly all water is H2Omol. The discrepancy may bedue to the large errors associated with measuring the1630 cm−1 band. Despite the large analytical uncertainty,the ratio of H2Omol to OH− is significantly higher thanpredicted by speciation models for rhyolitic melts atmagmatic temperatures (approximately 20% of H2Omol;Newman and Lowenstern, 2002). High proportions ofH2Omol are consistent with slow cooling,which drives thewater solubility reaction (H2Omol+O=N 2OH−) to theleft, resulting in a substantially higher H2Omol:OH
− ratio(Zhang et al., 1997). Rhyolitic magmas cooling rates havebeen documented to be as slow as 0.001 K/min, allowingwater contents to equilibrate to the glass transitiontemperature (Gottsmann and Dingwell, 2002), estimatedat 600–800 °C for the Sumisu groundmass glasses(Fig. 5).Water speciation could not be determined forsample TS27-48 due to low water contents resulting inlow detection limits for molecular water.
Imaging-FTIR analyses of melt inclusions indicatesimilar average total water contents of 1.18 wt.% H2Otot
in 1391-R2 and 1.24 wt.% H2Otot in 1394-R2A, with atotal range of 1.02–1.38 wt.% H2Otot. This is withinerror of the Sumisu 1391-R2 groundmass glasses, butlower than Sumisu 1394-R2A groundmass glasses. Theproportion of water species in inclusions is indistin-guishable to that of the groundmass glasses, with highmolecular water contents suggesting slow cooling.
Melt inclusions in plagioclase from TS27-48 have awide range in total water content (0.22–0.41 wt.%H2Otot) that is significantly higher than groundmass glasswater contents (0.18–0.26 wt.% H2Otot). Four melt
height (v=3550 cm−1) from Sumisu and Torishima samples. Colourt water content, as peak height is dependant on water content, thicknesse show the area analysed. Scale is 350 μm across each image. Isolatednnels occur. (A) Sample Sumisu 1394-R2A, showing small (b20 μm)henocryst with elongate melt inclusions and parallel and orthogonalisu 1391-R2, with multiple melt inclusions, some of which are open
ma-48 sample glass with small plagioclase phenocryst. Note the water-e sample wafer during sample processing. Glass occurs as patches withntents (dark coloured glass).
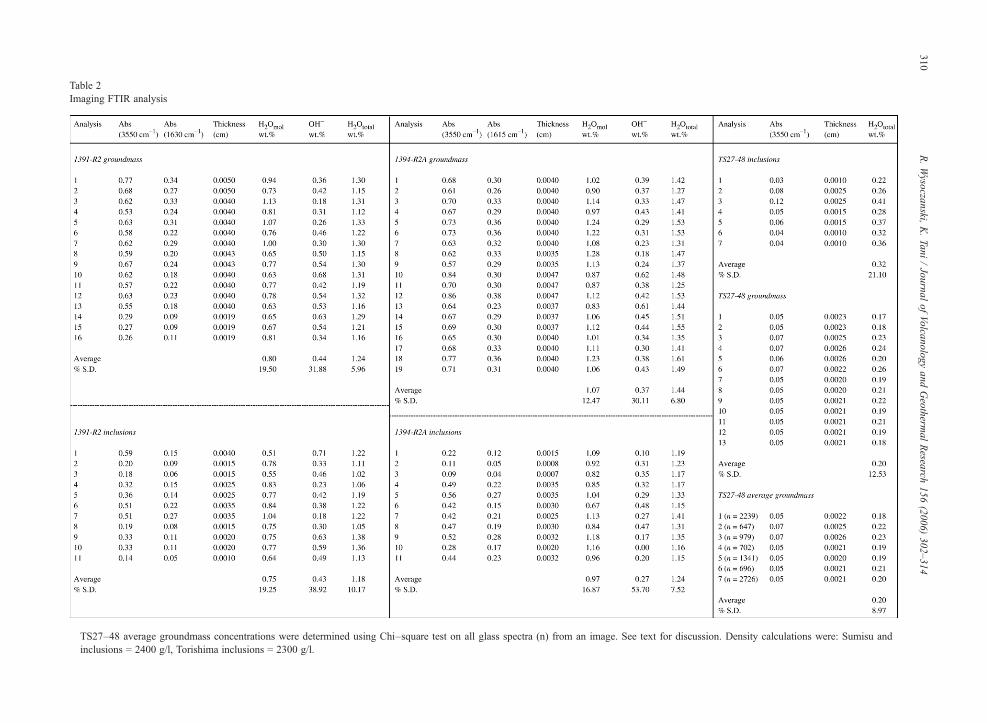
Table 2Imaging FTIR analysis
TS27–48 average groundmass concentrations were determined using Chi–square test on all glass spectra (n) from an image. See text for discussion. Density calculations were: Sumisu andinclusions = 2400 g/l, Torishima inclusions = 2300 g/l.
310R.Wysoczanski,
K.Tani
/Journal
ofVolcanology
andGeotherm
alResearch
156(2006)
302–314
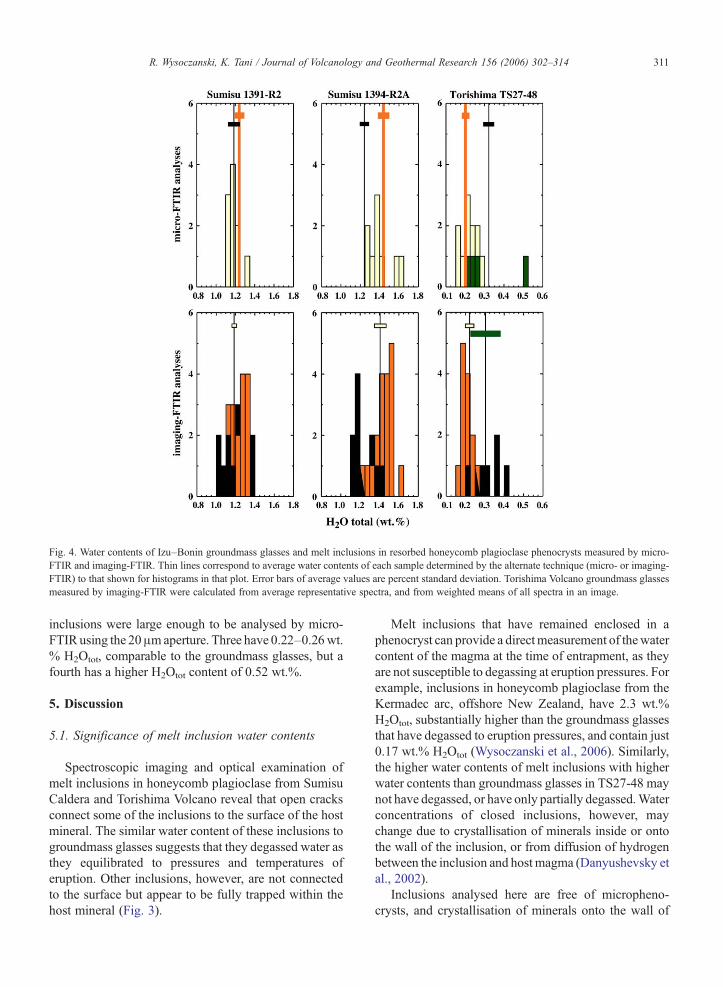
Fig. 4. Water contents of Izu–Bonin groundmass glasses and melt inclusions in resorbed honeycomb plagioclase phenocrysts measured by micro-FTIR and imaging-FTIR. Thin lines correspond to average water contents of each sample determined by the alternate technique (micro- or imaging-FTIR) to that shown for histograms in that plot. Error bars of average values are percent standard deviation. Torishima Volcano groundmass glassesmeasured by imaging-FTIR were calculated from average representative spectra, and from weighted means of all spectra in an image.
311R. Wysoczanski, K. Tani / Journal of Volcanology and Geothermal Research 156 (2006) 302–314
inclusions were large enough to be analysed by micro-FTIRusing the 20μmaperture. Three have 0.22–0.26wt.% H2Otot, comparable to the groundmass glasses, but afourth has a higher H2Otot content of 0.52 wt.%.
5. Discussion
5.1. Significance of melt inclusion water contents
Spectroscopic imaging and optical examination ofmelt inclusions in honeycomb plagioclase from SumisuCaldera and Torishima Volcano reveal that open cracksconnect some of the inclusions to the surface of the hostmineral. The similar water content of these inclusions togroundmass glasses suggests that they degassed water asthey equilibrated to pressures and temperatures oferuption. Other inclusions, however, are not connectedto the surface but appear to be fully trapped within thehost mineral (Fig. 3).
Melt inclusions that have remained enclosed in aphenocryst can provide a directmeasurement of thewatercontent of the magma at the time of entrapment, as theyare not susceptible to degassing at eruption pressures. Forexample, inclusions in honeycomb plagioclase from theKermadec arc, offshore New Zealand, have 2.3 wt.%H2Otot, substantially higher than the groundmass glassesthat have degassed to eruption pressures, and contain just0.17 wt.% H2Otot (Wysoczanski et al., 2006). Similarly,the higher water contents of melt inclusions with higherwater contents than groundmass glasses in TS27-48 maynot have degassed, or have only partially degassed.Waterconcentrations of closed inclusions, however, maychange due to crystallisation of minerals inside or ontothe wall of the inclusion, or from diffusion of hydrogenbetween the inclusion and host magma (Danyushevsky etal., 2002).
Inclusions analysed here are free of micropheno-crysts, and crystallisation of minerals onto the wall of

Fig. 5. Water solubility plot (Newman and Lowenstern, 2002) of felsic glasses at variable temperature and pressure. Groundmass glass compositionsof Sumisu Caldera samples are plotted as points against the pressure of their depth of collection. Total water contents of inclusions from all samplesare shown as horizontal fields, as their pressure of entrapment is uncertain.
312 R. Wysoczanski, K. Tani / Journal of Volcanology and Geothermal Research 156 (2006) 302–314
the phenocryst is not visible. Diffusion of hydrogen ismore difficult to determine. The slow cooling of theinclusions may have resulted in lower hydrogen fugacityin the inclusions relative to the host magma, resulting indiffusion of hydrogen into the inclusion. Conversely,loss of hydrogen from the inclusion may also haveoccurred, although the absence of magnetite dust in theinclusions suggests that any hydrogen loss was minimal(Danyushevsky et al., 2002).
Despite evidence that these inclusions have remainedclosed, their similar water contents to both open inclusionsand groundmass glasses suggests that they have alsoequilibrated to eruption pressures, through diffusion ordegassing of water. One simple test to determine if theyhave lost water species would be to analyse samplescollected at greater water depths. If the inclusions in thosesamples have degassed, then their water contents willhave equilibrated to eruptive temperatures and pressures.However, if their water contents are similar to that ofclosed inclusions analysed here, then it is likely that theyhave not degassed with eruption onto the seafloor.
5.2. Possible implications for models of silicic crustalgrowth
Honeycomb plagioclase in arc magmas can form as askeletal texture with rapid growth during supercooling,or due to partial dissolution of plagioclase when it is indisequilibrium with the host magma (Kawamoto, 1992).
The rhyolitic composition of the Izu–Bonin melt in-clusions in honeycomb plagioclase with high-An cores(Shukuno et al., 2006-this issue) suggests that theyformed by partial dissolution of plagioclase that hadinitially crystallised from a mafic magma. This isconsistent with models of partial melting of andesiticor basaltic crust producing a rhyolitic magma (Tamuraand Tatsumi, 2002; Shukuno et al., 2006-this issue), orof plagioclase derived from basaltic or andesiticmagmas being entrained in younger silicic magmas ofuncertain origin. The water contents of the meltinclusions at the time of entrapment will reflect thecomposition of the source of the silicic magmas.
The pre-eruptive water contents of the silicic magmascan only be inferred to have been equal to or greater thanconcentrations measured in the inclusions and ground-mass glasses, as it is likely that they have lost water bydegassing and/or diffusion. However, the anhydrousmineral assemblage of all silicic lavas from the Izu–Bonin arc suggests a relatively dry source. This is moreconsistent with partial melting of a dry or damp crust,than with partial melting of water-rich crust or dif-ferentiation of basaltic magma, as the silicic products ofthese processes would have high water contents, andcrystallise hydrous minerals as they evolve. Furtheranalysis of melt inclusions in silicic rocks from the Izu–Bonin arc, particularly those collected at greater depths,will help further elucidate the pre-eruptive water contentof the magmas, and the composition of their source.
313R. Wysoczanski, K. Tani / Journal of Volcanology and Geothermal Research 156 (2006) 302–314
5.3. Application of imaging to studies of volcanicmaterials
In addition to the application shown here, spectro-scopic imaging has the potential for investigating manyother volcanic processes and products. For example,experiments to examine diffusion, particularly in homo-genising melt inclusions using heating stages (Danyush-evsky et al., 2002) are an ideal application of thetechnique as imaging can capture near-instantaneoustime-series images of the homogenisation process, inaddition to providing both qualitative and quantitativedata. Another similar application would be tracing theflow of fluids in serpentinites and eclogites from thedescending slab, which is an important process in refer-tilisation of the mantle, partial melting and subsequentgrowth of silicic crust (e.g. Tatsumi and Eggins, 1995;Hattori and Guillot, 2003; Wysoczanski et al., 2006).Imaging-FTIR can also be used to determine modalpopulations of groundmass phases (Fig. 3) from sta-tistical treatment of imaging spectra. For example, theproportion of groundmass glass can be estimated fromthe proportion of spectra with characteristics of glass.Hydrous and anhydrous mineral phases can be estimatedfrom remaining spectra that contain or do not containwater, respectively. Vesicle content can also be deter-mined, simply from the number of spectra that do nothave silica absorbance bands.
6. Conclusions
Spectroscopic FTIR-imaging, applied to silicic vol-canic glasses from the Izu–Bonin arc, provides compa-rable water species concentration measurements toconventional micro-FTIR analysis, at a similar precision.In addition, it has the advantage of higher spatial reso-lution (5 μm) allowing small-scale heterogeneities inwater content to be distinguished and inclusions that aretoo small for micro-FTIR analysis to be analysed. Fur-thermore, it can provide a visual image of the distributionof water species in the sample. Reflection spectra,obtained by either imaging- or micro-FTIR analysis canprovide high-precision thickness measurements of asample, and is a reliable alternative to micrometer mea-surements, especially for thin samples (b50 μm) whereusing a micrometer may impart significant error onanalyses, and damage the sample.
Groundmass glasses in silicic lavas from SumisuCaldera and Torishima Volcano contain water contentsconsistent with equilibration to their pressures oferuption. Water contents of melt inclusions in SumisuCaldera plagioclase have similar water contents to the
groundmasses glasses (b1.5 wt.% H2Otot), suggestingthat they may also have lost water through degassingand/or diffusion. Torishima Volcano melt inclusionshave water contents (up to 0.5 wt.% H2Otot) that arehigher than groundmass glasses (0.2 wt.% H2Otot).Degassing and/or diffusion of water from theseinclusions cannot be discounted. Although the pre-eruptive water content of the silicic magmas could notbe determined from this study, the anhydrous mineralassemblage of all silicic lavas from the Izu–Bonin arcsuggests a source with low water content, consistentwith partial melting models of dry, or damp, mid-lower crust.
Acknowledgements
We thank the captain and the crew of the researchvessel R.V. Natsushima and the manned submersibleShinkai2000, from which the samples were collectedfrom Sumsiu Caldera. We also thank A.R.L Nichols andS. Yamashita for their helpful and constructive reviews,and H. Shukuno, Y. Tamura and Y. Tatsumi for theaccess to the data and/or discussions.
References
Agrinier, P., Jendrzejewski, N., 2000. Overcoming problems of densityand thickness measurements in FTIR volatile determinations: aspectroscopic approach. Contrib. Mineral. Petrol. 139, 265–272.
Aramaki, S., Ui, T., 1978. Major element frequency distribution of theJapanese Quaternary volcanic rocks. Bull. Volcanol. 41, 390–407.
Danyushevsky, L.V., Eggins, S.M., Falloon, T.M., Christie, D.M.,2000. H2O abundance in depleted to moderately enriched mid-ocean ridge magmas; Part I: incompatible behaviour, implicationsfor mantle storage, and origin of regional variations. J. Petrol. 41,1329–1364.
Danyushevsky, L.V., McNeill, A.W., Sobolev, A.V., 2002. Experi-mental and petrological studies of melt inclusions in phenocrystsfrom mantle-derived magmas: an overview of techniques,advantages and complications. Chem. Geol. 183, 5–24.
Dixon, J.E., Clauge, D.A., 2001. Volatiles in basaltic glasses fromLoihi Seamount, Hawaii. J. Petrol. 42, 627–654.
Dixon, J.E., Stolper, E.M., Delaney, J.R., 1988. Infrared spectroscopicmeasurements of CO2 and H2O glasses in the Juan de Fuca Ridgebasaltic glasses. Earth Planet. Sci. Lett. 90, 87–104.
Dixon, J.E., Stolper, E.M., Holloway, J.R., 1995. An experimentalstudy of water and carbon dioxide solubilities in mid-ocean ridgebasaltic liquids. Part I: calibration and solubility models. J. Petrol.36, 1607–1631.
Dixon, J.E., Leist, L., Langmuir, C.H., Schilling, J.-G., 2002. Recycleddehydrated lithosphere observed in plume-influenced mid-ocean-ridge basalt. Nature 420, 385–398.
Dobson, P.F., Epstein, S., Stolper, E.M., 1989. Hydrogen isotope frac-tionation between coexisting vapor and silicate glasses and melts atlow pressure. Geochim. Cosmochim. Acta 53, 2723–2730.
Fiske, R.S., Naka, J., Iizasa, K., Yuasa, M., Klaus, A., 2001. Submarinesilicic caldera at the front of the Izu–Bonin arc, Japan: voluminous
314 R. Wysoczanski, K. Tani / Journal of Volcanology and Geothermal Research 156 (2006) 302–314
seafloor eruptions of rhyolite pumice. Geol. Soc. Am. Bull. 113,813–824.
Gottsmann, J., Dingwell, D.B., 2002. The thermal history of a splatter-fed lava flow: the 8-ka pantellerite flow of Mayor Island, NewZealand. Bull. Volcanol. 64, 410–422.
Hattori, K.H., Guillot, S., 2003. Volcanic fronts form as a consequenceof serpentinite dehydration in the forearc mantle wedge. Geology31, 525–528.
Hauri, E.,Wang, J., Dixon, J.E., King, P.L., Mandeville, C., Newman, S.,2002. SIMS analyses of volatiles in volcanic glasses. 1: calibration,matrix effects and comparisons with FTIR. Chem. Geol. 183,99–114.
Ihinger, P.D., Hervig, R.L., McMillan, P.F., 1994. Applications ofexperimental results to C–O–H species in natural melts. Mineral.Soc. Am. Rev. Min. 30, 67–121.
Ito, Y., Nakashima, S., 2002. Water distribution in low-grade siliceousmetamorphic rocks bymicro-FTIR and its relation to grain size: a casefrom the Kanto Mountain region, Japan. Chem. Geol. 189, 1–18.
Kawamoto, T., 1992. Dusty and honeycomb plagioclase: indicators ofprocesses in the Uchino stratified magma chamber, Izu Peninsula,Japan. J. Volcanol. Geotherm. Res. 49, 191–208.
Kawate, S., Arima, M., 1998. Petrogenesis of the Tanzawa plutoniccomplex, central Japan: exposed felsic middle crust of the Izu–Bonin–Mariana arc. Isl. Arc 7, 342–358.
King, P.L., Vennemann, T.W., Holloway, J.R., Hervig, R.L., Low-enstern, J.B., Forneris, J.F., 2002. Analytical techniques forvolatiles: a case study using intermediate (andesitic) glasses. Am.Mineral. 87, 1077–1089.
Lewis, E.N., Treado, P.J., Reeder, R.C., Story, G.M., Dowrey, A.E.,Marcott, C., Levin, I.W., 1995. Fourier Transform SpectroscopicImaging using an Infrared Focal-Plane Array Detector. Anal.Chem. 67 (19), 3377–3381.
Luhr, J.F., 2001. Glass inclusions andmelt volatile contents at ParícutinVolcano, México. Contrib. Mineral. Petrol. 142, 261–283.
Macpherson, C.G.,Hilton,D.R.,Newman, S.,Mattey,D.P., 1999.CO2,13C/12C and H2O variability in natural basaltic glasses: a studycomparing stepped heating and FTIR spectroscopic techniques.Geochim. Cosmochim. Acta 63, 1805–1813.
Nagaoka, D., Okino, K., Kato, S., 1991. Landforms of submarinevolcanoes in central part of the Izu–Ogasawara arc, by multi-beamsounding system. Rep. Hydrogr. Res. 27, 145–172.
Nakajima, K., Arima, M., 1998. Melting experiments on hydrous low-K tholeiite: implications for the genesis of tonalitic crust in theIzu–Bonin–Mariana arc. Isl. Arc 7, 359–373.
Nakamoto, K., 1978. Infrared and Raman Spectra of Inorganic andCoordination Compounds. John Wiley, New York. 448p.
Newman, S., Lowenstern, J.B., 2002. VolatileCalc: a silicate melt-H2O–CO2 solution model written in Visual Basic for Excel.Comput. Geosci. 28, 597–604.
Newman, S., Stolper, E.M., Epstein, S., 1986. Measurement of waterin rhyolitic glasses-calibration of an infrared spectroscopictechnique. Am. Mineral. 71, 1527–1541.
Newman, S., Stolper, E., Stern, R., 2000. H2O and CO2 in magmasfrom the Mariana arc and back arc system. Geochem. Geophys.Geosys. 1 (5). doi:10.1029/1999GC000027.
Nichols, A.R.L., Carroll, M.R., Hoskuldsson, A., 2002. Is the Icelandhot spot also wet? Evidence from the water contents of undegassedsubmarine and subglacial pillow basalts. Earth Planet. Sci. Lett.202, 77–87.
Nishikida, K., Nishio, E., Hannah, R.W., 1996. Selected Applicationsof Modern FT-IR Techniques. Gordon and Breach. 200 pp.
Shukuno, H., Tamura, Y., Tani, K., Chang, Q., Suzuki, T., Fiske, R.S.,2006. Origin of silicic magmas and the compositional gap atSumisu submarine caldera, Izu–Bonin arc, Japan. J. Volcanol.Geotherm. Res. 156, 187–216. doi:10.1016/j.jvolgeores.2006.03.018.
Signorelli, S., Vaggelli, G., Romano, C., 1999. Pre-eruptive volatile(H2O, F, Cl, S) contents of phonolitic magmas feeding the 3550-year old Avellino eruption fromVesuvius, southern Italy. J. Volcanol.Geotherm. Res. 93, 237–256.
Sircombe, K.N., 2004. AgeDisplay; an EXCEL workbook to evaluateand display univariate geochronological data using binnedfrequency histograms and probability density distributions.Comput. Geosci. 30, 21–31.
Sobolov, A.V., Chaussidon, M., 1996. H2O concentrations in primarymelts from supra-subduction zones and mid-ocean ridges:implications for H2O storage and recycling in the mantle. EarthPlanet. Sci. Lett. 137, 45–55.
Takahashi, N., Suyehiro, K., Shinohara, M., 1998. Implications fromthe seismic crustal structure of the northern Izu–Bonin arc. Isl. Arc7, 383–394.
Tamura, Y., Tatsumi, Y., 2002. Remelting of an andesitic crust as apossible origin for rhyolitic magma in oceanic arcs; an examplefrom the Izu–Bonin arc. J. Petrol. 43 (6), 1029–1047.
Tatsumi, Y., Eggins, S.M., 1995. Subduction Zone Magmatism.Blackwell, Cambridge. 211p.
Vogel, T.A., Patino, L.C., Alvarado, G.E., Gans, P.B., 2004. Silicicignimbrites within the Costa Rican volcanic front: evidence for theformation of continental crust. Earth Planet. Sci. Lett. 226,149–159.
Wysoczanski, R.J., Allibone, A.H., 2004. Age, correlation and pro-venance of the Neoproterozoic Skelton Group, Antarctica:Grenville age detritus on the margin of East Antarctica. J. Geol.112, 401–416.
Wysoczanski, R.J., Wright, I.C., Gamble, J.A., Hauri, E.H., Luhr, J.F.,Eggins, S.M., Handler, M.R., 2006. Volatile contents of KermadecArc–Havre Trough pillow glasses; fingerprinting slab-derivedaqueous fluids in the mantle sources of arc and back-arc lavas. J.Volc. Geotherm. Res. 152, 51–73.
Yamashita, S., 1999. Experimental study of the effect of temperatureon water solubility in natural rhyolite melt to 100MPa. J. Petrol. 40(10), 1497–1507.
Yuasa, M., Murakami, F., Sato, E., Watanabe, K., 1991. Submarinetopography of seamounts on the volcanic front of the Izu–Ogasawara (Bonin) arc. Bull. Geol. Surv. Japan 42, 703–743.
Zhang, Y., Jenkins, J., Zhengjui, X., 1997. Kinetics of the reactionH2O+O⇔2OH in rhyolitic glasses upon cooling: geospeedome-try and comparison with glass transition. Geochim. Cosmochim.Acta 61, 11, 2167–2173.


![Quantum Mechanical Study of the Structure and Spectroscopic (FTIR, FT-Raman, NMR and UV), First Order Hyperpolarizability and HOMO-LUMO Analysis of 2- [(Methylamino)Methyl]Pyridine](https://static.fdocuments.net/doc/165x107/5695d1d51a28ab9b0298197c/quantum-mechanical-study-of-the-structure-and-spectroscopic-ftir-ft-raman.jpg)
