Spectro-Electrochemical Investigations on Immobilised Heme ... · Spectro-Electrochemical...
160
Spectro-Electrochemical Investigations on Immobilised Heme Proteins vorgelegt von Diplom Chemiker Murat Sezer aus Berlin von der Fakultät II – Mathematik und Naturwissenschaften der Technischen Universität Berlin zur Erlangung des Akademischen Grades Doktor der Naturwissenschaften Dr. rer. nat. genehmigte Dissertation Promotionsausschuss: Vorsitzender: Prof. Dr. Andreas Grohmann Berichter: Prof. Dr. Peter Hildebrandt Berichterin: Prof. Dr. Ulla Wollenberger Tag der wissenschaftlichen Aussprache: 20. Juli 2011 Berlin 2011 D83
Transcript of Spectro-Electrochemical Investigations on Immobilised Heme ... · Spectro-Electrochemical...
Spectro-Electrochemical Investigations on
Immobilised Heme Proteins
vorgelegt von
Diplom Chemiker
Murat Sezer
aus Berlin
von der Fakultät II – Mathematik und Naturwissenschaften
der Technischen Universität Berlin
zur Erlangung des Akademischen Grades
Doktor der Naturwissenschaften
Dr. rer. nat.
genehmigte Dissertation
Promotionsausschuss:
Vorsitzender: Prof. Dr. Andreas Grohmann
Berichter: Prof. Dr. Peter Hildebrandt
Berichterin: Prof. Dr. Ulla Wollenberger
Tag der wissenschaftlichen Aussprache: 20. Juli 2011
Berlin 2011
D83


Note
Except for chapter 7.3, this thesis is written in British English. Chapter 7.3 is written in American English since it is a manuscript that has been accepted for publication in an American journal (J. Phys. Chem. B.). Moreover, the references in chapter 7.3 are listed separately in the end of chapter 7.3. Chapters 5.4 and 6.3 have been published in Phys. Chem. Chem. Phys. The references in chapters 5.4 and 6.4 are also listed seperately in the end of the respective chapters. All other references are listed in chapter 10.

Table of Contents Abbreviations ........................................................................................................................I Symbols ...............................................................................................................................II Physical constants ..............................................................................................................III Abstract............................................................................................................................... V Zusammenfassung ............................................................................................................ IX 1 Introduction.....................................................................................................................1 2 Theoretical Background.................................................................................................5
2.1 Raman Spectroscopy ............................................................................................................ 5 2.1.1 Normal Modes.................................................................................................................................. 5 2.1.2 Raman Scattering ............................................................................................................................ 6 2.1.3 Raman Signal Intensity .................................................................................................................... 7 2.1.4 Polarisability Tensor Components.................................................................................................... 8
2.2 Resonance Raman Effect...................................................................................................... 9 2.3 Surface Enhanced Raman Spectroscopy ............................................................................ 12 2.4 Electrochemical Interface at the Bare Silver Electrode ........................................................ 14 2.5 Self Assembled Monolayers of Alkanethiol Derivatives........................................................ 15 2.6 Electron Transfer Theory..................................................................................................... 17
2.6.1 Homogeneous Electron Transfer ................................................................................................... 18 2.6.2 Heterogeneous Electron Transfer.................................................................................................. 21
2.7 Heme Proteins .................................................................................................................... 23 3 Instrumentation.............................................................................................................25
3.1 Excitation Source ................................................................................................................ 25 3.2 Sample Arrangement........................................................................................................... 26 3.3 Electrochemical Setup......................................................................................................... 28 3.4 Spectroscopic and Spectro-Electrochemical Setup.............................................................. 28
4 Methods .........................................................................................................................31
4.1 Resonance Raman Spectroscopy of Heme Proteins ........................................................... 31 4.2 Surface Enhanced Resonance Raman Spectroscopy of Heme Proteins ............................. 34
4.2.1 Electrode preparation..................................................................................................................... 34 4.2.3 Time Resolved Potential Controlled Measurements...................................................................... 36 4.2.4 SERR Spectroscopic Study of Catalytic Oxidation Processes ...................................................... 37
4.3 Component Fit Analysis....................................................................................................... 38 4.4 Protein Film Voltammetry .................................................................................................... 40
4.4.1 Protein Film Voltammetry under non-Turnover Conditions............................................................ 41 4.4.2 Protein Film Voltammetry under Turnover Conditions ................................................................... 44
4.5 Computational Chemistry .................................................................................................... 45 5 Silver-Gold Hybrid Devices for Spectro-Electrochemistry........................................47
5.1 Analytical Model for the Optical Performance ...................................................................... 48 5.2 Cytochrome c ...................................................................................................................... 51 5.3 Overpotential Dependence of Heterogeneous Electron Transfer Rates............................... 52
5.4 Multi-layer electron transfer across nanostructured Ag-SAM-Au-SAM junctions probed by surface enhanced Raman spectroscopy..................................................................55
6 Human Sulphite Oxidase..............................................................................................65 6.1 Structure of Human Sulphite Oxidase.................................................................................. 66 6.2 Catalytic Mechanism of Sulphite Oxidases.......................................................................... 66
6.3 Redox properties and catalytic activity of surface-bound human sulfite oxidase studied by a combined surface enhanced resonance Raman spectroscopic and electrochemical approach.............................................................................................69 7 Membrane Bound Hydrogenase from Ralstonia eutropha H16 ................................85
7.1 Structure of the Membrane Bound Hydrogenase from Ralstonia eutropha H16................... 86 7.2 Redox Chemistry and Catalytic Cycle.................................................................................. 88
7.3 Role of the HoxZ subunit in the electron transfer pathway of the membrane-bound [NiFe]-hydrogenase from Ralstonia eutropha H16 immobilized on electrodes .............91 8 Other Projects .............................................................................................................115
8.1 Surface Enhanced Resonance Raman Spectroscopic Investigations on Xenobiotic Reductase A....................................................................................................................... 115
8.1.1 RR and SERR Spectra Using 8-Aminooctanethiol Coating..........................................................116 8.1.2 SERR Spectra Using 6-Aminohexanethiol Coating ......................................................................118
8.2 Resonance Raman Spectroscopic Investigations of Mitochondria Preparations from Mouse Pancreas............................................................................................................................ 120
9 Conclusion and Outlook ............................................................................................123
9.1 Silver-Gold Hybrid Devices................................................................................................ 123 9.2 Human Sulphite Oxidase................................................................................................... 124 9.3 Membrane Bound Hydrogenase from Ralstonia eutropha H16.......................................... 125
10 References ................................................................................................................127 11 List of Publications...................................................................................................137 Danksagung.....................................................................................................................141

I
Abbreviations
5c, 6c five-coordinated, six-coordinated
AHT 6-aminohexanethiol
AOT 8-aminooctanethiol
AUT 11- aminoundecanethiol
CCD charge coupled device
clSO chicken liver sulphite oxidase
CV cyclic voltammetry
cw continuous wave
Cyt b (di-heme) cytochrome b (domain of the membrane bound
hydrogenase from Ralstonia eutropha H16)
Cyt b5 cytochrome b5 (domain of human sulphite oxidase)
Cyt c cytochrome c
EPR electron paramagnetic resonance
ET electron transfer
FC Franck-Condon
FMN flavin-mononucleotide
HS, LS high spin, low spin
hSO human sulphite oxidase
HHCyt c horse heart cytochrome c
IET intramolecular electron transfer
IR infrared
MBH membrane bound hydrogenase from Ralstonia eutropha H16
MDHA 16-mercaptohexadecanoic acid
moco molybdopterin cofactor (of human sulphite oxidase)
MUA 11-mercaptoundecanoic acid
[NiFe] nickel iron (metal ions of the active site of certain hydrogenases)
PFV protein film voltammetry
RR resonance Raman
SAM self assembled monolayer
SHE standard hydrogen electrode (-0.210 V vs. Ag/AgCl)
SE(R)R surface enhanced (resonance) Raman
Tris tris(hydroxymethyl)aminomethane
TR-SERR time resolved surface enhanced resonance Raman
UV-Vis ultra violet – visible
XenA xenobiotic reductase A from Pseudomonas Putida 86
YCyt c iso-1-cytochrome c from yeast

II
Symbols
symbol unit signification
A [cm2] real electrode surface area
c [mol . cm-2] surface concentration
E [V] potential
E [eV] energy
Er
⋅⋅
3sA
mkg electric field vector
)(νF wavelength dependent electric field enhancement factor
RPH [eV] electronic coupling
elH Born-Oppenheimer electronic Hamiltonian
I [eV, or a.u.] intensity
I [A] current
k [s-1] electron transfer rate constant
M electron position operator
M electronic transition moment
n number of transferred electrons
n number of repetitions
pH negative logaritmic value of the H+ concentration
)( iEP Boltzmann probability of state i with energy iE
ApK negative logaritmic value of the acid dissociation constant
kQ [ mkg ⋅2/1 ] mass-weighted coordinates of the normal mode k
R , r [nm] radius
t [s] time
T [K] temperature
α [A2�s4�kg-1] molecular polarisability
α [°] tilt angle of self assembled monolayers with respect to the
surface normal
β tunelling decay parameter
Γ [cm-1] bandwidth at half height
Γ [mol] amount of electro-active protein on an electrode surface
RrΓ damping constant related to the lifetime of the vibronic state Rr

III
δ Dirac delta function
δ [s] delay time
ε dielectric constant or dielectric function
η [V] overpotential
elκ electron transmission coefficient
λ [nm] wavelength
λ [eV] reorganisation free energy
µr
[debye] dipole moment
ν [s-1] frequency
ν~ [cm-1] wavenumber
scanν [V.s-1] scan rate
elv [rpm] rotation speed of the working electrode
ρ density of states of a solid metal electrode
Dτ [s] dielectric relaxation time
σ resonance Raman cross section parameter
Φ quantum yield
Φ
⋅⋅
3sA
mkg local electric field
IFΦ [A. s . cm-2] surface charge density
ψ dimensionless electric potential
ψ electronic wave function
Physical constants
c speed of light 1458.299792 −⋅= skmc
e elementary charge Ase 1910602.1 −⋅=
F Faraday constant 1339.96485 −⋅= molAsF
h Planck constant sJh ⋅⋅= −3410626.6
h reduced Planck constant sJ ⋅⋅= −3410055.1h
Bk Boltzmann constant 123103806504.1 −− ⋅⋅= KJkB
R universal gas constant 11314.8 −− ⋅⋅= KmolJR
0ε vacuum permittivity 1112
0 10854187.8 −−− ⋅⋅= mVCε

IV

Abstract
V
Abstract
In this thesis, different aspects of spectro-electrochemical research on chromophore containing
redox-active proteins were addressed. On the one hand, this work is related to the development of
novel functional materials as substrates for surface enhanced resonance Raman (SERR) spectro-
electrochemistry, on the other hand, electron transfer processes of immobilised enzymes were
investigated.
The optical and electronic performance of novel silver-gold hybrid devices as support materials
for SERR spectro-electrochemistry was explored using horse heart cytochrome c (HHCyt c) and
yeast iso-1-cytochrome c (YCyt c) as model proteins. In these devices a thin gold island film, which
can be further functionalised, is separated by amino-terminated self assembled monolayers
(spacer SAMs) from an electrochemically roughened silver support. Comparable Raman signal
intensity was observed for electrostatically immobilised HHCyt c on SAM-coated silver and silver-
gold hybrid devices, respectively. The native heme conformation of HHCyt c was preserved upon
electrostatic immobilisation and interfacial electron transfer (ET) between the protein and the silver-
gold multilayer device occurred with an almost Nernstian behaviour with an apparent number of
transferred electrons close to one (n = 0.8 – 0.9). Interfacial ET rates were found to be limited
either by electron tunnelling through the outer SAM on the gold layer or the spacer SAM between
the metal layers, and impurities or defects in the spacer SAM. Fastest rates were obtained using
11-aminoundecanthiol (AUT) as spacer, shorter spacer SAMs yielded lower ET rates, most likely
due to impurities or defects. The potential of zero charge of a Ag-AUT-Au-MDHA device (MDHA –
16-Mercaptohexadecanethiol) was determined to be pzcE = -0.2 V (vs. Ag/AgCl, 3M KCl), which is
in between of the respective values for Ag-MDHA ( pzcE = -0.45 V) and Au-MDHA ( pzcE = -0.03 V).
Also the overpotential dependence of heterogeneous reduction rated of HHCyt c on this particular
hybrid device was found to to lie in between of the respective silver and gold supports. YCyt c was
covalently attached via Cys102 to the bare gold surface of the hybrid device, yielding 25 times
higher SERR signal intensity as compared to the bare silver surface. The covalently attached YCyt
c partially converted into a non-native species and exhibited a broad interfacial redox transition (n
= 0.3). It was shown that the hybrid device provides similar Raman signal enhancements as pure
silver supports, exhibit the surface chemistry and biocompatibility of gold and efficient interfacial
ET.
Human sulphite oxidase (hSO) was electrostatically immobilised on SAM-coated silver
electrodes and studied by protein film voltammetry (PFV) and (time-resolved) potential controlled
SERR spectroscopy. The heme pocket structure in the cytochrome b5 (Cyt b5) domain and
functionality of the enzyme were preserved upon immobilisation. It was shown that the
Abstract
VI
heterogeneous ET rate of the Cyt b5 domain and catalytic activity of hSO dramatically increase
upon increasing the ionic strength of the buffer solution. Upon increasing the concentration of a
Tris-acetate buffer from 5 mM to 750 mM, heterogeneous ET rates for the Cyt b5 domain of hSO
increase from 17 s-1 to 440 s-1 and the apparent number of transferred electrons increases from n
= 0.74 to n = 0.96 as obtained by SERR spectroscopy. PFV measurements demonstrated an
increase of the apparent turnover rate of the immobilised hSO from 0.85 s-1 in 100 mM to 5.26 s-1
in 750 mM Tris-acetate buffer. These effects result from increased mobility of the enzyme with
increasing buffer concentration due to a weakening of electrostatic interaction forces. Comparative
studies with the isolated Cyt b5 domain and calculations on the surface potential distribution
suggest that the entire hSO is most likely immobilised via its dimerisation domain to the SAM. The
flexible loop region connecting the molybdopterin cofactor (Moco) containing domain, where the
catalytic raction takes place, and the Cyt b5 domain allows alternating contact of the Cyt b5 with
the Moco domain interaction site and the SAM surface. This movement enables sequential
intramolecular and heterogeneous ET from Moco via the Cyt b5 to the electrode. At higher ionic
strength, the contact time of the Cyt b5 domain with both the Moco domain and the SAM surface,
respectively, is shorter, corresponding to a faster overall ET process.
The entire HoxGKZ hetero-trimer and the isolated HoxZ domain of the membrane bound [NiFe]
hydrogenase from Ralstonia eutropha H16 (MBH) were studied with PFV and potential controlled
SERR spectroscopy. The role of the HoxZ domain, which is a di-heme cytochrome b (Cyt b) unit, in
the electron transfer pathway of the immobilised HoxGKZ hetero-trimer from was investigated.
Experimental conditions were optimised for the isolated Cyt b unit with regard to structural integrity
and electronic communication with the electrode. Best results within this study were obtained using
carboxyl-terminated SAMs and 100 mM phosphate buffer at pH 5.5. Under these conditions the
heme pocket structure was preserved and a single broad heterogeneous electron transition
between the heme cofactor(s) and the silver electrode was clearly observed with potential
controlled SERR spectroscopy. The apparent number of transferred electrons of this redox
transition is n ≈ 0.5, the midpoint potential is similar to the value in solution ( solmE , = -0.09 V, vs.
SHE) and the heterogeneous ET kinetics were found to be rather slow ( k = 0.24 s-1). The native
six-coordinated low spin (6cLS) heme state and a non-native five-coordinated high spin (5cHS)
state were found to be in an equilibrium that depends on experimental conditions. Experimental
conditions at which the heme pocket structure is preserved were adopted for the study of the entire
hetero-trimer. As observed with PFV, the immobilised HoxGKZ shows enzymatic activity in both
directions, whereby the hydrogen splitting under hydrogen supply is much more efficient than
hydrogen evolution under inert gas atmosphere. It was shown with SERR spectroscopy that
electrons from enzymatic hydrogen oxidation are transferred to hemes of the HoxZ domain. The
apparent rate of the catalytic heme reduction is low ( k = 0.15 s-1) and includes transport of
hydrogen to the electrode, reductive activation of the enzyme and intramolecular electron transfer.
Abstract
VII
The shape of the cyclic voltammograms resembles those previously reported for the HoxGK
hetero-dimer. The immobilised HoxGKZ hetero-trimer exhibits similar anaerobic inactivation and
reactivation behaviour with similar switch potential switchE = 0.09 V (vs. SHE). Also in this work,
similar catalytic currents were observed for the HoxGK hetero-dimer, however, with much lower
current intensity. On the basis of the experimental findings, we conclude that the HoxZ subunit is
not primarily involved in the electron transfer of the immobilised HoxGKZ to the electrode but plays
a crucial role in stabilising the enzyme on the electrode.

VIII

Zusammenfassung
IX
Zusammenfassung
Diese Arbeit behandelt zwei Aspekte innerhalb des Forschungsgebiets der Spektro-
Elektrochemie an chromophorhaltigen redox-aktiven Proteinen. Zum einen ging es um die
Entwicklung neuartiger Materialien als Plattform für oberflächenverstärkte Resonanz Raman
(SERR) Spektro-Elektrochemie, zum anderen um die Aufklärung von Elektronentransferprozessen
immobilisierter Proteine.
Die optischen und elektronischen Eigenschaften von neuartigen Silber-Gold Hybrid Materialien
als Substrate für SERR Spektro-Elektrochemie wurden untersucht, wobei Cytochrom c vom
Pferdeherzen (HHCyt c) und iso-1-Cytochrom c aus Hefe (YCyt c) als Modellproteine verwendet
wurden. In diesen Hybrid-Materialien ist eine dünne Inselschicht aus Gold, welche noch weiter
funktionalisiert werden kann, von einer elektrochemisch aufgerauten Silberoberfläche durch
Amino-terminierte selbstorganisierte Monoschichten (Spacer-SAMs) separiert. Vergleichbare
Raman Signalintensitäten für elektrostatisch gebundenes HHCyt c wurden auf SAM-beschichteten
Silber beziehungsweise Silber-Gold Hybrid-Materialien beobachtet. Die natürliche Konformation
des HHCyt c blieb bei der Immobilisierung erhalten und heterogener Elektronentransfer (ET)
zwischen dem Protein und dem Silber-Gold Multischicht-Material entsprach nahezu idealem
Nernstschen Verhalten. Die apparente Anzahl übertragener Elektronen lag nahe bei eins (n = 0,8
– 0.9). Es hat sich heraus gestellt, dass der limitierende Faktor für den heterogenen ET entweder
durch Elektronentunneln über die Spacer-SAM zwischen den Metallschichten beziehungsweise die
äußere SAM auf der Goldschicht und durch Verunreinigungen oder Defekte in der Spacer-SAM
gegeben ist. Die höchste ET-Geschwindigkeit wurde bei Verwendung von 11-Aminoundekanthiol
(AUT) als Spacer-SAM beobachtet, die Verwendung von kürzeren Spacer-SAMs führte zu
niedrigeren Geschwindigkeiten, vermutlich aufgrund von Verunreinungen oder Defekten. Das
Nullladungspotenzial einer Ag-Aut-Au-MDHA (MDHA – 16-Mercaptohexadekanthiol) wurde mit
pzcE = -0,2 V (vs. Ag/AgCl, 3M KCl) ermittelt. Dieser Wert liegt zwischen den entsprechenden
Werten für Ag-MDHA ( pzcE = -0,45 V) und Au-MDHA ( pzcE = -0,03 V). Auch die
Überpotentialabhängigkeit der heterogenen Reduktionsgeschwindigkeit von HHCyt c auf dieser
speziellen Hybrid-Elektrode liegt zwischen denen auf reinem Silber beziehungsweise reinem Gold.
YCyt c wurde kovalent über Cys102 an die Goldoberfläche der Hydrid-Elektrode gebunden. Die
SERR Signalintensität war für dieses System 25 Mal höher im Vergleich zur Silberelektrode. Ein
Teil des kovalent gebundenen YCyt c ging in einen nicht-nativen Konformationszustand über und
es wurde ein sehr breiter heterogener ET (n = 0,3) beobachtet. Dadurch wurde gezeigt, dass das
Hybrid-Material die chemischen Oberflächeneigenschaften und die Biokompatibilität von Gold
aufweist. Außerdem bietet es eine Verstärkung von Ramansignalen, die mit der von reinen
Zusammenfassung
X
Silberoberflächen vergleichbar ist und zeigt einen effizienten heterogenen ET.
Menschliche Sulfit-Oxidase (hSO) wurde elektrostatisch auf SAM-beschichteten Silber-
Elektroden immobilisiert und mit Proteinfilm Voltammetrie (PFV) und (zeitaufgelöster) Potential-
kontrollierter oberflächenvestärkter Resonanz Raman (SERR) Spektroskopie untersucht. Die
native Struktur der Häm-Bindungstasche in der Cytochrom b5 (Cyt b5) Domäne und die
Funktionalität des Enzyms blieben nach der Immobilisierung erhalten. Es wurde gezeigt, dass die
heterogene ET-Geschwindigkeit der Cyt b5 Domäne und die katalytische Aktivität des hSO durch
eine Erhöhung der Ionenstärke der Pufferlösung sehr stark ansteigen. Durch eine Erhöhung der
Konzentration eines Tris-Acetat Puffers von 5 mM auf 750 mM wurde mir SERR-Spektroskopie ein
Anstieg der heterogenen ET-Geschwingigkeit für die Cyt b5 Domäne der hSO von 17 s-1 auf
440 s-1 gemessen, wobei auch die apparente Anzahl übertragener Elektronen von n = 0,74 auf
n = 0,96 angestiegen ist. PFV Messungen haben gezeigt, dass die apperente Umsetzungsrate
der immobilisierten hSO von 0,85 s-1 in 100 mM auf 5,26 s-1 in 750 mM Tris-Acetat Puffer ansteigt.
Beide Effekte resultieren von einer erhöhten Beweglichkeit des Enzyms mit steigender
Pufferkonzentration aufgrund einer Schwächung elektrostatischer Wechselwirkungen.
Vergleichende Studien zur isolierten Cyt b5 Domäne und theoretische Berechnungen zur
Verteilung des Oberflächenpotentials deuten darauf hin, dass die gesamte hSO vor allem über die
Dimerisierungs-Domäne an die SAM gebunden ist. Die flexible Loop-Region, welche die
Molybdopterin Kofaktor (Moco) enthaltende Domäne (in der die katalytische Reaktion stattfindet)
mit der Cyt b5 Domäne verbindet, erlaubt abwechselnden Kontakt der Cyt b5 Domäne mit der
Bindungstasche der Moco Domäne und der SAM-Oberfläche. Diese Bewegung ermöglicht
aufeinanderfolgenden intramolekularen und heterogenen ET vom Moco über das Cyt b5 zur
Elektrode. Bei höheren Inonenstärken ist die Kontaktzeit der Cyt b5 Domäne sowohl mit der Moco
Domäne als auch mit der SAM-Oberfläche kürzer, was zu einem schnelleren ET Gesamtprozess
führt.
Das gesamte HoxGKZ hetero-Trimer und die isolierte HoxZ Domäne der Membran-
gebundenen [NiFe] Hydrogenase von Ralstonia eutropha H16 (MBH) wurden mit kombinierter
Proteinfilm Voltammetrie und Potential-kontrollierter SERR Spektroskopie untersucht. Die Rolle der
HoxZ Domäne, welches eine di-Häm Cytochrom b (Cyt b) Einheit ist, beim heterogenen
Elektronentransfer des immobilisierten HoxGKZ hetero-Trimers wurde untersucht. Die
experimentellen Bedingungen wurden zunächst für das isolierte Cyt b hinsichtlich struktureller
Integrität und elektronischer Kommunikation mit der Elektrode optimiert. Innerhalb dieser Arbeit
wurden die besten Ergebnisse bei der Verwendung von Carboxyl-termierten SAMs und 100 mM
Phosphat-Puffer mit einem pH von 5,5 erzielt. Unter diesen Bedingungen blieb die natürliche
Konformation der Häm-Bindungstasche erhalten und ein einzelner, breiter heterogener
Redoxübergang zwischen dem/den Häm Kofaktor(en) und der Elektrode wurde mit Potential-

Zusammenfassung
XI
kontrollierter SERR Spektroskopie beobachtet. Die apparente Anzahl übertragener Elektronen für
diesen Elektronenübergang beträgt n ≈ 0.5 und liegt bei einem Potential, der dem Wert entspricht,
der bei Messungen in Lösung ermittelt wurde ( solmE , = -0.09 V, vs. SHE). Die heterogene ET-
Geschwingigkeit dieses Übergangs liegt bei k = 0.24 s-1. Die native sechsfach-koordinierte low-
spin (6cLS) Häm-Koordination liegt mit einem fünffach-koordinierten low-spin (5cHS) Zustand in
einem Gleichgewicht, das von experimentellen Bedingungen abhängt. Die experimentellen
Bedingungen, bei denen die native Struktur der Häm-Bindungstasche erhalten bleibt, wurden für
die Untersuchung des gesamten hetero-Trimers übernommen. Mit PFV konnte gezeigt werden,
dass das immobilisierte HoxGKZ in zwei Richtungen katalytisch aktiv ist, wobei die
Wasserstoffspaltung unter Wasserstoffgaszufuhr wesentlich effizienter ist als die
Wasserstoffproduktion unter Inertgas-Atmosphäre. Es wurde mit SERR Spektroskopie gezeigt,
dass Elektronen, die dem Wasserstoff bei der enzymatischen Spaltung entzogen werden, zu den
Häm-Gruppen der HoxZ Domäne übertragen werden. Die apparente Geschwingigkeit dieser
katalytischen Häm-Reduktion ist niedrig ( k = 0,15 s-1) und beinhaltet den Transport von
Wasserstoff zur Elektrode, reduktive Aktivierung des Enzyms und intramolekularen
Elekronentransfer. Die Form der zyklischen Voltammogramme gleichen denen, die in früheren
Arbeiten zum HoxGK hetero-Dimer berichtet wurden. Das immobilisierte HoxGKZ hetero-Trimer
zeigt gleiches anaerobes Inaktivierungs- und Reaktivierungsverhalten mit gleichem switch-
Potential switchE = 0,09 V (vs. SHE). Auch in dieser Arbeit wurde das HoxGK hetero-Dimer
untersucht und es wurden ähnliche Ergebnisse erzielt, allerdings ist die Intensität des katalytischen
Stromes im Falle des hetero-Dimers sehr viel geringer. Auf Basis der Ergebnisse schließen wir,
dass die HoxZ Domäne nicht primär in den heterogenen Elektronentransfer des immobilisierten
HoxGKZ involviert ist, allerdings eine wichtige Rolle bei der Stabilisierung des Enzyms auf der
Elektrode spielt.

XII
Introduction
1
1 Introduction
The main motivation of this work was to gain insight into structural and mechanistic properties
of selected chromophore containing enzymes immobilised on conductive support devices.
Immobilisation of enzymes onto conductive supports is one of the main strategies in the design of
bioelectronic devices such as biofuel cells [95] and biosensors [72, 78, 79]. The performance of
these devices is determined by the catalytic activity and stability of the immobilised enzyme and
the efficiency of its electronic communication with the conductive support. Moreover, biocompatibly
coated conductive supports may represent model systems for mimicking membranes [1, 3]. In their
natural environment, many enzymes exert their function at membranes under the influence of high
electric fields. Since conductive supports allow for electrochemical potential and electric field
control, they may provide a more realistic platform for the study of enzymes [3, 191, 198].
Electrochemical methods that monitor the integrated electronic response of immobilised
species to changes of experimental parameters are being employed in the study and optimisation
of support/enzyme devices [72, 95]. The membrane bound hydrogenase from Ralstonia eutropha
H16 (MBH) [6, 18, 19, 21, 24, 97] and human sulphite oxidase (hSO) [72, 78, 79] represent two
prominent examples of enzymes that have been extensively studied with electrochemical methods.
However, these techniques do not provide structural information and do not give insight into
molecular processes that are associated with the electron transfer. In this respect, surface
enhanced vibrational spectroscopy represents an increasingly important technique complementing
electrochemical methods [1, 3]. Moreover, surface enhanced spectroscopic techniques can be
employed simultaneously with electrochemical methods [1-3, 5, 8, 68, 112] such as protein film
voltammetry (PFV), which is a standard technique in the study of catalytic processes of
immobilised proteins [6].
A combined surface enhanced resonance Raman (SERR) spectroscopic and protein film
voltammetric (PFV) approach was employed in this work for the study of the heme containing
enzymes hSO (chapter 6) [5] and MBH (chapter 7) [8]. The MBH is an oxygen tolerant [NiFe]
hydrogenase consisting of three subunits HoxG, HoxK and the di-heme cytochrome b subunit
HoxZ [23, 24, 103]. It is able to catalyse the reversible splitting of hydrogen into protons and
electrons even in the presence of atmospheric oxygen concentrations [21]. In view of decreasing
fossil resources there is the need of developing hydrogen-based energy conversion technologies
[20, 95]. Therefore, research efforts have been made in order to explore the possibilities of MBH
for application in bioelectronic devices [19, 21, 95] and examine its extraordinary oxygen tolerance
[103]. However, research on MBH was mainly focussed so far on the HoxGK hetero-dimer [6, 18,
19, 21, 25-27]. In this work, the role of the HoxZ subunit in the electron transfer pathway of
Introduction
2
immobilised MBH was explored [8] (chapter 7.3).
The homo-dimeric hSO contains a molybdopterin cofactor (moco) domain and a mono-heme
cytochrome b5 (Cyt b5) domain per monomer [73]. While catalytic oxidation of sulphite to sulphate
takes place at the moco, the Cyt b5 was shown to function as an electron shuttling unit that
exhibits large translational reorientation between electron uptake from the moco domain and
electron release to an external redox partner [13, 80 - 84]. HSO has been considered for
application in sulphite biosensor devices [72, 78, 79]. Since sulphites may bear health risks [88, 89]
but are widely used in food and pharmaceutical industries [85-87], there is a demand for low cost
quantitative sulphite sensing devices. The rational design of a hSO based biosensor in particular
and support/enzyme systems in general would benefit from a better understanding of the molecular
processes at the support/protein interface. The aim of the SERR spectroscopic and
electrochemical study of hSO presented in chapter 6.3 [5] was to examine the adsorption process
of the enzyme and the role of the cytochrome b5 subunit during catalysis in the immobilised state.
A brief introduction into the current state of electrochemical and spectroscopic research and related
issues on hSO and MBH is given in the respective chapters.
The main principles of SERR spectroscopy and PFV are presented in chapter 2.1 – 2.3 and
chapter 4.4, respectively. SERR spectroscopy provides dynamic structural information with
enormous sensitivity and a two-fold selectivity, because only the chromophore region of adsorbed
molecules is probed [1, 3, 7]. However, the incident radiation needs to be in resonance with both
the plasmon frequencies of an surface enhanced Raman (SER) active metal support material and
an electronic transition of the adsorbed probe molecule, respectively [1, 7]. For the study of heme
cofactors immobilised on sub-microscopically rough silver surfaces both resonance conditions are
particularly well matched upon 413 nm excitation. Silver provides by far the highest signal
enhancements throughout the visible and near-infrared region and is therefore best suited for
SERR spectroscopy from the optical point of view [4]. However, the electrochemical applicability
and biocompatibility of silver is poor [11, 156, 161] as compared to gold, which is more commonly
used in electrochemistry [176-180]. Silver supports can still be employed in the study of
biomolecules by using biocompatible electrode coating materials [1-3, 5, 7, 8, 67]. Self assembled
monolayers (SAM) of ω-functionalised alkanethiols represent the most versatile biocompatible
coating materials [9] and were used throughout this work. They are presented in chapter 2.5.
There are also other approaches to improve the performance of silver-based SER-active
support materials. A novel gold-silver-hybrid electrode for SER spectro-electrochemistry that aims
at combining the electrochemical properties and chemical stability of gold with the optical
properties of silver is introduced in chapter 5 [11, 12]. In this work, the performance of this hybrid
device was explored (chapters 5.3 and 5.4) [12].

Introduction
3
Finally, two more projects that were carried out in this work are briefly presented in chapter 8.
These projects were the SERR spectroscopic study of the flavin containing xenobiotic reductase A
from Pseudomonas Putida 86 and the resonance Raman spectroscopic study of mitochondria
sample preparations from mouse pancreas.

4
Theoretical Background – Raman Spectroscopy – Normal Modes (2.1.1)
5
2 Theoretical Background
2.1 Raman Spectroscopy
In this work, Raman spectroscopic techniques were employed for the study of chromophore
containing proteins. For a better understanding, the theory and main principles of Raman
spectroscopic techniques are briefly presented in the following chapters.
2.1.1 Normal Modes
Each atom within a molecule has three degrees of freedom, hence an N-atomic molecule has
3N degrees of freedom. For a non-linear (linear) molecule three of them refer to translations and
three (two) to rotations of the molecule. The remaining 3N – 6 (3N – 5) degrees of freedom are
precisely defined periodic oscillations of the atoms. These oscillations can be described by
displacements (∆xγ, ∆yγ, ∆zγ) of each individual atom γ within the Cartesian coordinates x, y and z.
They are the vibrations of the molecule, the so-called normal modes, which may also be described
by normal mode coordinates, kQ [ mkg ⋅2/1 ]. For a given normal mode k (which has the frequency
kν ), the normal coordinates are 'kQ = 0 for all kk ≠' and the movement of all atoms can be
described in terms of a single scalar )(tQk oscillating at kν . The normal coordinates kQ are
therefore a measure for the amplitude of the deformation according to the pattern of a given normal
mode k .
Transitions between energy levels, i.e. oscillation frequencies, of normal modes are probed by
vibrational spectroscopy. Normal mode frequencies lie in the range of 0.5 to 0.005 eV, which
corresponds to electromagnetic radiation in the infrared region (wavelengths between 2.5 and 50
µm). For historical reasons the frequencies of normal modes are expressed in wavenumbers ν~
[cm-1], defined according to
{2.1.1} c
νν =~ ,
with ν being the frequency of the normal mode and c the speed of light. In each normal mode
each atom oscillates in-phase and with the same frequency. The amplitude of oscillation, however,
may be different for each atom, such that the contribution of the oscillation of each individual atom
to a particular normal mode may vary significantly. In many instances it is a reasonable

Theoretical Background – Raman Spectroscopy – Raman Scattering (2.1.2)
6
approximation to ascribe a certain normal mode to the oscillation of a group of few atoms within the
whole molecule. Weighted by their contribution, the energies of a particular normal mode
sensitively depend on (a) the masses of the individual atoms and (b) the forces acting on them.
These forces do not only include chemical bonds of the individual atoms, but also non-bonding
interactions within the molecule and with the environment of the molecule. Therefore, vibrational
spectra are signatures of the chemical constitution, the structure, electron density distribution and
chemical environment of the molecule.
2.1.2 Raman Scattering
The two main techniques to obtain vibrational spectra are infrared absorption (IR) and Raman
spectroscopy, which are based on different physical mechanisms. In IR-absorption spectroscopy
the molecule is exposed to a continuous IR radiation source and normal modes are excited directly
into higher vibrational energy levels through the absorption of infrared radiation. In Raman
spectroscopy vibrational transitions are induced via inelastic scattering of monochromatic light
(figure 2.1.2). The light is usually in the visible region and can be provided by commercially
available lasers. The inelastic scattering of light by matter is named after the Indian scientist C. V.
Raman who was the first to observe this effect in 1928.
Figure 2.1.2: Energy transitions in vibrational spectroscopy.
The scattering process can be described with classical physics in terms of an interaction of the
electric field vector of the incident light with the electron cloud of the molecule. As a response to
the nuclear motions also the molecular electron cloud is vibrating with the normal mode frequency
kν~ . In a quantum mechanical picture an incident photon with the frequency 0~ν (whereby kνν ~~
0 >> )
Theoretical Background – Raman Spectroscopy – Raman Signal Intensity (2.1.3)
7
is scattered by the molecule to produce a phonon, corresponding to a normal mode with kν~ and a
scattered photon with kνν ~~0 − (Stokes Raman scattering). In case of anti-Stokes Raman scattering
( kνν ~~0 + ) a phonon is annihiliated whereas in Rayleigh scattering (elastic scattering) the frequency
of the incident and the scaterred light is the same. In inelastic scattering the frequencies are shifted
with respect to the incident light and are associated with a transition from a lower into a higher
vibration level ( kνν ~~0 − ) and vice versa ( kνν ~~
0 + ). The wavenumbers of Raman bands are quoted
as Raman shifts ν~∆ and are defined according to )~~(~~00 kνννν ±−=∆ .
The frequencies obtained with Raman spectroscopy are in principle equivalent to the ones
probed from IR absorption. However, due to different physical mechanisms, the probability for a
certain vibrational transition is different for both techniques resulting in different relative and
absolute intensities of absorbed (IR) and inelastically scattered (Raman) radiation. Therefore IR
and Raman spectroscopy are commonly referred to as complementary techniques.
2.1.3 Raman Signal Intensity
Raman band intensities are proportional to the square of the induced dipole moment indµr
,
which results from the interaction of the molecular electron cloud with the electric field vector 0Er
of
the incident light. The induced dipole moment depends on the square root of the incident light
intensity 2
00 )(~ EIr
and the polarisability [ ]α of the molecule. It can be shown that the Raman
scattering intensity for a fundamental transition from vibrational state i to f is proportional to
the variation of the polarisability with respect to the motion along the normal mode coordinate kQ
of this vibrational mode according to:
{2.1.3.1} fQidQ
dk
k
if δα
α0
~
.
Only vibrational modes for which ifα is non-zero are observable with Raman spectroscopy.
This general selection rule for Raman scattering is different to the IR absorption selection rules,
where the permanent dipole moment of the molecule must change upon nuclear motion along the
normal mode coordinate. To account for its anisotropy, the molecular polarisability [ ]α has to be
expressed as a tensor containing nine elements ρσα with ρ and σ denoting the molecule fixed x,
y and z coordinates.

Theoretical Background – Raman Spectroscopy – Polarisability Tensor Components (2.1.4)
8
The occupation of vibrational states is given by the Boltzmann distribution. Accordingly, the
occupation of the vibrational ground state is always higher than for excited vibrational states. It
should also be noted that, according to Rayleigh’s 4ν -law, the intensity of scattered light is
proportional to the fourth power of its frequency (4
~ scsc vI ). Since light of shorter wavelengths is
scattered with much higher intensity this law has also strong relevance for the choice of the
excitation source, i.e. the frequency of the incident light beam.
All these considerations are summed up in the following expression for Raman band intensities
ifI at the Raman band frequency kν :
{2.1.3.2} ( )4444 34444 21)sec(~
,,,
24
00 )(~
tioncrossRaman
zyxifk
Tk
E
if
if
B
i
vveII
σ
σρρσα∑
=
−
⋅±⋅⋅ .
iE denotes the energy of the initial vibrational state i , T the temperature and Bk the
Boltzmann constant. It is useful to introduce the Raman cross section for this transition, ifσ , which
is a quantity to define the inelastic scattering efficiency. It is proportional to the indicated terms of
equation {2.1.3.2}.
According to the Boltzmann distribution, the intensity of Stokes scattering is always higher than
anti-Stokes scattering, however, their intensity ratio is temperature dependent. The temperature
dependence can, in turn, be utilised for the determination of local sample temperatures [39].
According to Rayleigh’s 4ν -law, also relative intensities of Stokes and anti-Stokes signals are
different.
2.1.4 Polarisability Tensor Components
A comprehensive description of the polarisability tensor components is only possible with
quantum mechanics, also taking into account that vibrational modes may be coupled to electronic
transitions. Since two photons are involved in the scattering process second order perturbation
theory has to be applied. On the basis of Kramers-Heisenberg-Dirac’s dispersion theory [33-36],
the components of the polarisability tensor for a transition between the vibrational states i and
f in the electronic ground state G can then be expressed as [1, 37-40]:

Theoretical Background – Resonance Raman Effect (2.2)
9
{2.1.4} ( ) ∑≠
Γ++−+
Γ+−−=
firR RrkRrRrkRrif ivvv
RrMiGGfMrR
ivvv
GfMrRRrMiG
h ,, 00
1 ρσσρ
ρσα .
Here ρ , σ = x, y, z independently refer to the axes of the molecule-fixed non-rotating
Cartesian coordinate system [39]. The indices R and r refer to the excited electronic states and
the vibrational (vibronic) states of these excited electronic states of the molecule, respectively. ρM
and σM are ρ - and σ -components of the respective electron position operator, referring to the
polarisation of the incident ( ρ ) and scattered (σ ) light. The frequency of the vibronic state Rr is
denoted as Rrν and RrΓ is a damping constant that is related to its lifetime. Under non-resonant
conditions where 0ν is far below any electronic transition, the denominators of both terms in the
brackets at the right side of equation {2.1.4} are large resulting in low values for the polarisabilty.
In general, only a small fraction of light that passes through a sample is scattered. Moreover,
most of the scattered light is scattered elastically and has therefore the same frequency as the
incident light beam (Rayleigh scattering). The quantum yield of Raman scattering is very low
(ФRaman ~ 10-9).
2.2 Resonance Raman Effect
If the frequency of the monochromatic light source 0ν is in resonance or pre-resonance with an
electronic transition of the molecule ( RG → ), this will result in an up to 106–fold amplification of
the signals of vibrational modes. However, only the signals of those vibrational modes that are
coupled to this specific electronic transition are enhanced. The selective signal amplification is a
result of increased polarisability of these modes and can be readily explained with equation {2.1.4}.
Under resonance conditions, the summation of vibrational states can be approximately restricted
only to the one resonant excited electronic state R . This simplifies equation {2.1.4}. Also the
summation term in brackets can be simplified. When 0ν is close to the frequency of the electronic
state R , hence also Rrν , the denominator of the right handed expression ( RrkRr iΓ++− 0ννν ) is
very high as compared to the left handed expression ( RrkRr iΓ+−− 0ννν ). Hence, the right handed
expression can be neglected. The integrals RrMiG ρ and GfMrR σ represent vibronic
transition dipole moments that depend on both the nuclear and electronic coordinates. According to
the Born-Oppenheimer approximation these can be separated leading to ρ,GRMir and
Theoretical Background – Resonance Raman Effect (2.2)
10
σ,GRMrf , respectively (Franck-Condon principle). The overlap integrals ir and rf of the
vibrational wavefunctions i , r and f are the Franck-Condon factors and ρ,GRM and σ,GRM are
the ρ - and σ -components of the electronic transition moment. These considerations lead to the
following simplified expression of equation {2.1.4} under resonance conditions:
{2.2.1} ( ) ∑≠ Γ+−−
≈fir RrkRr
GRGR
if ivvv
MMrfir
h , 0
,,1 σρρσα .
If the Born-Oppenheimer approximation is valid, the dependence of the electronic transition
moment on the internal normal mode coordinates kQ is small. Therefore, ρ,GRM and σ,GRM can
be expanded in a Taylor series with respect to kQ .
{2.2.2}
...
...)()(
'
,
0
,
0
,)0(
,,
++=
+
∂
∂+=
∑
∑
k
kGRGR
k
k
k
GR
kGRkGR
QMM
MQMQM
ρρ
ρρρ
σ,GRM is expanded in a similar manner. The combination of equations {2.2.1} and {2.2.2} leads
to an infinite number of terms, however, within the harmonic approximation only the first and
second terms of the Taylor series are considered. With this, the ρσ -components of the
polarisability tensor can be expressed as the sum of two so-called Albrecht’s A- and B-terms:
{2.2.3} ( ) ρσρσρσα BAif
+≈ ,
{2.2.3a} ∑≠ Γ+−−
≈fir RrkRr
GRGRivvv
rfirMM
hA
, 0
0
,
0
,
1σρρσ ,
{2.2.3b}
Γ+−−+
Γ+−−≈ ∑∑
≠≠ fir RrkRr
k
GRGR
fir RrkRr
k
GRGRivvv
fQrirMM
ivvv
rfrQiMM
hB
, 0
0
,
'
,
, 0
0
,
'
,
1ρσσρρσ .
The ρσA – and ρσB – terms represent the two major enhancement mechanisms in RR
spectroscopy. They are referred to as Franck-Condon (FC) ( ρσA – term) and Herzberg-Teller
vibronic coupling (HT) ( ρσB – term) scattering. In both cases, the denominators ( RrkRr Γ+−− 0ννν )
decrease rapidly when 0ν approaches the frequency of the electronic state R leading to increased
polarisability and thus an increased RR signal. The contribution of each of the mechanisms to the
Theoretical Background – Resonance Raman Effect (2.2)
11
overall enhancement, however, may be different for different vibrational modes and electronic
transitions, respectively.
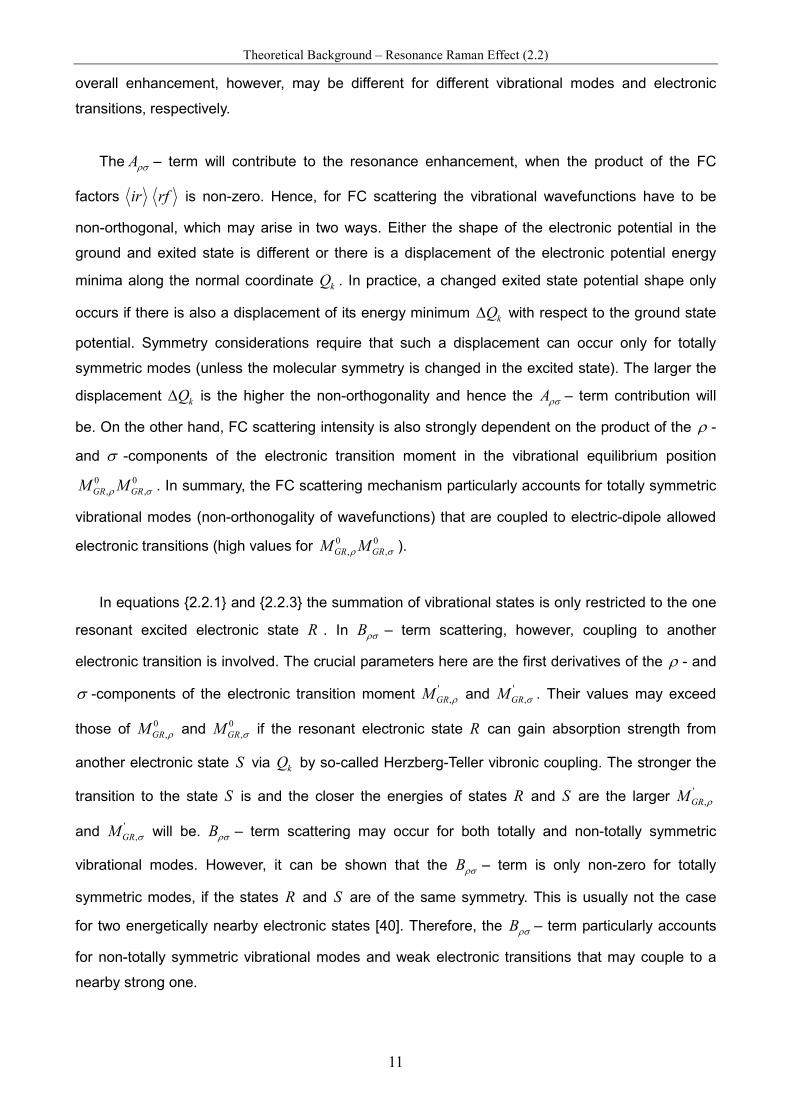
The ρσA – term will contribute to the resonance enhancement, when the product of the FC
factors ir rf is non-zero. Hence, for FC scattering the vibrational wavefunctions have to be
non-orthogonal, which may arise in two ways. Either the shape of the electronic potential in the
ground and exited state is different or there is a displacement of the electronic potential energy
minima along the normal coordinate kQ . In practice, a changed exited state potential shape only
occurs if there is also a displacement of its energy minimum kQ∆ with respect to the ground state
potential. Symmetry considerations require that such a displacement can occur only for totally
symmetric modes (unless the molecular symmetry is changed in the excited state). The larger the
displacement kQ∆ is the higher the non-orthogonality and hence the ρσA – term contribution will
be. On the other hand, FC scattering intensity is also strongly dependent on the product of the ρ -
and σ -components of the electronic transition moment in the vibrational equilibrium position
0
,
0
, σρ GRGR MM . In summary, the FC scattering mechanism particularly accounts for totally symmetric
vibrational modes (non-orthonogality of wavefunctions) that are coupled to electric-dipole allowed
electronic transitions (high values for 0
,
0
, σρ GRGR MM ).
In equations {2.2.1} and {2.2.3} the summation of vibrational states is only restricted to the one
resonant excited electronic state R . In ρσB – term scattering, however, coupling to another
electronic transition is involved. The crucial parameters here are the first derivatives of the ρ - and
σ -components of the electronic transition moment '
,ρGRM and '
,σGRM . Their values may exceed
those of 0
,ρGRM and 0
,σGRM if the resonant electronic state R can gain absorption strength from
another electronic state S via kQ by so-called Herzberg-Teller vibronic coupling. The stronger the
transition to the state S is and the closer the energies of states R and S are the larger '
,ρGRM
and '
,σGRM will be. ρσB – term scattering may occur for both totally and non-totally symmetric
vibrational modes. However, it can be shown that the ρσB – term is only non-zero for totally
symmetric modes, if the states R and S are of the same symmetry. This is usually not the case
for two energetically nearby electronic states [40]. Therefore, the ρσB – term particularly accounts
for non-totally symmetric vibrational modes and weak electronic transitions that may couple to a
nearby strong one.

Theoretical Background – Surface Enhanced Raman Spectroscopy (2.3)
12
2.3 Surface Enhanced Raman Spectroscopy
In the 1970ies it was discovered that molecules exhibit greatly enhanced Raman scattering if
adsorbed on rough surfaces of certain metals. Other photophysical and photochemical processes
are enhanced as well albeit to a different extent [45]. The so-called surface enhancement that can
be of several orders of magnitude, is metal- and wavelength-specific and also closely related to the
morphology of the metal surfaces [4, 44]. Even though surface enhanced Raman (SER)
spectroscopy could be demonstrated using transition metals [125-127, 187], it mainly relies on the
coinage metals gold, silver and copper, which exhibit the best performance as optically active
support materials [128, 187]. Among them, silver support materials provide by far the highest
plasmonic electromagnetic field enhancements throughout the visible and near-infrared region and
are therefore best suited for SER spectroscopy from the optical point of view [4]. Gold and copper
substrates only provide surface enhancement above 520 nm [4].
There are several methods for the preparation of a roughness in the nm-scale (10 – 100 nm),
which was found to be necessary. In this work, a standard electrochemical roughening procedure
of solid ring shaped silver electrodes was employed, other methods include chemical or vapour
deposition on appropriate solid support materials [41, 42]. The SER effect is also observed upon
adsorption on silver and gold nanoparticles in colloidal solutions [43, 184]. The application of rough
solid silver electrodes, however, allows potential-dependent SER-spectroscopic studies by
controlling the electrode potential. Due to its much lower oxidation potential, the applicable
potential range is quite narrow for silver as compared to gold electrodes, which are more
commonly used for electrochemistry [176-180]. Moreover, the intrinsic biocompatibility of silver is
lower than of gold as Ag+ ions that can harm immobilised biomolecules are formed at the metal-
solution interface [11, 156, 161]. In this respect, the properties of silver supports can be
significantly improved with biocompatible coating materials, enabling the application of these
devices also in the study of biomolecules [1-3, 5, 7, 8, 67] (see chapter 2.4).
Electrochemically roughened silver electrodes represent excellent platforms for SER
spectroscopy and provide control of electrode potential. With respect to colloidal solutions this
represents an important advantage for the study of redox processes. For the description of the
SER effect, however, it is useful to consider a colloidal metal particle first.
The SER effect can be understood on the basis of classical electromagnetic theory [45]. If the
radius 0r of a sphere-shaped metal particle is small with respect to the wavelength of the incident
light 0λ (Rayleigh limit), the electric field of the incident light )( 00 νEr
can induce an electric dipole
moment in the sphere and excite the surface plasmons, which are the collective vibrations of the
free electrons of the metal particle. This induced dipole moment causes an additional induced

Theoretical Background – Surface Enhanced Raman Spectroscopy (2.3)
13
electric field component )( 0νindEr
, which is normal to the surface in the near-field of the sphere.
The induced electric field component is given by:
{2.3.1}
+−
⋅=2)(~1)(~
2)()(0
0000 νε
νενν
r
rind EE
rr.
The quantity )(~0νε r is the frequency dependent dielectric constant of the metal divided by the
square of the refractive index of the surrounding medium solvn :
{2.3.1a} 2
000
)()()(~
solv
imrer
n
i νενενε
+= .
The total electric field )( 0νtotEr
, which is the sum of the incident and induced electric field, can
be expressed by:
{2.3.2} )()()()()( 0000000 ννννν Eindtot FEEEE ⋅=+=rrrr
.
It can be easily seen from equation {2.3.1} and {2.3.1a} that the enhancement factor )( 0νEF ,
becomes large when the real part of the frequency dependent dielectric constant )( 0νε re
approaches -2 and the imaginary part )( 0νε imi , which is a measure for losses in the solid related to
absorption, is small. These conditions are particularly well matched for silver around 400 nm. The
considerations for the enhancement of the electric field of the incident light may also account for
the electric field of the Raman scattered light )( 0 kRaE νν ±r
, which is proportional to )( 0νtotEr
. Due to
shifted frequencies, however, the magnitude of the field enhancement )( 0 kEF νν ± may be different
from )( 0νEF . Because both the electric field of the incident and Raman scattered light are
enhanced and the intensity of light scattering is proportional to the square of the electric field, the
SER effect may yield enormous signal enhancements. The enhanced electric field vector is
directed normal to the metal plane. Since the metal plane is a particle or a rough surface, all
possible directions are included on the macroscopic view. Therefore, SER signals are always
depolarised.
The considerations for small colloidal particles can be principally adopted for the description of
other surface morphologies including electrochemically roughened silver surfaces used in this work
(see chapter 3.2). The morphology of an electrochemically roughened silver surface can be

Theoretical Background – Electrochemical Interface at the Bare Silver Electrode (2.4)
14
approximately modelled by connected semi-spheres with a broad distribution of radii in the range
between 20 – 200 nm. It was shown that the plasmon resonance frequency of particles with radii
above the Rayleigh-limit ( 00 λ<<r ) is shifted to the red with increasing radii [181-183]. Therefore,
the experimentally observed wavelength dependent surface enhancement for such a device is very
broad and may cover the whole spectral range between the UV and IR region [4].
The electromagnetic theory implies that the surface enhancement is not restricted to directly
adsorbed molecules. In fact, molecules that are not adsorbed but situated in close proximity of
SER-active surfaces also experience the enhancement effect. The magnitude of surface
enhancement of Raman scattering, expressed by the enhancement factor SERF , decays with the
distance dependence of dipole-dipole interactions. The enhancement )(dFSER that a molecule at a
distance d from a spherical particle with the radius 0r experiences can be expressed by
{2.3.2}
12
0
0)0()(
+⋅=
dr
rFdF SERSER ,
with )0(SERF representing the enhancement factor when directly adsorbed on the surface. The
distance dependence is especially important for the study of biological molecules. In these studies
SER-active metal surfaces are often covered by biocompatible coatings to prevent denaturation
and/or inactivation of the biomolecule in the adsorbed state. The thickness of these coatings is
typically between 1 and 5 nm. At these distances the surface enhancement from particles with radii
in the range 20 – 100 nm is significantly decreased but still sufficiently strong to be utilised.
It should be noted that also in surface enhanced Raman spectroscopic experiments the
resonance Raman effect may apply. If the exciting radiation is in resonance with an electronic
transition of the molecule and the surface plasmons of the SER substrate, the molecular (RR) and
surface plasmon (SER) resonance enhancement mechanisms will sum up resulting in very high
sensitivity and a two-fold selectivity, because only the cofactor of only the adsorbed proteins are
probed with surface enhanced resonance Raman (SERR) spectroscopy [43, 172].
2.4 Electrochemical Interface at the Bare Silver Electrode
A bare silver surface has a highly negative potential of zero charge ( pzcE around -0.7 V vs. SHE
[195, 196]) and is therefore positively charged in aqueous electrolyte solutions. The positive charge
is overcompensated by anions from the electrolyte solution that bind to the silver forming an

Theoretical Background – Self Assembled Monolayers of Alkanethiol Derivatives (2.5)
15
electric double layer on the surface (figure 2.4). Especially chloride, sulphate and phosphate ions
are known to have a high tendency for specific binding on silver.
Figure 2.4: A) Representation of the Helmholtz electric double layer at the bare silver/electrolyte interface.
Proteins can bind electrostatically to the positively charged silver surface or to the compact
anion-layer, respectively. However, most biomolecules will experience severe structural changes
upon adsorption and may lose their functionality [156, 163]. Here, the crucial parameter is the
surface charge density IFΦ , which is very high at the electrochemical interface of the bare silver
electrode. Moreover, chemical reactions between silver ions and the adsorbate can not be
excluded [156, 161]. These problems can be solved by using self assembled monolayers (SAMs)
that separate the biomolecule from the silver surface.
2.5 Self Assembled Monolayers of Alkanethiol Derivatives
Alkanethiole derivatives attach spontaneously from solution to silver and gold surfaces via
formation of strong covalent metal-sulphur bonds [9, 46]. This process can be described by the
Langmuir or Frumkin adsorption isotherm and takes place within millisecond to few minutes,
resulting in a monolayer of chemisorbed organic molecules on the metal surface. In a second step,
the monolayer reorganises to form a compact monolayer [46]. This formation of a so-called self
assembled monolyer (SAM) takes place within several hours. The driving force for the
reorganisation is thermodynamic energy optimisation by hydrophobic interactions between the
alkyl-chains [9]. The alkanethiol molecules can have an additional functional group X
(e.g. X = -NH2, -COOH, -OH) in the terminal ω-position.
It was shown that SAMs may facilitate immobilisation of proteins under preservation of their
native structure and functionality [3]. The rational choice of a certain type of SAM can facilitate the
adsorption of a particular biomolecule in the desired manner. The surface charge density IFΦ may
be strongly decreased on a SAM with respect to the bare electrode. Carboxyl-terminated SAMs
(X = -COOH), for instance, are mostly protonated at pH 7.0 (vide supra) and provide, therefore, a
slightly negatively charged biocompatible surface. This may facilitate the immobilisation of cationic
Theoretical Background – Self Assembled Monolayers of Alkanethiol Derivatives (2.5)
16
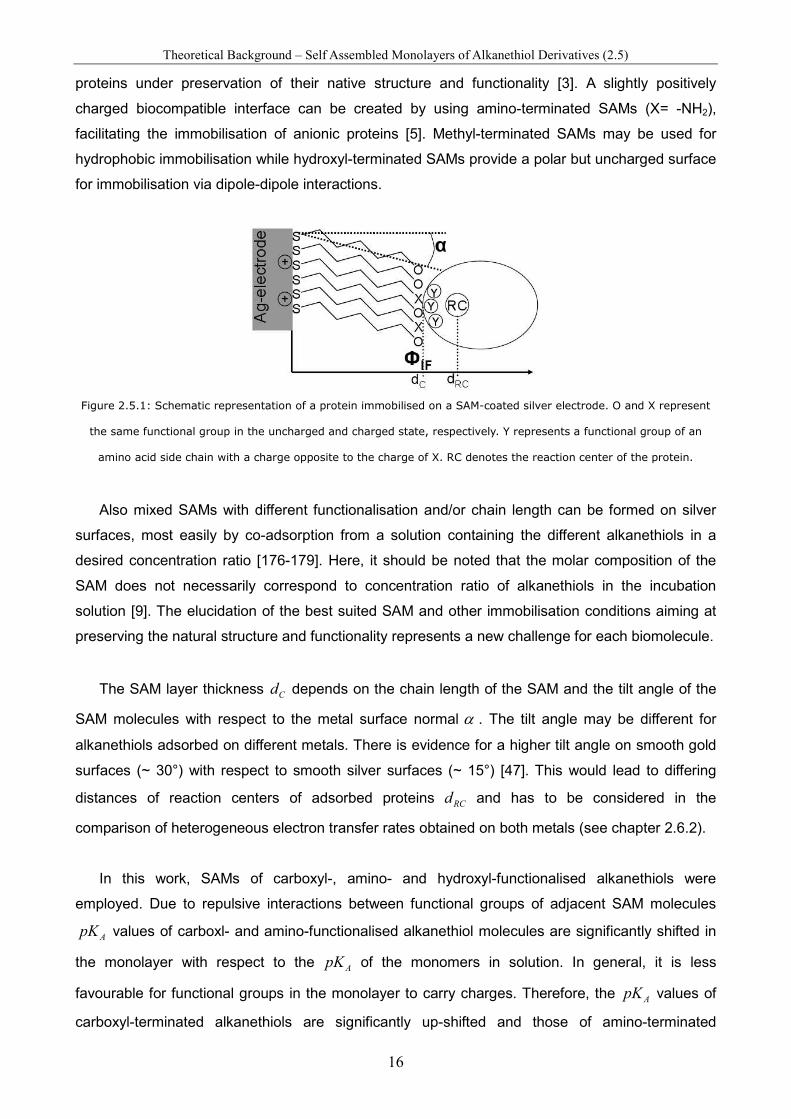
proteins under preservation of their native structure and functionality [3]. A slightly positively
charged biocompatible interface can be created by using amino-terminated SAMs (X= -NH2),
facilitating the immobilisation of anionic proteins [5]. Methyl-terminated SAMs may be used for
hydrophobic immobilisation while hydroxyl-terminated SAMs provide a polar but uncharged surface
for immobilisation via dipole-dipole interactions.
Figure 2.5.1: Schematic representation of a protein immobilised on a SAM-coated silver electrode. O and X represent
the same functional group in the uncharged and charged state, respectively. Y represents a functional group of an
amino acid side chain with a charge opposite to the charge of X. RC denotes the reaction center of the protein.
Also mixed SAMs with different functionalisation and/or chain length can be formed on silver
surfaces, most easily by co-adsorption from a solution containing the different alkanethiols in a
desired concentration ratio [176-179]. Here, it should be noted that the molar composition of the
SAM does not necessarily correspond to concentration ratio of alkanethiols in the incubation
solution [9]. The elucidation of the best suited SAM and other immobilisation conditions aiming at
preserving the natural structure and functionality represents a new challenge for each biomolecule.
The SAM layer thickness Cd depends on the chain length of the SAM and the tilt angle of the
SAM molecules with respect to the metal surface normal α . The tilt angle may be different for
alkanethiols adsorbed on different metals. There is evidence for a higher tilt angle on smooth gold
surfaces (~ 30°) with respect to smooth silver surfaces (~ 15°) [47]. This would lead to differing
distances of reaction centers of adsorbed proteins RCd and has to be considered in the
comparison of heterogeneous electron transfer rates obtained on both metals (see chapter 2.6.2).
In this work, SAMs of carboxyl-, amino- and hydroxyl-functionalised alkanethiols were
employed. Due to repulsive interactions between functional groups of adjacent SAM molecules
ApK values of carboxl- and amino-functionalised alkanethiol molecules are significantly shifted in
the monolayer with respect to the ApK of the monomers in solution. In general, it is less
favourable for functional groups in the monolayer to carry charges. Therefore, the ApK values of
carboxyl-terminated alkanethiols are significantly up-shifted and those of amino-terminated
Theoretical Background – Electron Transfer Theory (2.6)
17
alkanthiols are significantly down-shifted upon formation of a monolayer [144, 145-150]. For
example the ApK of a mercaptoundecanoic acid SAM on a gold electrode is ~5.5, which is about
two units higher than for the molecules in solution. Moreover, it should be noted that ApK shifts
are larger with increasing chain lengths [145] and strongly depend on the applied electrode
potential [146].
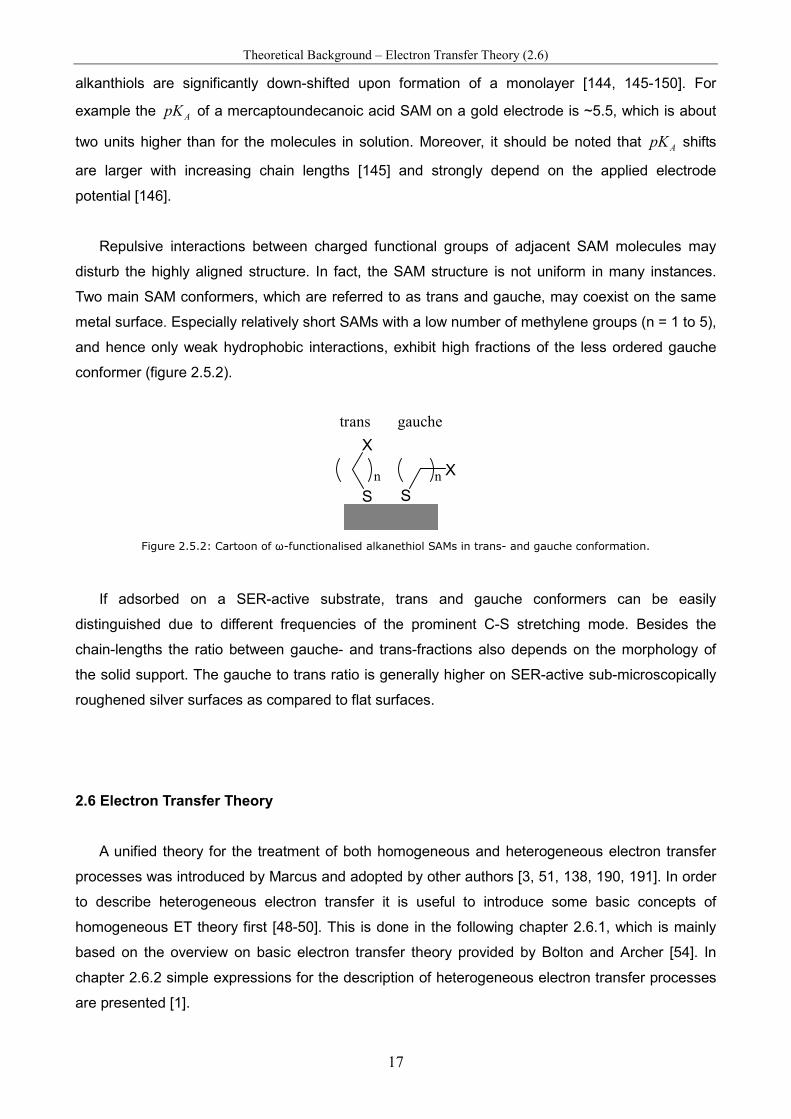
Repulsive interactions between charged functional groups of adjacent SAM molecules may
disturb the highly aligned structure. In fact, the SAM structure is not uniform in many instances.
Two main SAM conformers, which are referred to as trans and gauche, may coexist on the same
metal surface. Especially relatively short SAMs with a low number of methylene groups (n = 1 to 5),
and hence only weak hydrophobic interactions, exhibit high fractions of the less ordered gauche
conformer (figure 2.5.2).
S
X
S
X
trans gauche
n n
Figure 2.5.2: Cartoon of ω-functionalised alkanethiol SAMs in trans- and gauche conformation.
If adsorbed on a SER-active substrate, trans and gauche conformers can be easily
distinguished due to different frequencies of the prominent C-S stretching mode. Besides the
chain-lengths the ratio between gauche- and trans-fractions also depends on the morphology of
the solid support. The gauche to trans ratio is generally higher on SER-active sub-microscopically
roughened silver surfaces as compared to flat surfaces.
2.6 Electron Transfer Theory
A unified theory for the treatment of both homogeneous and heterogeneous electron transfer
processes was introduced by Marcus and adopted by other authors [3, 51, 138, 190, 191]. In order
to describe heterogeneous electron transfer it is useful to introduce some basic concepts of
homogeneous ET theory first [48-50]. This is done in the following chapter 2.6.1, which is mainly
based on the overview on basic electron transfer theory provided by Bolton and Archer [54]. In
chapter 2.6.2 simple expressions for the description of heterogeneous electron transfer processes
are presented [1].
Theoretical Background – Electron Transfer Theory – Homogeneous ET (2.6.1)
18
2.6.1 Homogeneous Electron Transfer
The classical Marcus theory is based on classical transition state theory, where a reaction
coordinate is introduced and the potential energy surface of the reactant and product states is each
reduced to a one-dimensional profile. In classical Marcus theory reactant and product states are
represented in a Gibbs energy space and their Gibbs energy profiles are approximated as
parabolas with similar shape. The parabolas are shifted along the reaction coordinate and may
also be shifted in Gibbs energy according to the 0G∆ -value of the ET reaction. The terms reactant
and product states refer to an electron donor-acceptor complex before and after the ET reaction,
respectively ( AD / and −+ AD / ). ET theory describes the rate constant ETk of the actual ET
reaction ( −+→ ADAD ETk // ). The observed ET rate constant, however, may be limited by the
formation and/or dissociation of the donor-acceptor complex or other processes that are coupled to
the ET reaction [3].
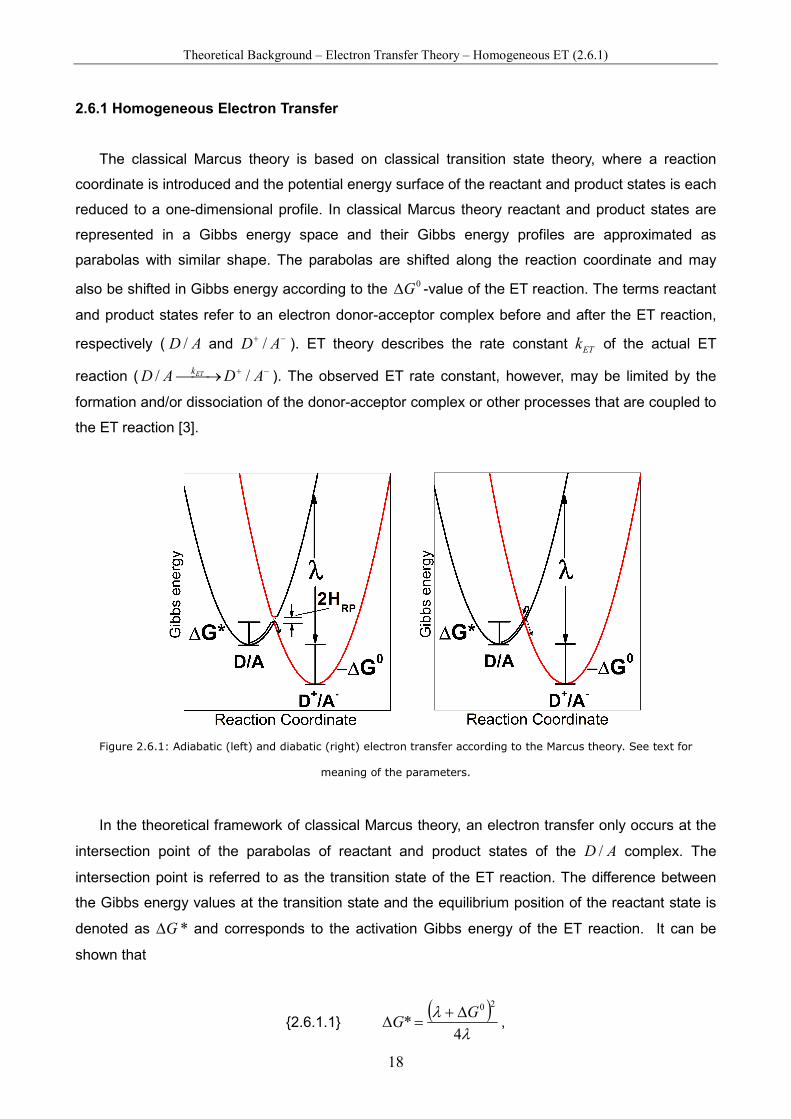
Figure 2.6.1: Adiabatic (left) and diabatic (right) electron transfer according to the Marcus theory. See text for
meaning of the parameters.
In the theoretical framework of classical Marcus theory, an electron transfer only occurs at the
intersection point of the parabolas of reactant and product states of the AD / complex. The
intersection point is referred to as the transition state of the ET reaction. The difference between
the Gibbs energy values at the transition state and the equilibrium position of the reactant state is
denoted as *G∆ and corresponds to the activation Gibbs energy of the ET reaction. It can be
shown that
{2.6.1.1} ( )
λλ
4*
20GG
∆+=∆ ,
Theoretical Background – Electron Transfer Theory – Homogeneous ET (2.6.1)
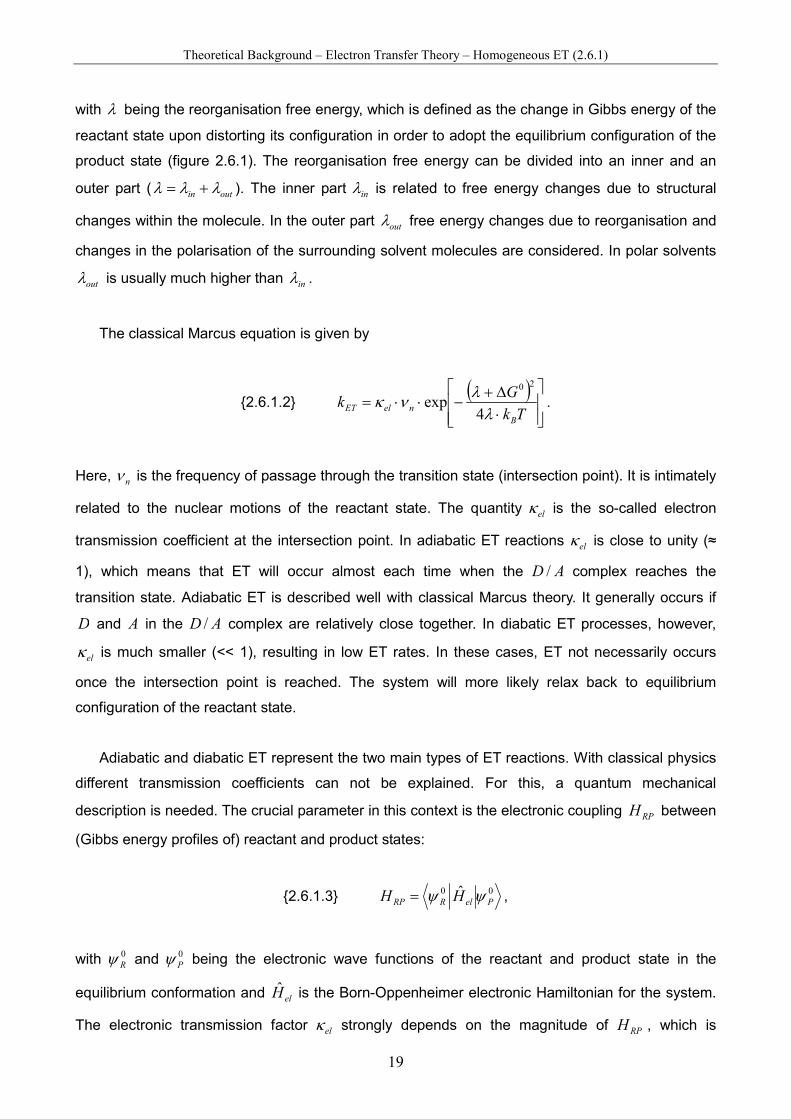
19
with λ being the reorganisation free energy, which is defined as the change in Gibbs energy of the
reactant state upon distorting its configuration in order to adopt the equilibrium configuration of the
product state (figure 2.6.1). The reorganisation free energy can be divided into an inner and an
outer part ( outin λλλ += ). The inner part inλ is related to free energy changes due to structural
changes within the molecule. In the outer part outλ free energy changes due to reorganisation and
changes in the polarisation of the surrounding solvent molecules are considered. In polar solvents
outλ is usually much higher than inλ .
The classical Marcus equation is given by
{2.6.1.2} ( )
⋅∆+
−⋅⋅=Tk
Gk
B
nelET λλ
νκ4
exp
20
.
Here, nν is the frequency of passage through the transition state (intersection point). It is intimately
related to the nuclear motions of the reactant state. The quantity elκ is the so-called electron
transmission coefficient at the intersection point. In adiabatic ET reactions elκ is close to unity (≈
1), which means that ET will occur almost each time when the AD / complex reaches the
transition state. Adiabatic ET is described well with classical Marcus theory. It generally occurs if
D and A in the AD / complex are relatively close together. In diabatic ET processes, however,
elκ is much smaller (<< 1), resulting in low ET rates. In these cases, ET not necessarily occurs
once the intersection point is reached. The system will more likely relax back to equilibrium
configuration of the reactant state.
Adiabatic and diabatic ET represent the two main types of ET reactions. With classical physics
different transmission coefficients can not be explained. For this, a quantum mechanical
description is needed. The crucial parameter in this context is the electronic coupling RPH between
(Gibbs energy profiles of) reactant and product states:
{2.6.1.3} 00 ˆPelRRP HH ψψ= ,
with 0
Rψ and 0
Pψ being the electronic wave functions of the reactant and product state in the
equilibrium conformation and elH is the Born-Oppenheimer electronic Hamiltonian for the system.
The electronic transmission factor elκ strongly depends on the magnitude of RPH , which is

Theoretical Background – Electron Transfer Theory – Homogeneous ET (2.6.1)
20
relatively large in adiabatic ET processes (>0.025 eV) [52]. In these cases the Gibbs energy
surfaces of reactant and product states interact as indicated in figure 2.6.1 (left) and electrons can
be readily transferred. The gap in the intersection region that arises from the coupling corresponds
to 2 RPH . The electronic coupling reaches a maximum value 0
RPH at the so-called van der Waals
donor-acceptor distance 0d . In case of diabatic ET, however, RPH is small and depends
exponentially on the donor-acceptor distance ( DAd ):
{2.6.1.4}
−−⋅≈
2
)(exp)( 00 dd
HdH DARPDARP
β.
The parameter β is referred to as the tunnelling decay parameter (see also equation {2.6.2.1}). As
a result of equation {2.6.1.4} an exponential dependence of ETk on DAd is observed.
In the quantum mechanical treatment, the electron transition probabilities from all reactant to all
product vibrational states have to be considered for the determination of ETk . Here, the Franck
Condon principle for vibronic transitions applies. The overlap of certain vibrational wavefunctions j
and i of reactant and product states (including solvent vibrational modes), respectively, determines
the probability of this particular ET process. The Franck Condon factors ijFC ij =)( have to be
weighted by their particular Boltzmann probability )( RjEP , where RjE is the energy of the
vibrational state j of the reactant state. These considerations are reflected in Fermi’s ‘Golden
Rule’ [34, 53], which is derived from time-dependent second order perturbation theory. Applied for
the description of an electron transfer in the AD / complex it leads to the following expression:
{2.6.1.5} ( ) ( )[ ] )()(2 22
RjPi
ij
RjijRPET EEEPFCHk −= ∑ δπh
,
where h is the reduced Planck constant and δ is a Dirac delta function that needs to be included
in order to ensure energy conservation (i.e. δ = 0 if RjPi EE ≠ ; δ = 1 if RjPi EE = ). Some
reasonable approximations can be made in order to simplify the expression in equation {2.6.1.5}.
Since solvent vibrational modes usually have low energies, they are often treated classically, which
leads to the so-called semi-classical Marcus equation [49]. Moreover, the relevant high frequency
vibrational modes of the molecule can be represented by a single averaged mode with the
frequency ν leading to the following expression [50]:

Theoretical Background – Electron Transfer Theory – Heterogeneous ET (2.6.2)
21
{2.6.1.6} ( ) ∑∞
=
−−
+∆+−
=
0
202/12
4
)(exp
!)4(
2
m Bout
out
mS
BoutRPETTk
mhG
m
SeTkHk
πλνλ
πλπh
,
with m being an integer and 1)( −= νλ hS in . For ET reactions, in which λ<∆− 0G (which
corresponds to the so-called normal ET region), equation {2.6.1.6} can be simplified to the “high-
temperature limit” of the semi-classical Marcus expression:
{2.6.1.7} ( )
∆+−= −
Tk
GTkHk
B
BRPET λλ
πλπ
4
)(exp)4(
2 202/12
h.
Fast ET rections may be limited by solvent dynamics. To account for this possibility, the
expression in equation {2.6.1.7} can be modified by multiplication with the factor [57]:
{2.6.1.8}
+ g1
1,
where g is an adiabaticity factor, which is defined as )/( sopD
D
ET Fkg εετ= . Here, D
ETk
corresponds to the diabatic ET rate constant at 0=g and F is a function of the ratios of outin λλ /
and TkG B/*∆ . The quantity Dτ is the constant field dielectric relaxation time of the solvent and
opε and sε are its optical and static dielectric constant. It should be noted that Dτ , and hence the
ET rate, is solvent viscosity dependent.
2.6.2 Heterogeneous Electron Transfer
An expression for electron tunnelling between an electrode and an adsorbed redox site, i. e.
diabatic heterogeneous ET, can be formulated as [138, 190, 191]:
{2.6.2.1} ( ) ( )
+⋅⋅−⋅⋅⋅≈
Tk
eerfcdHk
B
RCRPET ληλ
βρπ
η4
exp)(20
h,
where η is the overpotential, Bk is the Boltzmann constant, e is the elementary charge and RCd is
the distance between the redox-center (RC) of the biomolecule and the electrode surface (see
figure 2.6.2). The parameter ρ is the density of states of the solid (metal) electrode, since, unlike
isolated systems like atoms or molecules, the density distributions of solid (metal) electrodes are

Theoretical Background – Electron Transfer Theory – Heterogeneous ET (2.6.2)
22
not discrete but continuous.
The complementary error function erfc is defined as:
{2.6.2.1 a} ∫∞
−=x
dttxerfc )exp(2
)( 2
π.
The overpotential η is defined as the difference between the applied electrode potential E and
the midpoint potential of the adsorbate mE , mEE −=η . It corresponds to the driving force of the
heterogeneous ET process and thus replaces 0G∆ in the expressions for homogeneous ET.
Electron transfer between electrodes and redox-active biomolecules that are separated by
relatively long (≥ 10 methylene units in the alkyl-chain) insulating SAMs has diabatic character. As
outlined in the previous chapter, diabatic ET occurs via electron tunnelling and shows exponential
distance dependence. In case of heterogeneous ET between a SAM-coated silver electrode and
an adsorbed biomolecule the electron tunnels across the SAM (see figure 2.5.1). The distance
between the electrode and the reaction center in the protein, RCd , depends on the properties of the
adsorbed biomolecule and its orientation with respect to the surface and the SAM layer thickness.
Here, it should be noted that electron transfer between the reaction center of the protein and the
binding region at the protein surface may take place according to a mechanism other than electron
tunneling.
It should be further noted that heterogeneous electron transfer of heme proteins may be
coupled to various other processes such as proton transfer, conformational transitions, ligand
exchange at the heme cofactor or rearrangement of the donor-acceptor complex, respectively [3,
67, 191]. Only if it can be excluded that other processes than the actual electron tunnelling process
are rate limiting, diabatic hetrogeneous ET is described well with equation {2.6.2.1} [1, 3, 138, 190,
191]. A simplified expression for the ET rate at zero driving force (η = 0) is given by [1]:
{2.6.2.2} ( )RCET dAk ⋅−⋅= βexp)0( .
Here, the electronic coupling, density of states and other parameter are considered in a single pre-
exponential factor A . Relating the ET rate at a given overpotential to the rate at zero driving force
yields [1, 191]:
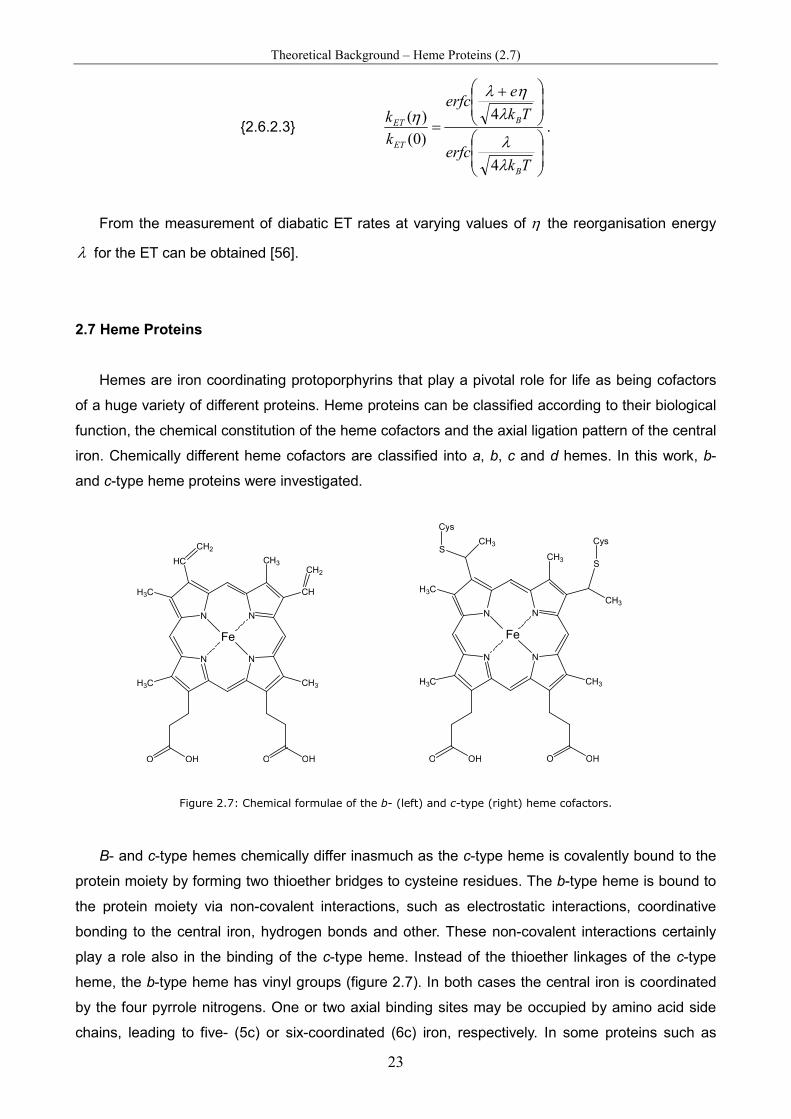
Theoretical Background – Heme Proteins (2.7)
23
{2.6.2.3}
+
=
Tkerfc
Tk
eerfc
k
k
B
B
ET
ET
λλ
ληλ
η
4
4
)0(
)(.
From the measurement of diabatic ET rates at varying values of η the reorganisation energy
λ for the ET can be obtained [56].
2.7 Heme Proteins
Hemes are iron coordinating protoporphyrins that play a pivotal role for life as being cofactors
of a huge variety of different proteins. Heme proteins can be classified according to their biological
function, the chemical constitution of the heme cofactors and the axial ligation pattern of the central
iron. Chemically different heme cofactors are classified into a, b, c and d hemes. In this work, b-
and c-type heme proteins were investigated.
N
N N
N
Fe
HC
CH2
CH3
CH
CH2
CH3H3C
H3C
O OH OHO
N
N N
N
CH3
CH3
CH3H3C
H3C
O OH OHO
CH3
S
Fe
Cys
S
Cys
Figure 2.7: Chemical formulae of the b- (left) and c-type (right) heme cofactors.
B- and c-type hemes chemically differ inasmuch as the c-type heme is covalently bound to the
protein moiety by forming two thioether bridges to cysteine residues. The b-type heme is bound to
the protein moiety via non-covalent interactions, such as electrostatic interactions, coordinative
bonding to the central iron, hydrogen bonds and other. These non-covalent interactions certainly
play a role also in the binding of the c-type heme. Instead of the thioether linkages of the c-type
heme, the b-type heme has vinyl groups (figure 2.7). In both cases the central iron is coordinated
by the four pyrrole nitrogens. One or two axial binding sites may be occupied by amino acid side
chains, leading to five- (5c) or six-coordinated (6c) iron, respectively. In some proteins such as

Theoretical Background – Heme Proteins (2.7)
24
peroxidases, an axial iron coordination site represents the binding site for target molecules. In b-
type heme proteins, both axial positions are usually occupied by nitrogens from histidine side
chains of the protein matrix. The axial positions of the heme iron of cytochrome c in its native
coordination, however, are occupied by a nitrogen atom of a histidine and a sulphur atom of a
methionine residue.
In general, the heme iron may
1. have different coordination pattern,
2. be in high- (HS) or low-spin (LS) state,
3. be in the oxidation state Fe2+ (reduced) or Fe3+ (oxidised) and
4. undergo changes in its coordination pattern, spin and oxidation state, respectively.
Structural and associated electronic properties of the heme cofactor are closely related to the
functioning of the protein and can be studied by RR and surface enhanced RR spectroscopy.
Different heme proteins were investigated in this work, two of which are the human sulphite
oxidase (chapter 6) and the membrane bound hydrogenase from Ralstonia eutropha H16 (chapter
7). Cytochrome c, which was used as a model protein in the study of silver-gold hybrid devices for
spectro-electrochemistry, is briefly presented in chapter 5.2 and chapter 8.2.

Instrumentation – Excitation Source (3.1)
25
3 Instrumentation
An experimental setup for Raman spectroscopy contains basic elements, which are the
monochromatic radiation source (usually a laser), the sample arrangement, a unit for analysing the
scattered radiation, an electronic detector unit (nowadays usually a charge coupled device camera,
CCD camera) and a control unit for data acquisition (computer) (figure 3.4) [1]. Additional optical
and/or electronic equipment may be required for specific Raman experiments. The experimental
setup that was used for Raman spectroscopic and electrochemical experiments is described in this
chapter.
3.1 Excitation Source
Lasers are powerful sources for monochromatic radiation and, therefore, they are suited as
excitation sources in Raman spectroscopy. Both pulsed and continuous wave (cw) lasers can be
used. Pulsed lasers provide a photon flux per pulse that is several orders of magnitude higher than
the photon flux of a cw-laser [1]. Since a high photon flux may induce unwanted photochemical
reactions and/or degradation of biomolecules, the use of cw-lasers is better suited for studying
proteins. Using cw-lasers may also be advantageous for certain time resolved spectroscopic
experiments (see chapter 4.2.3), because laser pulses with defined and adjustable duration and
repetition time can be created by gating the beam, e.g. with pockels cells. A pockels cell is a
versatile electro-optical device that contains a voltage-controlled birefringent crystal of well chosen
dimension and orientation [60]. The direction, to where an incident laser beam that passes through
a pockels cell is refracted, changes as a function of applied voltage. As a consequence, for a given
laser polarisation a voltage of minimum and maximum light throughput in the direction of the optical
pathway of the Raman setup can be set, respectively. By switching between these two voltages
laser pulses down to the nanosecond time scale can be created out of a cw-laser source.
Noble gas ion lasers emit a large number of discrete cw-laser lines that are appropriate for
Raman spectroscopic studies. The emitted laser light is highly polarised perpendicular to its
propagation direction [1]. In this study, mainly the 413 nm line a Kr+-ion cw-laser (Coherent Innova
400c, Coherent Innova 300c) was used as excitation source. Additionally, the 514 nm line of
Ar+-ion cw-lasers (Coherent Innova 400c and Coherent Innova 70c) was used in some
experiments.
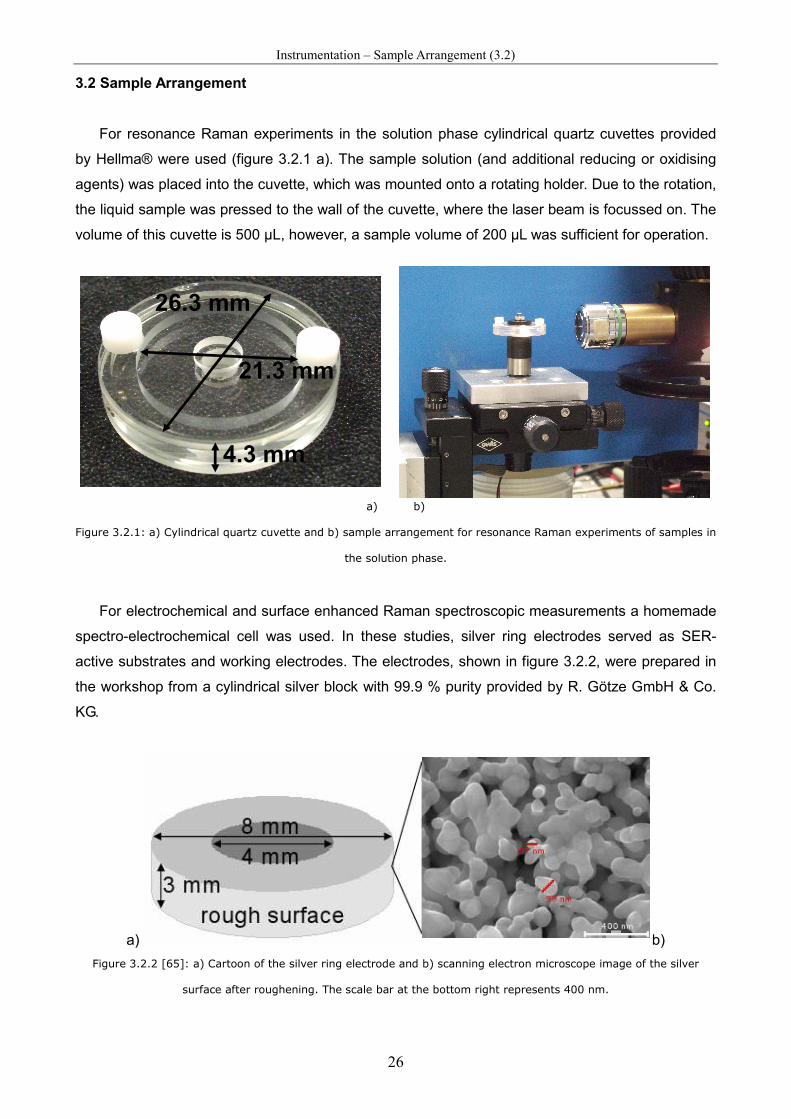
Instrumentation – Sample Arrangement (3.2)
26
3.2 Sample Arrangement
For resonance Raman experiments in the solution phase cylindrical quartz cuvettes provided
by Hellma® were used (figure 3.2.1 a). The sample solution (and additional reducing or oxidising
agents) was placed into the cuvette, which was mounted onto a rotating holder. Due to the rotation,
the liquid sample was pressed to the wall of the cuvette, where the laser beam is focussed on. The
volume of this cuvette is 500 µL, however, a sample volume of 200 µL was sufficient for operation.
a) b)
Figure 3.2.1: a) Cylindrical quartz cuvette and b) sample arrangement for resonance Raman experiments of samples in
the solution phase.
For electrochemical and surface enhanced Raman spectroscopic measurements a homemade
spectro-electrochemical cell was used. In these studies, silver ring electrodes served as SER-
active substrates and working electrodes. The electrodes, shown in figure 3.2.2, were prepared in
the workshop from a cylindrical silver block with 99.9 % purity provided by R. Götze GmbH & Co.
KG.
a) b)
Figure 3.2.2 [65]: a) Cartoon of the silver ring electrode and b) scanning electron microscope image of the silver
surface after roughening. The scale bar at the bottom right represents 400 nm.
21.3 mm
26.3 mm
4.3 mm

Instrumentation – Sample Arrangement (3.2)
27
The modified electrodes were mounted onto the rotating shaft of a homemade electrode holder.
The lateral surface of the electrode, which is exposed to the electrolyte solution, is rough,
chemically modified and used for protein immobilisation. The laser light is focussed on the lateral
surface of the electrode with a long working distance objective. The smooth upper surface of the
ring electrode is used for electrical contact with the holder. Constant rotation of the electrode
ensures that individual proteins are not exposed for too long to the harmful laser light.
a)
b)
Figure 3.2.3: a) Front view picture of the spectro-electrochemical cell. b) Schematic representation of the
electrochemical cell.
Spectro-electrochemical cells with a volume of about 10 mL can be mounted onto the holder as
shown in figure 3.2.3a. The cell contained the modified Ag ring as the working electrode, a Ag/AgCl
3 M KCl reference electrode (Dri-Ref 2 from World Precision Instruments, +210 mV vs. standard
hydrogen electrode), and a platinum ring shaped counter electrode. The applied electrode potential
is controlled by a potenstiostat (EG&G 273 and 263A). The spectro-electrochemical cell has
additional entrances, which allow for purging the electrolyte solution with gases and filling of
chemicals (e.g. the substrate of an immobilised enzyme). The presence of oxygen could disturb
the measurements, especially since oxygen is reduced at the electrode at potentials < -0.25 V (vs.
Ag/AgCl 3M KCl). Therefore, the spectro-electrochemical cell was de-aerated with highly purified
argon in most cases.
Instrumentation – Electrochemical Setup (3.3) – Spectroscopic and Spectro-Electrochemical Setup (3.4)
28
3.3 Electrochemical Setup
For the roughening of the silver ring electrodes a computer controlled CH instrument 660 C
(Austin, USA) was used. A special homemade electrochemical cell containing a cylindrical Pt
counter electrode with a high surface area was used for homogeneous roughening of the solution
exposed silver surface. A stirring bar was placed on the bottom of the electrochemical roughening
cell.
With the computer controlled potentiostat various electrochemical techniques can be
employed. Since it is possible to connect not only the roughening cell but also the spectro-
electrochemical measuring cell to the computer controlled potentiostat, electrochemical (CH
instrument 660 C, Austin, USA) and spectro-electrochemical (EG&G 273 and 263A) experiments
were performed subsequently on the same system with different potentiostats.
3.4 Spectroscopic and Spectro-Electrochemical Setup
Both SER- and RR spectra were measured with confocal Raman microscopes in
backscattering geometry (LabRam HR-800, Jobin Yvon) equipped with liquid nitrogen cooled back-
illuminated charged coupled device (CCD) detectors. The setup of spectroscopic and spectro-
electrochemical experiments is depicted in figure 3.4.
The laser passes through two synchronised pockels cells (p.cell, Linos LM 0202) before it hits
the sample. The pockels cells and the potentiostat are controlled by a homemade electronic 4-
channel pulse delay generator. In this way defined laser pulses and potential jumps can be
employed as needed in time resolved potential controlled spectroscopic measurements (see
chapter 4.2.3). The laser is highly focussed onto the sample by the objective (O) of the microscope
(Mic). The scattered light is collected by the same objective in 180° backscattering geometry. Due
to focussing of the light onto a very tiny area and the resultant high local photon flux, relatively low
laser powers have to be used. A Nikon 20 x objective with a working distance of 20.5 mm and a
numeric aperture of 0.35 was used throughout all Raman spectroscopic experiments. The laser
power on the sample was typically 1 – 2 mW.
Notch filters (NF) only reflect light in a narrow wavelength range and are transmissive for all
other wavelengths. They have to be selected for the respective wavelength of the incident laser.
With the appropriate choice of filter, inelastically scattered radiation passes through the filter and

Instrumentation – Spectroscopic and Spectro-Electrochemical Setup (3.4)
29
the strong Rayleigh scattering is filtered out. The confocal pinhole (CP) ensures that only the
scattered radiation at the focus of the objective passes to the lens (L), which focuses the light
through the entrance slit (S) of the Czerny-Turner type monochromator.
Figure 3.4 [61]: SERR spectro-electrochemical setup
p.cell – pockels cell, M – mirror, Mic – microscope, O – objective, PH – pin hole, CP – confocal pin hole, NF – notch
filter, PF – plasmaline filter, G – grating, L – lens, Mc – collimating mirror, Mf – focussing mirror, S – slit.
Two different LabRam spectrometers of similar design but with different diffraction gratings
were used in this study. The first spectrometer was operated with a 2400 1/mm grating and was
equipped with a liquid nitrogen cooled CCD with 2048 pixels. In most cases this system was
operated with a CCD binning factor 2 affording a spectral resolution of 2 cm-1 and an increment per
data point of 0.57 cm-1 at 413 nm excitation. The second LabRam spectrometer was used with a
1200 1/mm grating and was coupled to a similar CCD with 2048 pixels. This system, however, was
operated with a CCD binning factor of 1 and afforded a spectral resolution of 1 cm-1 with an
increment per data point of 0.75 cm-1. Both spectrometers were controlled by the LabSpec®
software (version 4.07 and version 5.45.09) and calibrated prior to measurements by the strong
mercury lines at 435.833 nm (in case of measurements with 413 nm excitation) and 546.074 nm
(at 514 nm excitation).

30

Methods – Resonance Raman Spectroscopy of Heme Proteins (4.1)
31
4 Methods
4.1 Resonance Raman Spectroscopy of Heme Proteins
Raman and IR spectra of complex molecules such as heme proteins contain a large number of
vibrational modes in the range between 200 and 1800 cm-1. Due to many overlapping bands in this
region, an assignment of bands to certain normal modes is impossible. Since the proteins studied
in this work, however, contain chromophoric heme cofactors, Raman spectroscopy can be
employed in the resonance mode. With this technique, only the vibrational modes of the heme
cofactor exhibit up to 106-fold increased band intensities. As a result RR spectra contain much less
bands that can be clearly assigned to specific cofactor vibrational modes [185].
Despite minor differences all heme proteins exhibit certain common features in their UV-Vis
absorption and resonance Raman spectra. These are discussed in the following for human sulphite
oxidase (hSO), which is a sulphite oxidising enzyme that was investigated within this work. The
hSO contains a cytochrome b5 subunit, which harbours a b-type heme. In figure 4.1.1 the UV-Vis
absorption spectrum of hSO in the reduced and oxidised state is shown. The absorption spectrum
of hSO in the visible range 400nm < λ < 700 is typical for heme proteins. No other cofactors
contribute to the absorption in that region, such that all absorption bands can be ascribed to
*ππ → electronic transitions of the heme cofactor [10].
375 400 425 450 475 500 525 550 575 600
(1)
π*
527
556
hSO oxidised hSO reduced
Ab
so
rpti
on
/ a
.u.
λλλλ / nm
423
413
π
(2)
Figure 4.1.1: UV-Vis absorption spectrum of hSO oxidase in the reduced (red) and oxidised (black) state. The inset
shows the underlying *ππ → electronic transitions according to the theory by Gouterman [10].
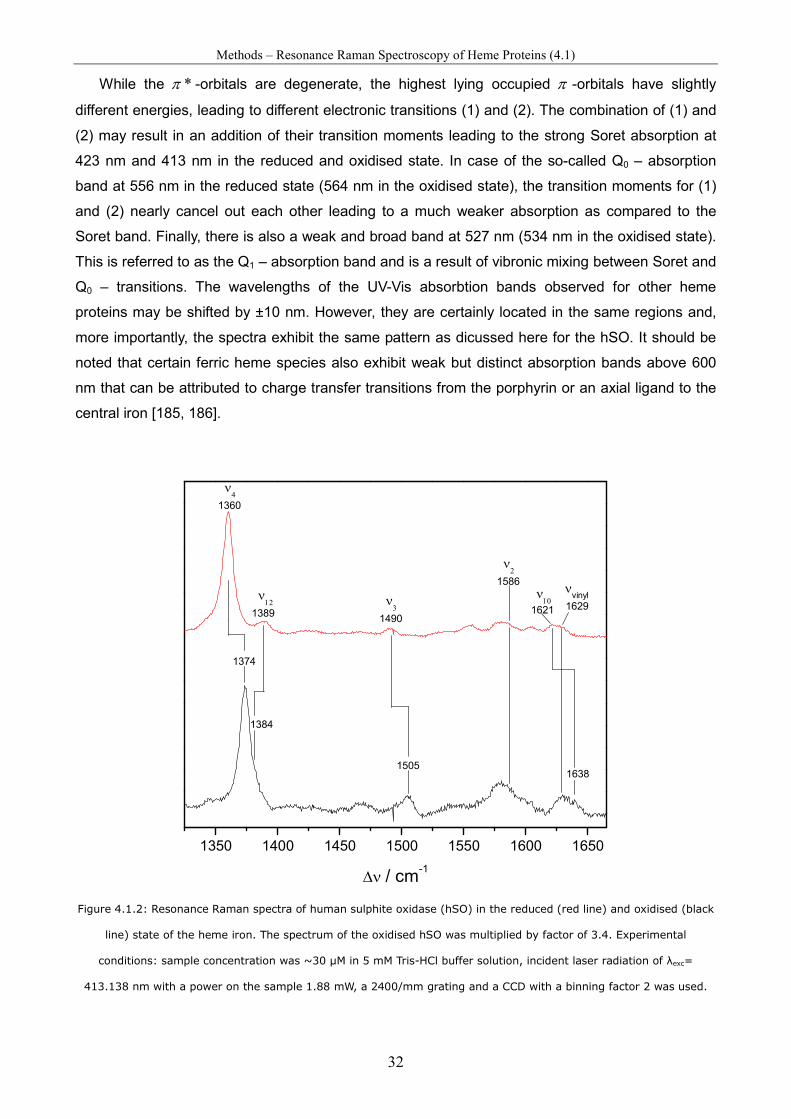
Methods – Resonance Raman Spectroscopy of Heme Proteins (4.1)
32
While the *π -orbitals are degenerate, the highest lying occupied π -orbitals have slightly
different energies, leading to different electronic transitions (1) and (2). The combination of (1) and
(2) may result in an addition of their transition moments leading to the strong Soret absorption at
423 nm and 413 nm in the reduced and oxidised state. In case of the so-called Q0 – absorption
band at 556 nm in the reduced state (564 nm in the oxidised state), the transition moments for (1)
and (2) nearly cancel out each other leading to a much weaker absorption as compared to the
Soret band. Finally, there is also a weak and broad band at 527 nm (534 nm in the oxidised state).
This is referred to as the Q1 – absorption band and is a result of vibronic mixing between Soret and
Q0 – transitions. The wavelengths of the UV-Vis absorbtion bands observed for other heme
proteins may be shifted by ±10 nm. However, they are certainly located in the same regions and,
more importantly, the spectra exhibit the same pattern as dicussed here for the hSO. It should be
noted that certain ferric heme species also exhibit weak but distinct absorption bands above 600
nm that can be attributed to charge transfer transitions from the porphyrin or an axial ligand to the
central iron [185, 186].
1350 1400 1450 1500 1550 1600 1650
1384
16381505
1360
∆ν / cm-1
1374
ν4
1629
νvinyl
1490
ν3 1621
ν10
1586
ν2
1389
ν12
Figure 4.1.2: Resonance Raman spectra of human sulphite oxidase (hSO) in the reduced (red line) and oxidised (black
line) state of the heme iron. The spectrum of the oxidised hSO was multiplied by factor of 3.4. Experimental
conditions: sample concentration was ~30 µM in 5 mM Tris-HCl buffer solution, incident laser radiation of λexc=
413.138 nm with a power on the sample 1.88 mW, a 2400/mm grating and a CCD with a binning factor 2 was used.

Methods – Resonance Raman Spectroscopy of Heme Proteins (4.1)
33
As indicated by the purple arrow in figure 4.1.1 RR and SERR spectra of heme proteins were in
this work almost exclusively measured using the 413 nm line of a Kr+-laser. Under resonance
conditions with the Soret absorption band, primarily totally symmetric vibrational modes are greatly
enhanced. The spectral properties of the heme cofactor can be discussed with reference to the D4h
point group. Naturally occurring heme cofactors always have lower symmetry due to different
porphyrin side chains and/or deviations from the planar porphyrin structure. Nevertheless the D4h
point group represents a reasonable approximation for the heme symmetry. With respect to this
point group hemes have nine totally symmetric modes that have A1g symmetry. These are referred
to as νi, i = 1, 2..., 9.
The νvinyl at 1629 cm-1 mainly includes the C=C stretching of the vinyl side chains and is
accordingly absent in c-type hemes. Some other non-totally symmetric modes such as the ν10, ν12
(both with B1g symmetry) also appear in the RR spectra upon Soret band excitation. The most
prominent band, however, is the totally symmetric ν4 mode at 1360 cm-1 and 1374 cm-1 in the
reduced and oxidised form, respectively. Like many other modes in the so-called fingerprint region
between 1300 cm-1 and 1700 cm-1, it mainly includes stretching coordinates of the tetrapyrroles
macrocycle. While the frequency of the ν4 represents a sensitive marker for the heme oxidation
state, the frequencies of other bands in this region were empirically shown to be correlated to the
core size of the porphyrin dCt-N. The core size, which is defined as the distance from the center of
the porphyrin core (Ct) to pyrrole nitrogens (N) sensitively depends on the axial coordination
pattern and the spin- and oxidation state of the heme iron. Hence, the frequencies of these bands
(ν2, ν3, ν10 and other) contain valuable structural information.
1450 1500 1550 1600 1650
1,96
1,98
2,00
2,02
2,04
2,06
ν10
ν2
Fe2+
5cHS
Fe3+
6cHS
dC
t-N
∆ν / cm-1
Fe2+
6cHS
Fe3+
5cHS
Fe2+
6cLS
Fe3+
6cLS
ν3
Figure 4.1.3: Vibrational band frequencies of ν2, ν3 and ν10 modes and porphrin core sizes for different heme species.
The RR spectra of hSO (figure 4.1.2) show the characteristic vibrational signature of a six-
coordinated low-spin (6cLS) heme in both the ferric and the ferrous form, as expected for a b-type
heme with bis-His axial ligation. The 6cLS conformation can be referred to as the native heme
conformation in hSO. It should be noted, however, that the signal intensity, and hence the

Methods – SERR Specroscopy of Heme Proteins (4.2) – Electrode Preparation (4.2.1)
34
resonance Raman cross section, of ferric and ferrous hSO are different. Since it is the most
prominent band in both oxidation states the v4 is best suited for determining the intensity ratio
under identical experimental conditions. This ratio is proportional to the ratio of the relative RR
cross section relativeσ of these modes for the native ferric hSO with respect to the native ferrous
species. Relative cross section parameters are needed for the evaluation of concentration ratios
from RR or SERR spectra of a mixture of different heme species.
4.2 Surface Enhanced Resonance Raman Spectroscopy of Heme Proteins
In the study of heme proteins immobilised on rough silver surfaces molecular and surface
plasmon resonance conditions are particularly well matched with 413 nm laser excitation. This
excitation line provides high quality vibrational spectra of heme proteins even at submonolayer
coverage within a few seconds of accumulation [3]. Therefore, surface enhanced resonance
Raman (SERR) spectroscopy represents a powerful technique for the study of heme proteins.
Moreover, using SAM-coated rough silver electrodes as SERR substrates opens up additional
possibilities. Not only potential controlled spectroscopic measurements are possible. Also
electrochemical experiments, such as protein film voltammetry, can be carried out on the same
system [5, 8, 12].
4.2.1 Electrode preparation
Cylindrical silver electrodes were polished with polishing sheets of three different grain sizes
(100 µm, 30 µm, 0.3 µm) going from rough to fine grains. The polishing sheets were purchased
from 3M®. The polished electrodes were subsequently immersed in pure water and ethanol and
treated in the ultrasonic bath for five minutes in each solution.
Prior to roughening, the electrode was subjected to a potential of E = -2 V (vs. Ag/AgCl, 3M
KCl) for 40s under stirring. The roughening procedure was employed in 0.1 M KCl electrolyte
solution using the roughening cell and the CH instrument 660 C. The roughening procedure
consists of three oxidation-reduction cycles at +0.32 V and -0.32 V, respectively, followed by an
additional reduction step at -0.5 V for 5 minutes (figure 4.2.1).
The electrochemically roughened silver ring electrodes are first gently rinsed with water (to
remove salt from the surface) and then with ethanol. They are then immersed for 8 – 16 hours in 1
– 2 M ethanol solutions of ω-functionalised alkanethiol molecules that form self assembled
monolayers (SAMs) on the roughened silver surface. In case of amino-terminated SAMs water was

Methods – Stationary Potential Controlled SERR Measurements (4.2.2)
35
added to the SAM solution in relation 1:4 (water : ethanol). The SAM-coated electrodes are
thoroughly rinsed with ethanol first and than with water and are immersed for 2 – 4 hours into a
solution that contains the sample protein at a concentration of ~0.5 µM. The electrode is
subsequently placed into the spectro-electrochemical cell and is ready to be measured.
0 100 200 300 400 500-1,5x10
-2
-1,0x10⁻²
-5,0x10⁻³
0,0
5,0x10⁻³
1,0x10⁻²
300 400 500-1,0x10
-4
-8,0x10⁻⁵
-6,0x10⁻⁵
-4,0x10⁻⁵
-2,0x10⁻⁵
0,0
-0.5 V
-0.3
2 V
0.3
2 V
-0.3
2 V
0.3
2 V
0.3
2 V
-0.3
2 V
I /
A
time / s
Figure 4.2.1: Current flow during the electrochemical roughening procedure. The inset shows the current flow during
the last reduction step ca. 100x enlarged.
The preparation of the silver-gold hybrid device is based on 11-aminoundecanethiol-coated
electrochemically roughened silver electrodes and is described in chapter 5.4.
4.2.2 Stationary Potential Controlled Measurements
With stationary potential controlled SERR spectroscopy the relative concentrations of oxidised
and reduced heme species for immobilised proteins are measured as a function of the applied
electrode potential E (see chapter 4.3). In this way, the midpoint potential mE and the number of
transferred electrons n can be determined according to the Nernst-equation:
{4.2.2} ox
redm
c
c
nF
RTEE ln−= ,
where R , T and F are the universal gas constant, temperature and Faraday constant,
respectively. The spectral contributions of different heme species must be clearly distinguishable
and relative cross section values must be known or at least reasonably estimated. One may

Methods –Time Resolved Potential Controlled SERR Measurements (4.2.3)
36
approximately assume that the relative cross section parameters for different heme species as
obtained with RR spectroscopy are similar in surface enhanced resonance Raman (SERR)
experiments [1]. The concentration ratios can then be plotted versus the applied electrode potential
and redox parameters can be extracted by fitting the Nernst-equation to the data.
4.2.3 Time Resolved Potential Controlled Measurements
Information about heterogeneous electron transfer kinetics of immobilised heme proteins can
be obtained with potential controlled time resolved SERR (TR-SERR) spectroscopy [1, 3, 63]. In
this approach, a rapid jump of the applied electrode potential E∆ from an initial value iE to a final
potential fE is employed. The equilibration at iE is perturbed by the potential jump and the
kinetics of the associated relaxation process to the new equilibrium corresponding to fE is
monitored. SERR spectra are measured during the time interval t∆ subsequent to various delay
times δ with respect to the potential jump. In order to monitor the dynamics of the relaxation
process, different delay times δ smaller than the relaxation time have to be adjusted. The
accuracy of the method is higher the smaller t∆ is with respect to δ (typically δ⋅∆ 2.0~t ). Then,
the measured spectrum represents the heme species composition at 2/' t∆+≈ δδ .
Figure 4.2.3: Schematic representation of time resolved surface enhanced resonance Raman experiments.
With this technique, the dynamics of potential jump induced processes at the heme domain can
be studied. However, the signal intensity of the TR-SERR spectrum depends on the accumulation
time ( t∆ ). For studying fast processes in the millisecond or microsecond time scale, t∆ is
accordingly small, such that a single shot TR-SERR spectrum would not afford a sufficiently high
signal-to-noise ratio as needed for quantitative analysis. Therefore, the potential is set back to iE
after the measuring intervals in order to recover the initial equilibrium during the time interval
Methods – SERR Spectroscopic Study of Catalytic Oxidation Processes (4.2.4)
37
)( iEt∆ , which should be distinctly larger than )( fEt∆ . Typically, the )(:)( fi EtEt ∆∆ ratio is around
5:1. In this way the potential jump experiment can be repeated as often (n times) as required for a
satisfactory spectrum (with a total accumulation time tn ∆⋅ ).
The potential induced (ET) process needs to be fully reversible for this procedure and the
immobilised sample needs to be stable throughout the whole TR-SERR experiment. A high signal
sensitivity is required in TR-SERR experiments in order to obtain good spectra while keeping the
number of repetitions of the potential jump experiment (n ) as low as possible.
4.2.4 SERR Spectroscopic Study of Catalytic Oxidation Processes
The reduction of the heme cofactor of immobilised heme containing enzymes during the
catalytic cycle of the enzyme can be in principle monitored by SERR spectroscopy at open circuit
[5, 8]. At open circuit potentials in de-aerated aqueous buffer solutions, heme cofactors are usually
predominantly in the oxidised ferric form. However, the heme will get reduced upon addition of the
enzyme’s substrate if a catalytic oxidation process with concomitant electron transfer to the heme
takes place. The kinetics of this reduction process can be determined by measuring consecutive
SERR spectra after addition of the substrate. Since usually accumulation times of at least 0.5 s for
each spectrum are required, only relatively slow reduction processes (< ~1.5 s-1) can be studied
with this approach.
The heme reduction rate obtained from such an experiment should be interpreted with care
since the reduction kinetics may be limited by several parameters, some of which are difficult to
control. First of all, the substrate, which can be introduced into the electrochemical cell via a
syringe, has to reach the electrode surface. This depends on the final substrate concentration in
the electrochemical cell after injection, the injection speed, the intrinsic diffusion behaviour of the
substrate, the sample arrangement and other parameters. Since the electrode holder of the SERR
setup (chapter 3.2) is rotating during measurement diffusion of small substrate molecules should
probably not be the limiting step in the slow reduction processes that can be monitored with this
technique.
After having reached the electrode surface, the substrate is oxidised at the active site, which
could be another cofactor or the heme itself. If the heme is not the active site, the electrons from
catalytic oxidation must be transferred in a second step via intramolecular electron transfer the
active site to the heme center. Moreover, information on the activation rate of the enzyme is
needed. It is reported in literature, that e.g. the active site of hydrogenases needs to be activated

Methods – Component Fit Analysis (4.3)
38
by the substrate (hydrogen) before the enzyme exhibits catalytic activity [8, 112]. Hence, the
observed heme reduction rate could be limited by the activation rate of the enzyme, the catalytic
turnover or the intramolecular electron transfer rate.
In summary, with this approach the apparent rate of heme reduction associated with catalytic
oxidation processes of the enzyme’s substrate can be selectively monitored. This may afford
valuable information about catalytic processes complementary to protein film voltammetry.
4.3 Component Fit Analysis
RR and SERR spectroscopy allows for quantitative determination of mixtures of heme species,
which differ with respect to their oxidation, spin and/or coordination state. The contribution of each
species to an observed spectrum can be disentangled by component fit analysis [69]. In this
approach, ‘synthetic’ spectra iX of the individual components i are generated. This can be made
for each component i by fitting a set of Lorentzian bandshapes (each corresponding to a
vibrational mode, e.g. ν4) to the measured spectrum of a ‘pure’ sample containing only the
component i . The Lorentzian bandshapes typically have bandwidths Γ in the range between 10
and 15 cm-1. If a pure sample of a particular component is not available, its spectrum may also be
obtained and fitted by subtracting all other species from the observed spectrum of a mixture that
contains this component. An observed spectrum O of a mixture of different heme species can then
be simulated by the superposition of the various synthetic spectra, according to:
{4.3.1} ∑=i
iiXfO .
In the fitting process, the amplitude of each component spectrum iX is scaled by a factor if .
This factor will be non-zero only for those components that are present in the sample mixture
giving the spectrum O . The accuracy of this technique depends on the accuracy of the synthetic
component spectra and the spectral range that is fitted. Certainly, at least a part of the fingerprint
region has to be covered for unambiguous assignments of component spectra to certain heme
species.
In figure 4.3, a SERR spectrum of the Cyt b subunit of the membrane bound hydrogenase from
Ralstonia eutropha H16 is shown [8]. As revealed by component fit analysis, four different heme
species contribute to the spectrum. The amount of reduced species is distinctly lower since this
spectrum was obtained under oxidising conditions. However, two different oxidised species can be
clearly distinguished, especially by different ν3 frequencies, revealing the coexistence of 6cLS and

Methods – Component Fit Analysis (4.3)
39
5cHS heme species [8]. Subsequent to the fitting procedure, the spectral contributions of each
component i can be converted into relative concentrations ic [69, 70], according to:
{4.3.2} ∑∑ ⋅
⋅=
j
jrelativej
irelativei
j
j
i
I
I
c
c
,
,
σσ
,
where the summation goes over all components j . The relative RR cross section parameter
relativeσ is the intensity ratio of each component with respect to a particular reference component.
Usually the native ferrous species is chosen as the reference species [70], which is in this case the
ferrous 6cLS species.
1350 1400 1450 1500
1374
∆ν ∆ν ∆ν ∆ν / cm-1
Inte
nsit
y / a
.u.
1491
1357
1360
1371
observed spectrum fit
6cLS oxidised 5cHS oxidised
6cLS reduced 5cHS reduced
1507
Figure 4.3: Component fit analysis of a surface enhanced resonance Raman spectrum of the Cyt b subunit of
membrane bound hydrogenase from Ralstonia eutropha H16. Experimental conditions: immobilisation on a 5-
carboxypentanethiol SAM-coated rough silver electrode, applied electrode potential was +0.1 V versus Ag/AgCl 3 M
KCl, 10 mM phosphate buffer at pH 7.0, incident laser radiation of λexc= 413.138 nm with a power on the sample of 1
mW, 1200/mm grating, CCD with a binning factor 2 .
The determination of relativeσ for the oxidised 6cLS species can be easily obtained from RR
experiments. Determination of relative cross section parameters of non-native species, however, is
not trivial because pure samples of non-native components can not easily be obtained. Moreover,
comparison of RR intensities of different heme species can only be done under similar
experimental conditions (same setup and position of the sample) and the concentration of different
samples has to be known. Relative cross section parameters for many different non-native species
of horse heart cytochrome c (HHCyt c) have been determined in the extensive study by Oellerich

Methods – Protein Film Voltammetry (4.4)
40
et al. [70]. Since similar heme species (with respect to their oxidation, spin and ligation state) of
different proteins exhibit comparable spectroscopic properties the relative cross section parameter
values of non-native HHCyt c species can be adopted in the study of other proteins [8].
In general, for component fit analysis, spectral contributions of different heme species must be
clearly distinguishable and for the conversion of spectral contributions into relative concentrations
the relative cross section values must be known or at least reasonably estimated.
A homemade MATLAB [62] based software (QPipsi) was used for generating synthetic
component spectra. The information of different component spectra (positions, heights and widths
of Lorentzian bandshapes) was stored in a fit file. These fit files were read by GNU Octave,
primarily intended for numerical computations [63]. This program enables the programming of
automated fitting procedures, which were employed in this work.
4.4 Protein Film Voltammetry
Protein film voltammetry (PFV) is a widely used powerful electrochemical tool for the study of
electronic and catalytic properties of immobilised redox-active proteins and enzymes [6, 15, 16, 19,
20]. In PFV the protein has to be immobilised on an electrode to form a (sub-)monolayer of protein,
which is referred to as the protein film. Moreover, good electrical communication, i.e. efficient
heterogeneous electron transfer, is required in order to perform voltammetry. Usually smooth gold
or carbon electrodes are used for PFV. However, the requirements of this technique may also be
met for heme proteins immobilised on SER-active SAM-coated silver electrodes. In the latter case,
PFV and SERR experiments can be performed on the same electrode [5, 8].
In cyclic voltammetry (CV) the applied electrode potential E is scanned bi-directionally within a
defined potential range and with a scan rate scanν , which is defined as 1)( −∆⋅∆= tEvscan . The
charge flux, i.e. the current, at the electrode is detected and plotted versus the potential. The
system under study may be dissolved in the electrolyte solution or immobilised on the electrode. In
the following the main concepts of PFV are presented on the example of immobilised human
sulphite oxidase (hSO). CV of dissolved systems represents a conceptually different case that will
not be described in this work.
In figure 4.4 two cyclic voltammograms of immobilised hSO at different conditions are shown.
HSO is a sulphite oxidising enzyme, which exhibits activity also in the immobilised state [5].

Methods – Protein Film Voltammetry under non-Turnover Conditions (4.4.1)
41
-0,30 -0,25 -0,20 -0,15 -0,10 -0,05 0,00 0,05
-1,0x10⁻⁵
-5,0x10⁻⁶
0,0
5,0x10⁻⁶
1,0x10⁻⁵
1,5x10⁻⁵
2,0x10⁻⁵
I /
A
E / V (vs. Ag/AgCl 3M KCl)
A
B
Figure 4.4: Cyclic voltammograms of human sulphite oxidase immobilised on a mixed 8-aminooctanethiole / 6-
mercaptohexanol (1:3) SAM. The buffer solution was 750 mM Tris-acetate at pH 7.4. Trace A was recorded at
sVscan /1.0=ν in the absence of sulphite. Trace B was recorded at sVscan /005.0=ν in the presence of 0.2 mM
sulphite.
In PFV in general, two basically different conditions have to be discerned in the study of redox-
active enzymes. Under so-called non-turnover conditions, the substrate of the enzyme is absent
and hence no catalytic reaction takes place (trace A of figure 4.4). Under non-turnover conditions
information about the midpoint potential mE of redox centers, heterogeneous electron transfer
rates ETk and the amount of electro-active protein Γ can be obtained. The term turnover-
conditions, in contrast, describes the situation when the substrate is present and catalytic turnover
is occurring. Valuable information on the catalytic turnover rate catk and other parameters of the
catalytic reaction may be obtained from PFV under turnover-conditions (trace B of figure 4.4).
4.4.1 Protein Film Voltammetry under non-Turnover Conditions
If the midpoint potential of a redox center in the immobilised protein is passed in the positive
scan direction (from more negative to more positive applied electrode potentials), the redox center
is oxidised and may give rise to a positive anodic oxidation peak at the anodic peak potential aE
and of the height aI . In the reverse scan direction, accordingly, the redox center is reduced and a
cathodic oxidation peak at cE with cI is observed (figure 4.4.1). However, the redox center needs
to perform efficient heterogeneous electron transfer. In case of similar heterogeneous reduction
and oxidation kinetics the anodic and cathodic peaks will have similar shapes with opposite sign.
The midpoint potential mE of the ET reaction can then be obtained according to:
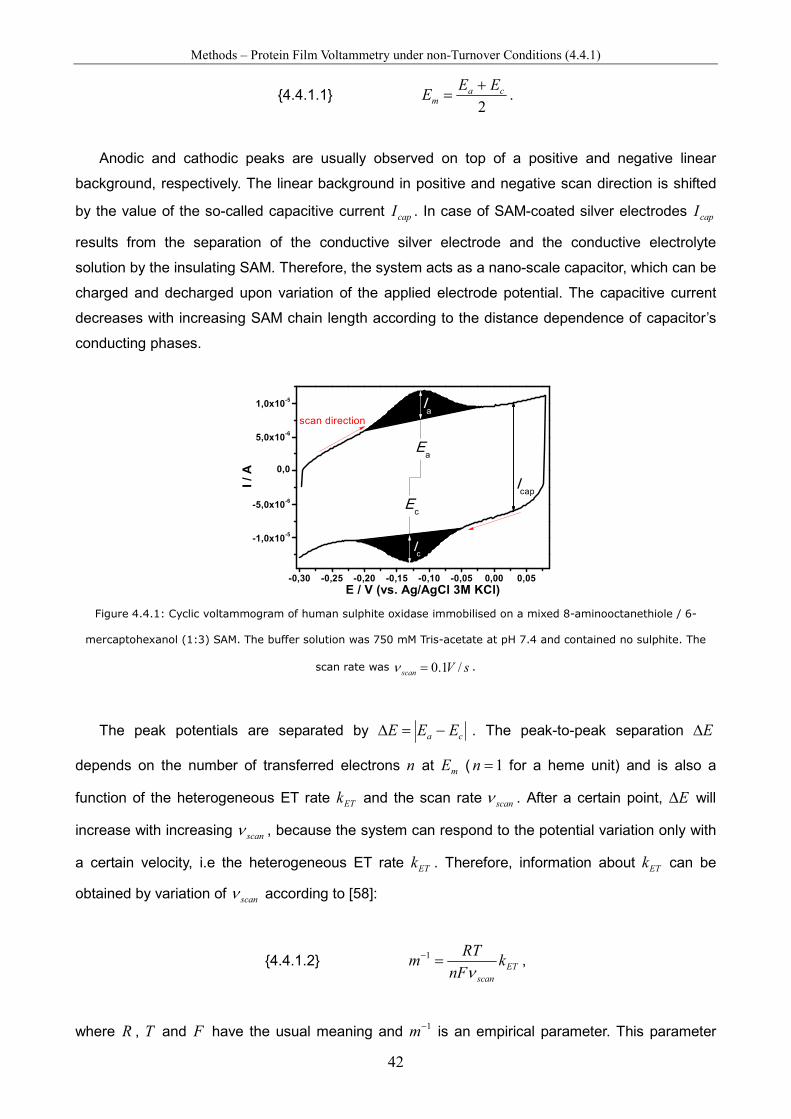
Methods – Protein Film Voltammetry under non-Turnover Conditions (4.4.1)
42
{4.4.1.1} 2
cam
EEE
+= .
Anodic and cathodic peaks are usually observed on top of a positive and negative linear
background, respectively. The linear background in positive and negative scan direction is shifted
by the value of the so-called capacitive current capI . In case of SAM-coated silver electrodes capI
results from the separation of the conductive silver electrode and the conductive electrolyte
solution by the insulating SAM. Therefore, the system acts as a nano-scale capacitor, which can be
charged and decharged upon variation of the applied electrode potential. The capacitive current
decreases with increasing SAM chain length according to the distance dependence of capacitor’s
conducting phases.
-0,30 -0,25 -0,20 -0,15 -0,10 -0,05 0,00 0,05
-1,0x10⁻⁵
-5,0x10⁻⁶
0,0
5,0x10⁻⁶
1,0x10⁻⁵
Icap
Ic
I /
A
E / V (vs. Ag/AgCl 3M KCl)
Ia
Ec
Ea
scan direction
Ia
Figure 4.4.1: Cyclic voltammogram of human sulphite oxidase immobilised on a mixed 8-aminooctanethiole / 6-
mercaptohexanol (1:3) SAM. The buffer solution was 750 mM Tris-acetate at pH 7.4 and contained no sulphite. The
scan rate was sVscan /1.0=ν .
The peak potentials are separated by ca EEE −=∆ . The peak-to-peak separation E∆
depends on the number of transferred electrons n at mE ( 1=n for a heme unit) and is also a
function of the heterogeneous ET rate ETk and the scan rate scanν . After a certain point, E∆ will
increase with increasing scanν , because the system can respond to the potential variation only with
a certain velocity, i.e the heterogeneous ET rate ETk . Therefore, information about ETk can be
obtained by variation of scanν according to [58]:
{4.4.1.2} ET
scan
knF
RTm
ν=−1 ,
where R , T and F have the usual meaning and 1−m is an empirical parameter. This parameter
Methods – Protein Film Voltammetry under non-Turnover Conditions (4.4.1)
43
has been shown to be related to n and E∆ as follows [58]:
n∆E[mV] 18.8 27 34.8 48.8 61.2 72.2 82.4 91.8 100.6 116.2 m-1 0.5 0.75 1 1.5 2 2.5 3 3.5 4 5
n∆E[mV] 130 142.4 153.8 164 173.4 182 190 197.6 204.6 m-1 6 7 8 9 10 11 12 13 14
Redox parameters of the heme obtained from PFV under non-turnover conditions and potential
controlled SERR spectroscopy should be similar. However, some fundamental differences between
these techniques that could lead to different results should be noted. SERR spectroscopy probes
all scattering molecules, also the redox-inactive ones, but, as a result of a possibly different local
environment, protein film subpopulations that are situated in different areas and/or are oriented
differently with respect to the electrode surface may also have slightly different electronic and
scattering properties. Moreover, SERR spectroscopy also probes different heme species that might
be present on the surface. CV, in contrast, only probes the integrated electrochemical response of
electro-active proteins.
It should also be noted that non-turnover CV is only applicable in case of sufficiently large
values of ETk . This is because the charge flux and hence the peak currents ( aI and cI ) and areas
( aA and cA , marked black in figure 4.4.1) are strongly dependent on the scan rate scanν . At higher
scan rates, the equilibrium between oxidised and reduced species is changed faster resulting in
high peak currents. At low scan rates ( scanν < 0.01 V/s) non-turnover currents become very small or
not observable at all. Therefore, slow heterogeneous ET processes cannot be studied with PFV. In
contrast, there is principally no lower detection limit for the determination of low ETk with SERR
spectroscopy. In summary, with respect to PFV, SERR spectroscopy is the more powerful
technique for the determination of redox parameters of heme proteins, provided there are proper
component spectra and values for relative RR cross sections.
On the other hand, PFV under non-turnover conditions enables the determination of the
amount of electro-active proteins hSOΓ by means of the observed peak currents according to [59]:
{4.4.1.3} scan
ahSO
FnA
RTI
ν⋅⋅⋅⋅⋅
=Γ22
4,
where A is the electrode surface area, which can be accurately determined for smooth electrode
surfaces with CV [151, 152]. In case of rough SER-active surfaces, however, other techniques
have to be applied for the determination of the real surface area. The roughness factor, which is

Methods – Protein Film Voltammetry under Turnover Conditions (4.4.2)
44
the ratio of the real and the geometric surface area, of electrochemically roughened silver
electrodes is 10 – 20 [153-155].
4.4.2 Protein Film Voltammetry under Turnover Conditions
The shape of the CV of a catalytically active protein film under turnover conditions widely differs
from that under non-turnover conditions (figure 4.4.1). It should be noted that the scan rate of the
traces in figure 4.4.1 is significantly lower in case of the turnover CV (trace B) with respect to the
non-turnover CV (trace A). In general, CV under turnover conditions is performed with low scanν ,
usually 1 – 5 mV/s [6]. Accordingly, the capacitive current is low and no peak shaped currents
occur. However, an additional catalytic current obs
catI is observed, which starts to rise at the so-called
onset potential onE and reaches a plateau region, which is far above the non-catalytic current
(indicated by the dotted line in figure 4.4.2.1).
-0,30 -0,25 -0,20 -0,15 -0,10 -0,05 0,00 0,05 0,10
0,0
5,0x10⁻⁶
1,0x10⁻⁵
1,5x10⁻⁵
2,0x10⁻⁵
2,5x10⁻⁵
Eon
I / A
E / V (vs. Ag/AgCl 3M KCl)
I obs
cat
Figure 4.4.2.1: Cylic voltammogram of human sulphite oxidase immobilised on a mixed 8-aminooctanethiole / 6-
mercaptohexanol (1:3) SAM in the presence of 0.2 mM sulphite. The buffer solution was 750 mM Tris-acetate at pH
7.4 and the scan rate was sVscan /005.0=ν .
In case of the hSO (figure 4.4.2.1) a positive catalytic current is observed in the presence of
sulphite. This observation points towards a catalytic oxidation process at the electrode. In fact, the
immobilised hSO catalyses the oxidation of sulphite to sulphate according to [15]:
Figure 4.4.2.2: Catalytic reaction of the immobilised human sulphite oxidase.

Methods – Computational Chemistry (4.5)
45
The electrons that are generated upon oxidation of the substrate are subsequently transferred
to the electrode and give rise to the positive oxidative catalytic current obs
catI . The onset potential
onE is situated in a region where the heme domain starts to get oxidised. This observation points to
the involvement of the Cyt b5 unit in the catalytic oxidation cycle.
The observed catalytic current depends on various processes, one of which is mass transport.
The substrate (SO32-) must reach the electrode and the product (SO4
2-) must be released back into
the solution. Mass transport, in turn, depends on the substrate concentration in the surrounding
electrolyte solution and the shape and rotation speed elv [rpm] of the working electrode [6].
Another important variable in the electro-catalytic process is the heterogeneous electron transfer
rate between the enzyme and the electrode. Only if the electro-catalytic process is not limited by
mass transport and heterogeneous electron transfer kinetics, respectively, the observed catalytic
current obs
catI represents the actual catalytic current catI . The actual catalytic current reflects the
kinetics of the catalytic process according to [5, 6, 15]:
{4.4.2} RTI
FnIk
a
scancatcat ⋅⋅
⋅⋅⋅=
4
ν.
4.5 Computational Chemistry
Computational chemistry provides powerful simulation methods for the analysis of molecular
observables, structures, interactions and reactions [189]. Computational methods afford very
detailed information. Within this work various computational methods were employed to compute
dipole moments, surface potential distributions, and structures of enzymes. Details on these
studies are described in the chapters 6.3 and 7.3.

46
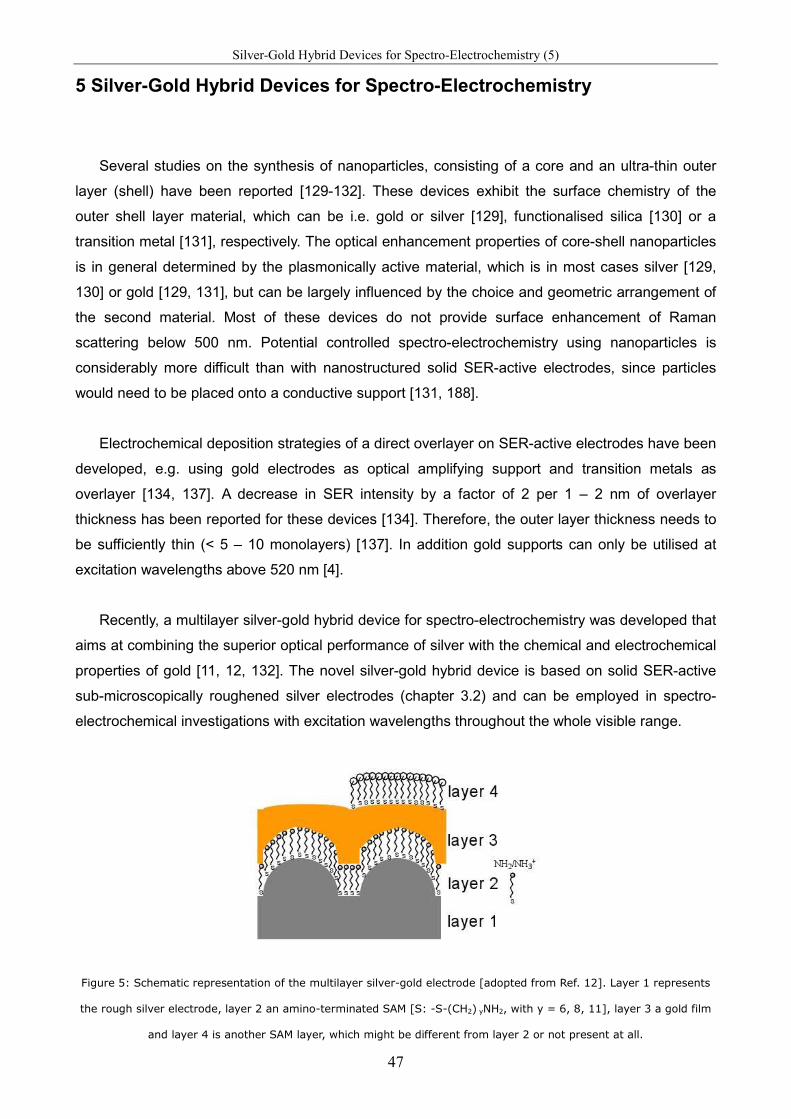
Silver-Gold Hybrid Devices for Spectro-Electrochemistry (5)
47
5 Silver-Gold Hybrid Devices for Spectro-Electrochemistry
Several studies on the synthesis of nanoparticles, consisting of a core and an ultra-thin outer
layer (shell) have been reported [129-132]. These devices exhibit the surface chemistry of the
outer shell layer material, which can be i.e. gold or silver [129], functionalised silica [130] or a
transition metal [131], respectively. The optical enhancement properties of core-shell nanoparticles
is in general determined by the plasmonically active material, which is in most cases silver [129,
130] or gold [129, 131], but can be largely influenced by the choice and geometric arrangement of
the second material. Most of these devices do not provide surface enhancement of Raman
scattering below 500 nm. Potential controlled spectro-electrochemistry using nanoparticles is
considerably more difficult than with nanostructured solid SER-active electrodes, since particles
would need to be placed onto a conductive support [131, 188].
Electrochemical deposition strategies of a direct overlayer on SER-active electrodes have been
developed, e.g. using gold electrodes as optical amplifying support and transition metals as
overlayer [134, 137]. A decrease in SER intensity by a factor of 2 per 1 – 2 nm of overlayer
thickness has been reported for these devices [134]. Therefore, the outer layer thickness needs to
be sufficiently thin (< 5 – 10 monolayers) [137]. In addition gold supports can only be utilised at
excitation wavelengths above 520 nm [4].
Recently, a multilayer silver-gold hybrid device for spectro-electrochemistry was developed that
aims at combining the superior optical performance of silver with the chemical and electrochemical
properties of gold [11, 12, 132]. The novel silver-gold hybrid device is based on solid SER-active
sub-microscopically roughened silver electrodes (chapter 3.2) and can be employed in spectro-
electrochemical investigations with excitation wavelengths throughout the whole visible range.
Figure 5: Schematic representation of the multilayer silver-gold electrode [adopted from Ref. 12]. Layer 1 represents
the rough silver electrode, layer 2 an amino-terminated SAM [S: -S-(CH2) yNH2, with y = 6, 8, 11], layer 3 a gold film
and layer 4 is another SAM layer, which might be different from layer 2 or not present at all.

Silver-Gold Hybrid Devices for Spectro-Electrochemistry – Analytical Model (5.1)
48
In the hybrid device, the rough silver electrode, which represents the first layer, is coated by a
dielectric spacer (S), which represents a second layer. On top of the spacer S, a metal island film
(third layer) is deposited, which can be further functionalised with a SAM (fourth layer).
This device was first developed using different amino-terminated SAMs [S: -S-(CH2) yNH2, with
y = 6, 8, 11] as dielectric spacer materials (second layer) and formation of a gold film (third layer)
by electrochemical reduction of AuCl- ions from solution [11, 12]. Strikingly, the Raman signal
enhancement property of these multilayer Ag-S-Au-SAM devices, probed by the SERR signal of
cytochrome c with 413 nm excitation immobilised on top of a fourth carboxyl-terminated SAM layer,
was found to be comparable to Ag-SAM electrodes, although the silver surface was separated from
the heme domain by roughly 15 nm and gold does not provide surface enhancement in this
wavelength region [4]. The separation of the outer metal film by a dielectric spacer (second layer)
was found to be necessary to yield high enhancements. Separation by conductive poly-electrolyte
materials or direct electro-deposition of gold films yielded about four times lower SERR intensities
[11].
The optical properties of the hybrid device were rationalised in terms of a long range plasmonic
coupling between the underlying silver (first layer) and the gold film [11, 12, 133]. Efficient
plasmonic coupling between two resonant metal nanostructures has been reported before [44,
135, 136], however, plasmonic coupling between a resonant and a non-resonant metal was first
observed for the silver-gold hybrid device. This phenomenon has prompted the development of a
theoretical model [133], which is discussed in the following chapter 5.1. In chapter 5.2 cytochrome
c from horse heart and iso-1- cytochrome c from yeast, which were used as model proteins, are
briefly introduced. In chapter 5.3 the overpotential dependence of the heterogeneous electron
transfer rate of cytochrome c immobilised on the hybrid device is discussed and compared to pure
silver and gold support materials [191]. Synthesis and further electronic properties of the silver-gold
hybrid device are discussed in chapter 5.4. It should be noted that modified procedures for
multilayer hybrid devices that differ either in the spacer material (second layer) [132] and/or in the
material or application of the third layer have been developed [132, H. Khoa Ly (unpublished)].
5.1 Analytical Model for the Optical Performance
The starting point for an analytical description of the optical enhancement properties of the
hybrid device is a non-concentric model, which is a simplified representation of the hybrid device
geometry (figure 5.1.1) [133].

Silver-Gold Hybrid Devices for Spectro-Electrochemistry – Analytical Model (5.1)
49
Figure 5.1.1 [adapted from reference 133]: Non-concentric model of the silver-gold hybrid device. A dipole is centered
in the middle of the hemisphere of layer one, which is the silver core. The radius of the hemisphere is set to 40 ± 20
nm. The dipole is depicted as a red arrow and is mirrored at each interface (exemplarily indicated by dashed red
arrows). The second and fourth layers are self assembled monolayers with dielectric constants ε2,4 = 2. Analytical
expressions for the dielectric functions of silver ε1 and gold ε3 (third layer) can be found in literature [139, 140].
According to experimental results [11] the gold layer thickness was set to 16 ± 10 nm and taken to be flat. AgAuR
denotes the distance from the center of the dipole to the SAM-H2O interface. The incident electric field 0Er
approaches
the electrode with the angle θ . The azimuthal angle φ (not depicted) defines the angle going out of the paper plane.
By using an image dipoles approach an expression for the electric field distribution in the
multilayer system can be derived and renders the following expression for the field enhancement
[133]:
{5.1} AgAur RrE
rEF ),(
),()( ),,(
0
νψν
ν φθ∇== r
r
.
In equation {5.1}, ),,( φθr∇ is the divergence operator within a coordinate system defined by r ,
which is the distance to the core of the hemisphere, and the angles θ and φ (see caption of figure
5.1.1). The dimensionless potential ),( νψ r is defined as:
{5.1a} AgAuRE
rr
0
),(),( r
ννψ
Φ−= ,
with ),( νrΦ being the local electric field at position r .
In figure 5.1.2 a) the analytical results for the Raman signal enhancement [ ]20 )(vFg = for the
non-concentric model of the hybrid device are compared to the conventional rough silver device
consisting of only the layers 1 and 2. In figure 5.1.2 b) the full spatial distribution of the signal
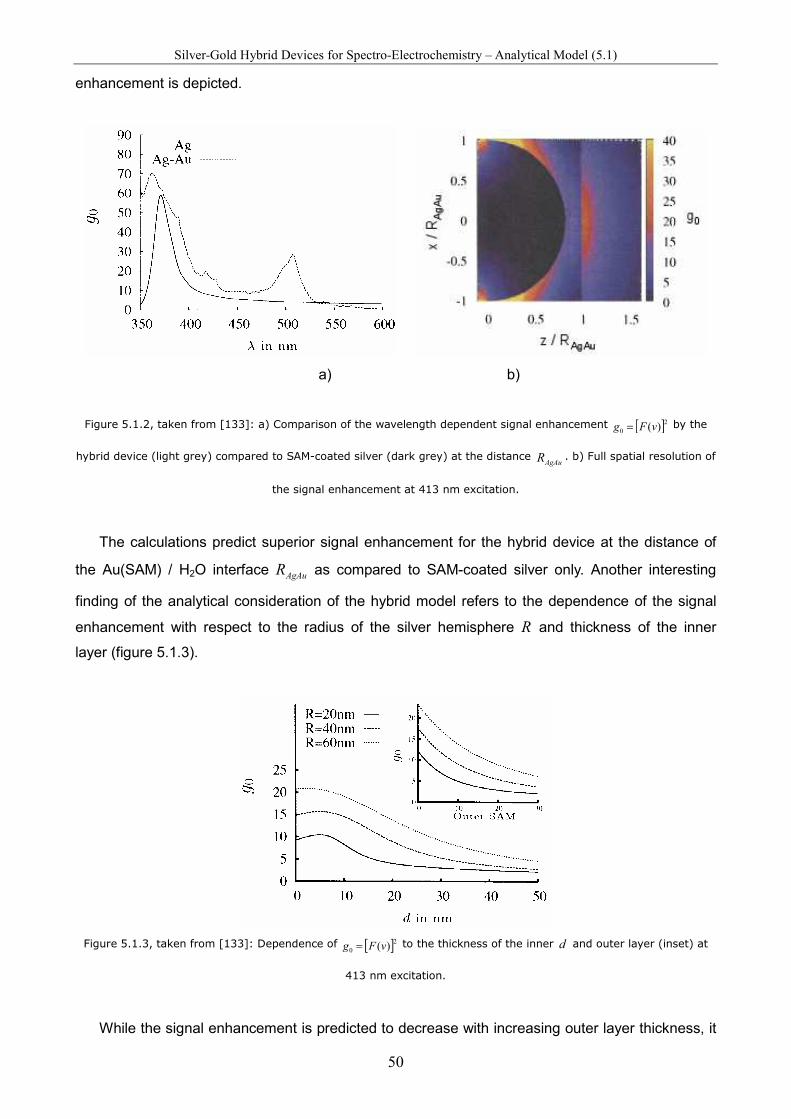
Silver-Gold Hybrid Devices for Spectro-Electrochemistry – Analytical Model (5.1)
50
enhancement is depicted.
a) b)
Figure 5.1.2, taken from [133]: a) Comparison of the wavelength dependent signal enhancement [ ]20 )(vFg = by the
hybrid device (light grey) compared to SAM-coated silver (dark grey) at the distance AgAuR . b) Full spatial resolution of
the signal enhancement at 413 nm excitation.
The calculations predict superior signal enhancement for the hybrid device at the distance of
the Au(SAM) / H2O interface AgAuR as compared to SAM-coated silver only. Another interesting
finding of the analytical consideration of the hybrid model refers to the dependence of the signal
enhancement with respect to the radius of the silver hemisphere R and thickness of the inner
layer (figure 5.1.3).
Figure 5.1.3, taken from [133]: Dependence of [ ]20 )(vFg = to the thickness of the inner d and outer layer (inset) at
413 nm excitation.
While the signal enhancement is predicted to decrease with increasing outer layer thickness, it

Silver-Gold Hybrid Devices – Overpotential Dependence of Heterogeneous ET Rates (5.3)
51
increases first with increasing inner spacer layer thickness up to a value around 5 nm. In fact,
experiments with different inner layers revealed only a weak inner spacer thickness dependence of
the signal enhancement [11, 12, 132]. The inner layer thickness, however, also affects the
electronic properties of the device, which are discussed in detail in chapters 5.3 and 5.4.
5.2 Cytochrome c
Cytochrome c is a small (~ 12 kDa), soluble c-type heme protein in the mitochondria of
eukaryotic cells from mammals to invertebrates and yeast. This protein is primarily involved in the
respiratory chain as being an electron carrier between the membrane integral enzymes complex III
and complex IV [197]. Moreover, it was recently shown that cytochrome c is involved in different
processes in the apoptosis of mammalian cells [167-169] (see chapter 8.2).
Figure 5.2, taken from [199]: Calculated surface potential distribution and dipole moment of iso-1-cytochrome c from
yeast (YCyt c) compared to horse heart cytochrome c (HHCyt c) at pH 7.0. Positively charged regions are coloured
blue, while red and white coloured regions are negatively charged and uncharged, respectively. The direction and
strength of the dipole moment is indicated by the arrow.
In this work, cytochrome c from horse heart (HHCyt c) and iso-1-cytochrome c from yeast
(YCyt c) were used as model proteins for exploring the performance of the silver-gold hybrid
devices. Both, HHCyt c and YCyt c are cationic proteins with an isoelectric point pI > 10, hence,
at neutral pH, both carry positive charges (+7 and +8 in the reduced and oxidised state,
respectively) [199]. The lysine-rich binding patches in close proximity to the heme cofactors are
positively charged. It should be noted that the dipole moment of YCyt c (~ 540 Debye) is more than
three times larger than for HHCyt c (~ 170 Debye) [199]. Moreover, YCyt c possesses a cysteine
residue at position 102 on the surface of the protein. This cysteine residue C102, which is absent
in HHCyt c, can be utilised for covalent immobilisation of YCyt c onto bare gold surfaces upon
formation of a strong gold-sulphur bond [200]. Both proteins can be immobilised electrostatically
via lysine residues to negatively charged self assembled monolayers [201] and studied with
electrochemistry [178-180] and surface enhanced vibrational spectroscopy [3, 68, 191, 197, 199].

Silver-Gold Hybrid Devices – Overpotential Dependence of Heterogeneous ET Rates (5.3)
52
The influence of high electric fields may induce a partial conversion to non-native species with
altered coordination pattern and significantly decreased midpoint potential of the central heme iron
[3, 191, 199].
5.3 Overpotential Dependence of Heterogeneous Electron Transfer Rates
A silver-gold hybrid device with 11-aminoundecanthiol (AUT) as spacer S (layer 2) and 16-
mercaptohexadecanoic acid (MHDA) as outer SAM material (layer 4) was used for time resolved
surface enhanced resonance Raman (TR-SERR) spectroscopic determination of heterogeneous
electron transfer rates )(ηETk of electrostatically immobilised horse heart cytochrome c (HHCyt c)
[191]. Reduction rates were obtained as a function of the applied overpotential η . The
overpotential dependence of the heterogeneous reduction rate using the silver-gold hybrid device
is depicted in figure 5.3 and compared to pure silver [192] and gold support matrials, respectively.
On MDHA-coated Ag electrodes a dramatic acceleration of the heterogeneous reduction rate
with increasing overpotential is observed and analysis of the data yields a reorganisation energy of
λ = 0.22 eV for this process [56, 192] (see chapter 2.6.2). Although similar values for the
reorganisation energy of heterogeneous reduction are expected for the hybrid and gold electrodes,
on these electrodes )(ηETk displays a drastically weaker increase with increasing η .
Figure 5.3 [191]: Overpotential dependence of the heterogeneous electron transfer rate constant )(ηETk for HHCyt c
immobilised on MHDA-coated electrodes. The black (open circles), dark gray (open triangles), and light gray (solid
squares) symbols refer to the data obtained from an Ag (TR- SERR), Ag-AUT-Au (TR-SERR), and Au electrode (rapid
scan surface enhanced infrared absorption). The solid line represents a fit of equation {2.6.2.3} (see chapter 2.6.2) to
the experimental data for the Ag electrode [56, 192], whereas in the case of Au and Au-SAM-Ag, dotted lines are
included to guide the eyes.

Silver-Gold Hybrid Devices – Overpotential Dependence of Heterogeneous ET Rates (5.3)
53
This discrepancy can be understood by taking into account different potential of zero charge
( pzcE ) values for the different MDHA-coated electrodes. pzcE depends on the crystalline structure
of the metal and the type of SAM coating and has been determined to be -0.45 and -0.2 V (vs.
Ag/AgCl, 3 M KCl) for 11-mercaptoundecanoic acid (MUA) coated Ag and Ag-AUT-Au electrodes,
respectively [12]. It is reasonable to assume that the values for the respective MDHA-coated
electrodes are very similar [193]. According to literature data the potential of zero charge of MDHA-
coated Au electrodes can be estimated to be around pzcE = -0.05 V [193]. The difference between
the applied electrode potential E and pzcE is proportional to the electric field in the MDHA / HHCyt
c interface [194]. Thus, heterogeneous ET reactions of HHCyt c at Au and Ag electrodes take place
under the action of opposite electric fields. Moreover, the field strength increases for Au but
decreases for Ag upon increasing the driving force for reduction, i.e. with increasingly negative
overpotential mEE −=η , taking into account the midpoint potentials of -0.01 V and +0.04 V for
HHCyt c on MDHA-coated Ag and Au electrodes, respectively [68, 194]. Accordingly, the electric
field variation for the Au-AUT-Ag electrode lies in between those for the Ag and Au electrode as it
first decreases until E = pzcE (with pzcE = -0.2 V [12]) and then increases again for E < pzcE .

54

55
5.4 Multi-layer electron transfer across nanostructured Ag-SAM-Au-SAM
junctions probed by surface enhanced Raman spectroscopy
Murat Sezer,a Jiu-Ju Feng,ad H. Khoa Ly,a Yanfei Shen,b Takashi Nakanishi,bc Uwe Kuhlmann,a
Peter Hildebrandt,a Helmuth Möhwaldb and Inez M. Weidingera*
a Technische Universität Berlin, Institut für Chemie, Sekr. PC14, Straße des 17. Juni 135, D-10623 Berlin, Germany.
*correspondence to E-mail: [email protected]; Fax: +49 3031421122; Tel: +49 3031422780
b Max Planck Institute of Colloids and Interfaces, Research Campus Golm, D-14424 Potsdam, Germany.
c National Institute for Materials Science, 1-2-1 Sengen, Tsukuba 305-0047, Japan.
d School of Chemistry and Environmental Science, Henan Normal University, Xinxiang, Henan 453007, China.
Published in Phys. Chem. Chem. Phys., 2010, 12, 9822 – 9829.
Reproduced with permission of the PCCP Owner Societies.

56
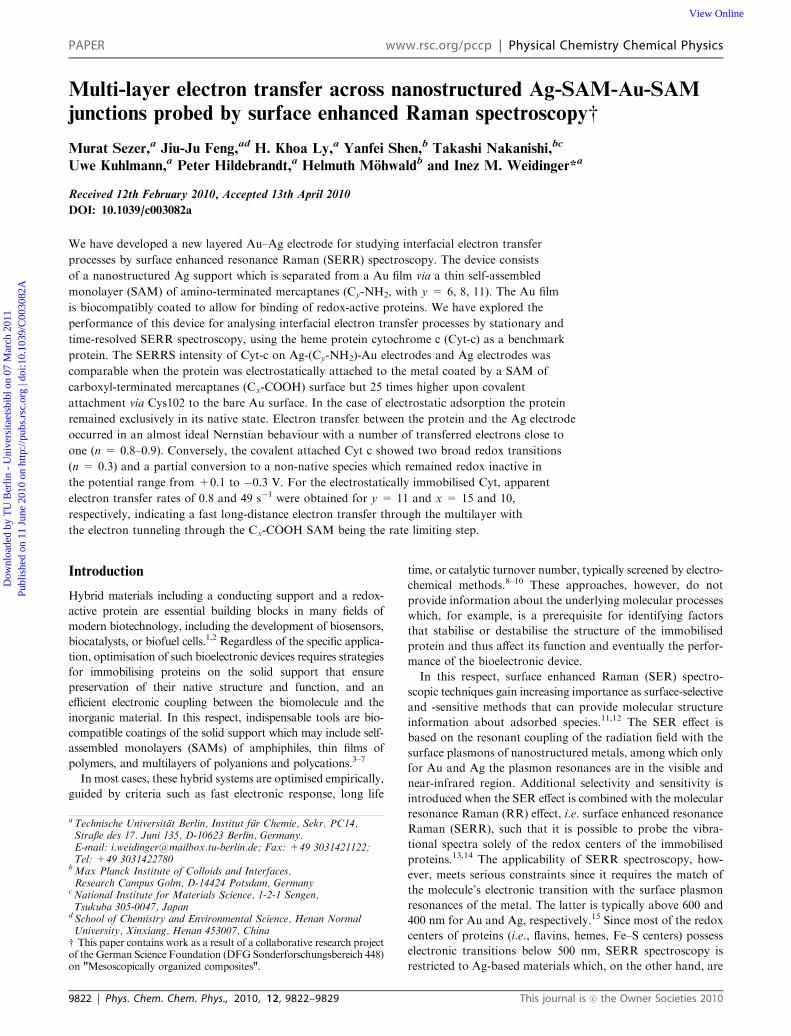
Multi-layer electron transfer across nanostructured Ag-SAM-Au-SAM
junctions probed by surface enhanced Raman spectroscopyw
Murat Sezer,a Jiu-Ju Feng,ad H. Khoa Ly,a Yanfei Shen,b Takashi Nakanishi,bc
Uwe Kuhlmann,aPeter Hildebrandt,
aHelmuth Mohwald
band Inez M. Weidinger*
a
Received 12th February 2010, Accepted 13th April 2010
DOI: 10.1039/c003082a
We have developed a new layered Au–Ag electrode for studying interfacial electron transfer
processes by surface enhanced resonance Raman (SERR) spectroscopy. The device consists
of a nanostructured Ag support which is separated from a Au film via a thin self-assembled
monolayer (SAM) of amino-terminated mercaptanes (Cy-NH2, with y = 6, 8, 11). The Au film
is biocompatibly coated to allow for binding of redox-active proteins. We have explored the
performance of this device for analysing interfacial electron transfer processes by stationary and
time-resolved SERR spectroscopy, using the heme protein cytochrome c (Cyt-c) as a benchmark
protein. The SERRS intensity of Cyt-c on Ag-(Cy-NH2)-Au electrodes and Ag electrodes was
comparable when the protein was electrostatically attached to the metal coated by a SAM of
carboxyl-terminated mercaptanes (Cx-COOH) surface but 25 times higher upon covalent
attachment via Cys102 to the bare Au surface. In the case of electrostatic adsorption the protein
remained exclusively in its native state. Electron transfer between the protein and the Ag electrode
occurred in an almost ideal Nernstian behaviour with a number of transferred electrons close to
one (n = 0.8–0.9). Conversely, the covalent attached Cyt c showed two broad redox transitions
(n = 0.3) and a partial conversion to a non-native species which remained redox inactive in
the potential range from +0.1 to �0.3 V. For the electrostatically immobilised Cyt, apparent
electron transfer rates of 0.8 and 49 s�1 were obtained for y = 11 and x = 15 and 10,
respectively, indicating a fast long-distance electron transfer through the multilayer with
the electron tunneling through the Cx-COOH SAM being the rate limiting step.
Introduction
Hybrid materials including a conducting support and a redox-
active protein are essential building blocks in many fields of
modern biotechnology, including the development of biosensors,
biocatalysts, or biofuel cells.1,2 Regardless of the specific applica-
tion, optimisation of such bioelectronic devices requires strategies
for immobilising proteins on the solid support that ensure
preservation of their native structure and function, and an
efficient electronic coupling between the biomolecule and the
inorganic material. In this respect, indispensable tools are bio-
compatible coatings of the solid support which may include self-
assembled monolayers (SAMs) of amphiphiles, thin films of
polymers, and multilayers of polyanions and polycations.3–7
In most cases, these hybrid systems are optimised empirically,
guided by criteria such as fast electronic response, long life
time, or catalytic turnover number, typically screened by electro-
chemical methods.8–10 These approaches, however, do not
provide information about the underlying molecular processes
which, for example, is a prerequisite for identifying factors
that stabilise or destabilise the structure of the immobilised
protein and thus affect its function and eventually the perfor-
mance of the bioelectronic device.
In this respect, surface enhanced Raman (SER) spectro-
scopic techniques gain increasing importance as surface-selective
and -sensitive methods that can provide molecular structure
information about adsorbed species.11,12 The SER effect is
based on the resonant coupling of the radiation field with the
surface plasmons of nanostructured metals, among which only
for Au and Ag the plasmon resonances are in the visible and
near-infrared region. Additional selectivity and sensitivity is
introduced when the SER effect is combined with the molecular
resonance Raman (RR) effect, i.e. surface enhanced resonance
Raman (SERR), such that it is possible to probe the vibra-
tional spectra solely of the redox centers of the immobilised
proteins.13,14 The applicability of SERR spectroscopy, how-
ever, meets serious constraints since it requires the match of
the molecule’s electronic transition with the surface plasmon
resonances of the metal. The latter is typically above 600 and
400 nm for Au and Ag, respectively.15 Since most of the redox
centers of proteins (i.e., flavins, hemes, Fe–S centers) possess
electronic transitions below 500 nm, SERR spectroscopy is
restricted to Ag-based materials which, on the other hand, are
a Technische Universitat Berlin, Institut fur Chemie, Sekr. PC14,Straße des 17. Juni 135, D-10623 Berlin, Germany.E-mail: [email protected]; Fax: +49 3031421122;Tel: +49 3031422780
bMax Planck Institute of Colloids and Interfaces,Research Campus Golm, D-14424 Potsdam, Germany
cNational Institute for Materials Science, 1-2-1 Sengen,Tsukuba 305-0047, Japan
d School of Chemistry and Environmental Science, Henan NormalUniversity, Xinxiang, Henan 453007, China
w This paper contains work as a result of a collaborative research projectof the German Science Foundation (DFGSonderforschungsbereich 448)on "Mesoscopically organized composites".
9822 | Phys. Chem. Chem. Phys., 2010, 12, 9822–9829 This journal is �c the Owner Societies 2010
PAPER www.rsc.org/pccp | Physical Chemistry Chemical Physics
Dow
nloa
ded
by T
U B
erlin
- U
nive
rsita
etsb
ibl o
n 07
Mar
ch 2
011
Publ
ishe
d on
11
June
201
0 on
http
://pu
bs.r
sc.o
rg |
doi:1
0.10
39/C
0030
82A
View Online
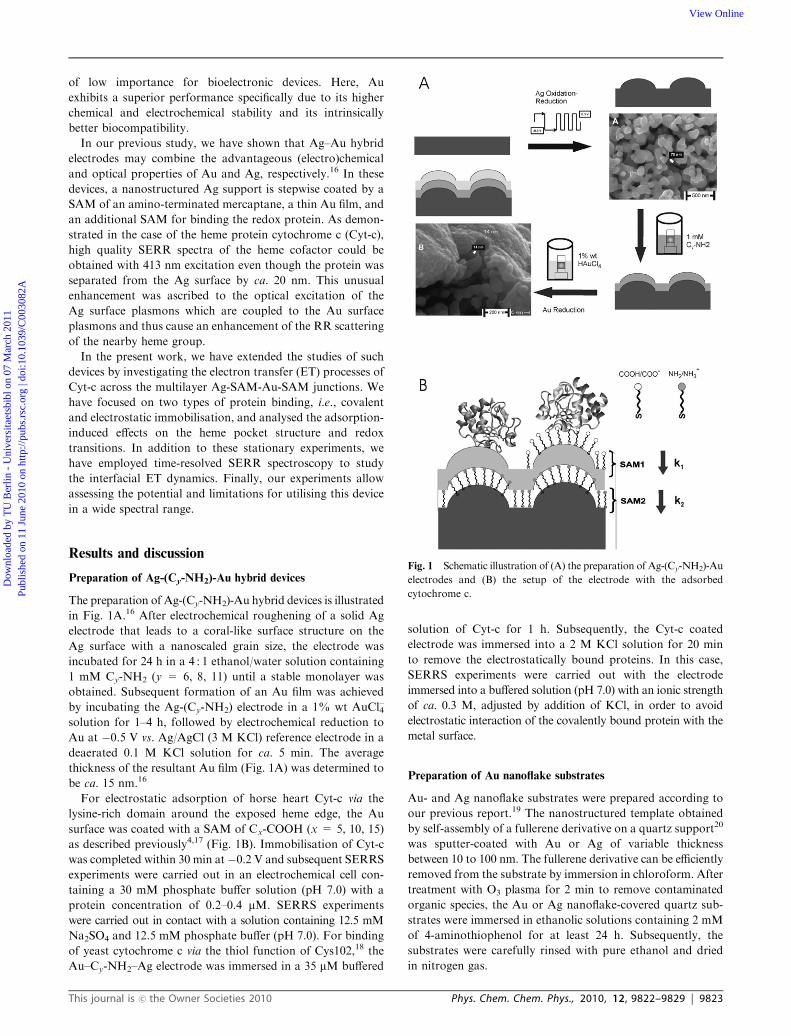
of low importance for bioelectronic devices. Here, Au
exhibits a superior performance specifically due to its higher
chemical and electrochemical stability and its intrinsically
better biocompatibility.
In our previous study, we have shown that Ag–Au hybrid
electrodes may combine the advantageous (electro)chemical
and optical properties of Au and Ag, respectively.16 In these
devices, a nanostructured Ag support is stepwise coated by a
SAM of an amino-terminated mercaptane, a thin Au film, and
an additional SAM for binding the redox protein. As demon-
strated in the case of the heme protein cytochrome c (Cyt-c),
high quality SERR spectra of the heme cofactor could be
obtained with 413 nm excitation even though the protein was
separated from the Ag surface by ca. 20 nm. This unusual
enhancement was ascribed to the optical excitation of the
Ag surface plasmons which are coupled to the Au surface
plasmons and thus cause an enhancement of the RR scattering
of the nearby heme group.
In the present work, we have extended the studies of such
devices by investigating the electron transfer (ET) processes of
Cyt-c across the multilayer Ag-SAM-Au-SAM junctions. We
have focused on two types of protein binding, i.e., covalent
and electrostatic immobilisation, and analysed the adsorption-
induced effects on the heme pocket structure and redox
transitions. In addition to these stationary experiments, we
have employed time-resolved SERR spectroscopy to study
the interfacial ET dynamics. Finally, our experiments allow
assessing the potential and limitations for utilising this device
in a wide spectral range.
Results and discussion
Preparation of Ag-(Cy-NH2)-Au hybrid devices
The preparation of Ag-(Cy-NH2)-Au hybrid devices is illustrated
in Fig. 1A.16 After electrochemical roughening of a solid Ag
electrode that leads to a coral-like surface structure on the
Ag surface with a nanoscaled grain size, the electrode was
incubated for 24 h in a 4 : 1 ethanol/water solution containing
1 mM Cy-NH2 (y = 6, 8, 11) until a stable monolayer was
obtained. Subsequent formation of an Au film was achieved
by incubating the Ag-(Cy-NH2) electrode in a 1% wt AuCl–4solution for 1–4 h, followed by electrochemical reduction to
Au at �0.5 V vs. Ag/AgCl (3 M KCl) reference electrode in a
deaerated 0.1 M KCl solution for ca. 5 min. The average
thickness of the resultant Au film (Fig. 1A) was determined to
be ca. 15 nm.16
For electrostatic adsorption of horse heart Cyt-c via the
lysine-rich domain around the exposed heme edge, the Au
surface was coated with a SAM of Cx-COOH (x = 5, 10, 15)
as described previously4,17 (Fig. 1B). Immobilisation of Cyt-c
was completed within 30 min at�0.2 V and subsequent SERRS
experiments were carried out in an electrochemical cell con-
taining a 30 mM phosphate buffer solution (pH 7.0) with a
protein concentration of 0.2–0.4 mM. SERRS experiments
were carried out in contact with a solution containing 12.5 mM
Na2SO4 and 12.5 mM phosphate buffer (pH 7.0). For binding
of yeast cytochrome c via the thiol function of Cys102,18 the
Au–Cy-NH2–Ag electrode was immersed in a 35 mM buffered
solution of Cyt-c for 1 h. Subsequently, the Cyt-c coated
electrode was immersed into a 2 M KCl solution for 20 min
to remove the electrostatically bound proteins. In this case,
SERRS experiments were carried out with the electrode
immersed into a buffered solution (pH 7.0) with an ionic strength
of ca. 0.3 M, adjusted by addition of KCl, in order to avoid
electrostatic interaction of the covalently bound protein with the
metal surface.
Preparation of Au nanoflake substrates
Au- and Ag nanoflake substrates were prepared according to
our previous report.19 The nanostructured template obtained
by self-assembly of a fullerene derivative on a quartz support20
was sputter-coated with Au or Ag of variable thickness
between 10 to 100 nm. The fullerene derivative can be efficiently
removed from the substrate by immersion in chloroform. After
treatment with O3 plasma for 2 min to remove contaminated
organic species, the Au or Ag nanoflake-covered quartz sub-
strates were immersed in ethanolic solutions containing 2 mM
of 4-aminothiophenol for at least 24 h. Subsequently, the
substrates were carefully rinsed with pure ethanol and dried
in nitrogen gas.
Fig. 1 Schematic illustration of (A) the preparation of Ag-(Cy-NH2)-Au
electrodes and (B) the setup of the electrode with the adsorbed
cytochrome c.
This journal is �c the Owner Societies 2010 Phys. Chem. Chem. Phys., 2010, 12, 9822–9829 | 9823
Dow
nloa
ded
by T
U B
erlin
- U
nive
rsita
etsb
ibl o
n 07
Mar
ch 2
011
Publ
ishe
d on
11
June
201
0 on
http
://pu
bs.r
sc.o
rg |
doi:1
0.10
39/C
0030
82A
View Online

Surface enhancement on layered Ag-(Cy-NH2)-Au materials
Nanostructured hybrid Ag-(Cy-NH2)-Au-(Cx-COOH) devices
are assembled in various combinations of SAMs with different
thickness that either serve for separating the Ag and Au metal
(Cy-NH2 with y = 6, 8, 11) or were used for electrostatic
binding of Cyt-c on the Au surface (Cx-COOHwith x=5, 10, 15).
The intensity of the prominent n4 band of ferrous Cyt c was
chosen for comparing the surface enhancement of the different
systems. Measurements were done at �0.4 V to guarantee that
the protein was present exclusively in its reduced state. SERR
signals of Cyt c adsorbed on Ag-(C11-NH2)-Au-(C11-COOH)
electrodes display an average SERR intensity that was only
slightly lower than for Cyt c on Ag-(Cx-COOH) electrodes
(Fig. 2A). This surprisingly high Raman enhancement of the
Ag-(C11-NH2)-Au-(C11-COOH) system can not result from
direct optical excitation of surface plasmon on Au, which
possesses a low optical activity below 600 nm due to d–d
transitions of the metal. Instead, transfer of optical plasmon
excitation from Ag to Au is assumed to be the origin for the
strong Raman intensities. Long range plasmon coupling between
two optically active nanostructures has been previously reported
in the literature21,22 for distances up to 30 nm. A similar
mechanism was proposed by our group for interaction between
optically active (Ag) and inactive (Au) metallic nanostructures.16,23
Upon decreasing the thickness of the inner layer, a drop
in SERR intensity by a factor of 2 (y = 8, x = 11) and 3
(y = 6 , x = 11) was observed. Presumably, this decrease is
related to defects present in shorter NH2-SAMs resulting in a
more discontinuous Au-film and possibly lower protein coverage.
The enhancement factor (EF) may be determined on the
basis of an early study of Cyt-c adsorbed on Ag colloids24
assuming that the enhancement is the same as for electro-
chemically roughened Ag electrodes. In that study, an EF was
determined to be 8 � 104 for 407 nm excitation which is likely
to be the same as for 413 nm excitation used in this work. For
Cyt-c immobilised on Cx-COOH-coated Ag electrodes, a
decrease in SERR intensity with increasing SAM thickness
was observed,17 which followed the same distance-dependence
previously determined by Compagnini et al.25 Correspondingly,
for Cyt-c immobilised on an Ag electrode coated by a
C10-COOH SAM, the enhancement is estimated to drop by
a factor of ca. 2.5 as compared to Cyt-c directly adsorbed on
an Ag electrode. Thus, EF for Cyt-c on an Ag-(C10-COOH)
electrode is assumed to be ca. 3.2� 104. Under the assumption
that protein surface concentration does not change signifi-
cantly for different Cx-COOH SAMs,17 EFs as a function of
SAM length and hence distance to the Ag surface could be
derived from the measured SERRS intensities (Fig. 2B).
To determine the EF for Cyt-c bound to Ag-(C11-NH2)-Au-
(C10-COOH), however, we have to take into account the
ca. 4 times higher surface coverage compared to Cyt-c on
Ag-(C10-COOH) as determined previously.16 Comparing the
SERR intensities obtained from these two devices under
identical conditions, the EF is then estimated to be ca. 1 � 104
for Cyt-c bound to Ag-(C11-NH2)-Au-(C10-COOH). EFs derived
for the Ag-(C11-NH2)-Au-(Cx-COOH) system decrease with
increasing number of methylene groups of the outer carboxyl-
terminated SAMs; however, the decrease is much less pronounced
than for the same SAMs directly bound to the Ag electrode
(Fig. 2B).
The situation is different for excitation at wavelengths above
600 nm where direct optical excitation of Au surface plasmons
becomes possible. However, with 647 nm excitation, the
SER spectra of the (C10-COOH) SAM on Ag-(C11-NH2)-Au-
(C10-COOH) reveal slightly lower signals than those detected
from Ag-(C10-COOH) (data not shown). We thus conclude
that the Au layer is too thin (ca. 15 nm) for an efficient direct
coupling of the Au surface plasmons with the radiation field at
this excitation line.
These findings imply that an efficient enhancement of the
Raman scattering via direct optical excitation of Au surface
plasmons requires a distinctly higher Au film thickness than
used in the present layered Ag-(Cy-NH2)-Au devices.
To test this hypothesis we have studied the effect of the Au
film thickness on the EF on the basis of Au nanoflakes which
have been shown to represent efficient SER-active materials
for red and near-infrared excitation.19 Fig. 3 displays the SER
spectra of 4-aminothiophenol SAMs on Au nanoflakes of
various metal film thicknesses. At 10 nm, the SER signal can
hardly be detected but it strongly increases by a factor of 40 at
50 nm. For this thickness, a lower limit of the EF has been
Fig. 2 (A) SERR spectra of Cyt c on Ag (black) and Ag-(Cy-NH2)-
Au (grey) electrodes at E = �0.4 V with 413 nm excitation. The
spectra were obtained with the same laser power and accumulation
time. (B) Semi-logarithmic plot of the enhancement factors for
Ag-(Cx-COOH) (hollow circles) and Ag-(C11-NH2)-Au-(Cx-COOH)
(solid squares) as a function of methylene groups of the carboxyl-
terminated SAM (x = 5, 10, 15). The error bars indicate the variation
for measurements from different preparations.
9824 | Phys. Chem. Chem. Phys., 2010, 12, 9822–9829 This journal is �c the Owner Societies 2010
Dow
nloa
ded
by T
U B
erlin
- U
nive
rsita
etsb
ibl o
n 07
Mar
ch 2
011
Publ
ishe
d on
11
June
201
0 on
http
://pu
bs.r
sc.o
rg |
doi:1
0.10
39/C
0030
82A
View Online

estimated to be 105. A further 2.5-fold increase is obtained
when the thickness is increased to 100 nm. A comparably
strong enhancement is also observed for Ag nanoflakes
(data not shown).
However, improvement of the enhancement of the layered
Ag-(Cy-NH2)-Au devices also for direct optical excitation of
the Au surface plasmons in the red spectral region was not
possible without decreasing the performance in the violet
region. Upon increasing the incubation time in the AuCl�4solution and the reduction time for depositing the outer Au
layer, corresponding to an increase of the Au layer thickness,
the SERR signal of Cyt-c probed at 413 nm excitation
decreased.16 This observation can readily be understood in
terms of the increased absorption of the incident light with
higher Au film thickness.
Redox equilibria of electrostatically immobilised cytochrome c
SERR spectra of the Cyt-c (horse heart) electrostatically
immobilised on Ag-(Cy-NH2)-Au-(Cx-COOH) electrodes do
not provide any indications for structural changes of the heme
pocket, as compared to the protein in solution. At each
electrode potential, the SERR spectra can be described by a
superposition of the component spectra of the native reduced
and oxidised state of Cyt-c, denoted as state B1(Fig. 4A). In
this respect, the SERR spectroscopic experiments reveal the
same results as for Cyt-c bound to Ag-(Cx-COOH) electrodes.
The quantitative analysis of the SERR spectra measured as
a function of electrode potential allows determining the redox
potentials of the immobilised proteins taking into account the
relative RR/SERR cross sections of the oxidised and reduced
species (Fig. 4B).17 In all cases, Nernstian plots display
a nearly ideal behaviour for a one-electron transfer process
(n = 0.8 – 0.9; Table 1). These relatively high values for
n indicate a largely uniform orientational distribution of the
immobilized protein. Especially for Cyt c on Ag-(Cy-NH2)-
Au-(C15-COOH), the n values are distinctly closer to one than
for Ag-(C15-COOH) which may be due to a better packing of
the SAM on Au than on Ag, particularly in view of the more
pronounced surface roughness in the latter case.16
The experimentally determined redox potentials are slightly
shifted with respect to the redox potential of the protein in
solution. For Ag-(C11-NH2)-Au-(C10-COOH), this shift (ERC)
is �56 mV and therefore slightly more pronounced than for
Cyt-c adsorbed on either Ag-(C10-COOH) or Au-(C10-COOH)
for which �40 mV and �20 mV respectively has been deter-
mined. These shifts are due to the interfacial drop across the
SAM and can be rationalised on the basis of simple electro-
static considerations17 which suggest a relationship between
the redox potential shift ERC and the difference between
the redox potential E0 and the potential of zero charge
Epzc., i.e., DEPZC = |E0 �EPZC|. For Ag-(C10-COOH) and
Ag-(C11-NH2)-Au-(C10-COOH), Epzc has been determined
to be �0.45 V and �0.20 V, respectively. Moreover, for
Au-(C10-COOH) DEPZC is close to zero (Epzc = 0.03 V)26
Fig. 3 SER spectra of 4-aminothiophenol with 1064 nm excitation on
Au nanoflakes with (from bottom to top) 10, 50 and 100 nm Au
thickness. The inset represents an SEM image of the Au nanoflakes
with 50 nm Au thickness. The spectra were obtained with the same
laser power and accumulation time.
Fig. 4 A SERR spectrum of Cyt c on Ag-(Cy-NH2)-Au electrodes at
�0.075 V. The grey, thin solid, and dotted lines refer to the experi-
mental spectrum and the component spectra of the reduced and
oxidised Cyt c (B1), respectively. B, relative concentrations of the
reduced (hollow circles) and oxidised (squares) form of Cyt c (B1) as a
function of potential, as determined from the SERR experiments.
This journal is �c the Owner Societies 2010 Phys. Chem. Chem. Phys., 2010, 12, 9822–9829 | 9825
Dow
nloa
ded
by T
U B
erlin
- U
nive
rsita
etsb
ibl o
n 07
Mar
ch 2
011
Publ
ishe
d on
11
June
201
0 on
http
://pu
bs.r
sc.o
rg |
doi:1
0.10
39/C
0030
82A
View Online

such that the lack of a notable redox potential shift can
readily be understood. However, this simple electrostatic
model fails to account for (a) the higher redox shifts observed
for Ag-(Cy-NH2)-Au systems and (b) the increasing values
for ERC from x = 6 (�5 mV) to x = 15 (+15 mV) at
Ag-(C11-NH2)-Au-(Cx-COOH), in contrast to the opposite
tendency at Ag-(Cx-COOH).17 Evidently, the underlying
assumptions of the electrostatic model are too crude to provide
a fully consistent description of the complex interfacial poten-
tial distribution of a metal/SAM multilayer device.
Redox equilibria of the covalently immobilised cytochromes
In contrast to horse heart Cyt c, iso-1 cytochrome c from yeast
exhibits a single surface cysteine at position 102, which can be
used for selective binding to pure metal surfaces. Upon covalent
attachment of Cyt c (yeast) via Cys102 we have observed a
significantly better performance on Ag-(C11-NH2)-Au which
affords a SERR intensity that is ca. 25 times higher than for
Ag under otherwise similar experimental conditions (Fig. 5).
We attribute this effect to the higher affinity of the thiol side
chain of Cys102 to Au, corresponding to a higher surface
coverage. However, potential-dependent SERR spectra of the
covalently bound Cyt-c on Ag-(C11-NH2)-Au reveal structural
changes in the heme pocket of the protein not observed upon
electrostatic immobilisation. For the covalently bound Cyt-c,
the SERR spectra include spectral markers that are charac-
teristic of a non-native ferric state of Cyt-c in which the Met80
ligand is replaced by a His residue (His33 or His26).27
In previous studies it has been shown that this species,
denoted as B2 state, is induced either via strong electrostatic
fields with lysine residues around the exposed heme edge, or by
hydrophobic interactions that involve the nonpolar peptide
segment 81–85. In both cases, the primary step is the removal
of the Met80 ligand from the heme. This coordination site can
be then occupied by His33 or His26 to yield the six-coordinated
low-spin (6cLS) of B2 or remains vacant, corresponding to a
five-coordinated high spin (5cHS). The 6cLS and 5cHS species
of B2, which can readily be distinguished on the basis of the
characteristic RR/SERR spectroscopic signature (Fig. 6A),27
thus typically coexist under strong electric fields17,28 and in
hydrophobic environments.29 Such conditions do not appear
to hold for the covalently bound Cyt-c on Au and, in addition,
only the 6cLS form of B2 but not the 5cHS species is
detectable in the SERR spectra. We, therefore, suggest that
in this case the conformational transition to the 6cLS B2 form
occurs via a different mechanism. Taking into account that
Cys102 is in close proximity to His33 (Fig. 5B), it may be that
the covalent attachment to the Au surface via the side chain of
Cys102 destabilises the region in the vicinity of His33 and
eventually favours the displacement of the peptide segment
involving His33 towards the heme pocket, such that this
residue may effectively compete with Met80 for binding to
the heme iron.
For the covalently bound Cyt-c, the relative concentration
of the ferric B2(6cLS) state is potential-independent and ca.
40% in the potential range between +0.1 V and �0.35 V
(Fig. 6B). This finding can be understood taking into account
that the redox potential of this species is between �0.35 and
�0.40 V.28 The remaining 60% of the covalently bound Cyt-c
is in the native B1 state and is fully redox-active although the
redox transition appears to be more complex than for the
electrostatically bound Cyt-c (vide supra). Here the potential-
dependent distribution between the ferric and ferrous B1 state,
as derived from the SERR spectra, shows two transitions
associated with lower values for n (ca. 0.3) and more negative
redox potentials (�0.1 and �0.25 V) as compared to the
electrostatically immobilised protein (Fig. 4). Evidently, the
Table 1 Redox potentials (E0) in V and number of transferredelectrons (n) for the redox process of cytochrome c (horse heart) onvarious coated Ag, Au, and Ag–Au hybrid electrodesa
C5–COOH C10–COOH C15–COOH
E0 n E0 n E0 n
Ag no 0.020 0.8 0.020 0.85 0.006 0.65Ag–Au C6–NH2 nd nd �0.001 0.89 nd nd
C8–NH2 nd nd 0.007 0.92 nd ndC11–NH2 �0.005 0.9 0.004 0.78 0.015 0.88
Aua no 0.037 0.81 0.040 0.77 0.030 0.84
a Data determined from SEIRA spectroscopy.32 Error margins for
redox potentials are �0.03 V; nd, not determined.
Fig. 5 Top, SERR spectra of Cyt c covalently bound via Cys102 on
Ag (black) and Ag-(Cy-NH2)-Au (grey) electrodes. Bottom, protein
structure of yeast Cyt c showing the positions of Met80, His26, His33
and Cys102.
9826 | Phys. Chem. Chem. Phys., 2010, 12, 9822–9829 This journal is �c the Owner Societies 2010
Dow
nloa
ded
by T
U B
erlin
- U
nive
rsita
etsb
ibl o
n 07
Mar
ch 2
011
Publ
ishe
d on
11
June
201
0 on
http
://pu
bs.r
sc.o
rg |
doi:1
0.10
39/C
0030
82A
View Online
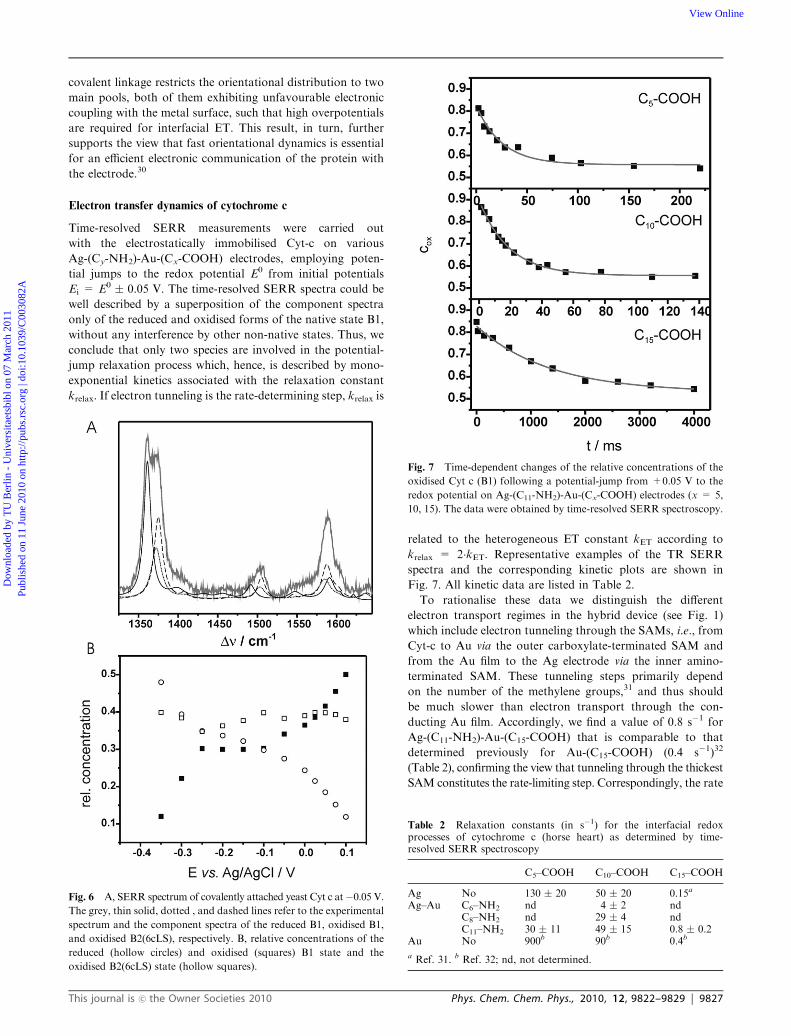
covalent linkage restricts the orientational distribution to two
main pools, both of them exhibiting unfavourable electronic
coupling with the metal surface, such that high overpotentials
are required for interfacial ET. This result, in turn, further
supports the view that fast orientational dynamics is essential
for an efficient electronic communication of the protein with
the electrode.30
Electron transfer dynamics of cytochrome c
Time-resolved SERR measurements were carried out
with the electrostatically immobilised Cyt-c on various
Ag-(Cy-NH2)-Au-(Cx-COOH) electrodes, employing poten-
tial jumps to the redox potential E0 from initial potentials
Ei = E0 � 0.05 V. The time-resolved SERR spectra could be
well described by a superposition of the component spectra
only of the reduced and oxidised forms of the native state B1,
without any interference by other non-native states. Thus, we
conclude that only two species are involved in the potential-
jump relaxation process which, hence, is described by mono-
exponential kinetics associated with the relaxation constant
krelax. If electron tunneling is the rate-determining step, krelax is
related to the heterogeneous ET constant kET according to
krelax = 2�kET. Representative examples of the TR SERR
spectra and the corresponding kinetic plots are shown in
Fig. 7. All kinetic data are listed in Table 2.
To rationalise these data we distinguish the different
electron transport regimes in the hybrid device (see Fig. 1)
which include electron tunneling through the SAMs, i.e., from
Cyt-c to Au via the outer carboxylate-terminated SAM and
from the Au film to the Ag electrode via the inner amino-
terminated SAM. These tunneling steps primarily depend
on the number of the methylene groups,31 and thus should
be much slower than electron transport through the con-
ducting Au film. Accordingly, we find a value of 0.8 s�1 for
Ag-(C11-NH2)-Au-(C15-COOH) that is comparable to that
determined previously for Au-(C15-COOH) (0.4 s�1)32
(Table 2), confirming the view that tunneling through the thickest
SAM constitutes the rate-limiting step. Correspondingly, the rate
Fig. 6 A, SERR spectrum of covalently attached yeast Cyt c at�0.05 V.The grey, thin solid, dotted , and dashed lines refer to the experimental
spectrum and the component spectra of the reduced B1, oxidised B1,
and oxidised B2(6cLS), respectively. B, relative concentrations of the
reduced (hollow circles) and oxidised (squares) B1 state and the
oxidised B2(6cLS) state (hollow squares).
Fig. 7 Time-dependent changes of the relative concentrations of the
oxidised Cyt c (B1) following a potential-jump from +0.05 V to the
redox potential on Ag-(C11-NH2)-Au-(Cx-COOH) electrodes (x = 5,
10, 15). The data were obtained by time-resolved SERR spectroscopy.
Table 2 Relaxation constants (in s�1) for the interfacial redoxprocesses of cytochrome c (horse heart) as determined by time-resolved SERR spectroscopy
C5–COOH C10–COOH C15–COOH
Ag No 130 � 20 50 � 20 0.15a
Ag–Au C6–NH2 nd 4 � 2 ndC8–NH2 nd 29 � 4 ndC11–NH2 30 � 11 49 � 15 0.8 � 0.2
Au No 900b 90b 0.4b
a Ref. 31. b Ref. 32; nd, not determined.
This journal is �c the Owner Societies 2010 Phys. Chem. Chem. Phys., 2010, 12, 9822–9829 | 9827
Dow
nloa
ded
by T
U B
erlin
- U
nive
rsita
etsb
ibl o
n 07
Mar
ch 2
011
Publ
ishe
d on
11
June
201
0 on
http
://pu
bs.r
sc.o
rg |
doi:1
0.10
39/C
0030
82A
View Online
constant increase by nearly two orders of magnitude to 49 s�1
upon reducing the thickness of the outer SAM, i.e. for
Ag-(C11-NH2)-Au-(C10-COOH). This value is low by a factor
of ca. 2 compared to that measured for the Au-(C10-COOH)
system, evidently due to the fact that in the hybrid device
tunneling occurs via two SAMs of nearly the same thickness.
Correspondingly, ET through Ag-(C11-NH2)-Au-(C5-COOH)
is expected to be limited by tunneling through the inner layer
which seems to be confirmed since krelax is similar albeit not
identical to the value for Ag-(C11-NH2)-Au-(C10-COOH).
Note that for Au-(C5-COOH) and Ag-(C5-COOH), krelax are
substantially larger and in these cases protein dynamics rather
than electron tunneling represents the rate-limiting step.30
Whereas for the Ag-(C11-NH2)-Au-(Cx-COOH) hybrid
electrodes, ET kinetics can be largely understood in terms of
the interplay between tunneling through the inner and the
outer SAM, surprising kinetic data were obtained for hybrid
electrodes in which the thickness of the inner SAM was varied
(Cy-NH2 with x = 6, 8, 11) without changing the outer SAM
(C10-COOH). Here we note a steady decrease of krelax with 49,
29, and 4 s�1 for y = 11, 8, and 6, respectively (Table 1). One
possible explanation may be that during the incubation of
the Ag-(Cy-NH2) electrode with AuCl–4 and the subsequent
electrochemical reduction, impurities are introduced into the
SAM which influence the electron transfer across the SAM.33
A possible damage of the spacer SAM could already occur
during the Au reduction due to the very negative potentials
and the presence of Cl� ions. This hypothesis is supported by
the fact that the rate for Ag-(C6-NH2)-Au-(C10-COOH) could
significantly be increased up to k = 35 s�1 if during the Au
reduction phosphate buffer was used instead of KCl and the
reduction potential was changed to �0.1 V. Both parameters
have a direct influence on the quality and protonation state of
the Cy-NH2 SAM but will not alter the tunneling distance
between the Au-islands and the Ag electrode.
Experimental
Chemicals
11-Mercaptoundecanoic acid (C10-COOH), 16-mercaptohexa-
decanoic acid (C15-COOH), sodium tetrachloroaurate (III)
dihydrate (Sigma Aldrich), 6-mercaptohexanoic acid (C5-COOH),
6-amino-1-hexanethiol hydrochloride (C6-NH2), 8-amino-1-
octanethiol hydrochloride (C8-NH2) and 11-amino-1-undecane-
thiol hydrochloride (C11-NH2) (Dojindo) were used without
further purification. Horse heart cytochrome c and yeast iso-1
cytochrome c from Sigma were purified by high performance
liquid chromatography. The water used in all experiments was
purified by a Millipore system and its resistivity was higher
than 18 MO cm.
Raman spectroscopic and electrochemical measurements
SER spectra of 4-aminothiophenol-coated Au nanoflakes were
obtained with 1064-nm excitation using FT-Raman spectro-
meter (Bruker RFS 100/S). For SERR experiments with
Cyt-c (413-nm excitation), a confocal Raman spectrometer
(LabRam HR-800, Jobin Yvon) was used. Details of the
experimental set-up including the spectroelectrochemical cell
are given elsewhere.34 SERR spectra of Cyt-c were acquired
with a spectral resolution of 2 cm�1 and an increment per data
point of 0.57 cm�1 using a laser power 1.5 mW. The accumu-
lation times were between 1 and 3 s. For time-resolved (TR)
SERR experiments, potential jumps of variable duration and
size were applied. The relaxation process of the surface
bound protein was probed by measuring the SERR spectra
at variable delay time (d0) after each jump. Synchronization of
potential jumps and measuring laser pulses was achieved with
a homemade four-channel pulse-delay generator. Short laser
pulses of a duration Dt were generated by passing the
continuous wave laser beam through two consecutive laser
intensity modulators (Linos). The time-dependent spectro-
scopic results are displayed in the following as a function of
the delay time (d) defined as d = d0 +Dt/2. The working
electrode was rotated at ca. 5 Hz to avoid laser induced
sample degradation. After polynomial baseline subtraction,
the measured SERR spectra were treated with homemade
component analysis software.
The potential of zero-charge was determined by impedance
spectroscopy as described previously.35 All potentials cited in
this work refer to the Ag/AgCl (3M KCl) electrode.
Conclusions
Ag-(Cy-NH2)-Au-(Cx-COOH) devices are suitable substrates
for SE(R)R spectroscopy, exhibiting enhancement factors and
profiles that are quite comparable to Ag electrodes. Thus, it
can be preferentially employed for excitation lines below
550 nm. For excitation at longer wavelengths, a distinctly
increase of the Au film thickness is required which, however,
would drastically lower the enhancement below 550 nm. The
enhancement can be further increased by replacing a planar
surface by a nanoflake-like support.
The electrodes represent an excellent platform for analysing
interfacial electron transfer processes. The multilayer structure
of metals and organic films causes only small potential drops.
Electron transfer across these junctions is limited by electron
tunneling through the organic films, specifically the outer
SAM that serves for protein binding.
Acknowledgements
The authors would like to thank Tillmann Utesch for support
in preparing graphics and Diego Millo for fruitful discussions.
Financial support was given by the DFG (SfB 448), the Fonds
der Chemischen Industrie (M.S and I.M.W.), and the National
Science Foundation of China (J.J.F.; NSFC No. 20905021).
Notes and references
1 I. Willner and E. Katz, Bioelectronics, Wiley-VCH, Weinheim,2005.
2 D. Chen, G. Wang and J. H. Li, J. Phys. Chem. C, 2007, 111, 2351.3 I. Willner and E. Katz, Angew. Chem., Int. Ed., 2000, 39, 1180.4 M. J. Tarlov and E. F. Bowden, J. Am. Chem. Soc., 1991, 113,1847.
5 D. H. Murgida and P. Hildebrandt, Phys. Chem. Chem. Phys.,2005, 7, 3773.
6 Y. Lvov, K. Ariga, I. Ichinose and T. Kunitake, J. Am. Chem.Soc., 1995, 117, 6117.
9828 | Phys. Chem. Chem. Phys., 2010, 12, 9822–9829 This journal is �c the Owner Societies 2010
Dow
nloa
ded
by T
U B
erlin
- U
nive
rsita
etsb
ibl o
n 07
Mar
ch 2
011
Publ
ishe
d on
11
June
201
0 on
http
://pu
bs.r
sc.o
rg |
doi:1
0.10
39/C
0030
82A
View Online
7 M. Gerard, A. Chaubey and B. D. Malhotra, Biosens. Bioelectron.,2002, 17, 345.
8 F. A. Armstrong, H. A. O. Hill and N. J. Walton, Acc. Chem. Res.,1988, 21, 407.
9 C. Leger and P. Bertrand, Chem. Rev., 2008, 108, 2379.10 F. A. Armstrong and G. S. Wilson, Electrochim. Acta, 2000, 45, 2623.11 D. L. Jeanmaire and R. P. Vanduyne, J. Electroanal. Chem., 1977,
84, 1.12 K. Kneipp, M. Moskovits and H. Kneipp, Surface-enhanced
Raman Scattering, Springer, Berlin, 2006.13 F. Siebert and P. Hildebrandt, Vibrational Spectroscopy in Life
Science, Wiley-VCH, Weinheim, 2008.14 D. H. Murgida and P. Hildebrandt, Angew. Chem., Int. Ed., 2001,
40, 728.15 J. A. Sanchez-Gil and J. V. Garcia-Ramos, J. Chem. Phys., 1998,
108, 317.16 J. J. Feng, U. Gernert, M. Sezer, U. Kuhlmann, D. H. Murgida,
C. David, M. Richter, A. Knorr, P. Hildebrandt andI. M. Weidinger, Nano Lett., 2009, 9, 298.
17 D. H. Murgida and P. Hildebrandt, J. Phys. Chem. B, 2001, 105,1578.
18 H. A. Heering, F. G. M. Wiertz, C. Dekker and S. de Vries, J. Am.Chem. Soc., 2004, 126, 11103.
19 Y. F. Shen, J. B. Wang, U. Kuhlmann, P. Hildebrandt, K. Ariga,H. Mohwald, D. G. Kurth and T. Nakanishi, Chem.–Eur. J., 2009,15, 2763.
20 T. Nakanishi, N. Miyashita, T. Michinobu, Y. Wakayama,T. Tsuruoka, K. Ariga and D. G. Kurth, J. Am. Chem. Soc.,2006, 128, 6328.
21 L. D. Qin, S. L. Zou, C. Xue, A. Atkinson, G. C. Schatz andC. A. Mirkin, Proc. Natl. Acad. Sci. U. S. A., 2006, 103(36), 13300.
22 L. He, E. A. Smith,M. J. Natan and C. D. Keating, J. Phys. Chem. B,2004, 108(30), 10973.
23 C. David, M. Richter, A. Knorr, I. M. Weidinger andP. Hildebrandt, J. Chem. Phys., 2010, 132, 024712.
24 P. Hildebrandt and M. Stockburger, J. Phys. Chem., 1986, 90,6017.
25 G. Compagnini, C. Galati and S. Pignataro, Phys. Chem. Chem.Phys., 1999, 1, 2351.
26 P. Ramırez, R. Andreu, A. Cuesta, C. J. Calzado andJ. J. Calvente, Anal. Chem., 2007, 79, 6473.
27 S. Oellerich, H. Wackerbarth and P. Hildebrandt, J. Phys. Chem. B,2002, 106, 6566.
28 H. Wackerbarth and P. Hildebrandt, ChemPhysChem, 2003, 4,714.
29 L. Rivas, D. H. Murgida and P. Hildebrandt, J. Phys. Chem. B,2002, 106, 4823.
30 A. Kranich, H. K. Ly, P. Hildebrandt and D. H. Murgida, J. Am.Chem. Soc., 2008, 130, 9844.
31 D. H. Murgida and P. Hildebrandt, J. Am. Chem. Soc., 2001, 123,4062.
32 N. Wisitruangsakul, I. Zebger, H. K. Ly, D. H. Murgida,S. Ekgasit and P. Hildebrandt, Phys. Chem. Chem. Phys., 2008,10, 5276.
33 R. E. Holmlin, R. Haag, M. L. Chabinyc, R. F. Ismagilov,A. E. Cohen, A. Terfort, M. A. Rampi and G. M. Whitesides,J. Am. Chem. Soc., 2001, 123, 5075.
34 H. Wackerbarth, U. Klar, W. Gunther and P. Hildebrandt, Appl.Spectrosc., 1999, 53, 283.
35 J. J. Feng, D. H. Murgida, U. Kuhlmann, T. Utesch,M. A. Mroginski, P. Hildebrandt and I. M. Weidinger, J. Phys.Chem. B, 2008, 112, 15202.
This journal is �c the Owner Societies 2010 Phys. Chem. Chem. Phys., 2010, 12, 9822–9829 | 9829
Dow
nloa
ded
by T
U B
erlin
- U
nive
rsita
etsb
ibl o
n 07
Mar
ch 2
011
Publ
ishe
d on
11
June
201
0 on
http
://pu
bs.r
sc.o
rg |
doi:1
0.10
39/C
0030
82A
View Online

Human Sulphite Oxidase (6)
65
6 Human Sulphite Oxidase
Sulphite oxidases constitute one of three enzyme families that contain a molybdopterin cofactor
(moco) (figure 6) [71]. The others are the xanthine oxidase and dimethyl sulphoxide reductase
families. Moco containing enzymes are all oxidoreductases, however, they differ in their specific
target molecules and the direction of their change in oxidation state. Sulphite oxidases catalyse the
oxidation of sulphite to sulphate. The three enzyme families differ in the coordination pattern of the
central molybdenum atom. In dimethyl sulphoxide reductases, the molybdenum is coordinated by
four thiolates of two pterin molecules and additional ligands. In contrast, in sulphate oxidases and
xanthine oxidases the molybdenum is coordinated by two thiolates of only one pterin and additional
ligands, which are different for the different families. The chemical structure of the cofactor in
sulphite oxidases is depicted in figure 6:
HN
HN
NH
O
O
S
S
MoVI
H2N
O
O
PO
O-
-O
S
O-
-OO
..
S-Cys
Figure 6: Chemical structure of sulphite (right) and the molybdopterin cofactor (left) of sulphite oxidases [202].
Sulphite oxidases are essential for the sulphur metabolism of many organisms. They catalyse
the terminal reaction in the oxidative degradation pathway of sulphur containing amino acids
cysteine and methionine [71-74]. Sulphite oxidases have attracted attention of medical research
since genetic human sulphite oxidase deficiency, which can occur due to point mutations, results
in profound defects, severe neonatal neurological problems and early death, with no effective
therapies known [73-75]. These severe consequences occur when sulphite can not be oxidised
because sulphite may disturb the tertiary structure of proteins by sulphitolysis of disulphide
bridges in the protein [76]. Research on sulphite oxidases was also motivated by the fact that
sulphites are widely used in food and pharmaceutical industries. They reduce or prevent microbial
spoilage and prevent oxidation of foods [85-87]. However, they may cause allergic reactions and
trigger asthma and many other diseases [88-89]. Hence, there is a demand for versatile and low
cost quantitative sulphite sensor devices. A promising approach in this respect is the development
of enzyme based bioelectronic sensor devices that take advantage of the sulphite selectivity and
sensitivity of sulphite oxidases upon immobilisation and electronic coupling to conducting support
materials [15, 78, 79].

Human Sulphite Oxidase – Catalytic Mechanism (6.2)
66
6.1 Structure of Human Sulphite Oxidase
Human sulphite oxidase (hSO) is a homo-dimeric anionic enzyme of 110 kDa and is located in
the intermembrane space of human mitochondria. With 68 % sequence identity, the structure and
functioning of hSO is similar to its analogue from chicken liver (clSO), for which a crystal structure
at 1.9 Å has been reported [73]. Each monomer consists of three subdomains and a loop region,
which connects the relatively small cytochrome b5 (Cyt b5) domain with the large moco
harbouring domain. The loop region is poorly resolved in the crystal structure of clSO, pointing
towards a high flexibility of this region. The third domain is the dimerisation domain at which the
protein dimerises in a head-to-head arrangement. The dimer is formed via numerous hydrogen
bonds and salt bridges between the dimerisation domains of the monomers.
Figure 6.1: Homology structure of human sulphite oxidase (hSO) on the basis of the crystal structure of chicken liver
oxidase (PDB: 1sox) and the hSO amino acid sequence (UniProtKB database entry P51687). The cytochrome b5 (Cyt
b5) subunit is coloured in red, molybdopterin harbouring (moco) subunit in yellow and the dimerisation domain in
green. The loop region connecting the Cyt b5 and the moco domain is coloured in cyan. The protein backbone
structure is depicted in new cartoon representation and the molybdopterin and heme cofactors are depicted in van
der Waals representation [77].
The distance between the molybdenum and iron metal centers of the cofactors in the hSO
structure model derived from the crystal structure of clSO is 32 Å. The moco domain is deeply
buried in the protein matrix of the large moco domain, whereas the heme cofactor is located close
to the surface of the Cyt b5 domain.
6.2 Catalytic Mechanism of Sulphite Oxidases
The mechanism of catalytic sulphite oxidation by sulphite oxidases has been investigated in
detail and is depicted in figure 6.2 [13, 80 – 84, 202]. It was shown that the catalytic reaction

Human Sulphite Oxidase – Catalytic Mechanism (6.2)
67
takes place at the molybdenum atom. Sulphite binds to an oxygen atom of the moco. The
molybdenum takes up two electrons and is reduced from state +VI to +IV upon substrate binding
[202]. Subsequently, the oxygen atom is transferred from the moco to the sulphite and hydoxide
from a water molecule, which is involved in the catalytic reaction, binds to the molybdenum. The
initial coordination and oxidation state at the molybdenum atom (figure 6) is recovered by proton
release and two consecutive electron transfer processes via the Cyt b5 domain to an external
redox partner, which is cytochrome c. Thus, catalytic sulphite oxidation also provides electrons to
the respiratory chain.
Cyt c (II)
Cyt c (III)
IET
Cyt c (II) Cyt c (III)
Mo(VI) / Fe(II)
Mo(V) / Fe(III) Mo(V) / Fe(II)
SO2-
4 + 2 H
+
Mo(IV) / Fe(III)
Mo(VI) / Fe(III)SO
2-
3 + H
2O
IET
Figure 6.2: Mechanism of catalytic sulphite oxidation. IET – intramolecular electron transfer.
With the metal to metal distance of 32 Å in the homology structure, the intramolecular electron
transfer step (IET) from the moco to the Cyt b5 domain would be very inefficient [49]. The crystal
structure, however, represents a static picture. It was shown that the position of the heme with
respect to the moco is flexible. The flexibility is provided by the loop region and enables the heme
to approach the moco thereby facilitating IET. The reduced Cyt b5 is then removed again from the
moco domain and reacts with the external redox partner. If immobilised on electrodes,
cytochrome c can be replaced by the electrode as the external redox partner [5, 14, 15].
It was found that the performance of sulphite oxidases strongly depend on external
conditions, such as the pH, ionic strength and composition of the buffer solution [13, 82-84]. It is
also reported that the catalytic activity is around one order of magnitude lower in the immobilised
state with respect to the value in solution [5, 13-15, 82]. The motivation of the combined SERR
spectroscopic and electrochemical study of hSO (chapter 6.3) was to gain insight into the
molecular processes that are responsible for these observations and to possibly improve the
performance of immobilised hSO.

68
69
6.3 Redox properties and catalytic activity of surface-bound human
sulfite oxidase studied by a combined surface enhanced resonance
Raman spectroscopic and electrochemical approach
Murat Sezer,a Roberto Spricigo,b Tillmann Utesch,a Diego Millo,a Silke Leimkühler,b Maria A.
Mroginski,a Ulla Wollenberger,b Peter Hildebrandta and Inez M. Weidinger*a
a Technische Universität Berlin, Institut für Chemie, Sekr. PC14, Straße des 17. Juni 135, D-10623 Berlin, Germany.
*correspondence to E-mail: [email protected]; Fax: +49 3031421122; Tel: +49 3031422780
b Institut für Biochemie und Biologie, Universität Potsdam, Karl-Liebknecht Straße 24-25, H. 25, Golm, D-14476, Germany.
Published in Phys. Chem. Chem. Phys., 2010, 12, 7894 – 7903.
Reproduced with permission of the PCCP Owner Societies.

70

Redox properties and catalytic activity of surface-bound human sulfite
oxidase studied by a combined surface enhanced resonance Raman
spectroscopic and electrochemical approachw
Murat Sezer,aRoberto Spricigo,
bTillmann Utesch,
aDiego Millo,
a
Silke Leimkuehler,bMaria A. Mroginski,
aUlla Wollenberger,
b
Peter Hildebrandtaand Inez M. Weidinger*
a
Received 23rd December 2009, Accepted 28th April 2010
First published as an Advance Article on the web 26th May 2010
DOI: 10.1039/b927226g
Human sulfite oxidase (hSO) was immobilised on SAM-coated silver electrodes under
preservation of the native heme pocket structure of the cytochrome b5 (Cyt b5) domain and
the functionality of the enzyme. The redox properties and catalytic activity of the entire enzyme
were studied by surface enhanced resonance Raman (SERR) spectroscopy and cyclic voltammetry
(CV) and compared to the isolated heme domain when possible. It is shown that heterogeneous
electron transfer and catalytic activity of hSO sensitively depend on the local environment of
the enzyme. Increasing the ionic strength of the buffer solution leads to an increase of the
heterogeneous electron transfer rate from 17 s�1 to 440 s�1 for hSO as determined by SERR
spectroscopy. CV measurements demonstrate an increase of the apparent turnover rate for the
immobilised hSO from 0.85 s�1 in 100 mM buffer to 5.26 s�1 in 750 mM buffer. We suggest that
both effects originate from the increased mobility of the surface-bound enzyme with increasing
ionic strength. In agreement with surface potential calculations we propose that at high ionic
strength the enzyme is immobilised via the dimerisation domain to the SAM surface. The flexible
loop region connecting the Moco and the Cyt b5 domain allows alternating contact with the
Moco interaction site and the SAM surface, thereby promoting the sequential intramolecular and
heterogeneous electron transfer from Moco via Cyt b5 to the electrode. At lower ionic strength,
the contact time of the Cyt b5 domain with the SAM surface is longer, corresponding to a slower
overall electron transfer process.
Introduction
Human sulfite oxidase (hSO) is a 110 kDa enzyme in the
intermembrane space of mitochondria. It catalyses the oxida-
tion of sulfite to sulfate, which is the terminal reaction in the
oxidative degradation of the sulfur-containing amino acids
cysteine and methionine.1 The structure of hSO is likely to be
the same as its analogue from chicken liver, for which a crystal
structure at 1.9 A has been determined.2 This protein is a
homodimer and each monomer contains an N-terminal cyto-
chrome b5 (Cyt b5) domain, a large central domain harboring
the molybdenum cofactor (Moco), and a large C-terminal
dimerisation domain.2,3 The Moco and Cyt b5 domains are
connected by a loop region, which provides high flexibility
between them. Catalytic sulfite oxidation takes place at theMoco
domain followed by a fast intramolecular electron transfer to the
heme center of the Cyt b5 domain. The electron is subsequently
transferred to an external redox partner (Fig. 1).1
When the enzyme is immobilised on a conducting support
the natural external redox partner cytochrome c can be
replaced by an electrode, which allows triggering the catalytic
cycle via control of the potential applied at the electrode.
Electrochemical studies of hSO on metal electrodes in single-
and multilayer systems have shown that catalytic activity can
be preserved in the immobilised state pointing to possible
applications of this system as a sensitive sulfite biosensor.4–6
Fig. 1 Scheme of the catalytic sulfite oxidation by human sulfite
oxidase.
a Technische Universitat Berlin, Institut fur Chemie, Sekr. PC 14,Straße des 17. Juni 135, D-10623 Berlin, Germany.E-mail: [email protected]
b Institut fur Biochemie und Biologie, Universitat Potsdam,Karl-Liebknecht Straße 24-25, H. 25, Golm, D-14476, Germany
w Electronic supplementary information (ESI) available: Absorptionspectra of hSO and the isolated Cyt b5 domain, desorption of theisolated Cyt b5 domain at 50 mM buffer concentration, superpositionof crystal structure of chicken liver SO and homology model of hSO,non-turnover and turnover CV signal of hSO, and effect of substrateconcentration and pH on the catalytic current. See DOI: 10.1039/b927226g
7894 | Phys. Chem. Chem. Phys., 2010, 12, 7894–7903 This journal is �c the Owner Societies 2010
PAPER www.rsc.org/pccp | Physical Chemistry Chemical Physics
Dow
nloa
ded
by T
EC
HN
UN
IVE
RSI
TA
T B
ER
LIN
on
30 J
uly
2010
Publ
ishe
d on
26
May
201
0 on
http
://pu
bs.r
sc.o
rg |
doi:1
0.10
39/B
9272
26G
View Online

For chicken liver SO it was shown that the catalytic perfor-
mance of the enzyme is controlled by external parameters such
as pH, ionic strength, and composition of the buffer solution.7–9
Catalytic turnover rates kcat of ca. 100 s�1 are reported for the
enzyme in solution,9 whereas in the immobilised state values of
only 2–20 s�1 have been obtained.6,10 Therefore, it has been
suggested that a large fraction of the enzyme loses its catalytic
activity but remains electroactive upon adsorption.10
In this work, we have applied a combined SERR spectro-
scopic and electrochemical approach to investigate electron
transfer properties and catalytic activity of the surface-bound
hSO. For this purpose SERR spectroscopy is an appropriate
and powerful tool, since it allows probing the vibrational
spectra selectively of the heme center in the Cyt b5 domain
of the immobilised protein.11–13 In addition to electrochemical
techniques, SERR spectroscopic investigation can also provide
information on enzyme denaturation, desorption or catalytic
inactivation. The high sensitivity and selective structural
information afforded by SERR spectroscopy may provide
deeper insight into the mechanism and performance of surface-
bound hSO. In order to understand the adsorption properties
of hSO on surfaces, these experimental spectroscopic and
electrochemical studies are complemented by theoretical
calculations of the dipole moment and the surface potential
distribution of hSO.
Electrochemical and SERR spectroscopic experiments have
been performed on nanostructured Ag electrodes to guarantee
the best possible comparability of the results obtained by both
techniques. Furthermore, these results can then be related to
the kinetics of the enzyme on smooth gold substrates deter-
mined previously4–6,10 and thus provide insight into the role of
electrode material and surface morphology on the enzymatic
processes.
Materials and methods
Materials
8-Aminooctanethiol hydrochloride [in the following denoted
as C8(NH2)] and 11-aminoundecanethiol hydrochloride
[C11(NH2)] were purchased from Dojindo. 6-Mercaptohexanol
[C6(OH)] and 11-mercaptoundecanol [C11(OH)] were provided
by Aldrich. His-tagged human SO was purified after expres-
sion in E. coli TP1000 cells containing the plasmid pTG718 as
described previously.14 To obtain the heme domain, a tryptic
cleavage was applied (100 mg of trypsin for each mg of SO).
The two proteins were incubated for 18 h at 4 1C. The two
parts were afterwards separated by size exclusion chromato-
graphy. In the following we denote the heme domain con-
tained in the integral enzyme as Cyt b5 domain whereas the
isolated heme domain is explicitly referred to as isolated Cyt b5
domain. Sodium sulfite (Na2SO4) was purchased from Merck
and used as substrate for catalytic reactions. The water used in
all experiments was purified by a Millipore system and its
resistance was higher than 18 MO.
Protein immobilisation
Ag ring electrodes were mechanically polished, subjected to an
electrode potential of �2 V for 40 s in 0.1 M KCl and
subsequently roughened electrochemically in the same electro-
lyte solution. All potentials reported here refer to a 3 M KCl
Ag/AgCl reference electrode from World Precision Instru-
ments (+204 mV versus NHE). The roughening consisted of
three oxidation–reduction cycles at +0.3 V and �0.3 V,
respectively, followed by an additional reduction step at
�0.5 V for 5 min. The nanostructured Ag electrodes were
immersed for 24 h into solutions of o-substituted mercaptanes
to form a self-assembled monolayer (SAM). For pure SAMs,
1 mM of C8(NH2) or C11(NH2) has been used. For the mixed
SAMs, 2 mM C8(NH2) and C6(OH) at a ratio of 1 : 1 M/M,
2 mM C11(NH2) and C11(OH) at a ratio of 1 : 1 M/M, and
4 mM C8(NH2) and C6(OH) at a ratio of 1 : 3 M/M have
been employed in a water/ethanol solution (1 : 4 v/v).15 The
presence of water in the SAM-solution favours the protona-
tion of the amino-groups, which may otherwise interact with
the electrode.16 Thus, water ensures the proper binding of
amino-alkanethiols to the Ag electrode via the sulfur atom.
Electrostatic immobilisation of the isolated Cyt b5 domain
and hSO was achieved within 2–4 h by immersion of the
SAM-coated rough Ag electrodes into a 1 mM Tris-acetate
buffer solution at pH 8.5 containingB0.2 mMof the respective
protein. Subsequently, the electrode was transferred to the
buffer solution used for the SERR and electrochemical experi-
ments. The pH of the buffer was adjusted by acetic acid to
avoid possible effects of small anions on the intramolecular
electron transfer.4,9
Spectroscopic and electrochemical measurements
For RR experiments a rotating cuvette was used with a protein
concentration of B30 mM in 5 mM buffer solution at pH 8.5.
SERR and electrochemical measurements were performed
using homemade spectro-electrochemical cells with a volume
of about 10 mL containing the modified Ag ring as the
working electrode, a 3 M KCl Ag/AgCl reference electrode
and a platinum counter electrode.
Cyclic voltammetric experiments were performed with a CH
instrument 660 C (Austin, USA).
SERR and RR spectra of hSO were measured using a
confocal Raman spectrometer (LabRam HR-800, Jobin
Yvon) with a spectral resolution of 2 cm�1 and an increment
per data point of 0.57 cm�1. The 413 nm laser line of a
Coherent Innova 300 c Krypton cw-laser was used for excita-
tion. The laser power on the sample was 1.9 mW for RR and
1.0 mW for SERR experiments, respectively. The laser beam
was focussed by a Nikon 20� objective with a working
distance of 20.5 mm and a numeric aperture of 0.35.
Accumulation times were 40 s and 1–3 s for RR and SERR
spectra, respectively. For time-resolved SERR experiments, poten-
tial jumps of variable duration and size were applied on the
working electrode as described previously.11,17,18 The working
electrode was rotated to avoid laser induced sample degradation.
After polynomial baseline subtraction, the measured SERR
spectra were treated by homemade component analysis software.
Molecular modelling and theoretical calculations
The sequence identity between hSO and chicken liver sulfite
oxidase is very high (67%), suggesting a similar three dimensional
This journal is �c the Owner Societies 2010 Phys. Chem. Chem. Phys., 2010, 12, 7894–7903 | 7895
Dow
nloa
ded
by T
EC
HN
UN
IVE
RSI
TA
T B
ER
LIN
on
30 J
uly
2010
Publ
ishe
d on
26
May
201
0 on
http
://pu
bs.r
sc.o
rg |
doi:1
0.10
39/B
9272
26G
View Online

(3D) structure of these two enzymes. Thus, a homology model
for hSO was constructed using the chicken liver SO as
template (PDB: 1SOX)2 and the amino acid sequence of
hSO contained in the UniProtKB database (entry P51687).19
Those residues located in the loop region connecting the
cytochrome b5 and Moco domain which are missing in the
template structure (A89 in chain A and E86, A87, P88, A89,
A90 and P91 in chain B) were added with the CHARMM
V32b20 code. In the model building procedure, the hSO
N-terminal transit peptides of 81 amino acids each, which
are lacking in the template structure, were removed. During
the modelling, the heme and molybdopterin cofactors and
their linked atoms were restrained to maintain the cofactor
environment of the template. The flexible loops connecting the
Cyt b5 and Moco domains were refined in order to correct for
the high structural uncertainty resulting from the lack of a
template in these regions. The optimisation and refinement of
the 3D structure for hSO was carried out according to the
dope score in MODELLER 9.5.21 Validation of the predicted
structure was done by calculating the root-mean-square devia-
tion (rmsd) with respect to the template structure and by
analysing the corresponding Ramachandran plots. In order
to carry out dipole moment and electrostatic potential calcula-
tions with the homology model of hSO, hydrogen atoms were
incorporated with CHARMM V32b.20 The amino acid side
chains were protonated according to pH 7 and the protonation
configuration of the histidine residues were adjusted to their
environment.
Dipole moment calculations were performed with VMD
1.8.6.22 Partial charges of the apoprotein and the heme
cofactor were taken from the CHARMM 22 force field23
whereas the partial charges of the Moco cofactors were
derived by quantum mechanical calculations.24 The electro-
static potential of the homodimeric enzyme was calculated
with the APBS program25 using the PDB2PQR tool.26
Results
Immobilisation and characterisation of hSO
In the visible region, absorption spectra of hSO measured in
solution display the characteristic electronic transitions of the
heme chromophore and are found to be identical to those of
the isolated Cyt b5 domain (ESIw, Fig. S1), indicating that
electronic transitions of the Moco do not contribute to the
spectra in this region. Correspondingly, also the RR spectra of
hSO (Fig. 2A) measured with 413 nm excitation exclusively
display the vibrational bands of the heme b group and are
indistinguishable from the RR spectra of the isolated Cyt b5.
The spectra show the characteristic vibrational signature of a
six-coordinated low-spin (6cLS) heme in both the ferric and
the ferrous form, as expected for a b-type heme with bis-His
ligation. A minor contribution from a five-coordinated high
spin species might be present in the reduced form, as indicated
by the weak shoulder at 1352 cm�1 of the prominent n4mode at 1360 cm�1 (6cLS) (Fig. 2C). This finding may be
rationalised in terms of the weaker binding affinity of a second
His ligand towards the ferrous as compared to the ferric
heme.27
Unlike the isolated Cyt b5 domain, hSO could be completely
reduced in 150 mM Tris-acetate buffer solution at pH 7.4 by
adding 1 mM sulfite to the sample. This result is a clear
indication for the integrity and catalytic activity of hSO. How-
ever, in 5 mM Tris-acetate buffer solution at pH 8.5, only a
partial hSO reduction is observed. This finding seems to be
contradictive to previous results that show a decrease in cata-
lytic activity with increasing concentration especially of certain
anions such as sulfate or phosphate.7–9 However, no data have
been reported so far for buffer concentrations as low as 5 mM.
SERR spectra of immobilised hSO (Fig. 2B) reveal no
difference in band position compared to the RR spectra.
Accordingly, it is concluded that no changes of the heme
pocket structure have occurred upon immobilisation.
Heterogeneous electron transfer
Initial SERR spectroscopic and electrochemical experiments
aimed at finding optimum conditions for effective heterogeneous
Fig. 2 (A) RR and (B) SERR spectra of hSO in Tris-acetate buffer
solution at pH 7.4. Solid lines represent the experimental spectra of the
oxidised species (A: solution at aerobic atmosphere; B: at E = 0.15 V).
Dashed lines represent the spectra of the reduced species (A: after addition
of an excess concentration of sodium dithionite; B:E=�0.3 V). In B, hSOis immobilised on a rough Ag electrode coated with SAM of C8(NH2)/
C6(OH) (1 : 3M/M). (C) Component analysis in the n4—region of the RR
spectrum of the reduced species. The solid light grey, solid black, solid dark
grey, and dashed black lines represent the experimental spectrum, the
component spectrum of the 6cLS species, the component spectrum of 5cHS
species, and the sum of the component spectra, respectively.
7896 | Phys. Chem. Chem. Phys., 2010, 12, 7894–7903 This journal is �c the Owner Societies 2010
Dow
nloa
ded
by T
EC
HN
UN
IVE
RSI
TA
T B
ER
LIN
on
30 J
uly
2010
Publ
ishe
d on
26
May
201
0 on
http
://pu
bs.r
sc.o
rg |
doi:1
0.10
39/B
9272
26G
View Online
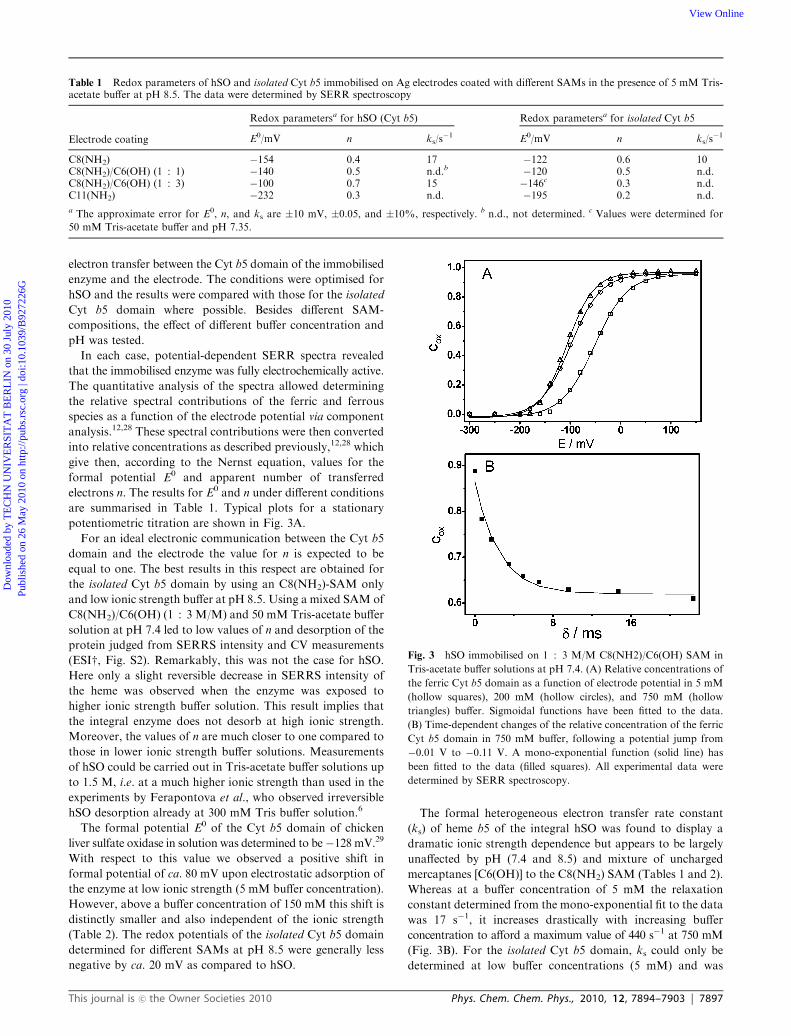
electron transfer between the Cyt b5 domain of the immobilised
enzyme and the electrode. The conditions were optimised for
hSO and the results were compared with those for the isolated
Cyt b5 domain where possible. Besides different SAM-
compositions, the effect of different buffer concentration and
pH was tested.
In each case, potential-dependent SERR spectra revealed
that the immobilised enzyme was fully electrochemically active.
The quantitative analysis of the spectra allowed determining
the relative spectral contributions of the ferric and ferrous
species as a function of the electrode potential via component
analysis.12,28 These spectral contributions were then converted
into relative concentrations as described previously,12,28 which
give then, according to the Nernst equation, values for the
formal potential E0 and apparent number of transferred
electrons n. The results for E0 and n under different conditions
are summarised in Table 1. Typical plots for a stationary
potentiometric titration are shown in Fig. 3A.
For an ideal electronic communication between the Cyt b5
domain and the electrode the value for n is expected to be
equal to one. The best results in this respect are obtained for
the isolated Cyt b5 domain by using an C8(NH2)-SAM only
and low ionic strength buffer at pH 8.5. Using a mixed SAM of
C8(NH2)/C6(OH) (1 : 3 M/M) and 50 mM Tris-acetate buffer
solution at pH 7.4 led to low values of n and desorption of the
protein judged from SERRS intensity and CV measurements
(ESIw, Fig. S2). Remarkably, this was not the case for hSO.
Here only a slight reversible decrease in SERRS intensity of
the heme was observed when the enzyme was exposed to
higher ionic strength buffer solution. This result implies that
the integral enzyme does not desorb at high ionic strength.
Moreover, the values of n are much closer to one compared to
those in lower ionic strength buffer solutions. Measurements
of hSO could be carried out in Tris-acetate buffer solutions up
to 1.5 M, i.e. at a much higher ionic strength than used in the
experiments by Ferapontova et al., who observed irreversible
hSO desorption already at 300 mM Tris buffer solution.6
The formal potential E0 of the Cyt b5 domain of chicken
liver sulfate oxidase in solution was determined to be�128 mV.29
With respect to this value we observed a positive shift in
formal potential of ca. 80 mV upon electrostatic adsorption of
the enzyme at low ionic strength (5 mM buffer concentration).
However, above a buffer concentration of 150 mM this shift is
distinctly smaller and also independent of the ionic strength
(Table 2). The redox potentials of the isolated Cyt b5 domain
determined for different SAMs at pH 8.5 were generally less
negative by ca. 20 mV as compared to hSO.
The formal heterogeneous electron transfer rate constant
(ks) of heme b5 of the integral hSO was found to display a
dramatic ionic strength dependence but appears to be largely
unaffected by pH (7.4 and 8.5) and mixture of uncharged
mercaptanes [C6(OH)] to the C8(NH2) SAM (Tables 1 and 2).
Whereas at a buffer concentration of 5 mM the relaxation
constant determined from the mono-exponential fit to the data
was 17 s�1, it increases drastically with increasing buffer
concentration to afford a maximum value of 440 s�1 at 750 mM
(Fig. 3B). For the isolated Cyt b5 domain, ks could only be
determined at low buffer concentrations (5 mM) and was
Fig. 3 hSO immobilised on 1 : 3 M/M C8(NH2)/C6(OH) SAM in
Tris-acetate buffer solutions at pH 7.4. (A) Relative concentrations of
the ferric Cyt b5 domain as a function of electrode potential in 5 mM
(hollow squares), 200 mM (hollow circles), and 750 mM (hollow
triangles) buffer. Sigmoidal functions have been fitted to the data.
(B) Time-dependent changes of the relative concentration of the ferric
Cyt b5 domain in 750 mM buffer, following a potential jump from
�0.01 V to �0.11 V. A mono-exponential function (solid line) has
been fitted to the data (filled squares). All experimental data were
determined by SERR spectroscopy.
Table 1 Redox parameters of hSO and isolated Cyt b5 immobilised on Ag electrodes coated with different SAMs in the presence of 5 mM Tris-acetate buffer at pH 8.5. The data were determined by SERR spectroscopy
Electrode coating
Redox parametersa for hSO (Cyt b5) Redox parametersa for isolated Cyt b5
E0/mV n ks/s�1 E0/mV n ks/s
�1
C8(NH2) �154 0.4 17 �122 0.6 10C8(NH2)/C6(OH) (1 : 1) �140 0.5 n.d.b �120 0.5 n.d.C8(NH2)/C6(OH) (1 : 3) �100 0.7 15 �146c 0.3 n.d.C11(NH2) �232 0.3 n.d. �195 0.2 n.d.
a The approximate error for E0, n, and ks are �10 mV, �0.05, and �10%, respectively. b n.d., not determined. c Values were determined for
50 mM Tris-acetate buffer and pH 7.35.
This journal is �c the Owner Societies 2010 Phys. Chem. Chem. Phys., 2010, 12, 7894–7903 | 7897
Dow
nloa
ded
by T
EC
HN
UN
IVE
RSI
TA
T B
ER
LIN
on
30 J
uly
2010
Publ
ishe
d on
26
May
201
0 on
http
://pu
bs.r
sc.o
rg |
doi:1
0.10
39/B
9272
26G
View Online

found to be 50% smaller than for the integral enzyme under
similar conditions.
Dipole moment calculations
Superposition of the 3D homology model of hSO and the
crystallographic structure of chicken liver SO yielded an rmsd
for all backbone atoms of 2.5 A (ESIw, Fig. S3). The largest
structural differences refer to the loop regions whereas for the
Cyt b5 domain there are only very small deviations (rmsd ca.
0.65 A) between the 3D model and the crystal structure of the
Cyt b5 domain of chicken liver SO,3 reflecting the reliability of
the structure prediction. Further validation of the predicted
structure was based on the Ramachandran plots. The fact that
more than 95% of the hSO residues lie in favoured regions of
the Ramachandran plot (Ramachandran Z-score: �0.182)30indicates that the homology model is well defined and that
there are no unusual backbone conformations.
In order to predict the preferred orientation of hSO on the
coated electrode surfaces we computed surface potentials as
well as dipole moments of the isolated Cyt b5 domain and of
the hSO monomer and dimer.
In the case of the isolated Cyt b5 domain, the predicted
electrostatic surface potential is in very good agreement with
previous results by Rudolph et al.3 The isolated Cyt b5 domain
exhibits a high negative surface charge density, which is not
only relevant for electron exchange with the Moco domain as
suggested previously3,7–9 but it also plays an important role for
protein adsorption on positively charged surfaces. The dipole
moment of the isolated Cyt b5 domain is determined to be
245 D and its vector forms a 72.61 angle with the porphyrin
plane indicating that the heme would be oriented nearly
parallel to the electrode surface as plotted in Fig. 4.
When considering the entire hSO monomer, the dipole
moment of the enzyme is drastically increased to 770 D and
its vector is oriented in such a way that the negative end is
located at the Cyt b5 domain and the positive end at the dimer
interface as shown in Fig. 4. According to these calculations the
heme cofactor would be oriented almost perpendicular to the
electrode surface (the dipole moment vector forms an angle of
28.11 with respect to the porphyrin plane). However, when hSO
is present as a dimer, the total dipole moment is lowered to
490 D, accompanied by an increase of the angle (69.71) of the
dipole moment vector with respect to the heme planes (Fig. 4).
Electrochemical study of enzymatic activity
CV experiments with hSO immobilised on nanostructured Ag
electrodes were carried out under turnover and non-turnover
conditions, i.e. in the presence and absence of substrate,
respectively. We focused on the investigations of 1 : 3 M/M
C8(NH2)/C6(OH) coatings in view of the good electrochemical
response and protein adsorption. The non-turnover signal
reveals two voltammetric peaks ascribed to the one-electron
redox transition of the heme group of the immobilised hSO
(ESIw, Fig. S4). Observation of the non-turnover signal allowed
determining the amount of electroactive enzyme immobilised
on the electrode according to:31
GhSO ¼Ia4RT
Ann2F2ð1Þ
with Ia denoting the peak current of the non-turnover response
of the immobilised enzyme at a given scan rate n. A is the
surface area of the electrode, n is as defined before and R, T
and F have the usual meaning. Upon addition of an excess of
sulfite (turnover conditions), no catalytic current was observed
in 5 mM buffer solution. However, upon raising the buffer
concentration up to 150 mM, a high catalytic current was
detected (Fig. 5). The current intensity increased further with
increasing buffer concentration up to 750 mM. The maximum
value Imax for each buffer concentration at pH 7.4 was already
reached in the presence of only Z 200 mM sulfite. At a buffer
pH of 8.5, however, a higher substrate concentration (4400 mM)
was needed to reach Imax (ESIw, Fig. S5). Consequently,
all further studies were carried out at pH 7.4. The Michaelis
constant KM for sulfite is by a factor of 3 lower at pH 7.4
Table 2 Redox parameters of hSO immobilised on Ag electrodescoated with C8(NH2)/C6(OH) (1 : 3 M/M) at different pH andTris-acetate concentrations. The data were determined by SERRspectroscopy
Solution conditions Redox parametersa
pH Ionic concentration/mM E0/mV n ks/s�1
7.4 5 �50 0.74 17150 �110 0.82 220500 �110 0.86 340750 �110 0.96 440
8.5 5 �100 0.7 15500 �120 0.86 360
a The approximate error for E0, n, and ks are �10 mV, �0.05, and�10%, respectively.
Fig. 4 Structural models of (A) the isolated Cyt b5 domain, (B) the
hSO monomer, and (C) the hSO dimer. The arrows indicate the dipole
moments. The surface potential is described by a color code with red
and blue referring to negative and positive values, respectively. The
heme group is indicated by the green color.
7898 | Phys. Chem. Chem. Phys., 2010, 12, 7894–7903 This journal is �c the Owner Societies 2010
Dow
nloa
ded
by T
EC
HN
UN
IVE
RSI
TA
T B
ER
LIN
on
30 J
uly
2010
Publ
ishe
d on
26
May
201
0 on
http
://pu
bs.r
sc.o
rg |
doi:1
0.10
39/B
9272
26G
View Online

(B60 mM) than at pH 8.5 (B170 mM) as already proposed for
chicken liver sulfite oxidase in solution studies.9
However, KM values in solution are much lower (B12 mMat pH 7.5 and B30 mM at pH 8.5),9 suggesting a better
accessibility of the active site in solution. Enzymatic activity
(kcat,el) can be derived according to:6
kcat;el ¼Ilim
GhSOAnFð2Þ
where Ilim refers to the maximum catalytic current obtained in
an experiment where mass transport is not the rate limiting
step.32 In the present case, the effects of mass transport can be
neglected due to rotation of the working electrode (vide infra)
and thus we can set Imax = Ilim.
By combining eqn (1) and (2), kcat,el can be calculated to
kcat;el ¼IlimnnFIa4RT
: ð3Þ
This equation is only valid if all redox active enzymes are also
catalytically active. In addition, the apparent turnover rate can
only be set equal to the catalytic rate if the process is not
limited by mass transport of either the substrates to or the
products away from the active site.32
Turnover signals have revealed the highest catalytic current
at substrate concentrations Z 200 mM in 750 mM Tris-acetate
buffer solution at pH 7.4 and rotation of the Ag ring electrode
at 480 rpm. In Fig. 6A the effect of rotation on the CV
is illustrated. For a stationary electrode (no rotation), the
catalytic current decreases rapidly and does not recover by
inverting the scan direction (trace b). This behavior is indicative
of substrate depletion rather than potential-induced inactiva-
tion, as reported for other enzymes.32 However, substrate
depletion can be minimised by fast electrode rotation, leading
to the fully sigmoidal shape shown in trace c of Fig. 6A.
The CV measurements revealed an apparent turnover rate
of kcat,el = 0.85 s�1 in 100 mM Tris-acetate buffer solution
(pH 7.4), which increased in 750 mM buffer to kcat,el = 5.3 s�1
(Table 3). These rates are comparable to those for chicken
liver SO reported by Elliott et al., who obtained turnover
rates of 2–4 s�1, using a pyrolytic graphite electrode and a
C6(OH)-coated polycrystalline gold electrode.10 However,
those data were obtained at much lower buffer concentra-
tions (40 mM). On the other hand, the largest rate constant
determined in the present work is yet roughly four times
smaller than that reported by Ferapontova et al.6 for chicken
liver SO immobilised on a 1 : 1 C11(NH2)/C11(OH) SAM.
These authors obtained turnover rates of ca. 20 s�1 using
100 mM Tris-HCl buffer solution and smooth Au instead of a
rough Ag electrode.
Fig. 5 CV of hSO immobilised on an Ag electrode coated with a
1 : 3 M/M C8(NH2)/C6(OH) SAM at pH 7.4 in the presence of 200 mMsulfite but different Tris-acetate buffer concentrations. a, 5 mM, b,
150 mM, and c, 750 mM. The scan rate was 2 mV s�1.
Fig. 6 CVs of hSO immobilised on an Ag electrode with 1 : 3 M/M
C8(NH2)/C6(OH) SAM in 750 mM Tris-acetate at pH 7.4. The scan
rate was 2 mV s�1. (A) a, in the absence of substrate (solid line); b, in
the presence of 200 mM sulfite without rotation of the electrode
(dashed line); c, in the presence of 200 mM sulfite with rotation of
the electrode at 480 rpm (dotted line). (B) a, without substrate (solid
line); b, in the presence of 200 mM sulfite upon rotation of the electrode
and sweeping to more positive potentials (dashed line); c, in the
presence of 200 mM sulfite upon rotation of the electrode (dotted
line), measured immediately after b; d, measured two hours after c
(short dotted line).
Table 3 Electron transfer and turnover rate constants of hSOimmobilised on Ag electrodes coated with C8(NH2)/C6(OH)(1 : 3 M/M) at pH 7.4
Tris-acetateconcentration/mM
Redox parameters and apparent turnover rateconstantsa
ks/s�1
kcat,el/s�1
kcat,SERRS(1)/s�1
kcat,SERRS(2)/s�1
100 210 0.85 0.12 0.013150 220 1.6 0.24 0.03200 220 3.8 0.76 0.14750 440 5.3 n.d.b n.d.
a Data were determined by SERR spectroscopy except for kcat,el (CV).
The approximate error for E0, n, and the rate constants are �10 mV,
�0.05, and �10%, respectively. b n.d., not determined.
This journal is �c the Owner Societies 2010 Phys. Chem. Chem. Phys., 2010, 12, 7894–7903 | 7899
Dow
nloa
ded
by T
EC
HN
UN
IVE
RSI
TA
T B
ER
LIN
on
30 J
uly
2010
Publ
ishe
d on
26
May
201
0 on
http
://pu
bs.r
sc.o
rg |
doi:1
0.10
39/B
9272
26G
View Online
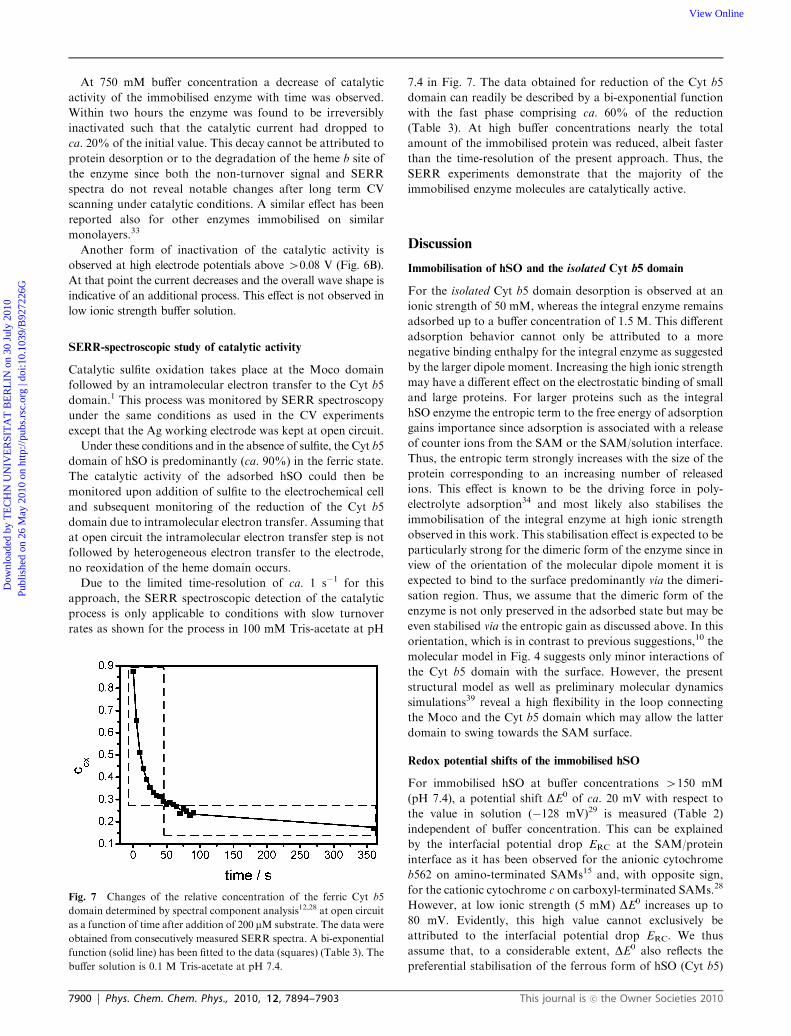
At 750 mM buffer concentration a decrease of catalytic
activity of the immobilised enzyme with time was observed.
Within two hours the enzyme was found to be irreversibly
inactivated such that the catalytic current had dropped to
ca. 20% of the initial value. This decay cannot be attributed to
protein desorption or to the degradation of the heme b site of
the enzyme since both the non-turnover signal and SERR
spectra do not reveal notable changes after long term CV
scanning under catalytic conditions. A similar effect has been
reported also for other enzymes immobilised on similar
monolayers.33
Another form of inactivation of the catalytic activity is
observed at high electrode potentials above 40.08 V (Fig. 6B).
At that point the current decreases and the overall wave shape is
indicative of an additional process. This effect is not observed in
low ionic strength buffer solution.
SERR-spectroscopic study of catalytic activity
Catalytic sulfite oxidation takes place at the Moco domain
followed by an intramolecular electron transfer to the Cyt b5
domain.1 This process was monitored by SERR spectroscopy
under the same conditions as used in the CV experiments
except that the Ag working electrode was kept at open circuit.
Under these conditions and in the absence of sulfite, the Cyt b5
domain of hSO is predominantly (ca. 90%) in the ferric state.
The catalytic activity of the adsorbed hSO could then be
monitored upon addition of sulfite to the electrochemical cell
and subsequent monitoring of the reduction of the Cyt b5
domain due to intramolecular electron transfer. Assuming that
at open circuit the intramolecular electron transfer step is not
followed by heterogeneous electron transfer to the electrode,
no reoxidation of the heme domain occurs.
Due to the limited time-resolution of ca. 1 s�1 for this
approach, the SERR spectroscopic detection of the catalytic
process is only applicable to conditions with slow turnover
rates as shown for the process in 100 mM Tris-acetate at pH
7.4 in Fig. 7. The data obtained for reduction of the Cyt b5
domain can readily be described by a bi-exponential function
with the fast phase comprising ca. 60% of the reduction
(Table 3). At high buffer concentrations nearly the total
amount of the immobilised protein was reduced, albeit faster
than the time-resolution of the present approach. Thus, the
SERR experiments demonstrate that the majority of the
immobilised enzyme molecules are catalytically active.
Discussion
Immobilisation of hSO and the isolated Cyt b5 domain
For the isolated Cyt b5 domain desorption is observed at an
ionic strength of 50 mM, whereas the integral enzyme remains
adsorbed up to a buffer concentration of 1.5 M. This different
adsorption behavior cannot only be attributed to a more
negative binding enthalpy for the integral enzyme as suggested
by the larger dipole moment. Increasing the high ionic strength
may have a different effect on the electrostatic binding of small
and large proteins. For larger proteins such as the integral
hSO enzyme the entropic term to the free energy of adsorption
gains importance since adsorption is associated with a release
of counter ions from the SAM or the SAM/solution interface.
Thus, the entropic term strongly increases with the size of the
protein corresponding to an increasing number of released
ions. This effect is known to be the driving force in poly-
electrolyte adsorption34 and most likely also stabilises the
immobilisation of the integral enzyme at high ionic strength
observed in this work. This stabilisation effect is expected to be
particularly strong for the dimeric form of the enzyme since in
view of the orientation of the molecular dipole moment it is
expected to bind to the surface predominantly via the dimeri-
sation region. Thus, we assume that the dimeric form of the
enzyme is not only preserved in the adsorbed state but may be
even stabilised via the entropic gain as discussed above. In this
orientation, which is in contrast to previous suggestions,10 the
molecular model in Fig. 4 suggests only minor interactions of
the Cyt b5 domain with the surface. However, the present
structural model as well as preliminary molecular dynamics
simulations39 reveal a high flexibility in the loop connecting
the Moco and the Cyt b5 domain which may allow the latter
domain to swing towards the SAM surface.
Redox potential shifts of the immobilised hSO
For immobilised hSO at buffer concentrations 4150 mM
(pH 7.4), a potential shift DE0 of ca. 20 mV with respect to
the value in solution (�128 mV)29 is measured (Table 2)
independent of buffer concentration. This can be explained
by the interfacial potential drop ERC at the SAM/protein
interface as it has been observed for the anionic cytochrome
b562 on amino-terminated SAMs15 and, with opposite sign,
for the cationic cytochrome c on carboxyl-terminated SAMs.28
However, at low ionic strength (5 mM) DE0 increases up to
80 mV. Evidently, this high value cannot exclusively be
attributed to the interfacial potential drop ERC. We thus
assume that, to a considerable extent, DE0 also reflects the
preferential stabilisation of the ferrous form of hSO (Cyt b5)
Fig. 7 Changes of the relative concentration of the ferric Cyt b5
domain determined by spectral component analysis12,28 at open circuit
as a function of time after addition of 200 mM substrate. The data were
obtained from consecutively measured SERR spectra. A bi-exponential
function (solid line) has been fitted to the data (squares) (Table 3). The
buffer solution is 0.1 M Tris-acetate at pH 7.4.
7900 | Phys. Chem. Chem. Phys., 2010, 12, 7894–7903 This journal is �c the Owner Societies 2010
Dow
nloa
ded
by T
EC
HN
UN
IVE
RSI
TA
T B
ER
LIN
on
30 J
uly
2010
Publ
ishe
d on
26
May
201
0 on
http
://pu
bs.r
sc.o
rg |
doi:1
0.10
39/B
9272
26G
View Online
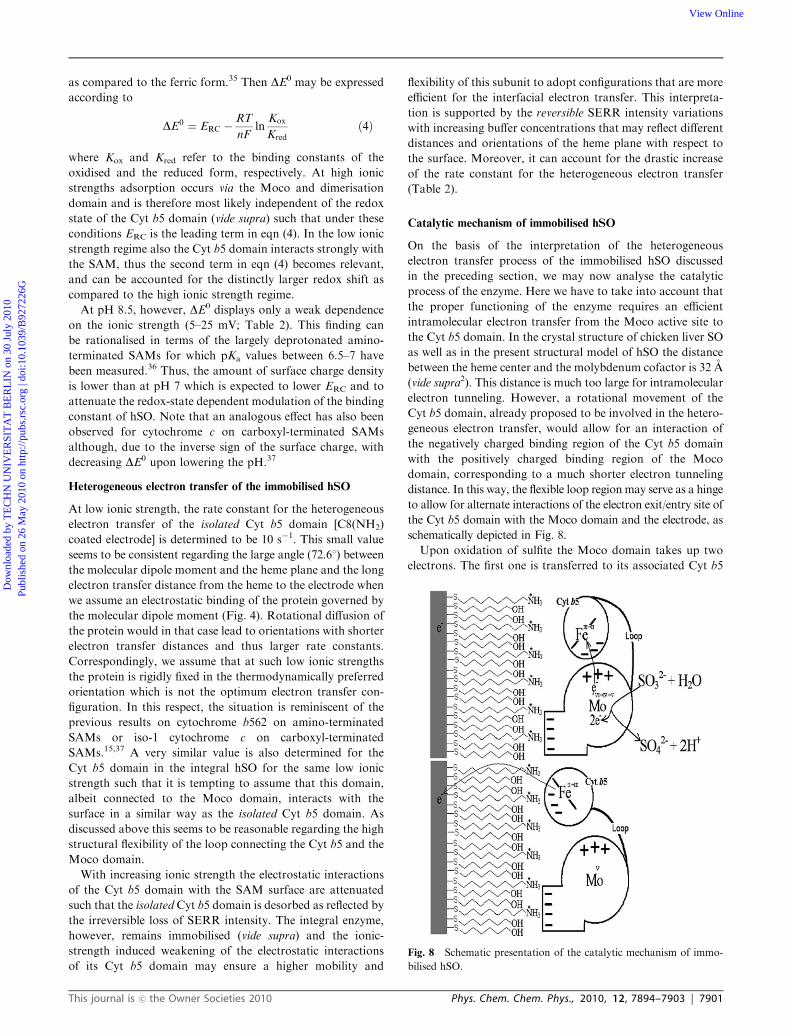
as compared to the ferric form.35 Then DE0 may be expressed
according to
DE0 ¼ ERC �RT
nFln
Kox
Kredð4Þ
where Kox and Kred refer to the binding constants of the
oxidised and the reduced form, respectively. At high ionic
strengths adsorption occurs via the Moco and dimerisation
domain and is therefore most likely independent of the redox
state of the Cyt b5 domain (vide supra) such that under these
conditions ERC is the leading term in eqn (4). In the low ionic
strength regime also the Cyt b5 domain interacts strongly with
the SAM, thus the second term in eqn (4) becomes relevant,
and can be accounted for the distinctly larger redox shift as
compared to the high ionic strength regime.
At pH 8.5, however, DE0 displays only a weak dependence
on the ionic strength (5–25 mV; Table 2). This finding can
be rationalised in terms of the largely deprotonated amino-
terminated SAMs for which pKa values between 6.5–7 have
been measured.36 Thus, the amount of surface charge density
is lower than at pH 7 which is expected to lower ERC and to
attenuate the redox-state dependent modulation of the binding
constant of hSO. Note that an analogous effect has also been
observed for cytochrome c on carboxyl-terminated SAMs
although, due to the inverse sign of the surface charge, with
decreasing DE0 upon lowering the pH.37
Heterogeneous electron transfer of the immobilised hSO
At low ionic strength, the rate constant for the heterogeneous
electron transfer of the isolated Cyt b5 domain [C8(NH2)
coated electrode] is determined to be 10 s�1. This small value
seems to be consistent regarding the large angle (72.61) between
the molecular dipole moment and the heme plane and the long
electron transfer distance from the heme to the electrode when
we assume an electrostatic binding of the protein governed by
the molecular dipole moment (Fig. 4). Rotational diffusion of
the protein would in that case lead to orientations with shorter
electron transfer distances and thus larger rate constants.
Correspondingly, we assume that at such low ionic strengths
the protein is rigidly fixed in the thermodynamically preferred
orientation which is not the optimum electron transfer con-
figuration. In this respect, the situation is reminiscent of the
previous results on cytochrome b562 on amino-terminated
SAMs or iso-1 cytochrome c on carboxyl-terminated
SAMs.15,37 A very similar value is also determined for the
Cyt b5 domain in the integral hSO for the same low ionic
strength such that it is tempting to assume that this domain,
albeit connected to the Moco domain, interacts with the
surface in a similar way as the isolated Cyt b5 domain. As
discussed above this seems to be reasonable regarding the high
structural flexibility of the loop connecting the Cyt b5 and the
Moco domain.
With increasing ionic strength the electrostatic interactions
of the Cyt b5 domain with the SAM surface are attenuated
such that the isolated Cyt b5 domain is desorbed as reflected by
the irreversible loss of SERR intensity. The integral enzyme,
however, remains immobilised (vide supra) and the ionic-
strength induced weakening of the electrostatic interactions
of its Cyt b5 domain may ensure a higher mobility and
flexibility of this subunit to adopt configurations that are more
efficient for the interfacial electron transfer. This interpreta-
tion is supported by the reversible SERR intensity variations
with increasing buffer concentrations that may reflect different
distances and orientations of the heme plane with respect to
the surface. Moreover, it can account for the drastic increase
of the rate constant for the heterogeneous electron transfer
(Table 2).
Catalytic mechanism of immobilised hSO
On the basis of the interpretation of the heterogeneous
electron transfer process of the immobilised hSO discussed
in the preceding section, we may now analyse the catalytic
process of the enzyme. Here we have to take into account that
the proper functioning of the enzyme requires an efficient
intramolecular electron transfer from the Moco active site to
the Cyt b5 domain. In the crystal structure of chicken liver SO
as well as in the present structural model of hSO the distance
between the heme center and the molybdenum cofactor is 32 A
(vide supra2). This distance is much too large for intramolecular
electron tunneling. However, a rotational movement of the
Cyt b5 domain, already proposed to be involved in the hetero-
geneous electron transfer, would allow for an interaction of
the negatively charged binding region of the Cyt b5 domain
with the positively charged binding region of the Moco
domain, corresponding to a much shorter electron tunneling
distance. In this way, the flexible loop region may serve as a hinge
to allow for alternate interactions of the electron exit/entry site of
the Cyt b5 domain with the Moco domain and the electrode, as
schematically depicted in Fig. 8.
Upon oxidation of sulfite the Moco domain takes up two
electrons. The first one is transferred to its associated Cyt b5
Fig. 8 Schematic presentation of the catalytic mechanism of immo-
bilised hSO.
This journal is �c the Owner Societies 2010 Phys. Chem. Chem. Phys., 2010, 12, 7894–7903 | 7901
Dow
nloa
ded
by T
EC
HN
UN
IVE
RSI
TA
T B
ER
LIN
on
30 J
uly
2010
Publ
ishe
d on
26
May
201
0 on
http
://pu
bs.r
sc.o
rg |
doi:1
0.10
39/B
9272
26G
View Online

domain via an intramolecular electron transfer step. Since
in the SERR experiments carried out at open circuit no
re-oxidation of the heme via the electrode takes place, the
second electron has to be transferred to another neighboring
heme (intermolecular electron transfer) in order to fully
reoxidise the Moco domain and enable it to react with the
next substrate molecule. A similar intermolecular electron
transfer mechanism has been reported by Brody and Hille9
for the enzymatic reaction of chicken liver SO in solution
corresponding to a dismutation reaction of two equivalents
of the two-electron reduced [Mo(V)/Fe(II)] to one three-
electron reduced [Mo(VI)/Fe(II)] and one one-electron reduced
[Mo(IV)/Fe(II)] species.
Thus, the SERR data (Fig. 7) originate from the Cyt b5 unit
of both the catalytically active and the inactive enzyme and, in
addition, reflect a complex mechanism of intra- and inter-
molecular electron transfer processes. Consequently, the rate
constants derived from a bi-exponential fit to the experimental
data cannot be directly compared with the results derived from
catalytic CV experiments in which the electrode serves as the
ultimate electron acceptor. However, assuming that in the
kinetic SERR experiments the slower phase mainly refers to
the intermolecular electron transfer between adjacent hSO
molecules, the faster phase, which then predominantly reflects
the intramolecular electron transfer, may be taken as a lower
limit for the turnover number. In fact, the rate constants of the
fast phase are lower by a factor of ca. 5 than the turnover rates
determined by CV measurements (Table 3).
The maximum value of 5.3 s�1 determined by CV for the
enzyme on the SAM-coated rough Ag electrodes falls in the
range of values reported for different electrochemical systems
ranging from 2 s�1 (pyrolytic graphite, SAM coated smooth
Au)10 to 20 s�1 (SAM coated smooth Au).6 In none of these
cases, however, turnover numbers comparable to that (100 s�1)
reported for the enzyme in solution9 have been observed. The
intrinsically lower enzymatic activity in the immobilised state
is likely to be related to restricted protein dynamics in the
adsorbed state, which may have an impact on substrate
binding and product release and particularly of the mobility
of the Cyt b5 domain. This is specifically true under conditions
of high interfacial electric fields which are known to affect
protein and cofactor structures and dynamics.18,27,38
The increase of the local electric field may also be the origin
for the reversible inactivation of the enzyme observed on Ag
electrodes at potentials E 4 +0.08 V. The magnitude of the
electric field increases with the amount of the difference
between the electrode potential and the potential of zero
charge. Taking into account that the potential of zero charge
is more negative for Ag than for Au,37 the local electric field at
electrode potentials 4+0.08 V is distinctly larger for Ag than
for Au for which in fact such an inactivation was not observed.
This potential-dependent inactivation may result from an
electric-field dependent increase of the binding interactions
of the Cyt b5 domain with the SAM surface which slows down
both the intramolecular and heterogeneous electron transfer.
Correspondingly, one may also understand the weak catalytic
activity and slow electron transfer at low ionic strength as an
increased contact time of the electron entry/exit site of Cyt b5
at the SAM surface.
Conclusions
Advanced SERR-spectroscopy was applied to study the hetero-
geneous electron transfer of human sulfite oxidase. It has been
shown that this technique is also applicable for monitoring the
catalytic activity, if the turnover rate is low (o1 s�1). The
efficiency of both the heterogeneous electron transfer and the
catalytic activity strongly increases with the ionic strength of
the buffer solution. This behaviour can be attributed to the
increase in protein flexibility, particularly of the Cyt b5
domain with respect to the remainder of the enzyme. This
interpretation is supported by the present structural model
derived for hSO on the basis of the crystal structure of the
chicken liver enzyme. Dipole moment calculations suggest that
the hSO dimer is immobilised via its dimerisation domain to
the SAM surface. For the electron transfer from the Moco
center to the electrode, the Cyt b5 domain has to swing from
the interaction site of the Moco domain to the SAM surface.
This electron shuttling mechanism is promoted at high ionic
strength which lowers the contact time of Cyt b5 with the
interaction domain of the electron donor (Moco) and electron
acceptor (SAM-coated electrode). At a buffer concentration of
750 mM, a rate constant for the heterogeneous electron
transfer of ks = 440 s�1 was measured, which is to our
knowledge the fastest heterogeneous electron transfer rate
for sulfite oxidase reported in the literature. At low ionic
strength and high electric fields, the contact time of the Cyt b5
domain with the SAM surface is strongly increased, thereby
drastically slowing down the overall electron transfer process,
both under catalytical and non-catalytical conditions.
We could show that a combined spectroscopic and electro-
chemical approach, complemented by molecular modelling and
electrostatics calculations, may provide novel insight into the
mechanism of enzymatic processes. The information extracted
from these experiments can also be relevant for improving
enzyme-based devices in bioelectronics and biocatalysis.
Acknowledgements
Financial support was given by the Fonds der Chemischen
Industrie (M.S. and I.M.W.) , the DFG (Unicat) and the
Alexander-von-Humboldt Foundation (D.M.).
References
1 R. M. Garrett, J. L. Johnson, T. N. Graf, A. Feigenbaum andK. V. Rajagopalan, Proc. Natl. Acad. Sci. U. S. A., 1998, 95, 6394.
2 C. Kisker, H. Schindelin, A. Pacheco, W. A. Wehbi, R. M. Garrett,K. V. Rajagopalan, J. H. Enemark and D. C. Rees, Cell, 1997, 91,973.
3 M. J. Rudolph, J. L. Johnson, K. V. Rajagopalan and C. Kisker,Acta Crystallogr., Sect. D: Biol. Crystallogr., 2003, 59, 1183.
4 R. Spricigo, R. Dronov, F. Lisdat, S. Leimkuhler, F. W. Schellerand U. Wollenberger, Anal. Bioanal. Chem., 2009, 393, 225.
5 R. Spricigo, R. Dronov, K. V. Rajagopalan, F. Lisdat,S. Leimkuhler, F. W. Scheller and U. Wollenberger, Soft Matter,2008, 4, 972.
6 E. E. Ferapontova, T. Ruzgas and L. Gorton, Anal. Chem., 2003,75, 4841.
7 A. Pacheco, J. T. Hazzard, G. Tollin and J. H. Enemark, JBIC, J.Biol. Inorg. Chem., 1999, 4, 390.
8 C. Feng, R. V. Kedia, J. T. Hazzard, J. K. Hurley, G. Tollin andJ. H. Enemark, Biochemistry, 2002, 41, 5816.
7902 | Phys. Chem. Chem. Phys., 2010, 12, 7894–7903 This journal is �c the Owner Societies 2010
Dow
nloa
ded
by T
EC
HN
UN
IVE
RSI
TA
T B
ER
LIN
on
30 J
uly
2010
Publ
ishe
d on
26
May
201
0 on
http
://pu
bs.r
sc.o
rg |
doi:1
0.10
39/B
9272
26G
View Online
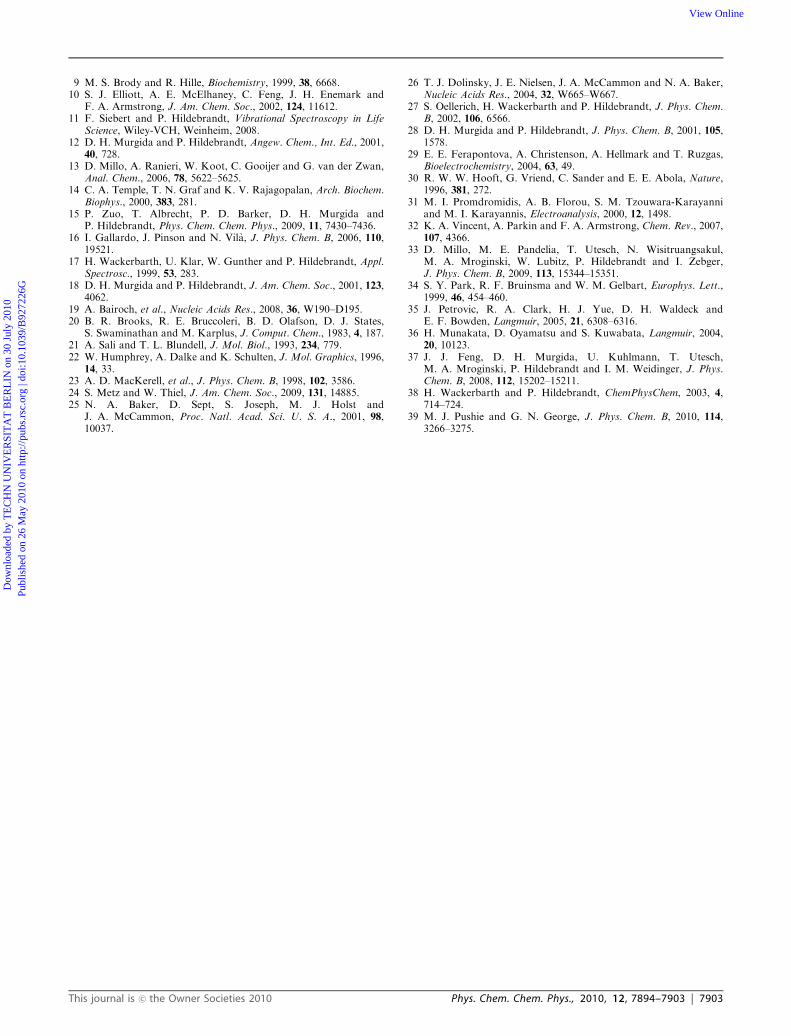
9 M. S. Brody and R. Hille, Biochemistry, 1999, 38, 6668.10 S. J. Elliott, A. E. McElhaney, C. Feng, J. H. Enemark and
F. A. Armstrong, J. Am. Chem. Soc., 2002, 124, 11612.11 F. Siebert and P. Hildebrandt, Vibrational Spectroscopy in Life
Science, Wiley-VCH, Weinheim, 2008.12 D. H. Murgida and P. Hildebrandt, Angew. Chem., Int. Ed., 2001,
40, 728.13 D. Millo, A. Ranieri, W. Koot, C. Gooijer and G. van der Zwan,
Anal. Chem., 2006, 78, 5622–5625.14 C. A. Temple, T. N. Graf and K. V. Rajagopalan, Arch. Biochem.
Biophys., 2000, 383, 281.15 P. Zuo, T. Albrecht, P. D. Barker, D. H. Murgida and
P. Hildebrandt, Phys. Chem. Chem. Phys., 2009, 11, 7430–7436.16 I. Gallardo, J. Pinson and N. Vila, J. Phys. Chem. B, 2006, 110,
19521.17 H. Wackerbarth, U. Klar, W. Gunther and P. Hildebrandt, Appl.
Spectrosc., 1999, 53, 283.18 D. H. Murgida and P. Hildebrandt, J. Am. Chem. Soc., 2001, 123,
4062.19 A. Bairoch, et al., Nucleic Acids Res., 2008, 36, W190–D195.20 B. R. Brooks, R. E. Bruccoleri, B. D. Olafson, D. J. States,
S. Swaminathan and M. Karplus, J. Comput. Chem., 1983, 4, 187.21 A. Sali and T. L. Blundell, J. Mol. Biol., 1993, 234, 779.22 W. Humphrey, A. Dalke and K. Schulten, J. Mol. Graphics, 1996,
14, 33.23 A. D. MacKerell, et al., J. Phys. Chem. B, 1998, 102, 3586.24 S. Metz and W. Thiel, J. Am. Chem. Soc., 2009, 131, 14885.25 N. A. Baker, D. Sept, S. Joseph, M. J. Holst and
J. A. McCammon, Proc. Natl. Acad. Sci. U. S. A., 2001, 98,10037.
26 T. J. Dolinsky, J. E. Nielsen, J. A. McCammon and N. A. Baker,Nucleic Acids Res., 2004, 32, W665–W667.
27 S. Oellerich, H. Wackerbarth and P. Hildebrandt, J. Phys. Chem.B, 2002, 106, 6566.
28 D. H. Murgida and P. Hildebrandt, J. Phys. Chem. B, 2001, 105,1578.
29 E. E. Ferapontova, A. Christenson, A. Hellmark and T. Ruzgas,Bioelectrochemistry, 2004, 63, 49.
30 R. W. W. Hooft, G. Vriend, C. Sander and E. E. Abola, Nature,1996, 381, 272.
31 M. I. Promdromidis, A. B. Florou, S. M. Tzouwara-Karayanniand M. I. Karayannis, Electroanalysis, 2000, 12, 1498.
32 K. A. Vincent, A. Parkin and F. A. Armstrong, Chem. Rev., 2007,107, 4366.
33 D. Millo, M. E. Pandelia, T. Utesch, N. Wisitruangsakul,M. A. Mroginski, W. Lubitz, P. Hildebrandt and I. Zebger,J. Phys. Chem. B, 2009, 113, 15344–15351.
34 S. Y. Park, R. F. Bruinsma and W. M. Gelbart, Europhys. Lett.,1999, 46, 454–460.
35 J. Petrovic, R. A. Clark, H. J. Yue, D. H. Waldeck andE. F. Bowden, Langmuir, 2005, 21, 6308–6316.
36 H. Munakata, D. Oyamatsu and S. Kuwabata, Langmuir, 2004,20, 10123.
37 J. J. Feng, D. H. Murgida, U. Kuhlmann, T. Utesch,M. A. Mroginski, P. Hildebrandt and I. M. Weidinger, J. Phys.Chem. B, 2008, 112, 15202–15211.
38 H. Wackerbarth and P. Hildebrandt, ChemPhysChem, 2003, 4,714–724.
39 M. J. Pushie and G. N. George, J. Phys. Chem. B, 2010, 114,3266–3275.
This journal is �c the Owner Societies 2010 Phys. Chem. Chem. Phys., 2010, 12, 7894–7903 | 7903
Dow
nloa
ded
by T
EC
HN
UN
IVE
RSI
TA
T B
ER
LIN
on
30 J
uly
2010
Publ
ishe
d on
26
May
201
0 on
http
://pu
bs.r
sc.o
rg |
doi:1
0.10
39/B
9272
26G
View Online

SUPPLEMENTARY INFORMATION
Redox properties and catalytic activity of surface-bound human
sulfite oxidase studied by a combined surface enhanced resonance
Raman spectroscopic and electrochemical approach.
Murat Sezera, Roberto Spricogo,b, Tillmann Utescha, Diego Milloa, Silke Leimkuehler,b, Maria A.
Mroginskia, Ulla Wollenberger,b, Peter Hildebrandta, and Inez M. Weidinger*a
a Technische Universität Berlin, Institut für Chemie, Sekr. PC 14, Straße des 17. Juni 135, D-10623 Berlin, Germany. b Institut für Biochemie und Biologie, Universität Potsdam, Karl-Liebknecht Straße 24-25, H. 25, Golm, D-14476, Germany.
E-mail: [email protected]
400 450 500 550 600
no SO2-3
1mM SO2-3
dithionite
λ / nm
abso
rban
ce /
a.u.
Isolated Cyt b5 Domain in 150mM Tris*acetate pH 7.4
no SO2-3
1mM SO2-3
dithionite
1mM SO2-3 in 5mM
Tris*acetate pH 8.5
Human Sulfite Oxidase in 150mM Tris*acetate pH 7.4
Figure S1: UV-Vis Absorption spectra of Human Sulfite Oxidase (up) and isolated cytochrome b5 domain in the absence and presence of sulfite.
Supplementary Material for PCCPThis journal is © The Owner Societies 2010

1200 1300 1400 1500 16000
1000
2000
3000
4000
5000
5 mM buffer 50 mM buffer
-0.3 -0.2 -0.1 0.0 0.1
-1.0x10⁻⁵
-5.0x10⁻⁶
0.0
5.0x10⁻⁶
1.0x10⁻⁵
I / A
E / V
Inte
nsity
/ a.
u.
ν / cm-1
isolated Cyt b5 - domain
Figure S2: Desorption of the isolated Cyt b5 domain in 50 mM Tris-acetate buffer at pH 7.4 indicated by an irreversible decrease of the
SERR- and CV-signal (inset).
Figure S3: Superposition of crystal structure of chicken liver SO and homology model of hSO.
Supplementary Material for PCCPThis journal is © The Owner Societies 2010

-0.30 -0.25 -0.20 -0.15 -0.10 -0.05 0.00 0.05
-1.0x10⁻⁵
-5.0x10⁻⁶
0.0
5.0x10⁻⁶
1.0x10⁻⁵
1.5x10⁻⁵
2.0x10⁻⁵
Ia
IlimI /
A
E / V
Figure S4: CV of hSO immobilized on an Ag electrode with 1:3 (M/M) C8(NH2)/C6(OH) – SAM in 750 mM Tris-acetate at pH 7.4. Dashed line, non-turnover signal at a scan rate of 100 mV/s; solid line, in the presence of 200 μM substrate at a scan rate of 2 mV/s.
Figure S5: Cyclic voltammograms of human Sulfite Oxidase immobilized on 1:3 C8(NH2) / C6(OH) – SAM, rotation of the electrode at 480 rpm and different buffer conditions and substrate concentrations, respectively.
-0.3 -0.2 -0.1 0.0 0.1
-5.0x10⁻⁶
0.0
5.0x10⁻⁶
1.0x10⁻⁵
1.5x10⁻⁵
2.0x10⁻⁵
2.5x10⁻⁵
I / A
E / V
100 200 1000
750mM, pH 7.4
[SO2-3 ] / μM
-0.3 -0.2 -0.1 0.0 0.1
-4.0x10⁻⁶
0.0
4.0x10⁻⁶
8.0x10⁻⁶
1.2x10⁻⁵
1.6x10⁻⁵
2.0x10⁻⁵
[SO2-3 ] / μMI /
A
E / V
200 400 1000
500mM, pH8.5
Supplementary Material for PCCPThis journal is © The Owner Societies 2010

84

Membrane Bound Hydrogenase from Ralstonia Eutropha H16 (7)
85
7 Membrane Bound Hydrogenase from Ralstonia eutropha H16
Hydrogenases enable hydrogen based energy conversion under physiological conditions and
are essential in the energy metabolism of a wide variety of microorganisms [90-94]. Three
phylogenetically distinct classes of hydrogenases that differ in their active site composition have
been identified so far [101]: di-iron [FeFe] [98], nickel-iron [NiFe] [92, 94] and (iron-sulphur free)
mono-iron [Fe] hydrogenases [93, 94]. [NiFe] and [FeFe] hydrogenases catalyse the reversible
splitting of hydrogen into electrons and protons according to:
{7} −++↔ eHH 222
While most [NiFe] hydrogenases are more efficient in hydrogen splitting [92, 94], [FeFe]
hydrogenases are usually more efficient in the opposite direction [98]. In contrast, [Fe]
hydrogenases catalyse a hydride transfer reaction during the methanogenesis process in
methanogens [93, 94].
In view of decreasing fossil energy resources, hydrogen-based technologies in energy storage
and conversion are becoming more and more important [20, 95]. Therefore, tremendous research
efforts have been made to explore the potential of hydrogenases for biotechnological applications
[6, 20, 95, 96]. In this respect the oxygen sensitivity of most hydrogenases represents a serious
constraint [66]. While the active site of [FeFe] hydrogenases is usually irreversibly destructed [66,
97, 98], most [NiFe] hydrogenases are inactivated by oxygen in a reversible manner [66, 97, 99,
115]. Some [NiFe] hydrogenases, however, retain activity in the presence of oxygen, such as the
membrane bound [NiFe] hydrogenase I from the hyper-thermophilic bacterium Aquifex aeolicus
[141, 142]. Except for its extraordinary thermostability it exhibits similar catalytic and electronic
features as the membrane bound [NiFe] hydrogenase of the chemolithoautotrophic
Knallgasbacterium Ralstonia eutropha H16 (MBH) [142]. Also the MBH has shown to retain
considerable catalytic activity even in the presence of atmospheric oxygen concentrations [6, 18,
19, 21, 24, 97]. These hydrogenases are therefore referred to as oxygen tolerant and are of
particular interest for biotechnological applications. Catalytic activity in the presence of oxygen was
also shown to occur for a [Fe] hydrogenase [94, 100]. Research that is related to the elucidation of
the mechanism of oxygen tolerance [103, 105] and possible biotechnological applications [6, 20,
95, 96], however, was so far mainly focussed on oxygen tolerant [NiFe] hyrogenases.
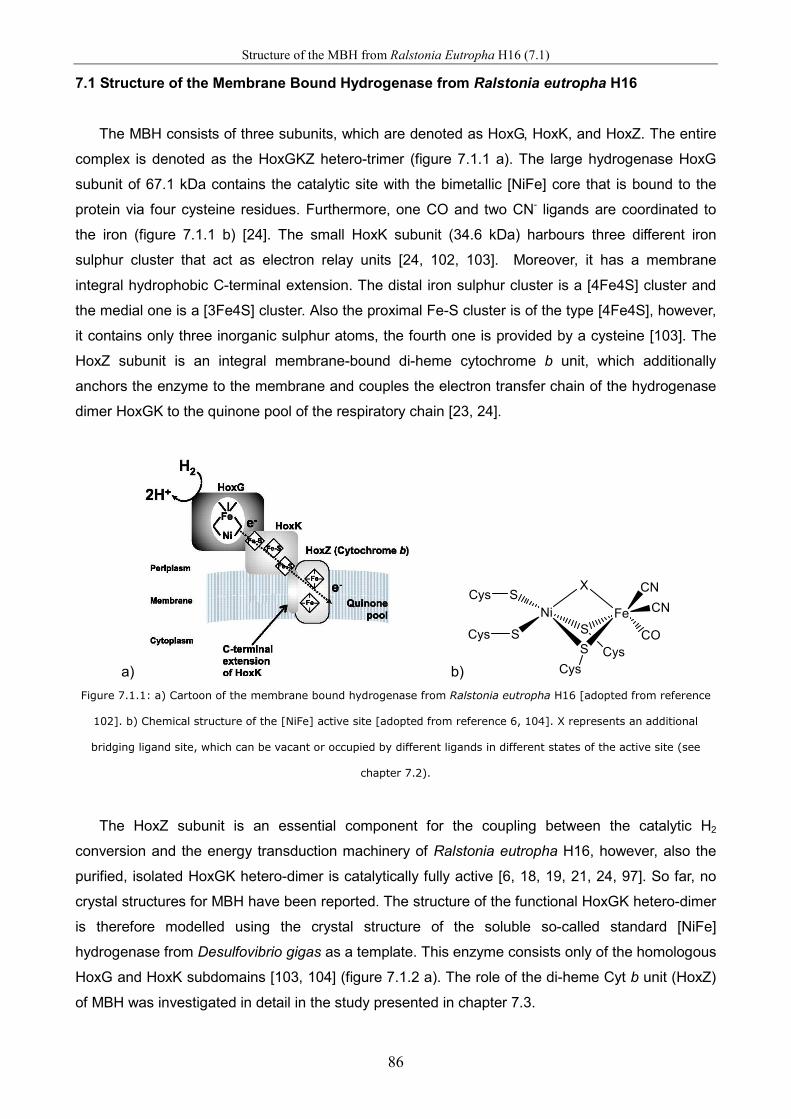
Structure of the MBH from Ralstonia Eutropha H16 (7.1)
86
7.1 Structure of the Membrane Bound Hydrogenase from Ralstonia eutropha H16
The MBH consists of three subunits, which are denoted as HoxG, HoxK, and HoxZ. The entire
complex is denoted as the HoxGKZ hetero-trimer (figure 7.1.1 a). The large hydrogenase HoxG
subunit of 67.1 kDa contains the catalytic site with the bimetallic [NiFe] core that is bound to the
protein via four cysteine residues. Furthermore, one CO and two CN- ligands are coordinated to
the iron (figure 7.1.1 b) [24]. The small HoxK subunit (34.6 kDa) harbours three different iron
sulphur cluster that act as electron relay units [24, 102, 103]. Moreover, it has a membrane
integral hydrophobic C-terminal extension. The distal iron sulphur cluster is a [4Fe4S] cluster and
the medial one is a [3Fe4S] cluster. Also the proximal Fe-S cluster is of the type [4Fe4S], however,
it contains only three inorganic sulphur atoms, the fourth one is provided by a cysteine [103]. The
HoxZ subunit is an integral membrane-bound di-heme cytochrome b unit, which additionally
anchors the enzyme to the membrane and couples the electron transfer chain of the hydrogenase
dimer HoxGK to the quinone pool of the respiratory chain [23, 24].
a) b)
Fe
CN
CN
COS
SNi
CysCys
XS
S
Cys
Cys
Figure 7.1.1: a) Cartoon of the membrane bound hydrogenase from Ralstonia eutropha H16 [adopted from reference
102]. b) Chemical structure of the [NiFe] active site [adopted from reference 6, 104]. X represents an additional
bridging ligand site, which can be vacant or occupied by different ligands in different states of the active site (see
chapter 7.2).
The HoxZ subunit is an essential component for the coupling between the catalytic H2
conversion and the energy transduction machinery of Ralstonia eutropha H16, however, also the
purified, isolated HoxGK hetero-dimer is catalytically fully active [6, 18, 19, 21, 24, 97]. So far, no
crystal structures for MBH have been reported. The structure of the functional HoxGK hetero-dimer
is therefore modelled using the crystal structure of the soluble so-called standard [NiFe]
hydrogenase from Desulfovibrio gigas as a template. This enzyme consists only of the homologous
HoxG and HoxK subdomains [103, 104] (figure 7.1.2 a). The role of the di-heme Cyt b unit (HoxZ)
of MBH was investigated in detail in the study presented in chapter 7.3.

Structure of the MBH from Ralstonia Eutropha H16 (7.1)
87
a) b)
Figure 7.1.2: a) Model structure of the HoxGK hetrodimer of the membrane bound hydrogenase from Ralstonia
eutropha H16. The structure was modelled using the crystal structure of the [NiFe] hydrogenase from Desulfovibrio
gigas as a template [104]. b) Cofactors in the HoxGK hetrodimer and their distances with respect to each other (in Å).
Since an efficient purification protocol for the hetero-trimer HoxGKZ was lacking, previous
studies on MBH were employed on the hetero-dimer HoxGK [6, 18, 19, 21, 25-27] or whole
membrane preparations [23, 28, 102], respectively. The overall basic structure of the HoxGK
hetero-dimer of oxygen tolerant MBH is similar to standard [NiFe] hydrogenases from Desulfovibrio
gigas and Desulfovibrio vulgaris Miyazaki F, respectively. However, there are distinct electronic and
structural differences. Redox potential values of the Fe-S clusters of the oxygen tolerant MBH and
membrane bound hydrogenase I from Aquifex aeolicus are reported to be about 100 mV higher as
compared to those of the soluble ‘standard’ oxygen sensitive [NiFe] hydrogenase from
Desulfovibrio gigas [24-26, 108, 142, 143].
cluster organism Desulfovibrio gigas [108] Ralstonia eutropha H16 [25-26]
Em [ ] 3/244
++
proximalSFe n.d. +0.160 V
Em [ ] 2/144
++
proximalSFe -0.290 V -0.060 V
Em [ ] 1/043
+±
medialSFe -0.070 V +0.025 V
Em [ ] 2/144
++
distalSFe -0.340 V -0.180 V
Table 7.1: Comparison of midpoint potential values of the Fe-S of the membrane bound hydrogenase from Ralstonia
eutropha H16 and the standard [NiFe] hydrogenase from Desulfovibrio gigas. Potentials refer to SHE (-0.210 V vs.
Ag/AgCl 3M KCl).
Different electronic properties of the proximal cluster are related to structural differences. Six
instead of four conserved cysteines are coordinating the proximal [4Fe4S] cluster in MBH [103].
Moreover, at high potentials the proximal Fe-S cluster in MBH most likely adopts the [4Fe4S]3+
oxidation state, which is not observed in standard hydrogenases [108]. Recent studies revealed
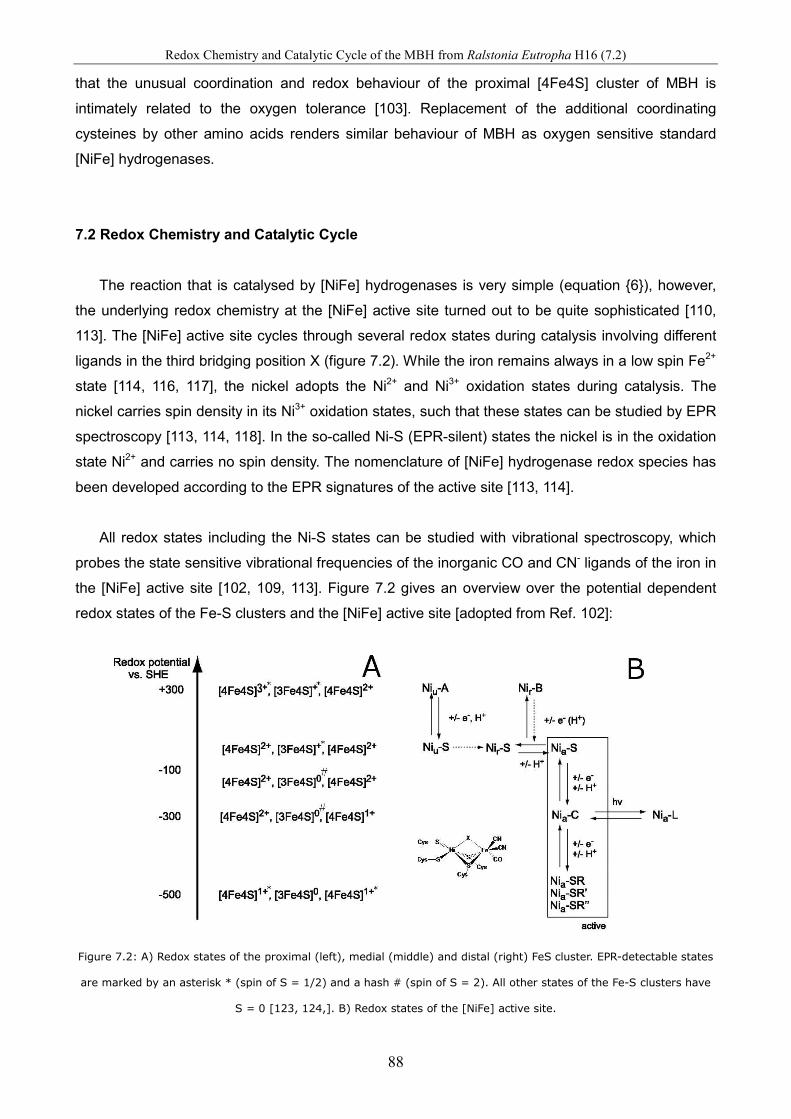
Redox Chemistry and Catalytic Cycle of the MBH from Ralstonia Eutropha H16 (7.2)
88
that the unusual coordination and redox behaviour of the proximal [4Fe4S] cluster of MBH is
intimately related to the oxygen tolerance [103]. Replacement of the additional coordinating
cysteines by other amino acids renders similar behaviour of MBH as oxygen sensitive standard
[NiFe] hydrogenases.
7.2 Redox Chemistry and Catalytic Cycle
The reaction that is catalysed by [NiFe] hydrogenases is very simple (equation {6}), however,
the underlying redox chemistry at the [NiFe] active site turned out to be quite sophisticated [110,
113]. The [NiFe] active site cycles through several redox states during catalysis involving different
ligands in the third bridging position X (figure 7.2). While the iron remains always in a low spin Fe2+
state [114, 116, 117], the nickel adopts the Ni2+ and Ni3+ oxidation states during catalysis. The
nickel carries spin density in its Ni3+ oxidation states, such that these states can be studied by EPR
spectroscopy [113, 114, 118]. In the so-called Ni-S (EPR-silent) states the nickel is in the oxidation
state Ni2+ and carries no spin density. The nomenclature of [NiFe] hydrogenase redox species has
been developed according to the EPR signatures of the active site [113, 114].
All redox states including the Ni-S states can be studied with vibrational spectroscopy, which
probes the state sensitive vibrational frequencies of the inorganic CO and CN- ligands of the iron in
the [NiFe] active site [102, 109, 113]. Figure 7.2 gives an overview over the potential dependent
redox states of the Fe-S clusters and the [NiFe] active site [adopted from Ref. 102]:
Figure 7.2: A) Redox states of the proximal (left), medial (middle) and distal (right) FeS cluster. EPR-detectable states
are marked by an asterisk * (spin of S = 1/2) and a hash # (spin of S = 2). All other states of the Fe-S clusters have
S = 0 [123, 124,]. B) Redox states of the [NiFe] active site.

Redox Chemistry and Catalytic Cycle of the MBH from Ralstonia Eutropha H16 (7.2)
89
A remarkable feature of oxygen tolerant [NiFe] hydrogenases is the absence of the Niu-A state
[28, 102, 109]. All other redox states that are reported for standard [NiFe] hydrogenases are
observed for oxygen tolerant MBH as well [28, 102]. In the Niu-A state the third bridging ligand
position X at the active site (figure 7.1.1 b and inset of figure 7.2) is occupied by either a
hydroperoxo- or hydroxide ligand [X = (O)OH-] [111] . As indicated by the index ‘u’ (= unready) the
enzyme is not active in this state and can only be activated with very slow activation kinetics under
strongly reducing conditions [66, 112, 119, 120]. The enzyme is also not active in the so-called Nir-
B state (X = OH-), however, this state is easily activated by hydrogen with fast kinetics [112, 115].
Accordingly, the index ‘r’ (= ready) indicates that the enzyme is ready for catalysis. The active
states of the enzyme, i.e. those states that are involved in the catalytic turnover, are denoted by the
index ‘a’. In the Nia-C state a hydride ion is bound to the active site in the third bridging ligand
position (X = H-) [114, 121, 122]. This state is easily converted into the unphysiological Nia-L state
upon light irradiation, in which the third bridging ligand position is vacant [114]. Different Nia-L
substates (denoted as Nia-L1, Nia-L2 ...) were detected by EPR spectroscopy and are believed to
differ slightly in the geometry of the thiol bridges at the [NiFe] site [114].
The structural features of the Ni-SR states (in some publications also denoted as Ni-R states,
with R denoting reduced [142]) are yet not known. However, they can be distinguished by IR-
spectroscopy and theoretical approaches are being employed to model their structure and their
role in the catalytic cycle.

90

91
7.3 Role of the HoxZ subunit in the electron transfer pathway of the
membrane-bound [NiFe]-hydrogenase from Ralstonia eutropha H16
immobilized on electrodes
Murat Sezera, Stefan Frielingsdorfb, Diego Milloa, Nina Heidarya, Tillmann Utescha, Maria-
Andrea Mroginskia, Bärbel Friedrichb, Peter Hildebrandta, Ingo Zebgera, Inez M. Weidingera*
a Technische Universität Berlin, Institut für Chemie, Sekr. PC14, Straße des 17. Juni 135, D-10623 Berlin, Germany.
*correspondence to E-mail: [email protected]; Fax: +49 3031421122; Tel: +49 3031422780
b Humboldt-Universität zu Berlin, Chausseestraße 117, 10115 Berlin.
Reproduced with permission from J. Phys. Chem. B, DOI: 10.1021/jp204665r, in press.
Copyright © 2011 American Chemical Society.

92

Role of the HoxZ Subunit in the ET Pathway of Immobilized MBH (7.3)
93
Abstract
The role of the diheme cytochrome b (HoxZ) subunit in the electron transfer pathway of the
membrane-bound [NiFe]-hydrogenase (MBH) hetero-trimer from Ralstonia eutropha H16 has
been investigated. The MBH in its native hetero-trimeric state was immobilized on electrodes
and subjected to spectroscopic and electrochemical analysis. Surface enhanced resonance
Raman spectroscopy was used to monitor the redox and coordination state of the HoxZ
heme cofactors while concomitant protein film voltammetric measurements gave insights into
the catalytic response of the enzyme on the electrode. The entire MBH hetero-trimer as well
as its isolated HoxZ subunit were immobilized on silver electrodes coated with self-
assembled monolayers of ω-functionalized alkylthiols, displaying the preservation of the
native heme pocket structure and an electrical communication between HoxZ and the
electrode. For the immobilized MBH hetero-trimer, catalytic reduction of the HoxZ heme
cofactors was observed upon H2 addition. The catalytic currents of MBH with and without the
HoxZ subunit were measured and compared with the heterogeneous electron transfer rates
of the isolated HoxZ. On the basis of the spectroscopic and electrochemical results, we
conclude that the HoxZ subunit under these artificial conditions is not primarily involved in the
electron transfer process but plays a crucial role in stabilizing the enzyme on the electrode.
KEYWORDS Surface enhanced Raman spectroscopy, [NiFe]-hydrogenases, oxygen
tolerance, cytochrome b, HoxZ, electron transfer, biocatalysis, protein film voltammetry
Introduction
[NiFe]-hydrogenases catalyze the reversible splitting of molecular hydrogen (H2) into
electrons and protons. In view of the growing importance of hydrogen-based technologies in
energy storage and conversion, substantial research efforts have been made to explore the
potential of these enzymes for biotechnological applications.1-4 In this respect, oxygen-
tolerant hydrogenases, such as the membrane-bound [NiFe]-hydrogenase (MBH) from
Ralstonia eutropha H16 (Re), are of particular interest since they retain considerable catalytic
activity even in the presence of atmospheric oxygen concentrations.1;5;6
MBH consists of three subunits, HoxG, HoxK, and HoxZ, and thus the entire purified
complex is denoted as HoxGKZ hetero-trimer (figure 1A). The large hydrogenase subunit
HoxG contains the catalytic site comprising the bimetallic [NiFe] core that is bound to the
protein via four cysteine residues. Furthermore, one CO and two CN- ligands are coordinated

Role of the HoxZ Subunit in the ET Pathway of Immobilized MBH (7.3)
94
to the Fe. The small subunit HoxK harbors three different iron sulphur clusters acting as an
electron relay unit.7;8 The membrane-integral heme b-containing subunit HoxZ anchors the
enzyme to the membrane and ensures electron transfer between the hydrogenase dimer
HoxGK and the quinone pool of the respiratory chain.9;10 Although HoxZ is evidently an
essential component of the coupling between the catalytic H2 conversion and the energy
transduction machinery, it has been found that the purified, isolated hydrogenase hetero-
dimer, consisting only of the subunits HoxG and HoxK, is catalytically fully active.11 In fact
most of the previous structural and catalytic studies on MBH were based on the hetero-dimer
HoxGK, 1;5-7;12-14 or on intact membrane preparations.7;15
In this study the entire hetero-trimeric HoxGKZ complex was isolated and used to analyze
the role of HoxZ for the overall catalytic- and electron transport processes in more detail.
These studies are of particular interest for potential applications of MBH immobilized on
electrodes since the optimization of the electronic communication between the catalytic
center and the conducting support material is one of the crucial challenges for exploiting
hydrogenases as a catalyst.
In order to elucidate the role of the HoxZ subunit in heterogeneous electron transfer
between the immobilized enzyme and the electrode during the catalytic process,
biocompatibly coated electrodes were employed that allow immobilization of enzyme
preparations under preservation of the native structure and function as shown in previous
studies of other redox enzymes.16-18 To probe electric communication between enzymes and
electrodes, electrochemical methods such as protein film voltammetry (PFV) are usually
employed. This technique, however, monitors only the current flow from the enzyme to the
electrode and vice versa whereas structural information on the redox cofactors cannot be
obtained. This disadvantage can be overcome by employing surface sensitive vibrational
spectroscopy such as surface enhanced infrared absorption (SEIRA) spectroscopy, that has
been successfully used to probe CN- and CO ligands of the catalytic center under turnover
and non-turnover conditions of immobilized hydrogenases.19-21 To monitor the two heme b
cofactors of HoxZ, which is in the focus of the present study, surface enhanced resonance
Raman (SERR) spectroscopy is the method of choice. This technique combines the surface
enhanced Raman effect, i.e. the amplification of the radiation field due to the coupling with
the surface plasmons of the metallic support, with the molecular resonance Raman (RR)
effect. For heme cofactors, optimum resonance conditions for both the plasmonic and the
molecular electronic transitions are achieved by using excitation lines in the violet spectral
region and nanostructured silver support materials. Under these conditions the SERR
spectra exclusively display the vibrational bands of the cofactors solely of the immobilized
Role of the HoxZ Subunit in the ET Pathway of Immobilized MBH (7.3)
95
heme proteins. Thus, it is possible to selectively monitor the redox and conformational states
of the cofactors of the immobilized HoxZ subunit during the catalytic cycle and to analyze the
dynamics of heterogeneous electron transfer between the heme cofactors and the electrode.
In combination with electrochemical and theoretical methods, the spectroscopic data provide
novel insight into the involvement of the HoxZ subunit in the catalytic processes of
immobilized MBH.
Materials and Methods
Chemicals
6-amino-1-hexanethiol hydrochloride [C6(NH2)] and 5-Carboxyl-1-pentanethiol [C5(COOH)]
were purchased from Dojindo; 6-mercaptohexanol [C6(OH)] was provided from Aldrich and
digitonin was purchased from Serva; n-dodecyl-ß-D-maltoside (ß-DDM) (crystallography
grade) and 7-mercaptoheptane was purchased from Applichem and Fluka, respectively. All
chemicals were of highest purity grade available.
Protein purification
In brief, the MBH hetero-trimer HoxGKZ was purified after solubilization with digitonin via a
C-terminal Strep-tag II at the HoxZ subunit. Isolation of the HoxZ subunit was performed in a
similar way but using ß-DDM as a detergent instead of digitonin. The detailed purification
protocol of the proteins used in this study will be published elsewhere.22
Protein immobilization
Electrochemically roughened Ag electrodes were immersed for 24 h in solutions of ω-
substituted mercaptanes to form a self assembled monolayer (SAM). For pure SAMs, 1 mM
of C6(NH2) or C5(COOH) was dissolved in a water/ethanol mixture (1:4 v/v) or pure ethanol.
For mixed SAMs, 1 mM C6(NH2) or C5(COOH) were mixed with 3 mM C6(OH) in a
water/ethanol solution (1:4 v/v) or in pure ethanol, respectively. Immobilization of the isolated
HoxZ subunit, the hetero-dimer HoxGK and the entire MBH hetero-trimer HoxGKZ was

Role of the HoxZ Subunit in the ET Pathway of Immobilized MBH (7.3)
96
achieved by immersion (3 - 5 hours) of the SAM-coated Ag electrodes into a 10 mM
potassium phosphate buffer (PB) solution containing ca. 0.4 µM of the respective protein, as
well as β-DDM in case of HoxZ and digitonin in case of HoxGKZ / HoxGK, respectively.
Spectroscopic and electrochemical measurements
A rotating cuvette was used for RR experiments. The protein concentration was ca.15 µM
in 50 mM PB buffer solution at pH 7.0 containing 150 mM NaCl and 0.01 % w/w β-DDM.
SERR and electrochemical measurements were performed using homemade spectro-
electrochemical cells with a volume of about 10 mL, a rotating Ag ring with a geometrical
area of 0.75 ± 0.05 cm2 as the working electrode, an Ag/AgCl (3 M KCl) reference electrode
(+0.21 V vs. SHE) and a platinum counter electrode. All potentials cited in this work refer to
the standard hydrogen electrode (SHE). The buffer solutions used for the SERR
spectroscopic and electrochemical experiments were adjusted to the same pH as the
respective incubation buffer but did not contain any detergent.
SERR and RR spectra were measured using a confocal Raman spectrometer (LabRam
HR 800, Jobin Yvon) coupled to a liquid nitrogen cooled CCD detector. The spectral
resolution was 1 cm-1 with an increment per data point of 0.75 cm-1. The 413 nm laser line of
a Coherent Innova 400 Krypton cw-laser was used for excitation. The laser power on the
sample was 2.0 mW for RR and 1.0 mW for SERR experiments. The laser beam was
focused onto the sample by a Nikon 20x objective with a working distance of 20.5 mm and a
numeric aperture of 0.35.
Accumulation times of the SERR spectra were between 1 and 10 s whereas for the RR
spectra the accumulation time was 30 s. Time-resolved (TR) SERR experiments were carried
out as described previously.23 After polynomial baseline subtraction, the measured spectra
were treated by homemade component analysis software.
UV/vis-spectroelectrochemical redox-titrations of the isolated HoxZ subunit in solution were
performed using a transmission cell which has been described elsewhere.24 UV-vis
absorption spectra were recorded using a Cary 50 spectrometer, while the cell potential was
controlled with a EG&G 263A potentiostat. The solution used for the spectroelectrochemical
measurements included 100 mM PB, 150 mM NaCl and 0.01 % w/w β-DDM, but no
additional redox mediators.
Role of the HoxZ Subunit in the ET Pathway of Immobilized MBH (7.3)
97
Cyclic voltammetric experiments were performed with a CH instrument 660 C (Austin,
USA).
Molecular modelling and theoretical calculations
Modeling was performed with the Swiss model server25 using the fdnI subunit of the
formate dehydrogenase-N (pdb accession code 1kqg) as a template structure.26 The
modeled residue range was from 26-243, the sequence identity between the model and the
template is 9.174 % and the Evalue was 1.0e-38. Dipole moment calculations were carried
out with VMD 1.8.727 with the partial charges of the CHARMM22 force field.28 For the
determination of the electrostatic potential we have utilized the APBS program29 and the
PDB2PQR tool.30
Results
Calculation of the HoxZ surface potential distribution
Due to the lack of structural information on the HoxZ subunit a homology model was
generated to calculate the electrostatic potential and the dipole moment of this protein (figure
1B). The fdnI subunit of the formate dehydrogenase-N from E. coli served as template. A
previous study reported on the basis of sequence analyses shows that these two proteins
are structurally related,31 such that the model is expected to represent a good approximation
for HoxZ. HoxZ contains two b-type hemes, each of them carrying two axial His ligands. The
distance between the heme irons in the model is 19.2 Å while the distance between the
edges of the porphyrin π-electron system is 7.5 Å, enabling direct electron tunneling between
the two heme groups.32 According to these structural model and surface potential
calculations, HoxZ possesses a cylindrical shape with a slightly negatively charged upper
and a positively charged bottom side. The latter accommodates the C- and N-terminal
regions and a mainly hydrophobic lateral area forming contacts with the bilayer core of the
membrane (figure 1C). The dipole moment was calculated to be ca. 1100 Debye in the fully
reduced state (Fe2+/Fe2+).

Role of the HoxZ Subunit in the ET Pathway of Immobilized MBH (7.3)
98
Figure 1: (A) Schematic representation of the whole MBH hetero-trimer HoxGKZ, (B) homology model and (C)
calculated surface potential distribution of the modelled HoxZ subunit. The arrows in B and C indicate the
direction of the calculated dipole moment.
SERR spectroscopic investigation of the HoxZ subunit
The RR spectra of the isolated HoxZ subunit show the vibrational signature characteristic
of six-coordinated low-spin (6cLS) hemes as expected for bis-His ligated coordination (figure
2A, E). The symmetric bandshapes point to essentially identical RR spectra of both heme
groups. Upon immobilization of HoxZ on SAM-coated Ag electrodes strong SERR-signals
were detected when using C6(NH2) or C5(COOH) SAMs at pH 7.0 and low ionic strength (10
mM PB). However, the SERR spectra differ from the RR spectrum, inter alia by a broadening
of the ν4 envelope and an additional peak in the ν3 band region at 1491 cm-1, which is
characteristic of five-coordinated high-spin (5cHS) heme (figure 2B). This conclusion is
confirmed by the component analysis of the spectra that allows quantifying the relative
contributions of the various species involved.33
The relative contribution of the 5cHS species is higher for C5(COOH)- than for C6(NH2)-
SAMs but decreases in both cases in favor of the 6cLS species upon increasing the ionic
strength and by an admixture of C6(OH) at a ratio of 3:1 [C6(OH)/C5(COOH) and
C6(OH)/C6(NH2)] (Table S1 Supporting information). Both effects are accompanied by a loss
of absolute intensity that reflects a partial HoxZ subunit desorption due to weakening of the
electrostatic interactions between the subunit and the SAM. In the case of the carboxyl-
terminated SAM, the 5cHS content was further diminished by decreasing the pH from 7.0 to
5.5. However, a similar decrease in pH in the case of C6(NH2)-SAMs led to a complete loss
in signal intensity.
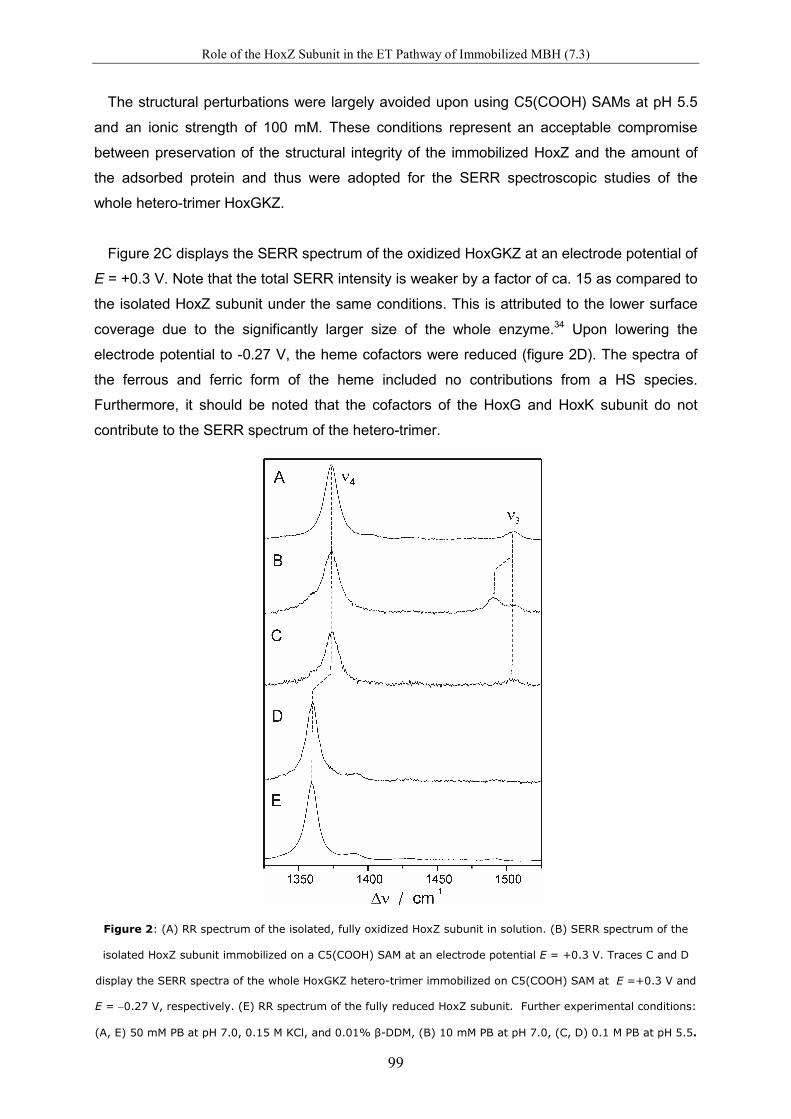
Role of the HoxZ Subunit in the ET Pathway of Immobilized MBH (7.3)
99
The structural perturbations were largely avoided upon using C5(COOH) SAMs at pH 5.5
and an ionic strength of 100 mM. These conditions represent an acceptable compromise
between preservation of the structural integrity of the immobilized HoxZ and the amount of
the adsorbed protein and thus were adopted for the SERR spectroscopic studies of the
whole hetero-trimer HoxGKZ.
Figure 2C displays the SERR spectrum of the oxidized HoxGKZ at an electrode potential of
E = +0.3 V. Note that the total SERR intensity is weaker by a factor of ca. 15 as compared to
the isolated HoxZ subunit under the same conditions. This is attributed to the lower surface
coverage due to the significantly larger size of the whole enzyme.34 Upon lowering the
electrode potential to -0.27 V, the heme cofactors were reduced (figure 2D). The spectra of
the ferrous and ferric form of the heme included no contributions from a HS species.
Furthermore, it should be noted that the cofactors of the HoxG and HoxK subunit do not
contribute to the SERR spectrum of the hetero-trimer.
Figure 2: (A) RR spectrum of the isolated, fully oxidized HoxZ subunit in solution. (B) SERR spectrum of the
isolated HoxZ subunit immobilized on a C5(COOH) SAM at an electrode potential E = +0.3 V. Traces C and D
display the SERR spectra of the whole HoxGKZ hetero-trimer immobilized on C5(COOH) SAM at E =+0.3 V and
E = −0.27 V, respectively. (E) RR spectrum of the fully reduced HoxZ subunit. Further experimental conditions:
(A, E) 50 mM PB at pH 7.0, 0.15 M KCl, and 0.01% β-DDM, (B) 10 mM PB at pH 7.0, (C, D) 0.1 M PB at pH 5.5.
Role of the HoxZ Subunit in the ET Pathway of Immobilized MBH (7.3)
100
Redox transitions
UV-vis spectroelectrochemical redox titrations of the isolated HoxZ subunit in solution were
performed by monitoring the intensity of the Soret band at 430 nm, corresponding to the
maximum absorbance of the ferrous heme b (figure 3A). Upon variation of the applied
potential, one sharp redox transition having a midpoint potential (Em,sol) at -0.086 V was
detected. The transition showed an almost ideal Nernstian behavior yielding an apparent
number of transferred electrons close to 1 (n = 0.8). The redox transition of the immobilized
HoxZ subunit, either isolated or as constituent of the MBH hetero-trimer, was probed by
potential-dependent SERR spectroscopy. The relative spectral contributions derived from the
component analysis of the spectra were converted into relative concentrations using the
proportionality factors determined from the RR spectra of the isolated HoxZ subunit in
solution. The corresponding factor for the 5cHS species was taken from a previous study of
cytochrome c.33
Figure 3B shows the molar fractions of the ferric and ferrous species of the HoxZ subunit in
the HoxGKZ trimer as a function of applied potential, determined under conditions that
suppressed the formation of the 5cHS species (100 mM PB, pH 5.5, C5(COOH) SAM). The
data show a clear redox transition with at midpoint potential at Em = -0.09 V similar to Em,sol of
the isolated HoxZ subunit in solution but within a significant broader potential window
expressed by a smaller apparent number of transferred electrons (n = 0.5, table 1). This low
value for n may reflect a broadened distribution for the midpoint potentials of the two hemes.
Alternatively, it is also consistent with the superposition of the redox transitions for the two
spectroscopically indistinguishable hemes exhibiting slightly different but discrete Em values.
The redox transition was completely reversible with the majority of the immobilized proteins
remaining electro-active at the surface, however a complete reduction was not possible due
to the lower limit of the accessible potential range for SAM-coated electrodes20 (i.e. ca. -0.3
V). The redox titration of the isolated HoxZ subunit displays essentially the same
potentiometric behavior (figure S1C). This suggests that the HoxZ subunit is in both cases
adsorbed similarly.

Role of the HoxZ Subunit in the ET Pathway of Immobilized MBH (7.3)
101
Figure 3: (A) Relative changes in the absorbance at 430 nm of the isolated HoxZ subunit in solution as a
function of electrode potential. The reference spectrum was taken at +0.3 V. (B) Potentiometric titration of the
HoxZ domain within the MBH hetero-trimer immobilized on C5(COOH)-coated electrodes at pH 5.5 (0.1 M PBS).
xred (solid squares), xox (open squares).
Under conditions where the 5cHS and 6cLS species coexist, redox titrations of the isolated
HoxZ subunit exhibit a similar redox behavior for both species throughout the entire potential
range that has been investigated (figure S1A, B). The midpoint potential of the HS species is
Em(HS) = -0.1 V and thus slightly more positive than Em(LS) = -0.14 V (See Table S1,
supporting information). One should note that the difference in Em between the 5cHS and
6cLS species is the same as observed for the B2 state of cytochrome c.33
In all redox titrations of the isolated HoxZ, a distinct midpoint potential Em is observed
below -0.08 V. Em is found to increase from -0.15 V (C5(COOH), pH 7.0, 10 mM PB) to more
positive values with increasing ionic strength and decreasing charge density on the SAM
surface (Table S1, supporting information) until, at mixed C5(COOH)/C6(OH) SAMs and pH
5.5 (100 mM PB), it approaches the value determined for the HoxZ subunit in solution (Em, sol
= - 0.086 V). No difference was noted for Em and n values comparing the isolated and MBH-
integrated HoxZ subunit (Table 1).
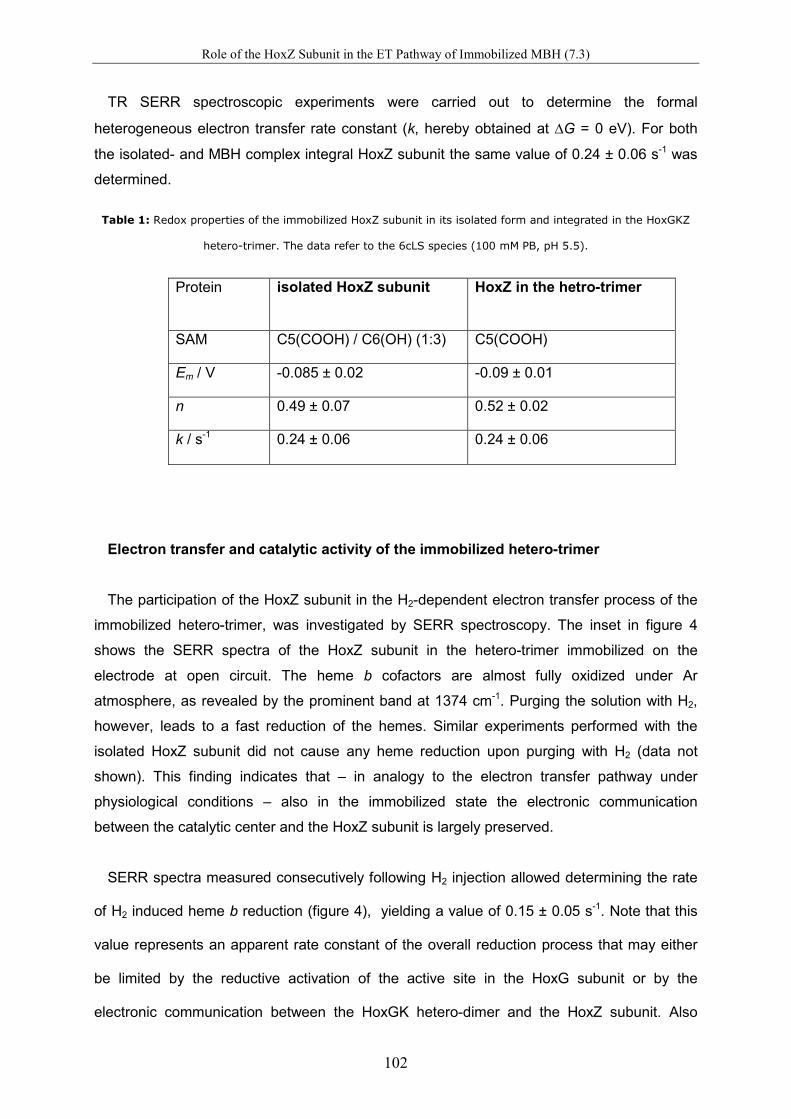
Role of the HoxZ Subunit in the ET Pathway of Immobilized MBH (7.3)
102
TR SERR spectroscopic experiments were carried out to determine the formal
heterogeneous electron transfer rate constant (k, hereby obtained at ∆G = 0 eV). For both
the isolated- and MBH complex integral HoxZ subunit the same value of 0.24 ± 0.06 s-1 was
determined.
Table 1: Redox properties of the immobilized HoxZ subunit in its isolated form and integrated in the HoxGKZ
hetero-trimer. The data refer to the 6cLS species (100 mM PB, pH 5.5).
Protein isolated HoxZ subunit HoxZ in the hetro-trimer
SAM C5(COOH) / C6(OH) (1:3) C5(COOH)
Em / V -0.085 ± 0.02 -0.09 ± 0.01
n 0.49 ± 0.07 0.52 ± 0.02
k / s-1 0.24 ± 0.06 0.24 ± 0.06
Electron transfer and catalytic activity of the immobilized hetero-trimer
The participation of the HoxZ subunit in the H2-dependent electron transfer process of the
immobilized hetero-trimer, was investigated by SERR spectroscopy. The inset in figure 4
shows the SERR spectra of the HoxZ subunit in the hetero-trimer immobilized on the
electrode at open circuit. The heme b cofactors are almost fully oxidized under Ar
atmosphere, as revealed by the prominent band at 1374 cm-1. Purging the solution with H2,
however, leads to a fast reduction of the hemes. Similar experiments performed with the
isolated HoxZ subunit did not cause any heme reduction upon purging with H2 (data not
shown). This finding indicates that – in analogy to the electron transfer pathway under
physiological conditions – also in the immobilized state the electronic communication
between the catalytic center and the HoxZ subunit is largely preserved.
SERR spectra measured consecutively following H2 injection allowed determining the rate
of H2 induced heme b reduction (figure 4), yielding a value of 0.15 ± 0.05 s-1. Note that this
value represents an apparent rate constant of the overall reduction process that may either
be limited by the reductive activation of the active site in the HoxG subunit or by the
electronic communication between the HoxGK hetero-dimer and the HoxZ subunit. Also
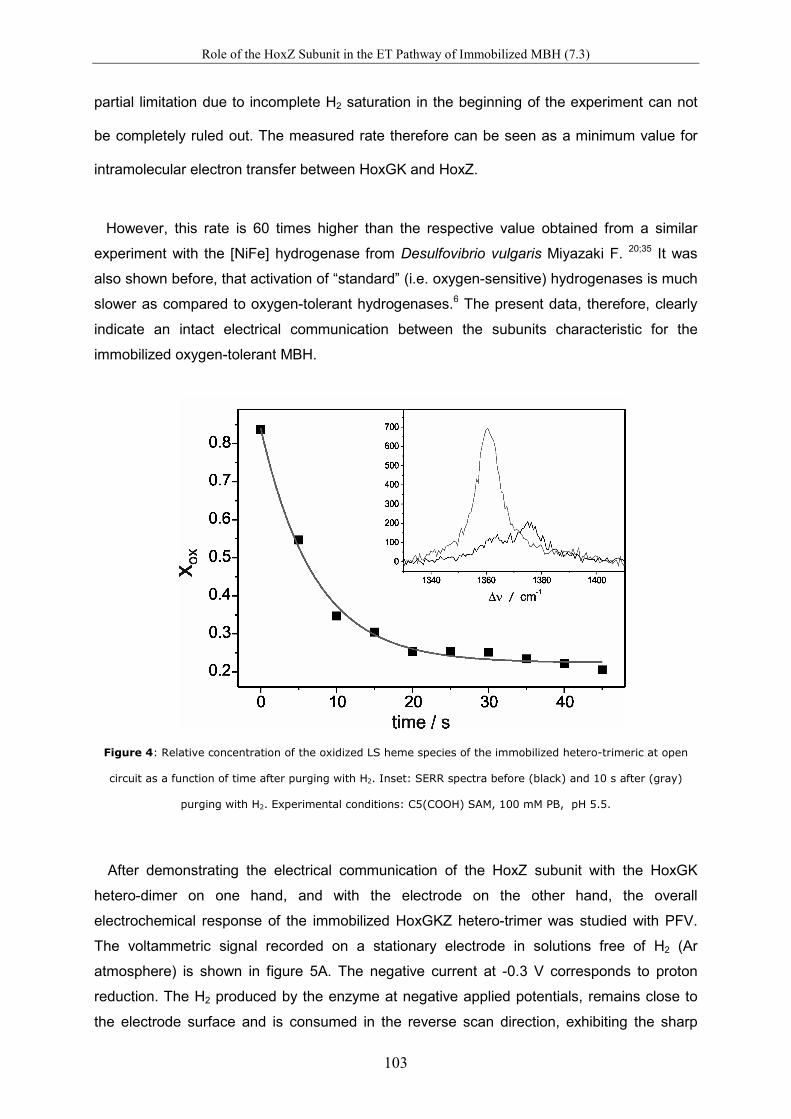
Role of the HoxZ Subunit in the ET Pathway of Immobilized MBH (7.3)
103
partial limitation due to incomplete H2 saturation in the beginning of the experiment can not
be completely ruled out. The measured rate therefore can be seen as a minimum value for
intramolecular electron transfer between HoxGK and HoxZ.
However, this rate is 60 times higher than the respective value obtained from a similar
experiment with the [NiFe] hydrogenase from Desulfovibrio vulgaris Miyazaki F. 20;35 It was
also shown before, that activation of “standard” (i.e. oxygen-sensitive) hydrogenases is much
slower as compared to oxygen-tolerant hydrogenases.6 The present data, therefore, clearly
indicate an intact electrical communication between the subunits characteristic for the
immobilized oxygen-tolerant MBH.
Figure 4: Relative concentration of the oxidized LS heme species of the immobilized hetero-trimeric at open
circuit as a function of time after purging with H2. Inset: SERR spectra before (black) and 10 s after (gray)
purging with H2. Experimental conditions: C5(COOH) SAM, 100 mM PB, pH 5.5.
After demonstrating the electrical communication of the HoxZ subunit with the HoxGK
hetero-dimer on one hand, and with the electrode on the other hand, the overall
electrochemical response of the immobilized HoxGKZ hetero-trimer was studied with PFV.
The voltammetric signal recorded on a stationary electrode in solutions free of H2 (Ar
atmosphere) is shown in figure 5A. The negative current at -0.3 V corresponds to proton
reduction. The H2 produced by the enzyme at negative applied potentials, remains close to
the electrode surface and is consumed in the reverse scan direction, exhibiting the sharp
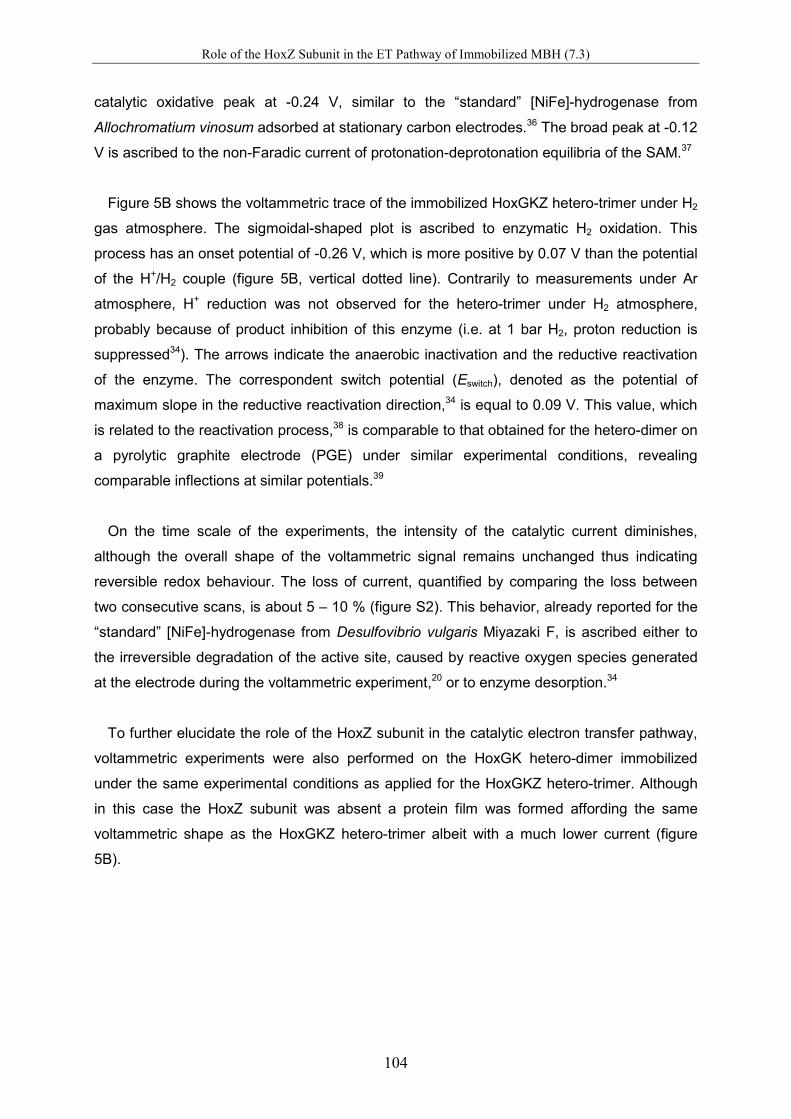
Role of the HoxZ Subunit in the ET Pathway of Immobilized MBH (7.3)
104
catalytic oxidative peak at -0.24 V, similar to the “standard” [NiFe]-hydrogenase from
Allochromatium vinosum adsorbed at stationary carbon electrodes.36 The broad peak at -0.12
V is ascribed to the non-Faradic current of protonation-deprotonation equilibria of the SAM.37
Figure 5B shows the voltammetric trace of the immobilized HoxGKZ hetero-trimer under H2
gas atmosphere. The sigmoidal-shaped plot is ascribed to enzymatic H2 oxidation. This
process has an onset potential of -0.26 V, which is more positive by 0.07 V than the potential
of the H+/H2 couple (figure 5B, vertical dotted line). Contrarily to measurements under Ar
atmosphere, H+ reduction was not observed for the hetero-trimer under H2 atmosphere,
probably because of product inhibition of this enzyme (i.e. at 1 bar H2, proton reduction is
suppressed34). The arrows indicate the anaerobic inactivation and the reductive reactivation
of the enzyme. The correspondent switch potential (Eswitch), denoted as the potential of
maximum slope in the reductive reactivation direction,34 is equal to 0.09 V. This value, which
is related to the reactivation process,38 is comparable to that obtained for the hetero-dimer on
a pyrolytic graphite electrode (PGE) under similar experimental conditions, revealing
comparable inflections at similar potentials.39
On the time scale of the experiments, the intensity of the catalytic current diminishes,
although the overall shape of the voltammetric signal remains unchanged thus indicating
reversible redox behaviour. The loss of current, quantified by comparing the loss between
two consecutive scans, is about 5 – 10 % (figure S2). This behavior, already reported for the
“standard” [NiFe]-hydrogenase from Desulfovibrio vulgaris Miyazaki F, is ascribed either to
the irreversible degradation of the active site, caused by reactive oxygen species generated
at the electrode during the voltammetric experiment,20 or to enzyme desorption.34
To further elucidate the role of the HoxZ subunit in the catalytic electron transfer pathway,
voltammetric experiments were also performed on the HoxGK hetero-dimer immobilized
under the same experimental conditions as applied for the HoxGKZ hetero-trimer. Although
in this case the HoxZ subunit was absent a protein film was formed affording the same
voltammetric shape as the HoxGKZ hetero-trimer albeit with a much lower current (figure
5B).

Role of the HoxZ Subunit in the ET Pathway of Immobilized MBH (7.3)
105
Figure 5. (A): Proton reduction and H2 re-oxidation by the hetero-trimer adsorbed on a stationary electrode
under Ar gas atmosphere. The scan direction is indicated by an arrowhead (B): Anaerobic inactivation and
reductive reactivation (marked by arrows) of the hetero-trimer (solid line) and hetero-dimer (dashed line)
immobilized on a C5(COOH) SAM under H2 gas atmosphere. The scan direction is indicated by an arrowhead;
Eswitch is marked by a vertical bar. The dotted vertical line indicates the potential of the H+/H2 couple under the
experimental conditions (1 bar H2, pH 5.5). The electrode was rotated at > 400 rpm. Voltammograms were
recorded at room temperature in solutions of 100 mM PB at a scan rate of v = 5 mV s-1.
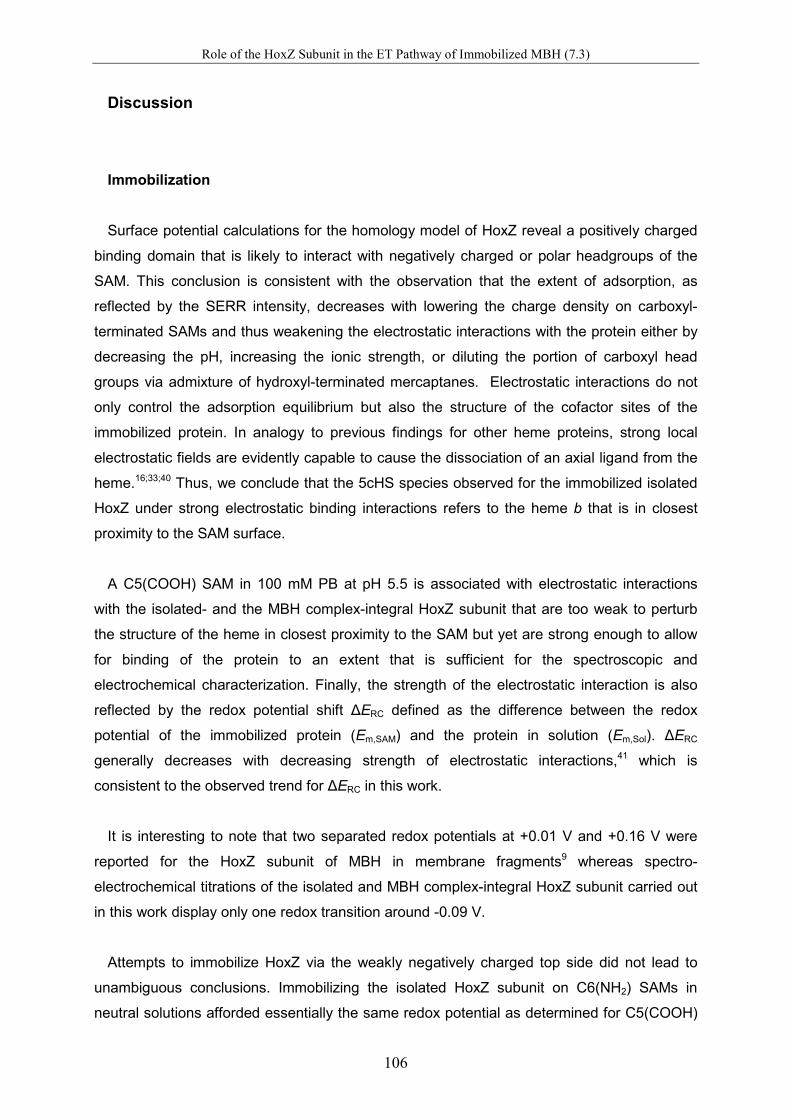
Role of the HoxZ Subunit in the ET Pathway of Immobilized MBH (7.3)
106
Discussion
Immobilization
Surface potential calculations for the homology model of HoxZ reveal a positively charged
binding domain that is likely to interact with negatively charged or polar headgroups of the
SAM. This conclusion is consistent with the observation that the extent of adsorption, as
reflected by the SERR intensity, decreases with lowering the charge density on carboxyl-
terminated SAMs and thus weakening the electrostatic interactions with the protein either by
decreasing the pH, increasing the ionic strength, or diluting the portion of carboxyl head
groups via admixture of hydroxyl-terminated mercaptanes. Electrostatic interactions do not
only control the adsorption equilibrium but also the structure of the cofactor sites of the
immobilized protein. In analogy to previous findings for other heme proteins, strong local
electrostatic fields are evidently capable to cause the dissociation of an axial ligand from the
heme.16;33;40 Thus, we conclude that the 5cHS species observed for the immobilized isolated
HoxZ under strong electrostatic binding interactions refers to the heme b that is in closest
proximity to the SAM surface.
A C5(COOH) SAM in 100 mM PB at pH 5.5 is associated with electrostatic interactions
with the isolated- and the MBH complex-integral HoxZ subunit that are too weak to perturb
the structure of the heme in closest proximity to the SAM but yet are strong enough to allow
for binding of the protein to an extent that is sufficient for the spectroscopic and
electrochemical characterization. Finally, the strength of the electrostatic interaction is also
reflected by the redox potential shift ∆ERC defined as the difference between the redox
potential of the immobilized protein (Em,SAM) and the protein in solution (Em,Sol). ∆ERC
generally decreases with decreasing strength of electrostatic interactions,41 which is
consistent to the observed trend for ∆ERC in this work.
It is interesting to note that two separated redox potentials at +0.01 V and +0.16 V were
reported for the HoxZ subunit of MBH in membrane fragments9 whereas spectro-
electrochemical titrations of the isolated and MBH complex-integral HoxZ subunit carried out
in this work display only one redox transition around -0.09 V.
Attempts to immobilize HoxZ via the weakly negatively charged top side did not lead to
unambiguous conclusions. Immobilizing the isolated HoxZ subunit on C6(NH2) SAMs in
neutral solutions afforded essentially the same redox potential as determined for C5(COOH)

Role of the HoxZ Subunit in the ET Pathway of Immobilized MBH (7.3)
107
SAMs. Under these conditions HoxZ might be immobilized via the cationic bottom side,
possibly via hydrogen bonding interactions to the non-protonated amino groups of the SAM.
This conclusion is supported by the fact that decreasing the pH, corresponding to an
increasing degree of protonation of the SAM, causes a decrease of the amount of adsorbed
proteins such that at pH 5.5 no SERR spectrum can be obtained anymore.
Electrical communication and catalytic activity of the immobilized HoxGKZ hetero-
trimer
It was shown that the immobilized hetero-trimer is able to catalytically oxidize hydrogen
and deliver electrons from its active site in HoxG to the HoxZ subunit. However, it is very
unlikely that the HoxZ subunit is primarily involved in the transfer of these electrons to the
electrode as observed in PFV experiments. On one hand, the onset potential of the catalytic
current is around -0.26 V, which is far below the redox potential of the HoxZ. Therefore, both
hemes of the subunit should be reduced at this electrode potential and, hence, not be able to
accept electrons. On the other hand, the heterogeneous electron transfer rate determined by
TR SERR spectroscopy (k = 0.24 ±0.06 s-1) is too small to account for the strong catalytic
current observed in PFV experiments, considering a turnover number of kcat = 250 s-1
estimated for the hetero-dimer on PGE.6 The poor electron transfer from HoxZ to the
electrode might be due to sterical hindrances caused by the detergent surrounding
hydrophobic patches of HoxZ. Based on these considerations, the voltammetric signal shown
in figure 5B is not mainly attributable to a hetero-trimer shuttling electrons through the HoxZ
subunit. On the first sight, the CV signal might be attributed to a fraction of hetero-dimer
dissociated from the hetero-trimer upon immobilization. This assumption, however, can be
excluded since a voltammetric film consisting of the hetero-dimer revealed a lower catalytic
current. Although this finding shows that the hetero-dimer alone may bind to the electrode
upon retention of catalytic activity, further stabilization of the enzyme on the electrode is
achieved by the HoxZ subunit.
It has to be noted at this point that in its biological context the HoxZ subunit unambiguously
fulfills two functions, i.e. (i) anchoring the hydrogenase module to the membrane and (ii)
transferring electrons to the quinone pool.9;42 On the electrode HoxZ mainly performs a
stabilizing function that could be related to its anchoring function in biological systems. Also
an additional stabilizing function as an electron sink or supply should be considered.
Accordingly, we propose that immobilization preserves essentially the hetero-trimer
structure but opens two different electron pathways for electronic communication with the
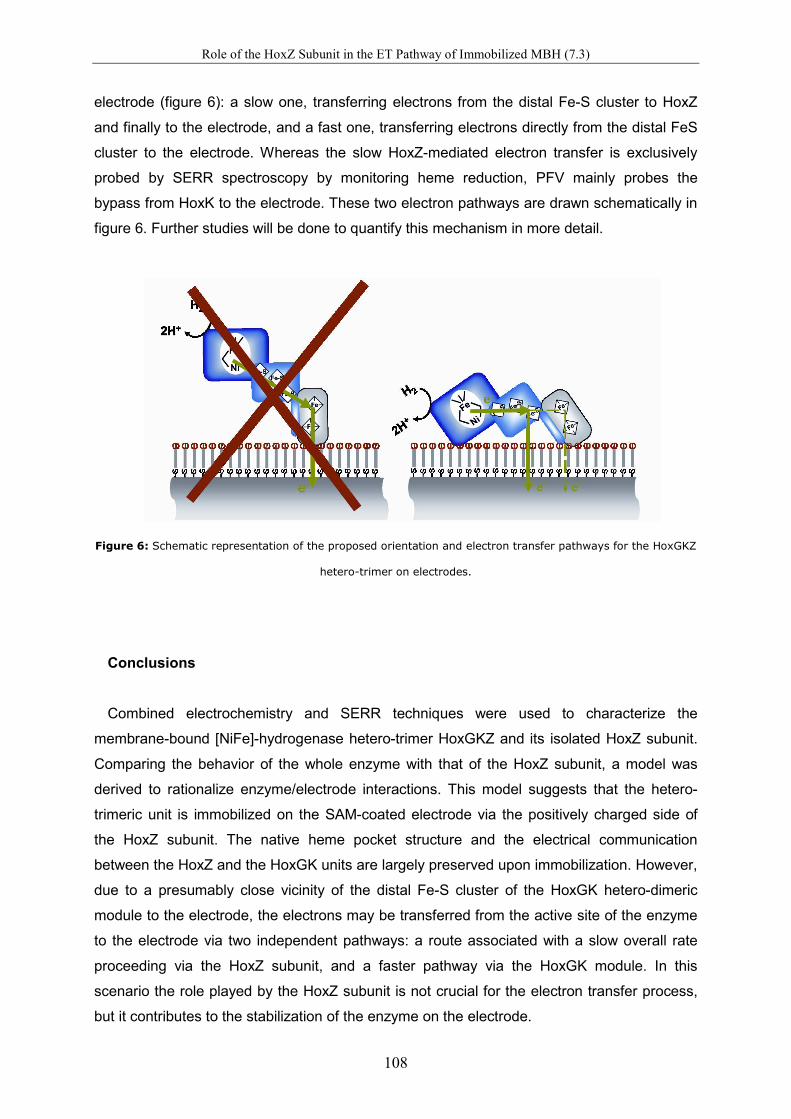
Role of the HoxZ Subunit in the ET Pathway of Immobilized MBH (7.3)
108
electrode (figure 6): a slow one, transferring electrons from the distal Fe-S cluster to HoxZ
and finally to the electrode, and a fast one, transferring electrons directly from the distal FeS
cluster to the electrode. Whereas the slow HoxZ-mediated electron transfer is exclusively
probed by SERR spectroscopy by monitoring heme reduction, PFV mainly probes the
bypass from HoxK to the electrode. These two electron pathways are drawn schematically in
figure 6. Further studies will be done to quantify this mechanism in more detail.
Figure 6: Schematic representation of the proposed orientation and electron transfer pathways for the HoxGKZ
hetero-trimer on electrodes.
Conclusions
Combined electrochemistry and SERR techniques were used to characterize the
membrane-bound [NiFe]-hydrogenase hetero-trimer HoxGKZ and its isolated HoxZ subunit.
Comparing the behavior of the whole enzyme with that of the HoxZ subunit, a model was
derived to rationalize enzyme/electrode interactions. This model suggests that the hetero-
trimeric unit is immobilized on the SAM-coated electrode via the positively charged side of
the HoxZ subunit. The native heme pocket structure and the electrical communication
between the HoxZ and the HoxGK units are largely preserved upon immobilization. However,
due to a presumably close vicinity of the distal Fe-S cluster of the HoxGK hetero-dimeric
module to the electrode, the electrons may be transferred from the active site of the enzyme
to the electrode via two independent pathways: a route associated with a slow overall rate
proceeding via the HoxZ subunit, and a faster pathway via the HoxGK module. In this
scenario the role played by the HoxZ subunit is not crucial for the electron transfer process,
but it contributes to the stabilization of the enzyme on the electrode.

Role of the HoxZ Subunit in the ET Pathway of Immobilized MBH (7.3)
109
ACKNOWLEDGMENT: The authors would like to thank the DFG (Cluster of excellence,
UniCat), the Fonds der Chemischen Industrie (I.W.), and the Alexander von Humboldt
Foundation (D.M).
SUPPORTING INFORMATION: Additional data on the different immobilization strategies
and the potentiometric titration of the isolated HoxZ subunit.
References
(1) Vincent, K. A.; Cracknell, J. A.; Lenz, O.; Zebger, I.; Friedrich, B.; Armstrong, F. A.
Proc. Nat. Acad. Sci. USA 2005, 102, 16951-16954.
(2) Cammack, R; Frey, M.; Robson, R. Hydrogen As a Fuel: Learning From Nature,
Taylor & Francis: London, 2001.
(3) Krassen, H.; Schwarze, A.; Friedrich, B.; Ataka, K.; Lenz, O.; Heberle, J. ACS Nano
2009, 3, 4055-4061.
(4) Friedrich, B.; Fritsch, J.; Lenz, O. Curr. Opin. Biotech. 2011, 22, 358-364.
(5) Ludwig, M.; Cracknell, J. A.; Vincent, K. A.; Armstrong, F. A.; Lenz, O. J. Biol. Chem.
2009, 284, 465-477.
(6) Cracknell, J. A.; Wait, A. F.; Lenz, O.; Friedrich, B.; Armstrong, F. A. Proc. Nat. Acad.
Sci. USA 2009, 106, 20681-20686.
(7) Saggu, M.; Zebger, I.; Ludwig, M.; Lenz, O.; Friedrich, B.; Hildebrandt, P.; Lendzian,
F. J. Biol. Chem. 2009, 284, 16264-16276.
(8) Goris, T.; Wait, A. F.; Saggu, M.; Fritsch, J.; Heidary, N.; Stein, M.; Zebger, I.;
Lendzian, F.; Armstrong, F. A.; Friedrich, B.; Lenz, O. Nat. Chem. Biol. 2011, 7, 310-
318.
(9) Bernhard, M.; Benelli, B.; Hochkoeppler, A.; Zannoni, D.; Friedrich, B. Eur. J.
Biochem. 1997, 248, 179-186.
(10) Lenz, O.; Ludwig, M.; Schubert, T.; Burstel, I.; Ganskow, S.; Goris, T.; Schwarze, A.;
Friedrich, B. ChemPhysChem 2010, 11, 1107-1119.

Role of the HoxZ Subunit in the ET Pathway of Immobilized MBH (7.3)
110
(11) Schink, B.; Schlegel, H. G. Biochim. Biophys. Acta 1979, 567, 315-324.
(12) Knuttel, K.; Schneider, K.; Erkens, A.; Plass, W.; Muller, A.; Bill, E.; Trautwein, A. X.
Bull. Pol. Acad. Sci. Chem. 1994, 42, 495-511.
(13) Saggu, M.; Teutloff, C.; Ludwig, M.; Brecht, M.; Pandelia, M. E.; Lenz, O.; Friedrich,
B.; Lubitz, W.; Hildebrandt, P.; Lendzian, F.; Bittl, R. Phys. Chem. Chem. Phys. 2010,
12, 2139-2148.
(14) Schneider, K.; Patil, D. S.; Cammack, R. Biochim. Biophys. Acta 1983, 748, 353-361.
(15) Saggu, M.; Ludwig, M.; Friedrich, B.; Hildebrandt, P.; Bittl, R.; Lendzian, F.; Lenz, O.;
Zebger, I. ChemPhysChem 2010, 11, 1215-1224.
(16) Murgida, D. H.; Hildebrandt, P. J. Phys. Chem. B 2001, 105, 1578-1586.
(17) Feng, J. J.; Murgida, D. H.; Kuhlmann, U.; Utesch, T.; Mroginski, M. A.; Hildebrandt,
P.; Weidinger, I. M. J. Phys. Chem. B 2008, 112, 15202-15211.
(18) Sezer, M.; Spricigo, R.; Utesch, T.; Millo, D.; Leimkuehler, S.; Mroginski, M. A.;
Wollenberger, U.; Hildebrandt, P.; Weidinger, I. M. Phys. Chem. Chem. Phys. 2010,
12, 7894-7903.
(19) Wisitruangsakul, N.; Lenz, O.; Ludwig, M.; Friedrich, B.; Lendzian, F.; Hildebrandt, P.;
Zebger, I. Angew. Chem. Int. Ed. 2009, 48, 611-613.
(20) Millo, D.; Pandelia, M. E.; Utesch, T.; Wisitruangsakul, N.; Mroginski, M. A.; Lubitz,
W.; Hildebrandt, P.; Zebger, I. J. Phys. Chem. B 2009, 113, 15344-15351.
(21) Millo, D.; Pandelia, M. E.; Lubitz, W.; Hildebrandt, P.; Zebger, I. Angew. Chem. Int.
Ed. 2011, 50, 2632-2634.
(22) Frielingsdorf et al. unpublished
(23) Wackerbarth, H.; Klar, U.; Gunther, W.; Hildebrandt, P. Appl. Spec. 1999, 53, 283-
291.
(24) Moss, D.; Nabedryk, E.; Breton, J.; Mantele, W. Eur. J. Biochem. 1990, 187, 565-
572.
(25) Arnold, K.; Bordoli, L.; Kopp, J.; Schwede, T. Bioinformatics 2006, 22, 195-201.
(26) Jormakka, M.; Tornroth, S.; Byrne, B.; Iwata, S. Science 2002, 295, 1863-1868.
(27) Humphrey, W.; Dalke, A.; Schulten, K. J. Mol. Graphics 1996, 14, 33-&.

Role of the HoxZ Subunit in the ET Pathway of Immobilized MBH (7.3)
111
(28) MacKerell et al J. Phys. Chem. B 1998, 102, 3586-3616.
(29) Baker, N. A.; Sept, D.; Joseph, S.; Holst, M. J.; McCammon, J. A. Proc. Nat. Acad.
Sci. USA 2001, 98, 10037-10041.
(30) Dolinsky, T. J.; Nielsen, J. E.; McCammon, J. A.; Baker, N. A. Nucleic Acid. Res.
2004, 32, W665-W667.
(31) Berks, B. C.; Page, M. D.; Richardson, D. J.; Reilly, A.; Cavill, A.; Outen, F.;
Ferguson, S. J. Mol. Microbiol. 1995, 15, 319-331.
(32) Page, C. C.; Moser, C. C.; Chen, X. X.; Dutton, P. L. Nature 1999, 402, 47-52.
(33) Wackerbarth, H.; Hildebrandt, P. ChemPhysChem. 2003, 4, 714-724.
(34) Vincent, K. A.; Parkin, A.; Armstrong, F. A. Chem. Rev. 2007, 107, 4366-4413.
(35) To avoid confusion: Only the reductive activation rate of the Nir-B state in ref. 20 is
taken into account for comparison.
(36) Léger, C.; Jones, A. K.; Roseboom, W.; Albracht, S. P. J.; Armstrong, F. A.
Biochemistry 2002, 41, 15736-15746.
(37) Millo, D.; Bonifacio, A.; Ranieri, A.; Borsari, M.; Gooijer, C.; van der Zwan, G.
Langmuir 2007, 23, 9898-9904.
(38) Fourmond, V.; Infossi, P.; Giudici-Orticoni, M. T.; Bertrand, P.; Léger, C. J. Am.
Chem. Soc. 2010, 132, 4848-4857.
(39) Vincent, K. A.; Parkin, A.; Lenz, O.; Albracht, S. P. J.; Fontecilla-Camps, J. C.;
Cammack, R.; Friedrich, B.; Armstrong, F. A. J. Am. Chem. Soc. 2005, 127, 18179-
18189.
(40) Weidinger, I. M.; Murgida, D. H.; Dong, W. F.; Möhwald, H.; Hildebrandt, P. J. Phys.
Chem. B 2006, 110, 522-529.
(41) Petrović, J.; Clark, R. A.; Yue, H. J.; Waldeck, D. H.; Bowden, E. F. Langmuir 2005,
21, 6308-6316.
(42) Gross, R.; Pisa, R.; Sanger, M.; Lancaster, C. R. D.; Simon, J. J. Biol. Chem. 2004,
279, 274-281.

112

Role of the HoxZ Subunit in the ET Pathway of Immobilized MBH – Supporting Information (7.3)
113
Supporting Information
Role of the HoxZ subunit in the electron transfer pathway of the membrane-
bound [NiFe]-hydrogenase from Ralstonia eutropha immobilized on electrodes
Murat Sezera, Stefan Frielingsdorfb, Diego Milloa, Nina Heidarya, Tillman Utescha, Maria-
Andrea Mroginskia, Bärbel Friedrichb, Peter Hildebrandta, Ingo Zebgera, Inez M. Weidingera*
aTechnische Universität Berlin, Insitut für Chemie, Straße des 17. Juni 135, 10623 Berlin. bHumboldt-Universität zu Berlin,
Chausseestraße 117, 10115 Berlin.
Table S1: Redox properties of the immobilized isolated Cyt b domain under different conditions. The data
refers to the 6c LS species.
SAM C6(NH2) C6(NH2)/
C6(OH) (1:3) C5(COOH)
C5(COOH)/
C6(OH)(1:3)
PB-buffer
10mM pH7.0
10mM pH7.0
100m pH7.0
10mM pH7.0
100mM pH7.0
100mM pH6.0
100mM pH5.5
Em /V -0.15 ±0.01
-0.125 ±0.02
-0.12 ±0.02
-0.14 ±0.02
-0.130 ±0.02
-0.11 ±0.01
-0.085 ±0.02
n 0.42 ±0.05 0.48 ±0.07
0.51 ±0.05
0.42 ±0.03
0.47 ±0.05
0.44 ±0.03
0.49 ±0.07
5cHSox [E=0.3V]
~ 20 % ~ 10 % ~0% ~ 40 % ~ 25 % ~ 15 % 0 - 10 %
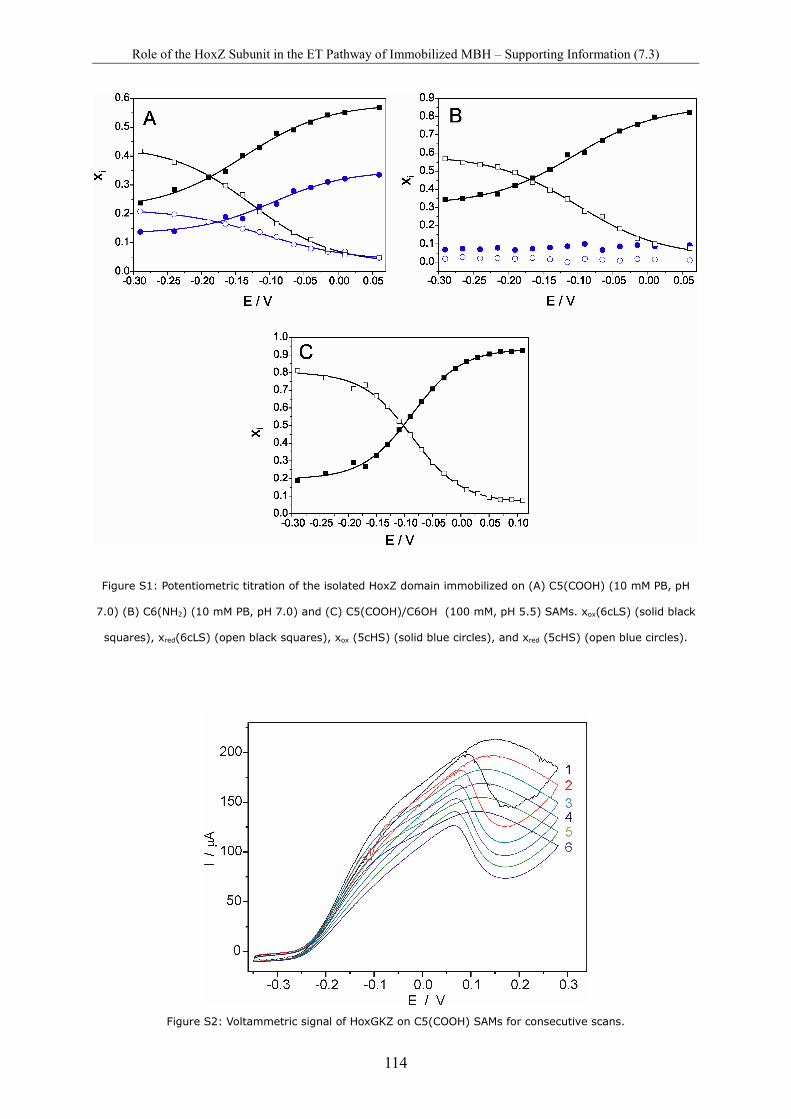
Role of the HoxZ Subunit in the ET Pathway of Immobilized MBH – Supporting Information (7.3)
114
Figure S1: Potentiometric titration of the isolated HoxZ domain immobilized on (A) C5(COOH) (10 mM PB, pH
7.0) (B) C6(NH2) (10 mM PB, pH 7.0) and (C) C5(COOH)/C6OH (100 mM, pH 5.5) SAMs. xox(6cLS) (solid black
squares), xred(6cLS) (open black squares), xox (5cHS) (solid blue circles), and xred (5cHS) (open blue circles).
Figure S2: Voltammetric signal of HoxGKZ on C5(COOH) SAMs for consecutive scans.
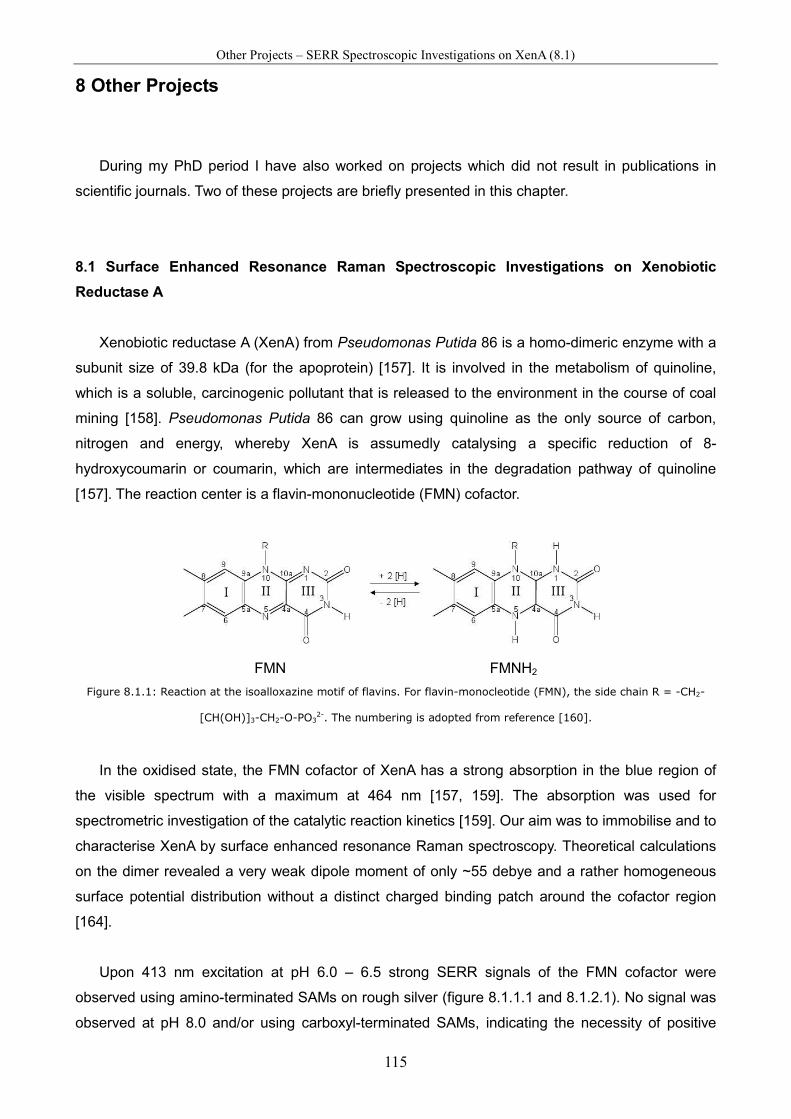
Other Projects – SERR Spectroscopic Investigations on XenA (8.1)
115
8 Other Projects
During my PhD period I have also worked on projects which did not result in publications in
scientific journals. Two of these projects are briefly presented in this chapter.
8.1 Surface Enhanced Resonance Raman Spectroscopic Investigations on Xenobiotic
Reductase A
Xenobiotic reductase A (XenA) from Pseudomonas Putida 86 is a homo-dimeric enzyme with a
subunit size of 39.8 kDa (for the apoprotein) [157]. It is involved in the metabolism of quinoline,
which is a soluble, carcinogenic pollutant that is released to the environment in the course of coal
mining [158]. Pseudomonas Putida 86 can grow using quinoline as the only source of carbon,
nitrogen and energy, whereby XenA is assumedly catalysing a specific reduction of 8-
hydroxycoumarin or coumarin, which are intermediates in the degradation pathway of quinoline
[157]. The reaction center is a flavin-mononucleotide (FMN) cofactor.
FMN FMNH2
Figure 8.1.1: Reaction at the isoalloxazine motif of flavins. For flavin-monocleotide (FMN), the side chain R = -CH2-
[CH(OH)]3-CH2-O-PO32-. The numbering is adopted from reference [160].
In the oxidised state, the FMN cofactor of XenA has a strong absorption in the blue region of
the visible spectrum with a maximum at 464 nm [157, 159]. The absorption was used for
spectrometric investigation of the catalytic reaction kinetics [159]. Our aim was to immobilise and to
characterise XenA by surface enhanced resonance Raman spectroscopy. Theoretical calculations
on the dimer revealed a very weak dipole moment of only ~55 debye and a rather homogeneous
surface potential distribution without a distinct charged binding patch around the cofactor region
[164].
Upon 413 nm excitation at pH 6.0 – 6.5 strong SERR signals of the FMN cofactor were
observed using amino-terminated SAMs on rough silver (figure 8.1.1.1 and 8.1.2.1). No signal was
observed at pH 8.0 and/or using carboxyl-terminated SAMs, indicating the necessity of positive

Other Projects – SERR Spectroscopic Investigations on XenA (8.1)
116
surface charge density for adsorption.
Figure 8.1.2 [164]: Dipole moment and surface potential distribution of the XenA dimer. A small part of the FMN
cofactor of one monomers can be seen in yellow (top right).
As reported for many other proteins [160-163] and also observed in this work upon
immobilisation on 6-aminohexanethiole (AHT) and 8-aminooctanethiol (AOT), the fluorescence of
flavoproteins can be effectively oppressed upon immobilisation on silver substrates. Silver acts as
an effective fluorescence quencher and may also provide vibrational surface enhancement.
However, a huge fluorescence background was observed on silver coated with 11-
aminoundecanethiol, indicating that for this SAM the separation of the fluorescent cofactor from the
silver surface is too large for efficient quenching (not shown).
8.1.1 RR and SERR Spectra Using 8-Aminooctanethiol Coating
Obviously, either the whole enzyme, or the extracted cofactor only, interact with positively
charged surfaces. Extraction of the cofactor was shown to occur for many flavoproteins in SERR
experiments using silver colloids [163]. To figure out whether the SERR signal originates from the
cofactor that is still incorporated in the enzyme or extracted, a similar experiment was carried out
using only the isolated FMN cofactor (figure 8.1.1.1 c).
The band at 1629 cm-1 in the RR spectrum of XenA can be designated as band I according to
the nomenclature introduced by Bowman and Spiro [160]. No significant frequency changes upon
adsorption onto AOT-coated electrodes is observed for this band, which consists of stretching
modes of aromatic C-C bonds in ring I of the isoalloxazine motif (figure 8.1.1) [160]. On the
contrary, a considerable downshift of ~9 cm-1 is observed for band II at 1589 cm-1. Band II mainly
consists of C-N stretching modes in ring II and III [160]. A large shift of this band upon
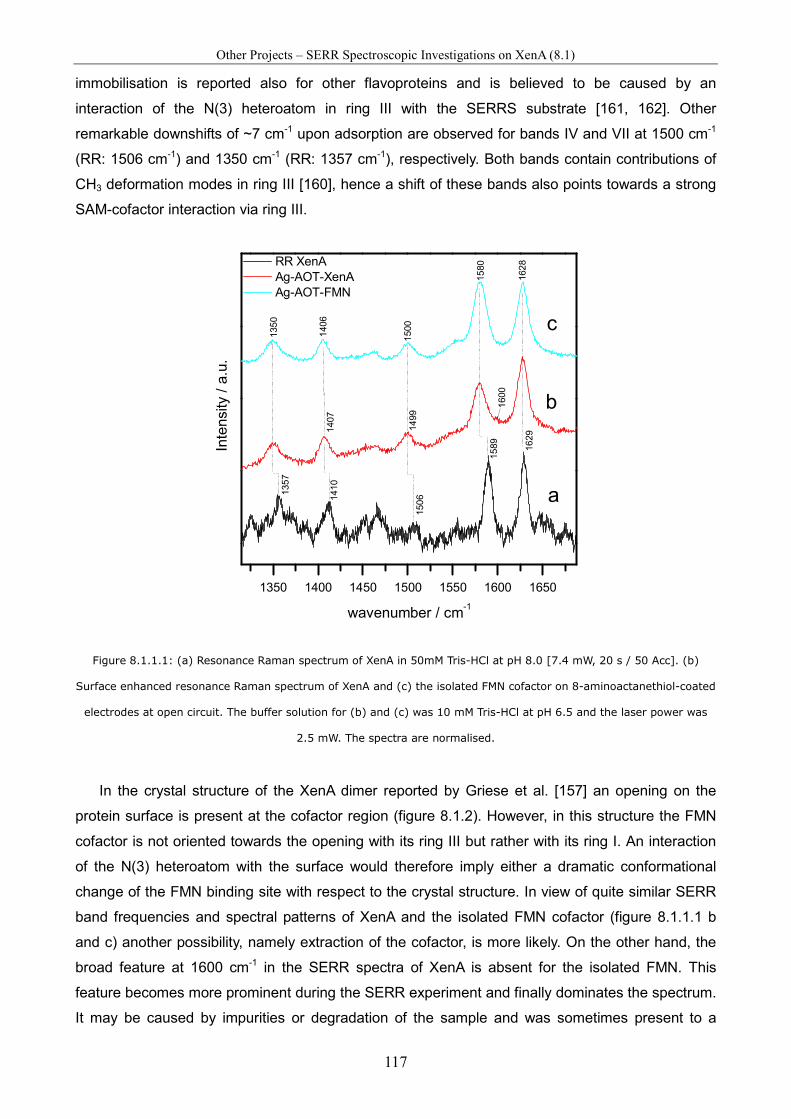
Other Projects – SERR Spectroscopic Investigations on XenA (8.1)
117
immobilisation is reported also for other flavoproteins and is believed to be caused by an
interaction of the N(3) heteroatom in ring III with the SERRS substrate [161, 162]. Other
remarkable downshifts of ~7 cm-1 upon adsorption are observed for bands IV and VII at 1500 cm-1
(RR: 1506 cm-1) and 1350 cm-1 (RR: 1357 cm-1), respectively. Both bands contain contributions of
CH3 deformation modes in ring III [160], hence a shift of these bands also points towards a strong
SAM-cofactor interaction via ring III.
1350 1400 1450 1500 1550 1600 1650
1580
c
b
a
150
0
140
6
135
0
160
0
140
7
1499
162
8
150
6135
7
1410
1629
1589
RR XenA Ag-AOT-XenA Ag-AOT-FMN
Inte
nsity
/ a
.u.
wavenumber / cm-1
Figure 8.1.1.1: (a) Resonance Raman spectrum of XenA in 50mM Tris-HCl at pH 8.0 [7.4 mW, 20 s / 50 Acc]. (b)
Surface enhanced resonance Raman spectrum of XenA and (c) the isolated FMN cofactor on 8-aminoactanethiol-coated
electrodes at open circuit. The buffer solution for (b) and (c) was 10 mM Tris-HCl at pH 6.5 and the laser power was
2.5 mW. The spectra are normalised.
In the crystal structure of the XenA dimer reported by Griese et al. [157] an opening on the
protein surface is present at the cofactor region (figure 8.1.2). However, in this structure the FMN
cofactor is not oriented towards the opening with its ring III but rather with its ring I. An interaction
of the N(3) heteroatom with the surface would therefore imply either a dramatic conformational
change of the FMN binding site with respect to the crystal structure. In view of quite similar SERR
band frequencies and spectral patterns of XenA and the isolated FMN cofactor (figure 8.1.1.1 b
and c) another possibility, namely extraction of the cofactor, is more likely. On the other hand, the
broad feature at 1600 cm-1 in the SERR spectra of XenA is absent for the isolated FMN. This
feature becomes more prominent during the SERR experiment and finally dominates the spectrum.
It may be caused by impurities or degradation of the sample and was sometimes present to a

Other Projects – SERR Spectroscopic Investigations on XenA (8.1)
118
considerable extend even in the beginning of the SERR experiment. Hence, the reproducibility and
signal stability was found to be insufficient for this system. Nevertheless, since the broad feature at
1600 cm-1 is completely absent in the SERR spectra of the isolated FMN it is also a sign for an
interaction of the protein matrix with the surface.
Because the reduced FMN does not absorb light in the visible range [157, 159], no SERR
signal was expected to appear for reduced species due to the lack of resonance enhancement at
413 nm laser excitation. However, the signal was not diminished at -0.5 V (vs. Ag/AgCl 3M KCl). In
solution measurements a value of -0.47 V was determined for the midpoint potential for the FMN /
(FMN-H)-1 couple at pH 8.0 [159]. Since the midpoint potential of the FMN is expected to increase
at lower pH values [165] and adsorption onto positively charged surfaces [12], we would expect a
fully reduced protein film at -0.5 V. However, potential controlled SERR using AOT coating only
revealed a continuous irreversible decrease of the signal intensity with time, regardless of the
applied electrode potential. This finding indicates poor electrochemical communication and
potential and/or laser induced degradation of the immobilised XenA. Remarkably a similar
irreversible decrease of the signal was observed for the isolated FMN cofactor.
8.1.2 SERR Spectra Using 6-Aminohexanethiol Coating
The SERR spectra on AHT clearly prove the existence of two different species, one of which
has a similar spectrum as on AOT and reversibly diminishes at negative potentials. Despite the fact
that the redox active species on AHT seems to be similar to the species observed on AOT, there
was no electronic communication on AOT, which might be related to the slightly greater thickness
of the AOT coating. The other species observed on AHT exhibits a different spectral pattern (band
II at 1593 cm-1, band VII at 1359 cm-1) and is inactive with respect to the electrode potential (figure
8.1.2.1). During the SERRS experiment the spectrum of this species, which is in the following
denoted as the inactive form, gain more and more intensity. Obviously, the initially redox active
XenA immobilised on AHT-coated electrodes undergoes an irreversible change into the inactive
form. This process seems to be accelerated when a potential is applied on the electrode.
The broad feature at 1600 cm-1 appears and gains more intensity during the experiment also
on AHT coatings. Apart from this, only the inactive form contributes to the SERR spectrum at
negative potentials. Remarkably, the frequencies of band I, II and VII for the inactive form are quite
similar to the respective positions in the RR spectrum of XenA (figure 8.1.1.1 a). From this
observation it may be concluded that the FMN cofactor in the inactive form does not interact with
the AHT coating via the N(3) heteroatom, at least not in a similar manner as in the active form.
Direct contact between N(3) and silver was shown to be required for SERRS at colloidal silver
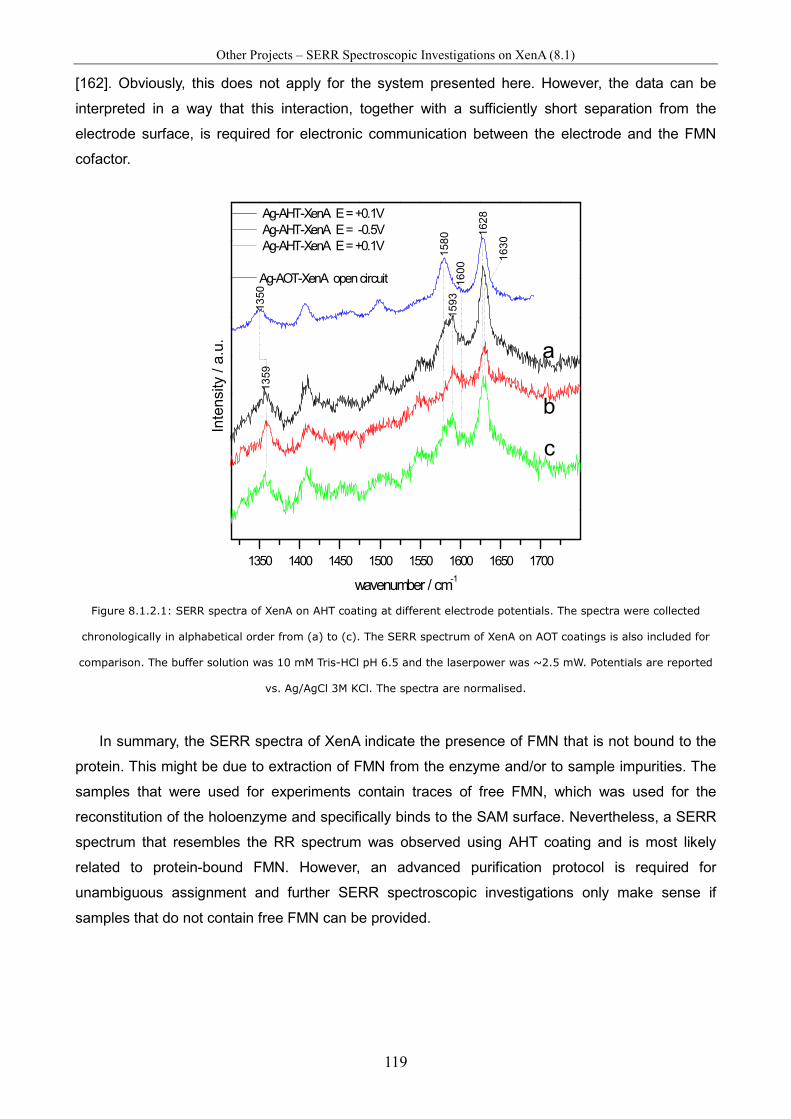
Other Projects – SERR Spectroscopic Investigations on XenA (8.1)
119
[162]. Obviously, this does not apply for the system presented here. However, the data can be
interpreted in a way that this interaction, together with a sufficiently short separation from the
electrode surface, is required for electronic communication between the electrode and the FMN
cofactor.
1350 1400 1450 1500 1550 1600 1650 1700
c
b
1600
1350
1359
158
015
93
162
8
163
0
Ag-AHT-XenA E = +0.1V Ag-AHT-XenA E = -0.5V Ag-AHT-XenA E = +0.1V
Ag-AOT-XenA open circuit
Inte
nsity
/ a
.u.
wavenumber / cm-1
a
Figure 8.1.2.1: SERR spectra of XenA on AHT coating at different electrode potentials. The spectra were collected
chronologically in alphabetical order from (a) to (c). The SERR spectrum of XenA on AOT coatings is also included for
comparison. The buffer solution was 10 mM Tris-HCl pH 6.5 and the laserpower was ~2.5 mW. Potentials are reported
vs. Ag/AgCl 3M KCl. The spectra are normalised.
In summary, the SERR spectra of XenA indicate the presence of FMN that is not bound to the
protein. This might be due to extraction of FMN from the enzyme and/or to sample impurities. The
samples that were used for experiments contain traces of free FMN, which was used for the
reconstitution of the holoenzyme and specifically binds to the SAM surface. Nevertheless, a SERR
spectrum that resembles the RR spectrum was observed using AHT coating and is most likely
related to protein-bound FMN. However, an advanced purification protocol is required for
unambiguous assignment and further SERR spectroscopic investigations only make sense if
samples that do not contain free FMN can be provided.
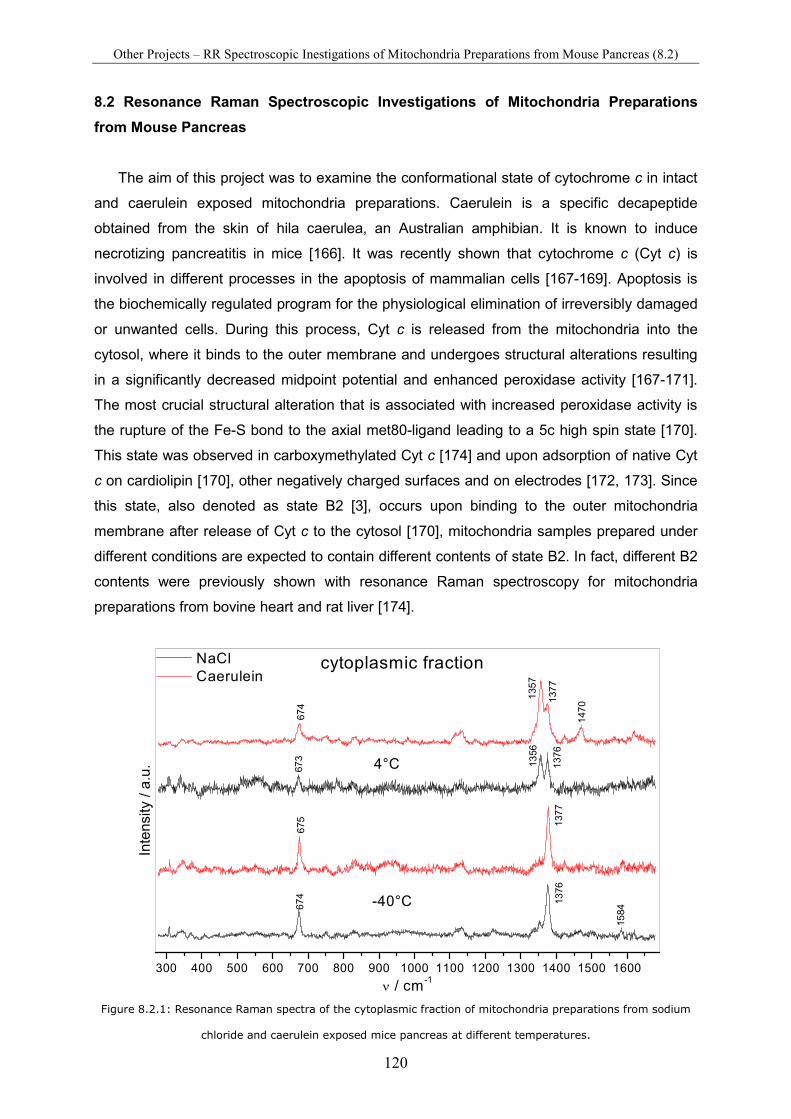
Other Projects – RR Spectroscopic Inestigations of Mitochondria Preparations from Mouse Pancreas (8.2)
120
8.2 Resonance Raman Spectroscopic Investigations of Mitochondria Preparations
from Mouse Pancreas
The aim of this project was to examine the conformational state of cytochrome c in intact
and caerulein exposed mitochondria preparations. Caerulein is a specific decapeptide
obtained from the skin of hila caerulea, an Australian amphibian. It is known to induce
necrotizing pancreatitis in mice [166]. It was recently shown that cytochrome c (Cyt c) is
involved in different processes in the apoptosis of mammalian cells [167-169]. Apoptosis is
the biochemically regulated program for the physiological elimination of irreversibly damaged
or unwanted cells. During this process, Cyt c is released from the mitochondria into the
cytosol, where it binds to the outer membrane and undergoes structural alterations resulting
in a significantly decreased midpoint potential and enhanced peroxidase activity [167-171].
The most crucial structural alteration that is associated with increased peroxidase activity is
the rupture of the Fe-S bond to the axial met80-ligand leading to a 5c high spin state [170].
This state was observed in carboxymethylated Cyt c [174] and upon adsorption of native Cyt
c on cardiolipin [170], other negatively charged surfaces and on electrodes [172, 173]. Since
this state, also denoted as state B2 [3], occurs upon binding to the outer mitochondria
membrane after release of Cyt c to the cytosol [170], mitochondria samples prepared under
different conditions are expected to contain different contents of state B2. In fact, different B2
contents were previously shown with resonance Raman spectroscopy for mitochondria
preparations from bovine heart and rat liver [174].
300 400 500 600 700 800 900 1000 1100 1200 1300 1400 1500 1600
1584
13
56
13
7613
76
673
674
674
675 1
377
147
0
135
7
137
7
NaCl Caerulein
Inte
nsi
ty / a
.u.
ν / cm -1
4°C
-40°C
cytoplasmic fraction
Figure 8.2.1: Resonance Raman spectra of the cytoplasmic fraction of mitochondria preparations from sodium
chloride and caerulein exposed mice pancreas at different temperatures.

Other Projects – RR Spectroscopic Inestigations of Mitochondria Preparations from Mouse Pancreas (8.2)
121
In figure 8.2.1 resonance Raman spectra from the cytoplasmic fraction of different
mitochondria sample preparations are shown. These samples are obtained from differential
centrifugation which allows for separation of the cytoplasmic fraction (containing dissolved
Cyt c) from the microsomal fraction (containing vesicles/vacuoles) and a heavy fraction
(containg membrane fragments with membrane bound Cyt c). The spectra of the frozen
sample at -40 °C clearly show the presence of an oxidised heme species, however, the
spectra are not attributable to Cyt c. In the liquid phase at +4 °C a partial reduction of the
heme species is observed due to photoreduction [175]. In figure 8.2.2 the spectra of the
microsomal fraction and ‘heavy’ fraction are shown.
300 400 500 600 700 800 900 1000 1100 1200 1300 1400 1500 1600
-40°C
4°C+dithionite
1470
1357
microsomal fraction NaCl Caerulein
744
1355
1372
1374
673
673
345
345
675
675 13
7413
77
'heavy' fraction
Inte
nsity
/ a
.u.
ν / cm-1
NaCl Caerulein
4°C+dithionite
-40°C
1358
1372
1375
1359
1376
4°C+dithionite
-40°C
674
673
675
673
Figure 8.2.2: Resonance Raman spectra of the microsomal and heavy fraction of mitochondria preparations
from sodium chloride and caerulein exposed mice pancreas at different temperatures.
A significantly lower extend of photoreduction was found for the more viscose microsomal
and heavy mitochondria fractions. Therefore, dithionite was added to the samples at +4 °C in
order to obtain vibrational signals from the respective reduced species. However, here again,
none of the spectra is attributable to any form of Cyt c, which was actually expected to
dominate the spectra of these sample preparations.

122

Conclusion and Outlook – Silver-Gold Hybrid Devices (9.1)
123
9 Conclusion and Outlook
This work contributed to two different aspects within the research field of resonance
Raman (RR) and surface enhanced resonance Raman (SERR) spectroscopy of
chromophore containing proteins. One aspect was related to the development of advanced
functional support materials for potential controlled surface enhanced (resonance) Raman
spectroscopy. The optical and electrochemical performance of recently developed silver-gold
hybrid devices as support materials was explored. Other projects within this work were
related to the analysis of interfacial processes of heme enzymes. The study of human
sulphite oxidase and membrane bound hydrogenase from Ralstonia eutropha H16
substantially contributed to the understanding of immobilised enzymes and the parameters
that determine their structural integrity, stability, catalytic performance and electronic
communication with conductive support materials.
9.1 Silver-Gold Hybrid Devices
The electrochemical and optical performance of novel silver-gold hybrid devices was
explored. In these devices a thin gold island film is separated by amino-terminated self
assembled monolayers (spacer SAMs) from an electrochemically roughened silver support.
The devices were found to exhibit optical enhancement factors and profiles that are
comparable to pure silver supports. At the same time they exhibit the surface chemistry and
biocompatibility of gold.
Heterogeneous electron transfer (ET) between immobilised HHCyt c and the multilayer
device was found to be limited by electron tunnelling through the spacer SAM or an outer
SAM deposited on the outer gold film. Surprisingly, decreasing ET rates with decreasing
spacer SAM thickness were found and rationalised in terms higher amounts of impurities
and/or defects in shorter spacer SAMs. The potential of zero charge of an Ag-AUT-MDHA
hybrid device was determined to be in between of MDHA-coated silver and gold supports
and, accordingly, the magnitude of acceleration of heterogeneous reduction rates with
increasing overpotential was found to lie between those of silver and gold.
Silver-gold hybrid devices represent excellent support materials for SE(R)R spectro-
electrochemistry. In principle, the concept of separating an island film by an insulating spacer
material from a rough silver surface in order to obtain optical enhancement properties of the
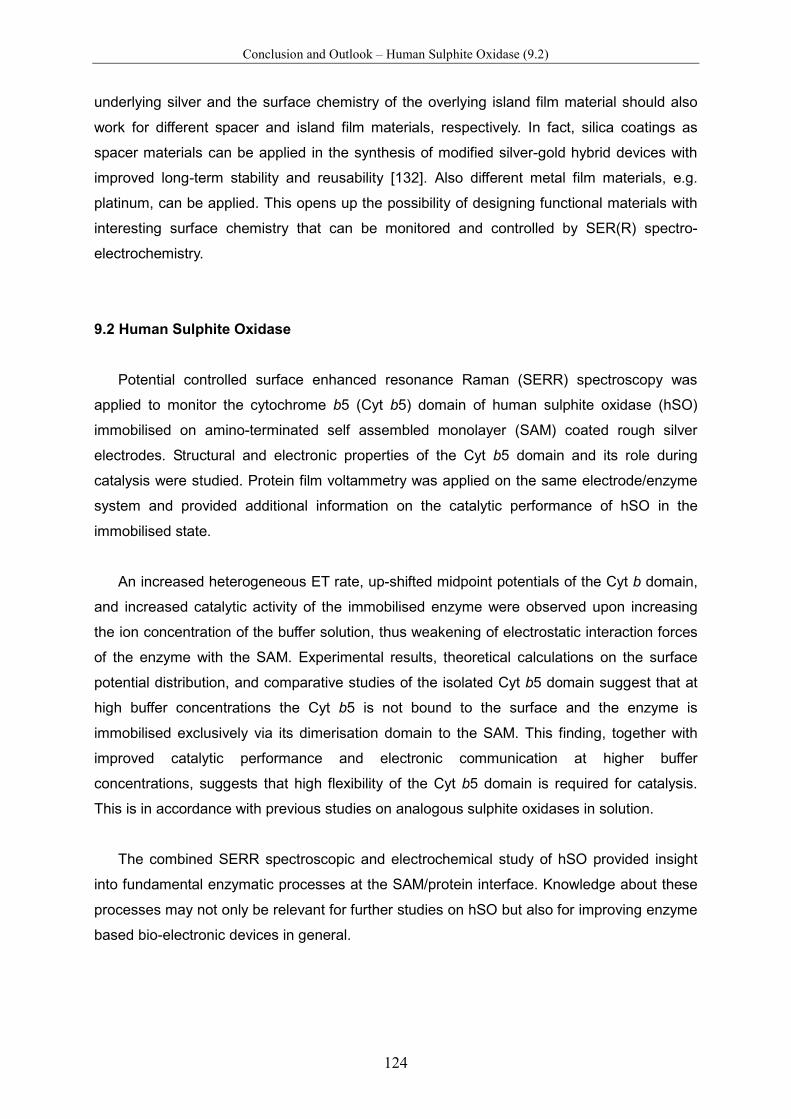
Conclusion and Outlook – Human Sulphite Oxidase (9.2)
124
underlying silver and the surface chemistry of the overlying island film material should also
work for different spacer and island film materials, respectively. In fact, silica coatings as
spacer materials can be applied in the synthesis of modified silver-gold hybrid devices with
improved long-term stability and reusability [132]. Also different metal film materials, e.g.
platinum, can be applied. This opens up the possibility of designing functional materials with
interesting surface chemistry that can be monitored and controlled by SER(R) spectro-
electrochemistry.
9.2 Human Sulphite Oxidase
Potential controlled surface enhanced resonance Raman (SERR) spectroscopy was
applied to monitor the cytochrome b5 (Cyt b5) domain of human sulphite oxidase (hSO)
immobilised on amino-terminated self assembled monolayer (SAM) coated rough silver
electrodes. Structural and electronic properties of the Cyt b5 domain and its role during
catalysis were studied. Protein film voltammetry was applied on the same electrode/enzyme
system and provided additional information on the catalytic performance of hSO in the
immobilised state.
An increased heterogeneous ET rate, up-shifted midpoint potentials of the Cyt b domain,
and increased catalytic activity of the immobilised enzyme were observed upon increasing
the ion concentration of the buffer solution, thus weakening of electrostatic interaction forces
of the enzyme with the SAM. Experimental results, theoretical calculations on the surface
potential distribution, and comparative studies of the isolated Cyt b5 domain suggest that at
high buffer concentrations the Cyt b5 is not bound to the surface and the enzyme is
immobilised exclusively via its dimerisation domain to the SAM. This finding, together with
improved catalytic performance and electronic communication at higher buffer
concentrations, suggests that high flexibility of the Cyt b5 domain is required for catalysis.
This is in accordance with previous studies on analogous sulphite oxidases in solution.
The combined SERR spectroscopic and electrochemical study of hSO provided insight
into fundamental enzymatic processes at the SAM/protein interface. Knowledge about these
processes may not only be relevant for further studies on hSO but also for improving enzyme
based bio-electronic devices in general.
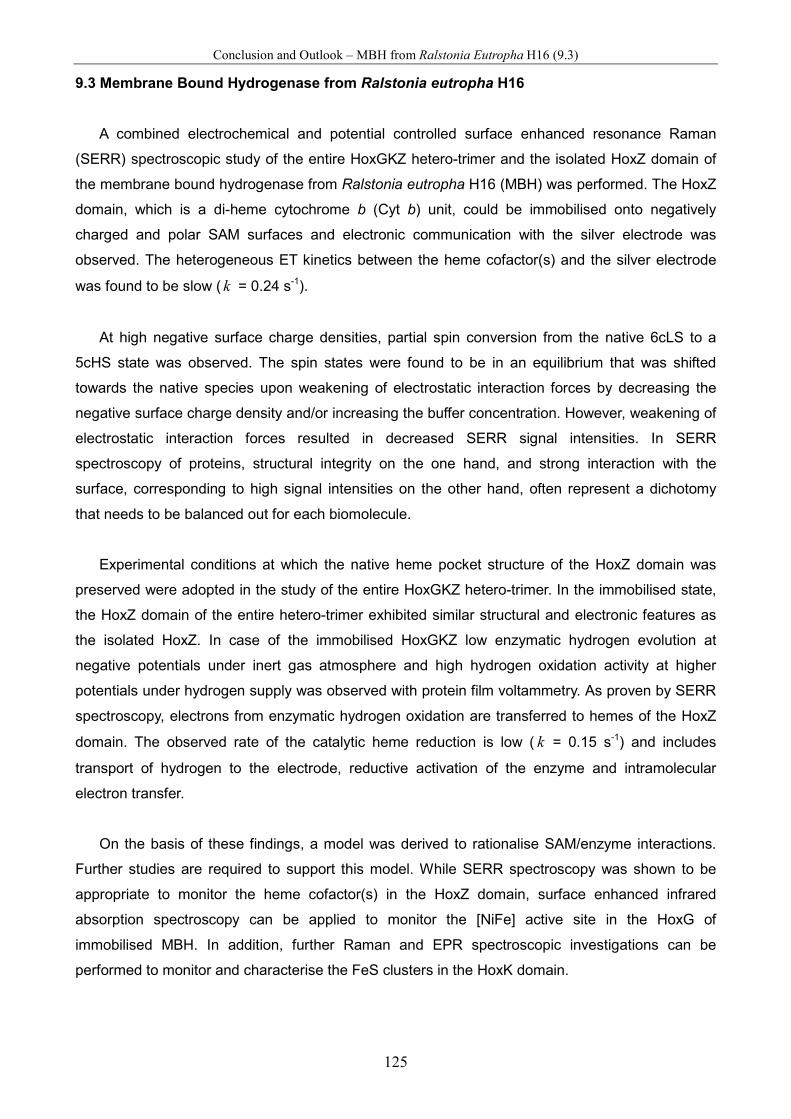
Conclusion and Outlook – MBH from Ralstonia Eutropha H16 (9.3)
125
9.3 Membrane Bound Hydrogenase from Ralstonia eutropha H16
A combined electrochemical and potential controlled surface enhanced resonance Raman
(SERR) spectroscopic study of the entire HoxGKZ hetero-trimer and the isolated HoxZ domain of
the membrane bound hydrogenase from Ralstonia eutropha H16 (MBH) was performed. The HoxZ
domain, which is a di-heme cytochrome b (Cyt b) unit, could be immobilised onto negatively
charged and polar SAM surfaces and electronic communication with the silver electrode was
observed. The heterogeneous ET kinetics between the heme cofactor(s) and the silver electrode
was found to be slow ( k = 0.24 s-1).
At high negative surface charge densities, partial spin conversion from the native 6cLS to a
5cHS state was observed. The spin states were found to be in an equilibrium that was shifted
towards the native species upon weakening of electrostatic interaction forces by decreasing the
negative surface charge density and/or increasing the buffer concentration. However, weakening of
electrostatic interaction forces resulted in decreased SERR signal intensities. In SERR
spectroscopy of proteins, structural integrity on the one hand, and strong interaction with the
surface, corresponding to high signal intensities on the other hand, often represent a dichotomy
that needs to be balanced out for each biomolecule.
Experimental conditions at which the native heme pocket structure of the HoxZ domain was
preserved were adopted in the study of the entire HoxGKZ hetero-trimer. In the immobilised state,
the HoxZ domain of the entire hetero-trimer exhibited similar structural and electronic features as
the isolated HoxZ. In case of the immobilised HoxGKZ low enzymatic hydrogen evolution at
negative potentials under inert gas atmosphere and high hydrogen oxidation activity at higher
potentials under hydrogen supply was observed with protein film voltammetry. As proven by SERR
spectroscopy, electrons from enzymatic hydrogen oxidation are transferred to hemes of the HoxZ
domain. The observed rate of the catalytic heme reduction is low ( k = 0.15 s-1) and includes
transport of hydrogen to the electrode, reductive activation of the enzyme and intramolecular
electron transfer.
On the basis of these findings, a model was derived to rationalise SAM/enzyme interactions.
Further studies are required to support this model. While SERR spectroscopy was shown to be
appropriate to monitor the heme cofactor(s) in the HoxZ domain, surface enhanced infrared
absorption spectroscopy can be applied to monitor the [NiFe] active site in the HoxG of
immobilised MBH. In addition, further Raman and EPR spectroscopic investigations can be
performed to monitor and characterise the FeS clusters in the HoxK domain.

126

References (10)
127
10 References
[1] F. Siebert and P. Hildebrandt, Vibrational Spectroscopy in Life Sciences, WILEY-VCH,
Weinheim, 2008.
[2] D. H. Murgida and P. Hildebrandt, Acc. Chem. Res., 2004, 37, 854 – 861.
[3] D. H. Murgida and P. Hildebrandt, Phys. Chem. Chem. Phys., 2005, 7, 3773 – 3784.
[4] J. A. Sánchez-Gil and J. V. Garcia-Ramos, J. Chem. Phys., 1998, 108, 317.
[5] M. Sezer, R. Spricigo, T. Utesch, D. Millo, S. Leimkühler, M. A. Mroginski, U. Wollenberger,
P. Hildebrandt and I. M. Weidinger, Phys. Chem. Chem. Phys., 2010, 12, 7894 – 7903.
[6] K. A. Vincent, A. Parkin and F. Armstrong, Chem. Rev., 2007, 107, 4366 – 4413.
[7] D. H. Murgida and P. Hildebrandt, Angew. Chem. Int. Ed., 2001, 40, 728.
[8] M. Sezer, S. Frielingsdorf, D. Millo, N. Heidary, T. Utesch, M. A. Mroginski, B. Friedrich, P.
Hildebrandt, I. Zebger and Inez M. Weidinger, J. Phys. Chem. B, 2011, accepted.
DOI: 10.1021/jp204665r
[9] J. C. Love, L. A. Estroff, J. K. Kriebel, R. G. Nuzzo, G. M. Whitesides, Chem. Rev., 2005,
105, 1103–1170.
[10] M. Gouterman, ‘Optical spectra and electronic structure in porphyrins and related rings’ in
‘The Porphyrins’, pp 1 – 156, D. Dolphin (Ed.), Vol. III, part A, Academic Press, New York,
1979.
[11] J.-J. Feng, U. Gernert, M. Sezer, U. Kuhlmann, D. H. Murgida, C. David, M. Richter, A.
Knorr, P. Hildebrandt and I. M. Weidinger, Nano Lett., 2009, 9, 298 – 303.
[12] M. Sezer, J.-J. Feng, H. K. Ly, Y. Shen, T. Nakanishi, U. Kuhlmann, P. Hildebrandt, H.
Möhwald and I. M. Weidinger, Phys. Chem. Chem. Phys., 2010, 12, 9822 – 9829.
[13] M. S. Brody and R. Hille, Biochemistry, 1999, 38, 6668 – 6677.
[14] S. J. Elliott, A. E. McElhaney, C. Feng, J. H. Enemark and F. A. Armstrong, J. Am. Chem.
Soc., 2002, 124, 11612 – 11613.
[15] E. E. Ferapontova, T. Ruzgas and L. Gorton, Anal. Chem., 2003, 75, 4841 – 4850.
[16] I. Willner and E. Katz, Bioelectronics, Wiley-VCH, Weinheim, 2005.
[17] D. Chen, G. Wang and J. H. Li, J. Phys. Chem. C, 2007, 111, 2351.
[18] M. Ludwig, J. A. Cracknell, K. A. Vincent, F. A. Armstrong and O. Lenz, Journal of
Biological Chemistry, 2009, 284, 465 – 477.
[19] J. A. Cracknell, A. F. Wait, O. Lenz, B. Friedrich, F. A. Armstrong, P. Natl. Acad. Sci. USA,
2009, 106, 20681 – 20686.
[20] R. Cammack, M. Frey, R. Robson, Hydrogen As a Fuel: Learning From Nature, Taylor &
Francis, London, 2001.
[21] K. A. Vincent, J. A. Cracknell, O. Lenz, I. Zebger, B. Friedrich and F. A. Armstrong, P. Natl.
Acad. Sci. USA, 2005, 102, 16951 – 16954.

References (10)
128
[22] B. Bowien and H. G. Schlegel, Annu. Rev. Microbiol., 1981, 35, 405 – 452.
[23] M. Bernhard, B. Benelli, A. Hochkoeppler, D. Zannoni and B. Friedrich, European Journal
of Biochemistry, 1997, 248, 179 – 186.
[24] O. Lenz, M. Ludwig, T. Schubert, I. Bürstel, S. Ganskow, T. Goris, A. Schwarze and B.
Friedrich, CHEMPHYSCHEM, 2010, 11, 1107 – 1119.
[25] K. Knüttel, K. Schneider, A. Erkens, W. Plass, A. Muller, E. Bill and A. X. Trautwein,
Bulletin of the Polish Academy of Sciences-Chemistry, 1994, 42, 495 – 511.
[26] K. Schneider, D. S. Patil and R. Cammack, Biochimica et Biophysica Acta, 1983, 748, 353
– 361.
[27] N. Wisitruangsakul, O. Lenz, M. Ludwig, B. Friedrich, F. Lendzian, P. Hildebrandt and I.
Zebger, Angew. Chem. Int. Ed., 2009, 48, 611 – 613.
[28] M. Saggu, M. Ludwig, B. Friedrich, P. Hildebrandt, R. Bittl, F. Lendzian, O. Lenz and I.
Zebger, CHEMPHYSCHEM, 2010, 11, 1215 – 1224.
[29] The purification procedure was developed by Dr. Stefan Frielingsdorf at the Humboldt
University Berlin and will be published soon.
[30] S. J. George, S. Kurkin, R. N. F. Thorneley and S. P. J. Albracht, Biochemistry, 2004, 43,
6808 – 6819.
[31] S. Kurkin, S. J. George, R. N. F. Thorneley and S. P. J. Albracht, Biochemistry, 2004, 43,
6820 – 6831.
[32] E. B. Wilson, J. C. Decius, P.C. Cross, Molecular Vibrations: The Theory of Infrared and
Raman Vibrational Spectra, McGraw-Hill, New York, 1995.
[33] H. A. Kramers and W. Heisenberg, Z. Phys., 1925, 31, 681 – 708.
[34] P. A. M. Dirac, Proc. Roy. Soc. Lond. A, 1927, 114, 243 – 265.
[35] P. A. M. Dirac, Proc. Roy. Soc. Lond. A, 1927, 114, 710 – 728.
[36] G. Breit, Rev. Mod. Phys., 1932, 504–576.
[37] A. C. Albrecht, J. Chem. Phys., 1961, 34, 1476 – 1484.
[38] A. Warschel and P. Dauber, J. Chem. Phys., 1977, 66, 5477 – 5488.
[39] R. S. Czernuszewicz and T. G. Spiro, IR, Raman, and Resonance Raman
Spectroscopy, in Inorganic Electronic Structure and Spectroscopy, Vol. 1, John Wiley &
Sons, Inc, 1999.
[40] D. A. Long, The Raman Effect: A Unified Treatment of the Theory of Raman Scattering by
Molecules, John Wiley & Sons Ltd, 2002.
[41] H. Miyake, S. Ye and M. Osawa, Electrochem. Commun., 2002, 4, 973 – 977.
[42] Y. Hirai, H. Yabu, Y. Matsuo, K. Ijiro and M. Shimomura, Chem. Commun., 2010, 46, 2298 –
2300.
[43] P. Hildebrandt and M. Stockburger, J. Phys. Chem., 1984, 88, 5935 – 5944.
[44] S. J. Lee, Z. Guan, H. Xu and M. Moskovits, J. Phys. Chem. C, 2007, 111, 17985 – 17988.
[45] M. Moskovits, Rev. Mod. Phys., 1985, 57, 783 – 826.

References (10)
129
[46] D. K. Schwartz, Annu. Rev. Phys. Chem., 2001, 52, 107 – 137.
[47] P. E. Laibinis, G. M. Whitesides, D. L. Allara, Y. T. Tao, A. N. Parikh and R. G. Nuzzo, J. Am
Chem. Soc., 1991, 113, 7152 – 7167.
[48] R. A. Marcus, J. Chem. Phys., 1956, 24, 966 – 978.
[49] R. A. Marcus and N. Sutin, Biochimica et Biophysica Acta, 1985, 811, 265 – 322.
[50] J. Jortner, J. Chem. Phys., 1976, 63, 4358 – 4368.
[51] L. D. Zusman, Z. Phys. Chem., 1994, 186, 1.
[52] M. D. Newton, N. Sutin, 1984, Annu. Rev. Phys. Chem., 35, 437.
[53] E. Fermi, Nuclear Physics, University of Chicago Press, 1950.
[54] J. R. Bolton and M. D. Archer, Basic Electron-Transfer Theory, in Electron Transfer in
Inorganic, Organic, and Biological Systems, American Chemical Society, 1991.
[55] T. M. Nahir, R. A. Clark and E. F. Bowden, Anal. Chem., 1994, 66, 2595 – 2598.
[56] P. Hildebrandt and D. H. Murgida, Bioelectrochemistry, 2002, 55, 139 – 143.
[57] L. D. Zusman, Chem. Phys., 1980, 49, 295.
[58] E. Laviron, J. Electroanal. Chem., 1979, 101, 19 – 28.
[59] M. I. Promdromidis, A. B. Florou, S. M. Tzouwara-Karayanni and M. I. Karayannis,
Electroanalysis, 2000, 12, 1498 – 1501.
[60] R. Goldstein, Pockels Cell primer, in Laser Focus Magazine, 1968.
http://www.fastpulse.com/pdf/pcp.pdf
[61] Figure 3.4 is based on: http://www.raman.re.kr/technote/image/LabRam-HR.gif
[62] MATLAB is a product of Mathworks®.
[63] http://www.gnu.org/software/octave/
[64] H. Wackerbarth, U. Klar, W. Gunther and P. Hildebrandt, Appl. Spec., 1999, 53, 283 – 291.
[65] Scanning electron microscope images were recorded by Dipl.-Ing. Ulrich Gernert at the
‘Zentraleinrichtung Elektronenmikroskopie’ at the Technical University Berlin.
[66] A. L. De Lacey, V. M. Fernandez, M. Rousset and R. Cammack, Chem. Rev., 2007, 107,
4304 – 4330.
[67] A. Kranich, H. K. Ly, P. Hildebrandt and D. H. Murgida, J. Am. Chem. Soc., 2008, 130, 9844
– 9848.
[68] N. Wisitruangsakul, I. Zebger, H. K. Ly, D. H. Murgida, S. Ekgasit and P. Hildebrandt, Phys.
Chem. Chem. Phys., 2008, 10, 5276 – 5286.
[69] S. Döpner, P. Hildebrandt, A. G. Mauk, H. Lenk and W. Stempfle, Spectrochim Acta A, 1996,
51, 573 – 584.
[70] S. Oellerich, H. Wackerbarth and P. Hildebrandt, J. Phys. Chem. B, 2002, 106, 6566 –
6580.
[71] R. Hille, Chem. Rev., 1996, 96, 2757 – 2816.
[72] U. Wollenberger, R. Spricigo, S. Leimkühler and K. Schröder, Adv. Biochem. Eng.
Biotechnol., 2008, 109, 19 – 64.
References (10)
130
[73] C. Kisker, H. Schindelin, A. Pacheco, W. A. Wehbi, R. M. Garrett, K. V. Rajagopalan, J. H.
Enemark and D. C Rees, Cell, 1997, 91, 973 – 83.
[74] R. M. Garrett. J. L. Johnson, T. N. Graf, A. Feigenbaum and K. V. Rajagopalan, Proc. Natl.
Acad. Sci. USA, 1998, 95, 6394 – 6398.
[75] J. L. Johnson, Prenat Diagn, 2003, 23, 6 – 8.
[76] D. B. Menzel, D. A. Keller and K. H. Leung, Adv. Exp. Med. Biol., 1986, 197, 477 – 492.
[77] The homology model and structure representation was created by Tillmann Utesch. The
designations of representation modes (new cartoon and van der Waals, respectively) refer
to the terminology of the VMD software.
[78] R. Spricigo, C. Richter, S. Leimkühler, L. Gorton, F. W. Scheller and U. Wollenberger,
Colloids and Surfaces A: Physicochemical and Engineering Aspects, 2010, 354, 314 –
319.
[79] R. Spricigo, R. Dronov, F. Lisdat, S. Leimkühler, F. W. Scheller and U. Wollenberger, Anal.
Bioanal. Chem., 2009, 393, 225 – 233.
[80] R. Hille, Biochimica et Biophysica Acta, 1994, 1184, 143 – 169.
[81] R. C. Bray, S. Gutteridge, M. T. Lamy and T. Wilkinson, Biochem. J., 1983, 211, 227 – 236.
[82] H. L. Wilson and K. V. Rajagopalan, J. Biol. Chem., 2004, 279, 15105 – 15113.
[83] A. Pacheco, J. T. Hazzard, G. Tollin and J. H. Enemark, J. Biol. Inorg. Chem., 1999, 4,
390 – 401.
[84] C. Feng, R. V. Kedia, J. T. Hazzard, J. K. Hurley, G. Tollin and J. H. Enemark,
Biochemistry, 2002, 41, 5816 – 5821.
[85] T. F. Chichester DF, (1972). Sulfur Dioxides and Sulfites. Handbook of Food Additives.
[86] M. A. Joslyn and J. B. Braverman, Adv. Food Res., 1954, 5, 97 – 160.
[87] R. Walker, Food Addit. Contam., 1985, 2, 5 – 24.
[88] D. D. Stevenson and R. A. Simon, Journal of Allergy and Clinical Immunology, 1981, 68, 26
– 32.
[89] W. H. Yang and E. C. R. Purchase, Canadian Medical Association Journal, 1985, 133, 865
– 867.
[90] M. Stephenson and L. H. Stickland, Biochem J., 1931, 25, 205 – 214.
[91] P. M. Vignais and A. Colbeau, Curr. Issues Mol. Biol., 2004, 6, 159 – 188.
[92] P. M. Vignais and B. Billoud, Chem. Rev., 2007, 107, 4206 – 4272.
[93] R. K. Thauer, A.-K. Kaster, H. Seedorf, W. Buckel and R. Hedderich, Nat. Rev. Microbiol.,
2008, 6, 579 – 591.
[94] R. K. Thauer, A.-K. Kaster, M. Goenrich, M. Schick, T. Hiromoto and S. Shima, Annu. Rev.
Biochem., 2010, 79, 507 – 536.
[95] J. A. Cracknell, K. A. Vincent and F. A. Armstrong, Chem. Rev., 2008, 108, 2439 – 2461.
[96] H. Krassen, A. Schwarze, B. Friedrich, K. Ataka, O. Lenz and J. Heberle, ACS Nano, 2009,
3, 4055 – 4061.
References (10)
131
[97] K. A. Vincent, A. Parkin, O. Lenz, S. P. J. Albracht, J. C. Fontecilla-Camps, R. Cammack, B.
Friedrich and F. A. Armstrong, J. Am. Chem. Soc., 2005, 127, 18179 – 18189.
[98] M. W. W. Adams, Biochimica et Biophysica Acta, 1990, 1020, 115 – 145.
[99] R. Cammack, V. M. Fernandez and K. Schneider, Biochimie, 1986, 68, 85 – 91.
[100] S. Shima and R. K. Thauer, Chem. Rec., 2007, 7, 37 – 46.
[101] P. M. Vignais, B. Billoud and J. Meyer, FEMS Microbiol. Rev., 2001, 25, 455 – 501.
[102] M. Saggu, I. Zebger, M. Ludwig, O. Lenz, B. Friedrich, P. Hildebrandt and F. Lendzian, J.
Biol. Chem., 2009, 284, 16264 – 16276.
[103] T. Goris, A. F. Wait, M. Saggu, J. Fritsch, N. Heidary, M. Stein, I. Zebger, F. Lendzian, F. A.
Armstrong, B. Friedrich and O. Lenz, Nat. Chem. Biol., 2011, 7, 310 – 318.
[104] A. Volbeda, M. H. Charon, C. Piras, E. C. Hatchikian, M. Frey and J. C. Fontecilla-Camps,
Nature, 1995, 373, 580 – 587.
[105] P.-P. Liebgott, S. Dementin, C. Léger and M. Rousset, Energy Environ. Sci., 2011, 4, 33 –
41.
[106] M. Jormakka, S. Törnroth, B. Byrne and S. Iwata, Science, 2002, 295, 1863 – 1868.
[107] B. C. Berks, M. D. Page, D. J. Richardson, A. Reilly, A. Cavill, F. Outen and S. J. Ferguson,
Mol. Microbiol., 1995, 15, 319 – 331.
[108] M. Teixeira, I. Moura, A. V. Xavier, J. J. Moura, J. LeGall, D. V. DerVartanian, H. D. Peck, Jr.
and B. H. Huynh, J. Biol. Chem., 1989, 264, 16435 – 16450.
[109] F. Germer, I. Zebger, M. Saggu, F. Lendzian, R. Schulz and J. Appel, J. Biol. Chem., 2009,
284, 36462 – 36472.
[110] M. J. Maroney and P. A. Bryngelson, J. Biol. Inor. Chem., 2001, 6, 453 – 459.
[111] M. Van Gastel, Appl. Magn. Reson., 2010, 37, 207 – 218.
[112] D. Millo, M. E. Pandelia, T. Utesch, N. Wisitruangsakul, M. A. Mroginski, W. Lubitz, P.
Hildebrandt and I. Zebger, J. Phys. Chem. B, 2009, 113, 15344 – 15351.
[113] M.-E. Pandelia, H. Ogata and W. Lubitz, ChemPhysChem, 2010, 11, 1127 – 1140.
[114] W. Lubitz, E. Reijerse and M. van Gastel, Chem. Rev., 2007, 107, 4331 – 4365.
[115] V. M. Fernandez, K. K. Rao, M. A. Fernandez and R. Cammack, Biochimie, 1986, 68, 43 –
48.
[116] A. Volbeda and J. C. Fonticella Camps, Dalton Trans., 2003, 4030 – 4038.
[117] J. E. Huyett, M. Carepo, A. Pamplona, R. Franco, I. Moura, J. J. G. Moura and B. M.
Hoffman, J. Am. Chem. Soc., 1997, 119, 9291 – 9292.
[118] J. J. G. Moura, M. Teixeira, I. Moura, J. Le Gall, The Bioinorganic Chemistry of Nickel, Ed.:
J. R. J. Lancaster, Wiley & Sons, 1988, p. 191.
[119] V. M. Fernandez, E. C. Hatchikian and Richard Cammack, Biochimica et Biophysica Acta,
1985, 832, 69 – 79.
[120] A. G. Agrawal, M. van Gastel, W. Gärtner and W. Lubitz, J. Phys. Chem. B, 2006, 110, 8142
– 8150.
References (10)
132
[121] M. Brecht, M. van Gastel, T. Buhrke, B. Friedrich, W. Lubitz, J. Am. Chem. Soc., 2003, 125,
13075 – 13083.
[122] S. Foerster, M. van Gastel, M. Brecht and W. Lubitz, J. Biol. Inorg. Chem., 2005, 10, 51 −
62.
[123] H. Beinert, FASEB J., 1990, 4, 2483 – 2491.
[124] D. C. Johnson, D. R. Dean, A. D. Smith and M. K. Johnson, Annu. Rev. Biochem, 2005, 74,
247 – 81.
[125] M. E. Abdelsalam, S. Mahajan, P. N. Bartlett, J. J. Baumberg and A. E. Russell, J. Am.
Chem. Soc., 2007, 129, 7399 – 7406.
[126] M. F. Mrozek, Y. Xie and M. J. Weaver, Anal. Chem., 2001, 73, 5953 – 5960.
[127] Z.-Q. Tian, Z.-L. Yang, B. Ren, J.-F. Li, Y. Zhang, X.-F. Lin, J.-W. Hu and D.-Y. Wu, Faraday
Discuss., 2006, 132, 159 – 170.
[128] P. L. Stiles, J. A. Dieringer, N. C. Shah, and R. P. Van Duyne, Annu. Rev. Anal. Chem.,
2008, 1, 601 – 626.
[129] S. Pande, S. K. Ghosh, S. Praharaj, S. Panigrahi, S. Basu, S. Jana, A. Pal, T. Tsukuda and
T. Pal, J. Phys. Chem. C, 2007, 111, 10806 – 10813.
[130] G. Maduraiveeran and R. Ramaraj, Anal. Chem., 2009, 81, 7552 – 7560.
[131] S. Park, P. Yang, P. Corredor and M. J. Weaver, J. Am. Chem. Soc., 2002, 124, 2428 –
2429.
[132] J.-J. Feng, U. Gernert, P. Hildebrandt and Inez M. Weidinger, Adv. Funct. Mater., 2010, 20,
1954 – 1961.
[133] C. David, M. Richter, A. Knorr, I. M. Weidinger and P. Hildebrandt, J. Chem. Phys., 2010,
132, 024712.
[134] S. Zou and M. J. Weaver, Anal. Chem., 1998, 70, 2387 – 2395.
[135] L. Qin, S. Zou, C. Xue, A. Atkinson, G. C. Schatz and C. A. Mirkin, Proc. Natl. Acad. Sci.
USA, 2006, 103, 13300 – 13303.
[136] L. He, E. A. Smith, M. J. Natan and C. D. Keating, J. Phys. Chem. B, 2004, 108, 10973 –
10980.
[137] M. F. Mrozek, Y. Xie and M. J. Weaver, Anal. Chem., 2001, 73, 5953 – 5960.
[138] R. A. Marcus, J. Chem. Phys., 1965, 43, 679 – 701.
[139] a) P. G. Etchegoin, E. C. Le Ru and M. Meyer, J. Chem. Phys., 2006, 125, 164705. b) P. G.
Etchegoin, E. C. Le Ru and M. Meyer, J. Chem. Phys., 2007, 127, 189901.
[140] P. B. Johnson and R. W. Christy, Phys. Rev. B, 1972, 6, 4370 – 4379.
[141] M. Guiral, P. Tron, V. Belle, C. Aubert, C. Léger, B. Guigliarelli and M.-T. Giudici-Orticoni,
International Journal of Hydrogen Energy, 2006, 31, 1424 – 1431.
[142] M.-E. Pandelia, V. Fourmond, P. Tron-Infossi, E. Lojou, P. Bertrand, C. Léger, M.-T. Giudici-
Orticoni and W. Lubitz, J. Am. Chem. Soc., 2010, 132, 6991 – 7004.
[143] M.-E. Pandelia, W. Nitschke, P. Infossi, M.-T. Giudici-Orticoni, E. Bill and W. Lubitz, Proc.

References (10)
133
Natl. Acad. Sci. USA, 2011, 108, 6097 – 6102.
[144] H. Munakata, D. Oyamatsu and S. Kuwabata, Langmuir, 2004, 20, 10123 – 10128.
[145] K. Shimazu, T. Teranishi, K. Sugihara and K. Uosaki, Chem. Lett., 1998, 27, 669 – 670.
[146] K. Sugihara and K. Shimazu, Langmuir, 2000, 16, 7101 – 7105.
[147] E. W. van der Vegte and G. Hadziioannou, J. Phys. Chem. B, 1997, 101, 9563 – 9569.
[148] D. V. Vezenov, A. Noy, L. F. Rozsnyai and C. M. Lieber, J. Am. Chem. Soc., 1997, 119,
2006 – 2015.
[149] T. Kakiuchi, M. Iida,S. Imabayashi and K. Niki, Langmuir, 2000, 16, 5397 – 5401.
[150] M. L. Wallwork, D. A. Smith, Jin Zhang, Jennifer Kirkham, and Colin Robinson, Langmuir,
2001, 17, 1126 – 1131.
[151] S. Trasatti and O. A. Petrii, J. Electroanal. Chem., 1992, 327, 353 – 376.
[152] G. Jarzqbek and Z. Borkowska, Electrochim. Acta, 1997, 42, 2915 – 2918.
[153] D. Millo, A. Ranieri, P. Gross, H. K. Ly, M. Borsari, P. Hildebrandt, G. J. L. Wuite, C. Gooijer
and G. van der Zwan, J. Phys. Chem. C, 2009, 113, 2861 – 2866.
[154] D. Millo, A. Bonifacio, M. R. Moncelli, V. Sergo, C. Gooijer and G. van der Zwan, Colloid
Surface B, 2010, 81, 212 – 216.
[155] J. T. Hupp, D. Larkin and M. J. Weaver, Surf. Sci., 1983, 125, 429 – 451.
[156] G. Smulevich and T. G. Spiro, J. Phys. Chem., 1985, 89, 5168 – 5173.
[157] J. J. Griese, R. P. Jakob, S. Schwarzinger and H. Dobbek, J. Mol. Biol., 2006, 361, 140 –
152.
[158] S. Fetzner, Appl. Microbiol. Biotechnol., 1998, 49, 237 – 250.
[159] O. Spiegelhauer, F. Dickert, S. Mende, D. Niks, R. Hille, M. Ullmann and H. Dobbek,
Biochemistry, 2009, 48, 11412 – 11420.
[160] W. D. Bowman and T. G. Spiro, Biochemistry, 1981, 20, 3313 – 3318.
[161] N. S. Lee, R. Sheng, M. D. Morris and L. M. Schopfer, J. Am. Chem. Soc., 1986, 108, 6179
– 6183.
[162] R. A. Copeland, S. P. A. Fodor and T. G. Spiro, J. Am. Chem. Soc., 1984, 106, 3872 – 3874.
[163] N. S. Lee, Y. Z. Hsieh, M. D. Morris and L. M. Schopfer, J. Am. Chem. Soc., 1987, 109,
1358 – 1363.
[164] Calculations were performed by Tillmann Utesch.
[165] P. A. O’Farrell, M. A. Walsh, A. A. McCarthy, T. M. Higgins, G. Voordouw and Stephen G.
Mayhew, Biochemistry, 1998, 37, 8405 – 8416.
[166] C. Niederau, L. D. Ferrell and J. H. Grendell, Gastroenterology, 1985, 88, 1192 – 1204.
[167] X. Liu, C. N. Kim, J. Yang, R. Jemmerson and X. Wang, Cell, 86, 147 – 157.
[168] X. Jiang and X. Wang, Annu. Rev. Biochem., 2004, 73, 87 – 106.
[169] V. E. Kagan, V. A. Tyurin, J. Jiang, Y. Y. Tyurina, V. B. Ritov, A. A. Amoscato, A. N. Osipov,
N. A. Belikova, A. A. Kapralov, V. Kini, I. I. Vlasova, Q. Zhao, M. Zou, P. Di, D. A.
Svistunenko, I. V. Kurnikov and G. G. Borisenko, Nat. Chem. Biol., 2005, 1, 223 – 232.

References (10)
134
[170] N. A. Belikova, Y. A. Vladimirov, A. N. Osipov, A. A. Kapralov, V. A. Tyurin, M. V. Potapovich,
L. V. Basova, J. Peterson, I. V. Kurnikov and V. E. Kagan, Biochemistry, 2006, 45, 4998 –
5009.
[171] L. V. Basova, I. V. Kurnikov, L. Wang, V. B. Ritov, N. A. Belikova, I. I. Vlasova, A. A.
Pacheco, D. E. Winnica, J. Peterson, H. Bayir, D. H. Waldeck and V. E. Kagan,
Biochemistry, 2007, 46, 3423 – 3434.
[172] P. Hildebrandt and M. Stockburger, Biochemistry, 1989, 28, 6710 – 6721.
[173] P. Hildebrandt and M. Stockburger, Biochemistry, 1989, 28, 6722 – 6728.
[174] S. Berezhna, H. Wohlrab and P. M. Champion, Biochemistry, 2003, 42, 6149 – 6158.
[175] Y. Gu, P. Li, J. T. Sage and P. M. Champion, J. Am. Chem. Soc., 1993, 115, 4993 – 5004.
[176] K. L. Davis, B. J. Drews, Hongjun Yue, D. H. Waldeck, K. Knorr and R. A. Clark, J. Phys.
Chem. C, 2008, 112, 6571 – 6576.
[177] K. L. Davis and D. H. Waldeck, J. Phys. Chem. B, 2008, 112, 12498 – 12507.
[178] A. El Kasmi, J. M. Wallace, E. F. Bowden, S. M. Binet and R. J. Linderman, J. Am. Chem.
Soc., 1998, 120, 225 – 226.
[179] J. Petrović, R. Clark, H. Yue, D. H. Waldeck and E. D. F. Bowden, Langmuir, 2005, 21,
6308 – 6313.
[180] T. M. Nahir and E. F. Bowden, J. Electroanal. Chem., 1996, 410, 9 – 13.
[181] E. J. Zeman and G. C. Schatz, J. Phys. Chem., 1987, 91, 634 – 643.
[182] S. Link and M. A. El-Sayed, J. Phys. Chem. B, 1999, 103, 8410 – 8426.
[183] K. L. Kelly, E. Coronado, L. L. Zhao and G. C. Schatz, J. Phys. Chem. B, 2003, 107, 668 –
677.
[184] A. Sivanesan, H. K. Ly, J. Kozuch, M. Sezer, U. Kuhlmann, A. Fischer and I. M. Weidinger,
Chem. Commun., 2011, 47, 3553 – 3555.
[185] S. Hu, I. K. Morris, J. P. Singh, K. M. Smith and T. G. Spiro, J. Am. Chem. Soc., 1993, 115,
12446 – 12458.
[186] W. A. Eaton and R. M. Hochstrasser, J. Chem. Phys., 1967, 46, 2533.
[187] Z.-Q. Tian, B. Ren and D.-Y. Wu, J. Phys. Chem. B, 2002, 106, 9463 – 9483.
[188] R. G. Freeman, K. C. Grabar, K. J. Allison, R. M. Bright, J. A. Davis, A. P. Guthrie, M. B.
Hommer, M. A. Jackson, P. C. Smith, D. G. Walter and M. J. Natan, Science, 1995, 267,
1629 – 1632.
[189] C. J. Kramer, Essentials of Computational Chemistry, 2nd Ed., John Wiley & Sons, Ltd, West
Sussex, England, 2004.
[190] C. E. D. Chidsey, Science, 1991, 257, 919 – 922.
[191] H. K. Ly, N. Wisitruangsakul, M. Sezer, J.-J. Feng, A. Kranich, I. M. Weidinger, I. Zebger, D.
H. Murgida and P. Hildebrandt, J. Electroanal. Chem., 2010, in Press.
[192] D. H. Murgida and P. Hildebrandt, J. Phys. Chem. B, 2002, 106, 12814 – 12819.
[193] P. Ramírez, R. Andreu, Á. Cuesta, C. J. Calzado and J. J. Calvente, Anal. Chem., 2007, 79,

References (10)
135
6473 – 6479.
[194] D. H. Murgida and P. Hildebrandt, J. Phys. Chem. B, 2001, 105, 1578 – 1586.
[195] S. Trasatti, in H. Gerischer and Ch. W. Tobias (Eds.), Advances in Electrochemistry and
Electrochemical Engineering, Vol. 10, 1977, p. 213.
[196] A. Hamelin, L. Stoicoviciu, L. Doubova and S. Trasatti, Surf. Sci., 1988, 201, L498 – L506.
[197] F. Lemberg and J. Barrett, Cytochromes, ACADEMIC PRESS INC. (LONDON) LTD, 1973.
[198] H. K. Ly, M. Sezer, N. Wisitruangsakul, J.-J. Feng, A. Kranich, D. Millo, I. M. Weidinger, I.
Zebger, D. H. Murgida and P. Hildebrandt, FEBS J., 2011, 278, 1382 – 1390.
[199] J.-J. Feng, D. H. Murgida, U. Kuhlmann, T. Utesch, M. A. Mroginski, P. Hildebrandt and I. M.
Weidinger, J. Phys. Chem. B, 2008, 112, 15202 – 15211.
[200] H. A. Heering, F. G. M. Wiertz, C. Dekker and S. de Vries, J. Am. Chem. Soc., 2004, 126,
11103 – 11112.
[201] J. Xu and E. F. Bowden, J. Am. Chem. Soc., 2006, 128, 6813 – 6822.
[202] R. Hille, J. Rétey, U. Bartlewski-Hof, W. Reichenbecher and B. Schink, FEMS Microbiol.
Rev., 1999, 22, 489 – 501.

136

List of Publications (11)
137
11 List of Publications
Articles in Scientific Journals
M. Sezer, J. J. Feng, H. K. Ly, Y. Shen, T. Nakanishi, U. Kuhlmann, H. Möhwald, P. Hildebrandt, I.
M. Weidinger, „Multi-layer electron transfer across nanostructured Ag-SAM-Au-SAM junctions
probed by surface enhanced Raman spectroscopy”, Phys. Chem. Chem. Phys., 2010, 12, 9822 –
9829.
M. Sezer, R. Spricigo, T. Utesch, D. Millo, S. Leimkuehler, M. A. Mroginski, U. Wollenberger, P.
Hildebrandt, I. M. Weidinger, „Redox properties and catalytic activity of surface-bound human
sulfite oxidase studied by a combined surface enhanced resonance Raman spectroscopic and
electrochemical approach“, Phys. Chem. Chem. Phys., 2010, 12, 7894 – 7903.
M. Sezer, D. Millo, R. Spricigo, U. Wollenberger, T. Utesch, M. A. Mroginski, P. Hildebrandt, I. M.
Weidinger, „A Combined SERR Spectroscopic And Electrochemical Approach To Study Enzymes
On Electrodes”, XXII INTERNATIONAL CONFERENCE ON RAMAN SPECTROSCOPY. AIP
Conference Proceedings, 2010, 1267, 1033 – 1034.
M. Sezer, S. Frielingsdorf, D. Millo, I. Zebger, T. Utesch, M. A. Mroginski, N. Heidary, B. Friedrich,
P. Hildebrandt, I. M. Weidinger, „Role of the HoxZ subunit in the electron transfer pathway of the
membrane-bound [NiFe]-hydrogenase from Ralstonia eutropha H16 immobilized on electrodes”, J.
Phys. Chem. B., 2011, accepted.
I. M. Weidinger, J. J. Feng, M. Sezer, U. Kuhlmann, D. H. Murgida, P. Hildebrandt, „Electron
transfer dynamics of cytochrome c immobilised on coated silver and silver-gold hybrid electrodes
studied by SERR spectroscopy“, Proc. XXIst Int. Conf. Raman Spectrosc., 2008, IM Pub.,
Chichester, 358 – 359.
J. J. Feng, U. Gernert, M. Sezer, U. Kuhlmann, D. H. Murgida, C. David, M. Richter, A. Knorr, P.
Hildebrandt, I. M. Weidinger, „A Novel Au-Ag hybrid device for surface enhanced (resonance)
Raman spectroscopy”, Nano Lett. 2009, 9, 298-303.

List of Publications (11)
138
I. M. Weidinger, J. J. Feng, M. Sezer, H.K. Ly, U. Kuhlmann, P. Hildebrandt, „Electron transfer
Dynamics of cytochrome c on novel nanostructured Au-Ag supports probed by surface enhanced
Raman spectroscopy“, J. Biol. Inorg. Chem., 2009, 14 (Suppl.1), 95.
H. K. Ly, N. Wisitruangsakul, M. Sezer, J.-J. Feng, A. Kranich, I. M. Weidinger, I. Zebger, D. H.
Murgida, P. Hildebrandt, „Electric-field effects on the interfacial electron transfer and protein
dynamics of cytochrome c”, J. Electroanal. Chem., 2010, in Press.
A. Sivanesan, H. K. Ly, J. Kozuch, M. Sezer, U. Kuhlmann, A. Fischer and I. M. Weidinger,
„Functionalized Ag nanoparticles with tunable optical properties for selective protein analysis”,
Chem. Commun., 2011, 47, 3553 – 3555.
H. K. Ly, M. Sezer, N. Wisitruangsakul, J.-J. Feng, A. Kranich, D. Millo, I. M. Weidinger, I. Zebger,
D. H. Murgida and P. Hildebrandt, „Surface-Enhanced vibrational spectroscopy for probing
transient interactions of proteins with biomimetic interfaces: electric field effects on structure,
dynamics and function of cytochrome c”, FEBS J., 2011, 278, 1382 – 1390.
Book Chapters
P. Hildebrandt, J. J. Feng, A. Kranich, H. K. Ly, M. Martí, D.F. Martín, D. H. Murgida, D. A. Paggi,
M. Sezer, N. Wisitruangsakul, I. M. Weidinger, I. Zebger, „Electron transfer of proteins at
membrane models”, in Surface Enhanced Raman Spectroscopy – Analytical, Biophysical and Life
Science Applications (Schlücker, S., Ed.), Wiley-VCH, 2010.
Oral Presentations
Sep 19, 2008
oral presentation at the Institute for Technology, Biology and Chemistry (ITQB) in Oeiras, Portugal:
"Gated electron transfer of iso-1-cytochrome c from yeast"
Nov 23, 2009
oral presentation at the Workshop on Bioanalysis 2009, Luckenwalde, Germany: "Combined
electrochemical and SERR-spectroscopic study of human Sulfite Oxidase"
List of Publications (11)
139
Poster Presentations
Sep 2008
poster presentation at the German Biophysical Society Meeting, Berlin, Germany: "Electron
transfer dynamics of cytochrome c on coated electrodes measured with SERR spectroscopy"
Aug 2009
poster presentation at the European Conference on the Spectroscopy of Biomolecules, Palermo,
Italy: "Combined surface enhanced resonance Raman spectroscopic and electrochemical study of
human Sulfite Oxidase"
Aug 2010
poster presentation at the International Conference on Raman spectroscopy (ICORS), Boston,
USA: "A Combined SERR Spectroscopic And Electrochemical Approach To Study Enzymes On
Electrodes"

140

141
Danksagung
Ich möchte mich vor allem bei zwei Personen bedanken,
- bei meinem Doktorvater Prof. Dr. Peter Hildebrandt, der mir diese Promotion und
somit eine sehr spannende und lehrreiche Zeit meines Lebens ermöglicht hat,
- und bei Dr. Inez Weidinger, die stets ein offenes Ohr für mich hatte, mich intensiv
unterstützt hat und einen sehr großen Anteil am Erfolg dieser Arbeit trägt.
Außerdem danke ich
- meinem Kollegen Dr. Diego Millo für die produktive Zusammenarbeit, Unterstützung
in unzähligen wissenschaftlichen Fragen und für die Leitung der ‚Hilde-Band’,
- Tillmann Utesch für ergänzende computergestützte Studien,
- Dr. Ingo Zebger für die tolle Zusammenarbeit und viele anregende Diskussionen,
- Dipl.-Ing. Ulrich Gernert für Messungen am Rasterelektronenmikroskop,
- ganz herzlich meinem alten Weggefährten Khoa Ly und den weiteren Kollegen Sara
Bruun, Dr. Jiu-Ju Feng, Jacek Kozuh, Nina Heidary, Marius Horch, Philipp
Hummel, Wiebke Meister, Yvonne Rippers, Johannes Salewski, Elisabeth
Siebert, Dr. Arumugam Sivanesan und Francisco Velazquez Escobar, die alle auf
ihre Art wunderbar sind und mich wissenschaftlich, menschlich und musikalisch (!)
sehr bereichert haben,
- Dr. Uwe Kuhlmann und Lars Paasche für geduldige und kompetente Unterstützung
in vielen technischen Fragen,
- Marina Böttcher, Jürgen Krauss, Norbert Michael, Prof. Dr. Maria Andrea
Mroginski, Dr. Hendrik Naumann, Dr. Miguel Saggu, Claudia Schulz, Dr. David
von Stetten, die alle auf die eine oder andere Weise Anteil am Gelingen dieser Arbeit
hatten, Dr. Steve Kaminski, Gal Schkolnik und allen weiteren Mitgliedern des
MVL für eine nette Arbeitsatmosphäre,
- meinen Kooperationspartnern vom Max-Planck-Institut für Kolloid- und Grenzflächen-
forschung Prof. Dr. Helmuth Möhwald, Yanfei Shen und Takashi Nakanishi,
- meinen Kooperationspartnern an der Universität Potsdam Dr. Roberto Spricigo,
Prof. Dr. Silke Leimkühler und Prof. Dr. Ulla Wollenberger,
- meinen Kooperationspartnern aus der Humboldt Universität Berlin Dr. Stefan
Frielingsdorf und Prof. Dr. Bärbel Friedrich,
- den Arbeitskreisen von Prof. Dr. Holger Dobbek und Prof. Dr. Walter Halangk für
die Bereitstellung von Proben.

142
Ich möchte mich an dieser Stelle auch ganz herzlich bei Franziska und allen weiteren
Freunden bedanken, die hier nicht aufgelistet sind.
Natürlich danke ich auch meiner Familie, und zwar auf Türkisch:
Beni her zaman destekleyen aileme çok teşekkür ediyorum. Özellikle annem Yüksel, babam
Şevki, vede abilerim Alper ve Sadettin’e çok teşekkür ediyorum. Yenlerim Emre ve Cihan’ı
gözlerinden öpüyorum.
Vielen Dank.
☺