Spectral shape parameters in storm events from different ... · «Bilde eller tekstur» og deretter...
34
Spectral shape parameters in storm events from different data sources Anne Karin Magnusson (MET Norway) [email protected] Elzbieta Bitner-Gregersen (DNV-GL) [email protected]
Transcript of Spectral shape parameters in storm events from different ... · «Bilde eller tekstur» og deretter...

Utskifting av
bakgrunnsbilde:
- Høyreklikk på
lysbildet og velg
«Formater
bakgrunn»
- Under «Fyll», velg
«Bilde eller tekstur»
og deretter «Fil…»
- Velg ønsket
bakgrunnsbilde og
klikk «Åpne»
- Avslutt med å velge
«Lukk»
Spectral shape parameters in storm
events from different data sources
Anne Karin Magnusson (MET Norway) [email protected]
Elzbieta Bitner-Gregersen (DNV-GL) [email protected]

Norwegian Meteorological Institute
Motivation
The shape of the wave spectrum with associated gamma
parameter is of significant importance in assessment of
loads and responses of ships and offshore structures.
occurrence of abnormal waves, also called freak or rogue
waves.
Behaviour of wave power systems
There are uncertainties related to estimation of the peakedness
parameter (gamma / γ ) when different sources of wave data
are used (models and observed).
How do recommendations in engineering compare with
observed and hindcasted data?
Spectral Shape parameters in storm events, AKM & EBG, 9. November 2015 2

Norwegian Meteorological Institute
Conclusions
NORA10 gamma values peak at around 3, seldomly when Hs is
at max, but that can be a consequence of retrieving data from
outside field of extremes (peak of very severe storms are
constrained, and there is large gradients in the field)
MIROS radar gives alike peakedness values as NORA10,
though slightly higher.
Other wave sensors (buoys, downlooking lasers –> In-situ
measurements!) give twice as high gamma values.
Gamma as retrieved from fitting J-spec to measured or
modelled spectra seems to have a close to linear dependence
on wave peak steepness (when the wave energy has one
peak).
Spectral Shape parameters in storm events, AKM & EBG, 9. November 2015 3
Norwegian Meteorological Institute
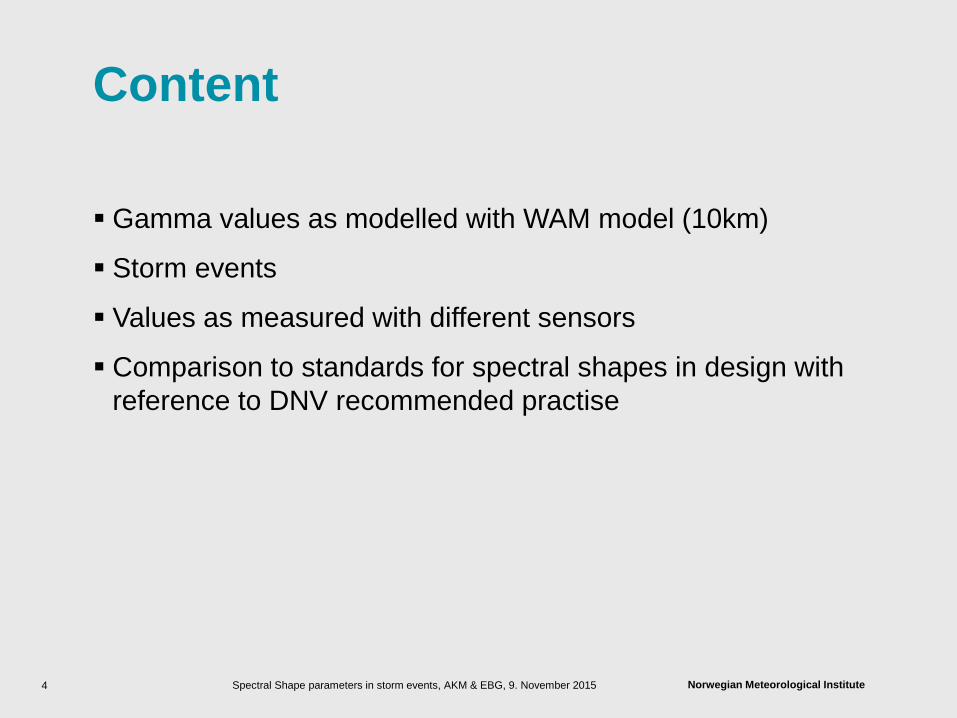
Content
Gamma values as modelled with WAM model (10km)
Storm events
Values as measured with different sensors
Comparison to standards for spectral shapes in design with
reference to DNV recommended practise
Spectral Shape parameters in storm events, AKM & EBG, 9. November 2015 4

Norwegian Meteorological Institute 5
Spectral shapes commonly used
in the marine industry
Shipping industry: For design: Pierson Moskowitz spectrum (1964) , (JONSWAP spectrum with γ=1.0).
For ship operations: The JONSWAP (1973) and Torsethaugen (1996) are starting to be used
Offshore industry:
For design and operations: JONSWAP(1973), Torsethaugen (1996)(double peaked).
2
2 2
4 ( )exp
22 4 5 5( ) (2 ) exp
4
m
m
f f
f
JON
m
fE f g f
f
Spectral Shape parameters in storm events, AKM & EBG, 9. November 2015
Norwegian Meteorological Institute 6
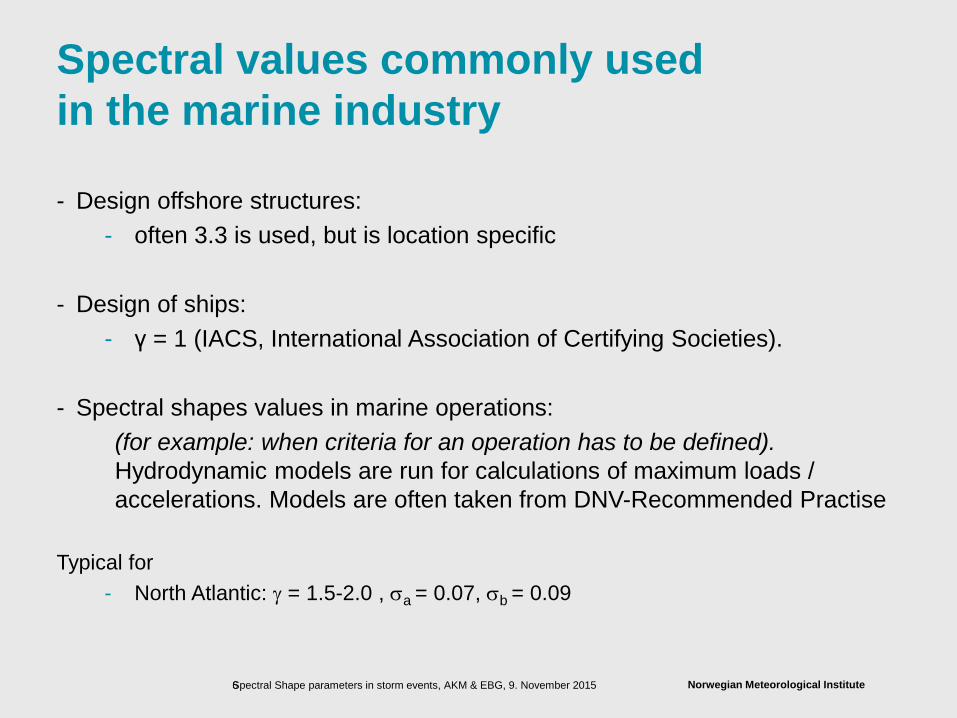
Spectral values commonly used
in the marine industry
- Design offshore structures:
- often 3.3 is used, but is location specific
- Design of ships:
- γ = 1 (IACS, International Association of Certifying Societies).
- Spectral shapes values in marine operations:
(for example: when criteria for an operation has to be defined).
Hydrodynamic models are run for calculations of maximum loads /
accelerations. Models are often taken from DNV-Recommended Practise
Typical for
- North Atlantic: = 1.5-2.0 , a = 0.07, b = 0.09
Spectral Shape parameters in storm events, AKM & EBG, 9. November 2015

Norwegian Meteorological Institute
Recommended Practice,
the legacy DNV-RP-C205, April 2014
Spectral Shape parameters in storm events, AKM & EBG, 9. November 2015 7

Norwegian Meteorological Institute
Recommended Practice
the legacy DNV-RP-C205, April 2014
Spectral Shape parameters in storm events, AKM & EBG, 9. November 2015 8
Gran, Sverre (1992). A Course in Ocean
Engineering. Book, Series Development in
Marine Technology 8, Published by
Elsevier.

Norwegian Meteorological Institute
Data used in the analysis
Hindcast data from NORA10 - WAM grid 10 km with BC from a 50km
model run with ERA40 winds
- Winds from Atmospheric model HIRLAM
10km with BC from ERA40
- Sept 1957 to 2015
- Stored:
· at all grid points, Δt=3 hours:
Parameters: Wind, Hs,Tp, TM02,
DDp, DDm (total sea, wind sea and
swell)
· at some grid points: wave spectra
(Δdeg=15°, 36 freq, Δt=3 hours)
Measured data (limited to North
Sea and Norwegian Sea )
Buoys
Marine radars (WAMOS)
MIROS doppler radars
Downlooking radars
Saab radars
MIROS Range Finder (MRF)
Optech lasers
Spectral Shape parameters in storm events, AKM & EBG, 9. November 2015 9

Norwegian Meteorological Institute
Observations stored at MET Norway
Spectral Shape parameters in storm events, AKM & EBG, 9. November 2015 10

Norwegian Meteorological Institute
Calculation og ‘Gamma peakedness’
Spectral Shape parameters in storm events, AKM & EBG, 9. November 2015
Using ‘anpass.f’ (courtesy of Heinz Günther, program originally used for analysing the JONSWAP data).
Required input: E(f) with 129 frequencies, and Δf = konstant
E(f) from models and observations are interpolated with ‘spline’ function in matlab f=[0.03-0.5 Hz].
(MIROS data in [0.03-0.3 Hz])
The program iterates a number of times to try to fit a J-spec with different values of α, , a and b
As expected not all (1D) spectra fit J-spec
11

Norwegian Meteorological Institute
Calculation og ‘Gamma peakedness’
Spectral Shape parameters in storm events, AKM & EBG, 9. November 2015 12
Ef(Jonswap) in blue
is resulting from J-
equation with
parameters resulting
from ‘anpass.f’ :
α = 0.017
= 2.98
a = 0.25
b = 0.073

Norwegian Meteorological Institute
Distribution of Hs vs Tp at Ekofisk (work presented in EXTREME SEAS meeting in Berlin, March 2011)
Spectral Shape parameters in storm events, AKM & EBG, 9. November 2015 13
All cases 2000-2008 45.6% of cases,
Jonswap shapes and Sp>0.01

Norwegian Meteorological Institute
NORA 10 data, vs Sp
· 36.1% of cases at Ekofisk
have Jonswap-similar shape
with Sp>0.02.
How does hindcast,
measurements and the
industrial standards
compare?
Spectral Shape parameters in storm events, AKM & EBG, 9. November 2015 14

Norwegian Meteorological Institute
Observations compared to model ? Ekofisk, Waverider in 20 storms 2007-2008
NORA10 Hs-Tp in Jspec shapes 2000-2008
Spectral Shape parameters in storm events, AKM & EBG, 9. November 2015 15
Waverider Hs-Tp dist.
0-1
5m

Norwegian Meteorological Institute
Gamma vs Sp
NORA10 and Waverider
NORA10 Waverider observations
during one severe storm
The black line shows how model values are distributed, and blue line how
gamma from Waverider spectra in one storm are vs Sp. observed
spectra have much higher gamma values.
Spectral Shape parameters in storm events, AKM & EBG, 9. November 2015 16

Norwegian Meteorological Institute
Gamma vs Sp
Three different sensors in one severe storm
Measured are
higher than
model
But: At what time
scale do extreme
events occure?
10, 30 or 60
minutes?
15 7
15 15
Waverider Optech laser
Miros Range Finder

Some severe storms
- 11. January 2006 at Haltenbanken. Hm0 15-17?m (ref:
‘Forecasting a 100 year event’, AK.Magnusson, M.Reistad, Ø.Breivik,
R.Myklebust, E.Ash), proceedings of 9th WW, Victoria, sept. 2006.
- 12.-13. January 2015 at Haltenbanken
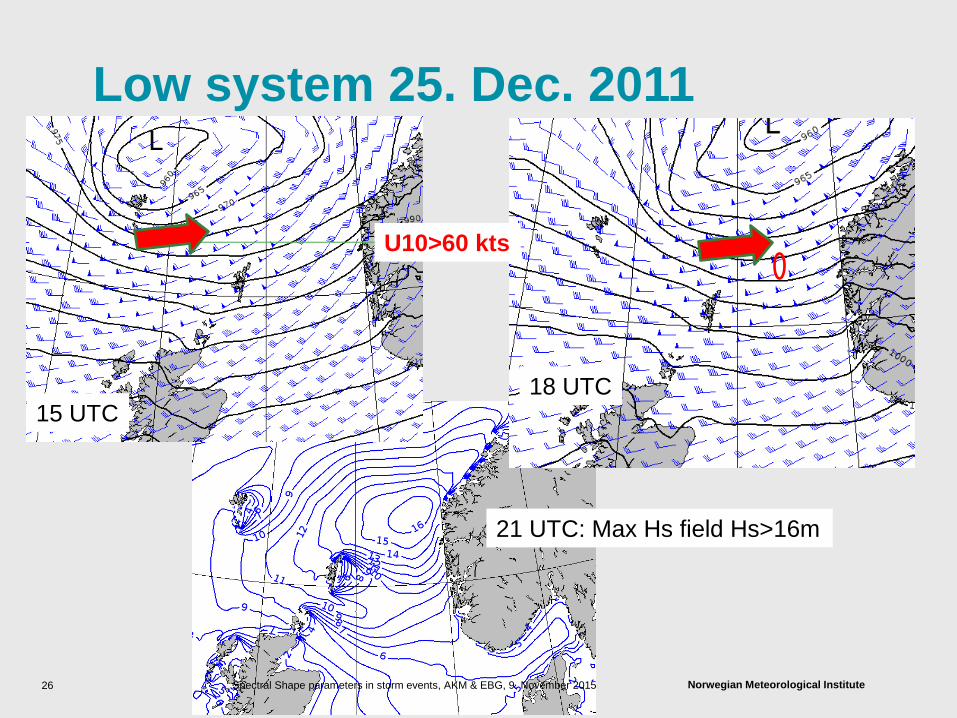
- 25.-26. December 2011 at GullfaksC/Snorre Hm0x 16m
Hm0 increase: 8 m in 6 hours
- 8.-9th December 2008 in Central North Sea. Hm0x ~11-12m
Measured Hs increase 4 m in 1.5 hours.

Severe storms – typical features
Hs close to 50 or 100 yr (!)
Strong forcing, especially at first
Veering of wind and wave field as
low pressure center moves on
Strong gradients in the Hs-field
Nearby platforms measure
different values
Spectral Shape parameters in storm events, AKM & EBG, 9. November 2015 19

Question of gound truth
Spectral Shape parameters in storm events, AKM & EBG, 9. November 2015 20
Distance to target site:
30-60 km
Distance to target site:
30-100 km
From presentation «Hs in rapidly evolving
environment, challenges to design» at
workshop «Advances in Ocean Wave
measurements», London, Oct.21st 2015
(http://www.rsaqua.co.uk/events.php) by
Eirini Spenza (DNV-GL). Co Authors:
R.V.Ahilan, P.Tromans, L.Vanderschuren,
AK.Magnusson and OJAarnes.
2m
12m
10 SW NW

Variability in wave measurements
· Ref: (WW13th):
· Bitner-Gregersen, E. M. and A. K. Magnusson, 2014: Effect
of sampling variability on wave parameters and wave
statistics, Ocean Dynamics (2014), Theoretical,
Computational and Observational Oceanography. ISSN
1616-7341. Vol 64, No 11. DOI 10.1007/s10236-014-0768-8
Spectral Shape parameters in storm events, AKM & EBG, 9. November 2015 21

Norwegian Meteorological Institute
The MIROS Doppler directional wave radar
Evaluates wave parameters and wave
directional spectra from
• Area of sea surface ~500 m away from
platform (less when mounted on a ship),
covering a 180° sector.
• Old systems have 30° resolution (scan 6
sectors (30 ° each) consecutively, for 2.5mins
each), newer have 10° resolution.
• Spectral parameters are evaluated as the
average of all 6 sectors for the last 3 full
sweeps (i.e. time average of the last 45
minutes of measurements, and spatial
average over the 180 deg area)
• Data are updated every 2.5 minutes as each
new 30 degree sector is scanned
22

Norwegian Meteorological Institute
Draugen and Heidrun, 11. Jan 2006
Spectral Shape parameters in storm events, AKM & EBG, 9. November 2015 23

Norwegian Meteorological Institute
Gullfaksc 25. December 2011
Spectral Shape parameters in storm events, AKM & EBG, 9. November 2015 24
From 8 to 15m in 6 hrs!

Norwegian Meteorological Institute
Gullfaks-C and Snorre-A 13. Jan 2015
Spectral Shape parameters in storm events, AKM & EBG, 9. November 2015 25
16.1m
12.9m
11.8m
Norwegian Meteorological Institute
Low system 25. Dec. 2011
Spectral Shape parameters in storm events, AKM & EBG, 9. November 2015 26
U10>60 kts
15 UTC 18 UTC
21 UTC: Max Hs field Hs>16m

Norwegian Meteorological Institute
Gamma values through storms
Spectral Shape parameters in storm events, AKM & EBG, 9. November 2015 27
• ϒ (RP) using Hm0 and Tp for both
model (red line) and observations
(blue line) give values [4-5] at
peak Hs values
• ϒ from MIROS spectra (blue dots)
give highest ϒ (~3.5) in the strong
forcing phase, and less than 3 at
peak Hs.
• ϒ from NORA10 spectra have
same tendency, but have less
variations.
The model is here and at other sites in the
North Sea (southern side of low) showing too
strong forcing in the increasing phase of
storm. It is suggested this is due to lack of
resolving finer scale atmospheric conditions.
ϒ(RP)

Norwegian Meteorological Institute
Gamma from MIROS measurements and
NORA10
· NORA10 max values of ϒ are around 3 in two cases, but
only in one of 7 cases at the maximum in storm. The other
one is in a very strong forcing period.
· MIROS measurements give ~2.7 in two of the cases at a
(seemingly) max in storm. Otherwise values are slightly
above NORA10 values.
Spectral Shape parameters in storm events, AKM & EBG, 9. November 2015 28
Norwegian Meteorological Institute
Gamma from other sensors
· Recorded values or those evaluated from 2Hz time series
give much higher values than NORA10 or the MIROS.
· DNV-RP for Gamma = f(Hm0,Tp) also gives much higher
values.
· Measurements from Ekofisk indicate a close to linear relation
as given by by DNV-RP, but values obtained by 20 minutes
records indicate even higher values.
· Many questions are still unanswered and more data are to
be analysed
Spectral Shape parameters in storm events, AKM & EBG, 9. November 2015 29
Norwegian Meteorological Institute
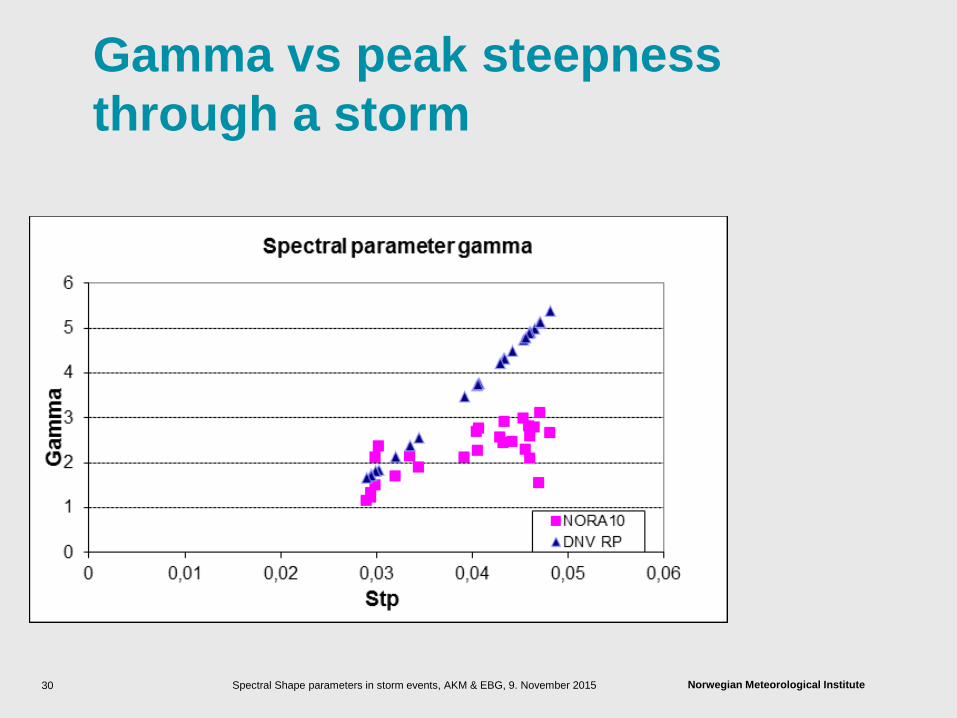
Gamma vs peak steepness
through a storm
Spectral Shape parameters in storm events, AKM & EBG, 9. November 2015 30

Norwegian Meteorological Institute
Gamma vs
Peak steepness
Spectral Shape parameters in storm events, AKM & EBG, 9. November 2015 31

Norwegian Meteorological Institute
Conclusions
NORA10 gamma values peak at around 3, seldomly when Hs is
at max. This may be a consequence of retrieving data from
outside field of extremes (peak of very severe storms are
constrained, with large horisontal gradients)
MIROS radar gives alike peakedness values as NORA10,
though slightly higher.
Other wave sensors (buoys, downlooking lasers –> In-situ
measurements!) give twice as high gamma values.
Gamma as retrieved from fitting J-spec to measured or
modelled spectra seems to have a close to linear dependence
on wave peak steepness
Spectral Shape parameters in storm events, AKM & EBG, 9. November 2015 32

Norwegian Meteorological Institute
Future work
- Finer resolution in wave model spectrum
- (24,25) (36,36)
- Hindcasts performed with finer grids.
- More quality controle on measurements
- Energy at low-high frequency bands
- Effect of different measuring periods (20-30-60min?)
- …
Spectral Shape parameters in storm events, AKM & EBG, 9. November 2015 33

Norwegian Meteorological Institute
A wave hit at unexpected height after Lilly,
sept 2001 (platform was designed in the
early 1970’s)
Ekofisk, 80’s. White, green and blue water. A
wave recorder was in period up to 2008 situated
on bridge north of the south flare tower.
Aberystwyth Seafront, 2014.02.10
(picture by BBC)
Thank you for
your attention