Deliverable FP7 SOLDER D3.1 Initial report of heterogeneous Carrier Aggregation in LTE-A and beyond

Secure Provisioning of Cloud Services based on SLA Management
SPECS Project - Deliverable 3.4.1
SPECS monitoring services Initial
Version 1.1 15 February 2016
The activities reported in this deliverable are partially supported by the European Community’s Seventh Framework Programme under grant agreement no. 610795.
SPECS monitoring services -‐ Initial
SPECS Project – Deliverable 3.4.1
2
Deliverable information Deliverable no.: D3.4.1 Deliverable title: SPECS monitoring services - Initial Deliverable nature: Prototype Dissemination level: Public Contractual delivery: 18 February 2016 Actual delivery date: 18 February 2016 Author(s): Georgiana Macariu, Bogdan Irimie (IeAT), Miha Stopar (XLAB),
Vincenzo Cinque (CeRICT) Contributors: Jolanda Modic (XLAB), Valentina Casola (CeRICT), Ciprian
Craciun, Dana Petcu (IeAT) Reviewers: Umberto Villano (CeRICT), Silvio La Porta (EMC) Task contributing to the deliverable:
T3.4
Total number of pages: 29

SPECS monitoring services -‐ Initial
SPECS Project – Deliverable 3.4.1
3
Executive summary This deliverable is associated with the prototype implementation of the monitoring module (Task 3.4). The goal of this document is to: (i) report the status of implementation activities, (ii) provide links to the SPECS public repository where the source code is available, (iii) give the initial instructions on how to install and use the code (even if the full details are reported on-‐line in the repository), especially for those components that are still in progress. Finally, a plan for the future implementation activities is discussed.

SPECS monitoring services -‐ Initial
SPECS Project – Deliverable 3.4.1
4
Table of contents Deliverable information ................................................................................................................................................ 2 Executive summary ........................................................................................................................................................ 3 Table of contents .............................................................................................................................................................. 4 Index of figures ................................................................................................................................................................ 5 Index of tables .................................................................................................................................................................. 6 1. Introduction ........................................................................................................................................................... 7 2. Relationship with other deliverables .......................................................................................................... 8 3. Monitoring core .................................................................................................................................................... 9 3.1. Status of development activities .......................................................................................................... 9 3.2. Event Hub .................................................................................................................................................... 12 3.2.1. Installation ........................................................................................................................................ 14 3.2.2. Usage .................................................................................................................................................... 16
4. Monitoring systems .......................................................................................................................................... 18 4.1. SVA Monitoring System and Adapter .............................................................................................. 18 4.1.1. Status of integration activities .................................................................................................. 18 4.1.1.1. SVA agent -‐ Chef recipe ........................................................................................................... 19 4.1.1.2. SVA adapter – Chef recipe ...................................................................................................... 19
4.1.2. Installation ........................................................................................................................................ 19 4.1.3. Usage .................................................................................................................................................... 19
4.2. OSSEC Monitoring System and Adapter ......................................................................................... 19 4.2.1. Status of integration activities .................................................................................................. 19 4.2.1.1. OSSEC agent -‐ Chef recipe ...................................................................................................... 20 4.2.1.2. OSSEC server – Chef recipe ................................................................................................... 20
4.2.2. Installation ........................................................................................................................................ 20 4.2.3. Usage .................................................................................................................................................... 21
4.3. OpenVAS Monitoring System and Adapter ................................................................................... 22 4.3.1. Status of integration activities .................................................................................................. 22 4.3.1.1. OpenVAS Manager and Scanner -‐ Chef managers recipe ......................................... 23 4.3.1.2. OpenVAS Client -‐ Chef client recipe ................................................................................... 23
4.3.2. Installation ........................................................................................................................................ 23 4.3.3. Usage .................................................................................................................................................... 24
4.4. NMAP Monitoring System and Adapter ......................................................................................... 24 4.4.1. Status of integration activities .................................................................................................. 24 4.4.2. Installation ........................................................................................................................................ 26 4.4.3. Usage .................................................................................................................................................... 26
5. Conclusions ........................................................................................................................................................... 28 6. Bibliography ......................................................................................................................................................... 29

SPECS monitoring services -‐ Initial
SPECS Project – Deliverable 3.4.1
5
Index of figures Figure 1. Relationships with other deliverables .............................................................................................. 8 Figure 2. Architecture of the Event Hub ............................................................................................................ 12 Figure 3: Architecture of monitoring system based on Nmap ................................................................. 25 Figure 4. Monitoring module implementation plan ..................................................................................... 28

SPECS monitoring services -‐ Initial
SPECS Project – Deliverable 3.4.1
6
Index of tables Table 1. SPECS Components related to the Monitoring module and related requirements ....... 11 Table 2. Monitoring Module Implementation Status ................................................................................... 11

SPECS monitoring services -‐ Initial
SPECS Project – Deliverable 3.4.1
7
1. Introduction The SPECS Monitoring module observes the SLA status by collecting information about the state of target services that is relevant to the set of signed SLAs, and by forwarding notifications of possible alerts and violations to the Enforcement module. Any changes in target services that may affect the validity of any signed SLA are reported to the Enforcement module, which is in charge of the main reasoning and analysis parts (cf. Diagnosis component). Monitoring components are configured by the Enforcement module in the SLA implemen-‐tation phase after each new SLA is signed. The Enforcement module extracts negotiated security metrics in order to properly configure monitoring systems for associated target services (to determine what to observe), and to translate metric values (the SLO in the signed SLA) into alert and violation thresholds (to determine when to notify the Enforcement module about a given monitoring event). See deliverable D3.3 for all design details. Existing open-‐source monitoring tools that are of interest to SPECS were described in detail in deliverable D3.1. We choose a subset of them in order to implement the validation scenarios described in Work Package 5. In this deliverable we report how we integrated the first set of them into the SPECS framework. The rest of this document is structured as follows: In Section 2 we describe the relationships with other deliverables. Section 3 is dedicated to the core monitoring components under development. It reports the status of development activities, installation and usage guides for the monitoring event router, i.e., the Event Hub. The first set of monitoring systems used in SPECS is presented in Section 4. For each monitoring system we report the integration status, the installation (i.e., the enforcement through a Chef implementation Server) and usage guidelines. The deliverable closes with final remarks in Section 5, reporting our plans for future activities.
SPECS monitoring services -‐ Initial
SPECS Project – Deliverable 3.4.1
8
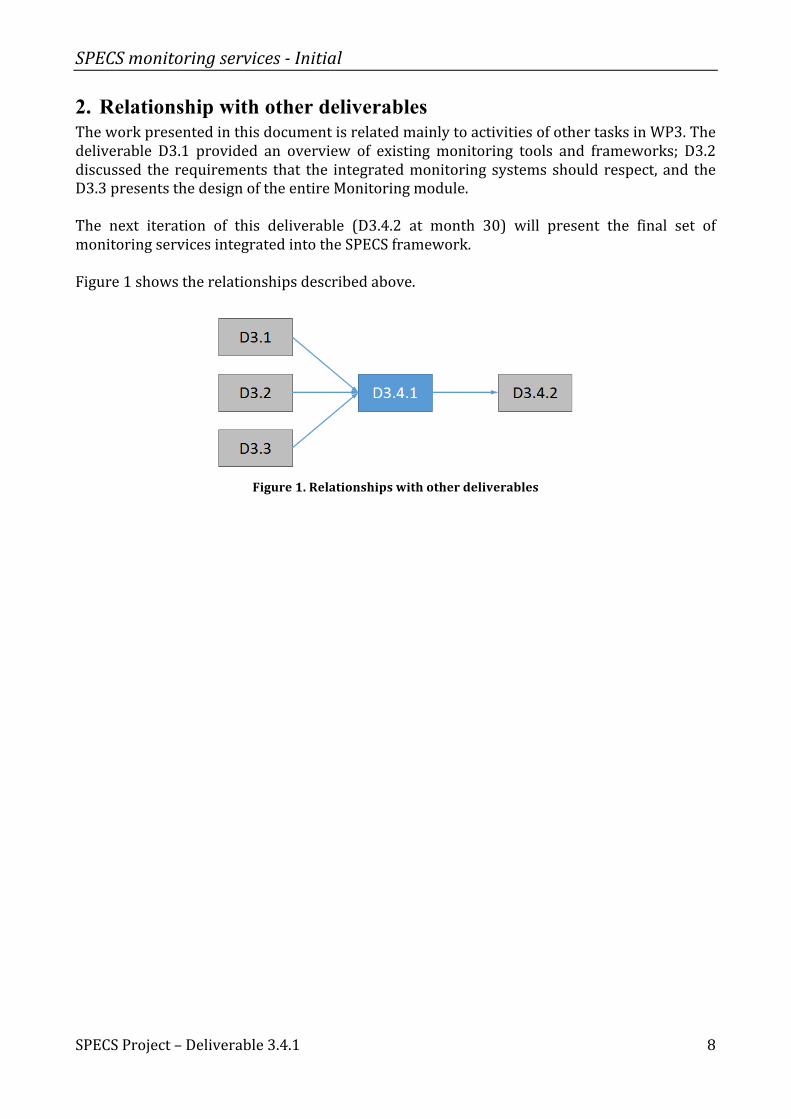
2. Relationship with other deliverables The work presented in this document is related mainly to activities of other tasks in WP3. The deliverable D3.1 provided an overview of existing monitoring tools and frameworks; D3.2 discussed the requirements that the integrated monitoring systems should respect, and the D3.3 presents the design of the entire Monitoring module. The next iteration of this deliverable (D3.4.2 at month 30) will present the final set of monitoring services integrated into the SPECS framework. Figure 1 shows the relationships described above.
Figure 1. Relationships with other deliverables
SPECS monitoring services -‐ Initial
SPECS Project – Deliverable 3.4.1
9
3. Monitoring core
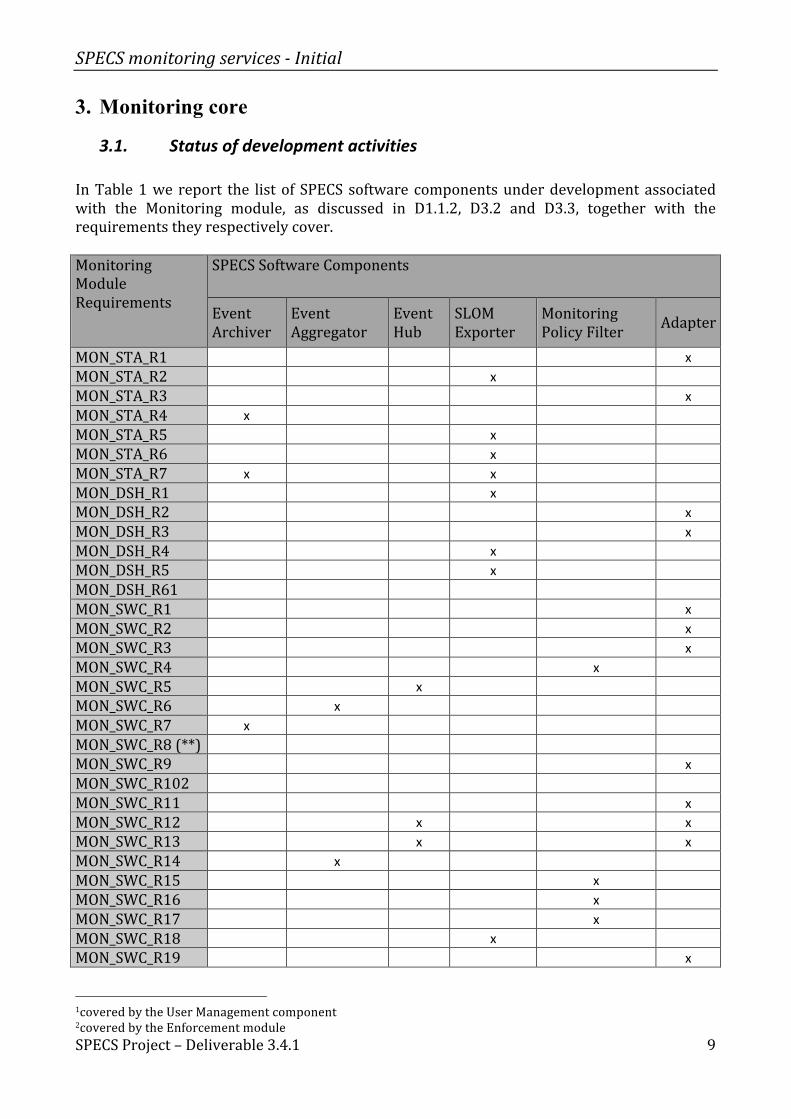
3.1. Status of development activities In Table 1 we report the list of SPECS software components under development associated with the Monitoring module, as discussed in D1.1.2, D3.2 and D3.3, together with the requirements they respectively cover. Monitoring Module Requirements
SPECS Software Components
Event Archiver
Event Aggregator
Event Hub
SLOM Exporter
Monitoring Policy Filter Adapter
MON_STA_R1
x MON_STA_R2
x
MON_STA_R3
x MON_STA_R4 x
MON_STA_R5
x MON_STA_R6
x
MON_STA_R7 x
x MON_DSH_R1
x
MON_DSH_R2
x MON_DSH_R3
x
MON_DSH_R4
x MON_DSH_R5
x
MON_DSH_R61 MON_SWC_R1
x MON_SWC_R2
x
MON_SWC_R3
x MON_SWC_R4
x
MON_SWC_R5
x MON_SWC_R6
x
MON_SWC_R7 x MON_SWC_R8 (**)
MON_SWC_R9
x MON_SWC_R102
MON_SWC_R11
x MON_SWC_R12
x
x
MON_SWC_R13
x
x MON_SWC_R14
x
MON_SWC_R15
x MON_SWC_R16
x
MON_SWC_R17
x MON_SWC_R18
x
MON_SWC_R19
x
1covered by the User Management component 2covered by the Enforcement module
SPECS monitoring services -‐ Initial
SPECS Project – Deliverable 3.4.1
10
MON_SWC_R20
x MON_SWC_R21
x
MON_SWC_R223 MON_SWC_R23
x MON_SST_R1
x
MON_SST_R2
x MON_SST_R3
x
MON_SST_R4
x MON_SST_R5 x
x
MON_SST_R6
x MON_SST_R7
x
MON_SST_R8
x MON_SST_R9
x
MON_SST_R10
x MON_NEG_R1
x
MON_NEG_R2
x MON_NEG_R3
x
MON_COS_R1
x MON_COS_R2
x
MON_COS_R3
x MON_COS_R4
x
MON_COS_R5
x MON_COS_R6
x
MON_COS_R7
x MON_COS_R8
x
MON_COS_R9
x MON_COS_R10 x x
MON_COS_R11
x MON_COS_R12
x x
MON_COS_R13
x x
x MON_BSC_R12
MON_BSC_R2
x
x MON_BSC_R3
x
x
MON_BSC_R4
x MON_BSC_R5
x
MON_BSC_R6
x MON_BSC_R7
x x
MON_BSC_R8
x MON_BSC_R9
x
x
MON_BSC_R10
x
x MON_BSC_R11
x
x
MON_BSC_R12 x MON_BSC_R13 x
x
x MON_DRE_R1
x
MON_DRE_R2
x MON_DRE_R3
x
3deprecated
SPECS monitoring services -‐ Initial
SPECS Project – Deliverable 3.4.1
11
MON_DRE_R4
x MON_DRE_R5
x
MON_DRE_R6
x MON_DRE_R7
x
MON_DFE_R1
x MON_DFE_R2
x
MON_SSB_R1
x MON_SSB_R2
x
MON_SSB_R3
x MON_SSB_R4
x
MON_SSB_R5
x MON_ENF_R12
MON_ENF_R2
x MON_ENF_R3
x x
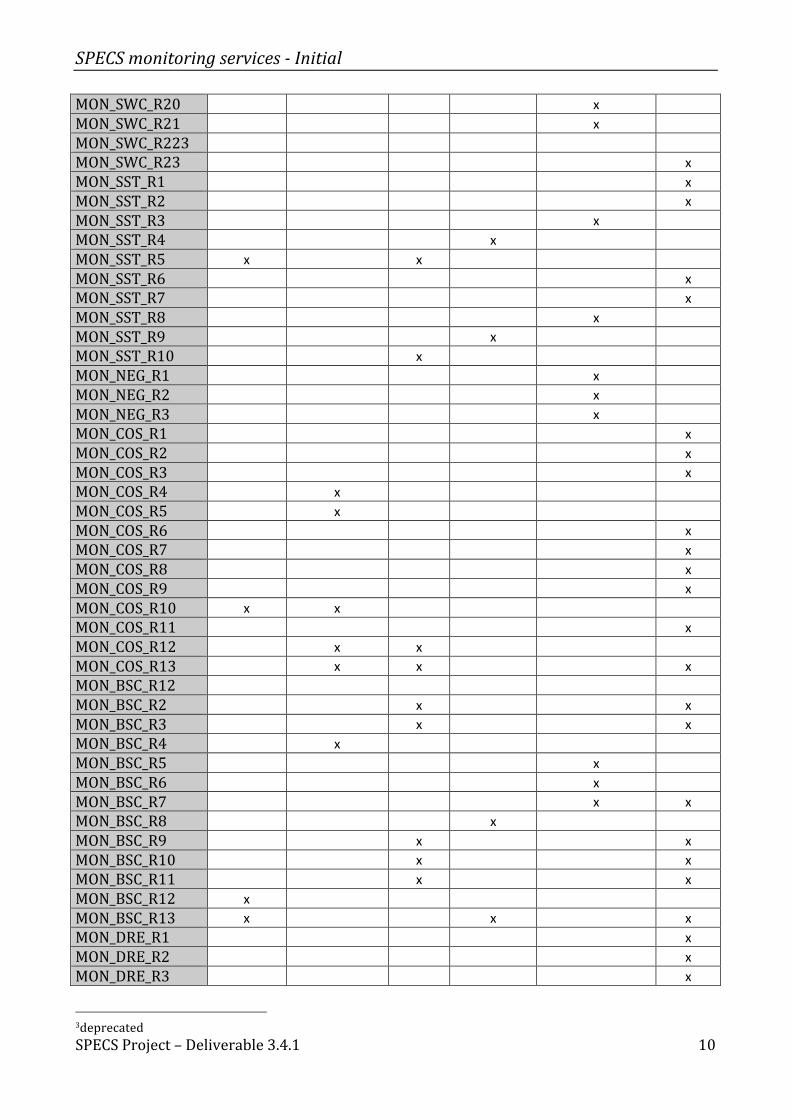
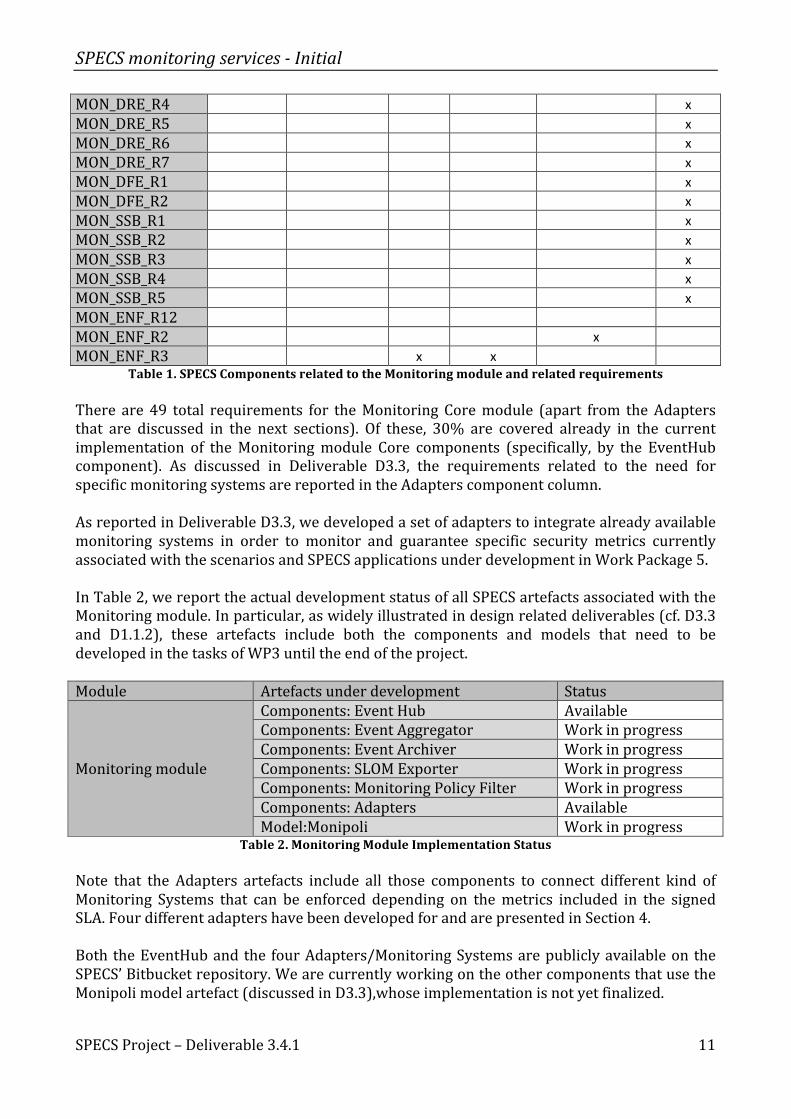
Table 1. SPECS Components related to the Monitoring module and related requirements There are 49 total requirements for the Monitoring Core module (apart from the Adapters that are discussed in the next sections). Of these, 30% are covered already in the current implementation of the Monitoring module Core components (specifically, by the EventHub component). As discussed in Deliverable D3.3, the requirements related to the need for specific monitoring systems are reported in the Adapters component column. As reported in Deliverable D3.3, we developed a set of adapters to integrate already available monitoring systems in order to monitor and guarantee specific security metrics currently associated with the scenarios and SPECS applications under development in Work Package 5. In Table 2, we report the actual development status of all SPECS artefacts associated with the Monitoring module. In particular, as widely illustrated in design related deliverables (cf. D3.3 and D1.1.2), these artefacts include both the components and models that need to be developed in the tasks of WP3 until the end of the project. Module Artefacts under development Status
Monitoring module
Components: Event Hub Available Components: Event Aggregator Work in progress Components: Event Archiver Work in progress Components: SLOM Exporter Work in progress Components: Monitoring Policy Filter Work in progress Components: Adapters Available Model:Monipoli Work in progress
Table 2. Monitoring Module Implementation Status Note that the Adapters artefacts include all those components to connect different kind of Monitoring Systems that can be enforced depending on the metrics included in the signed SLA. Four different adapters have been developed for and are presented in Section 4. Both the EventHub and the four Adapters/Monitoring Systems are publicly available on the SPECS’ Bitbucket repository. We are currently working on the other components that use the Monipoli model artefact (discussed in D3.3),whose implementation is not yet finalized.
SPECS monitoring services -‐ Initial
SPECS Project – Deliverable 3.4.1
12
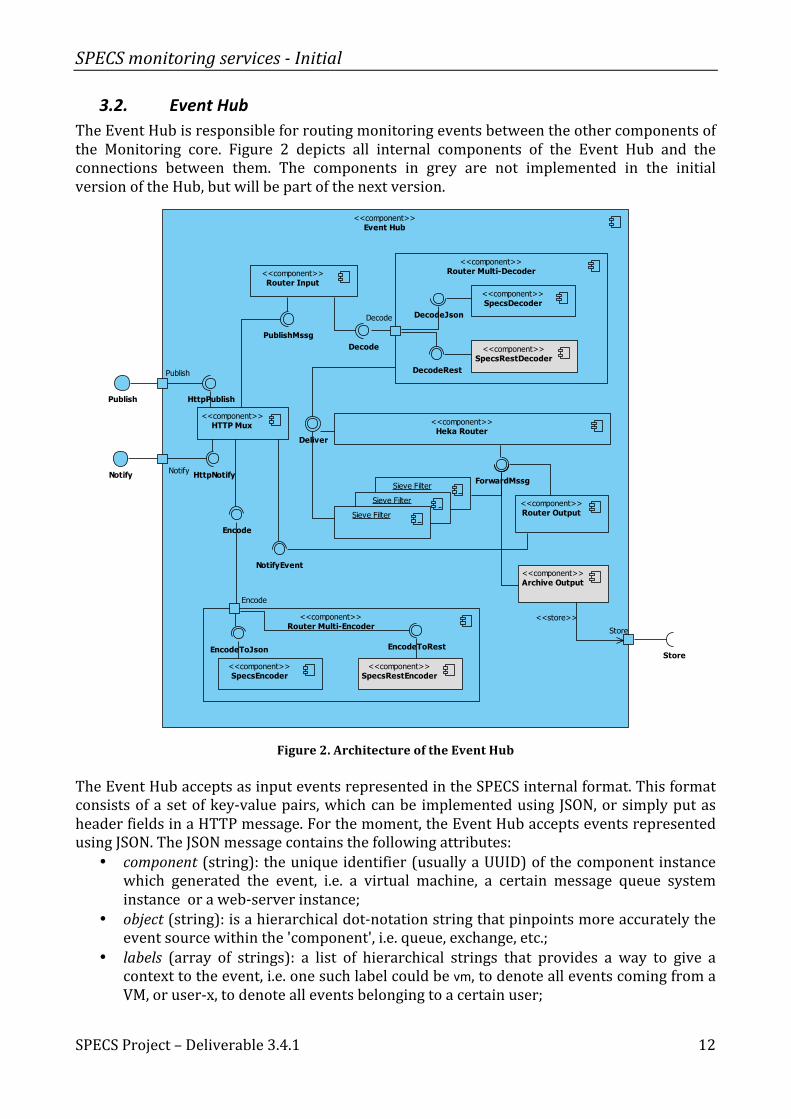
3.2. Event Hub The Event Hub is responsible for routing monitoring events between the other components of the Monitoring core. Figure 2 depicts all internal components of the Event Hub and the connections between them. The components in grey are not implemented in the initial version of the Hub, but will be part of the next version.
Figure 2. Architecture of the Event Hub
The Event Hub accepts as input events represented in the SPECS internal format. This format consists of a set of key-‐value pairs, which can be implemented using JSON, or simply put as header fields in a HTTP message. For the moment, the Event Hub accepts events represented using JSON. The JSON message contains the following attributes:
• component (string): the unique identifier (usually a UUID) of the component instance which generated the event, i.e. a virtual machine, a certain message queue system instance or a web-‐server instance;
• object (string): is a hierarchical dot-‐notation string that pinpoints more accurately the event source within the 'component', i.e. queue, exchange, etc.;
• labels (array of strings): a list of hierarchical strings that provides a way to give a context to the event, i.e. one such label could be vm, to denote all events coming from a VM, or user-‐x, to denote all events belonging to a certain user;
Event Hub<<component>>
Publish
Notify
Store
Router Input<<component>>
Sieve Filter
Router Multi-Decoder<<component>>
Decode
Sieve Filter
Sieve Filter
Router Multi-Encoder<<component>>
Encode
SpecsDecoder<<component>>
SpecsRestDecoder<<component>>Decode
DecodeRest
DecodeJson
HTTP Mux<<component>>
PublishMssg
Heka Router<<component>>
Deliver
Router Output<<component>>
ForwardMssg
Encode
NotifyEvent
SpecsEncoder<<component>>
SpecsRestEncoder<<component>>
EncodeToJson EncodeToRest
Publish
Notify
HttpPublish
HttpNotify
Archive Output<<component>>
Store
<<store>>

SPECS monitoring services -‐ Initial
SPECS Project – Deliverable 3.4.1
13
• type (string): an hierarchical string indicating what type of event is this, like "syslog", "structured-‐log", "cloudwatch.metrics";
• data (JSON object): depends on the type of event; • timestamp (number): time of the event, in seconds; • token (JSON object): the token identifying an event generated by the Event Hub. The
object has two attributes: uuid, containing the UUID in the token, and seq, containing the sequence number in the token. More the details about this token attribute will follow below.
Typically, the Event Hub will receive published events, from the Monitoring Adapters, process them and will notify the Monitoring Policy Filter of the generated events. The interface with all these systems uses the HTTP Mux component, which implements a configurable request router and dispatcher. The HTTP Mux forwards the received HTTP requests, containing events, to the Router Input component, which decodes the event from the SPECS internal format to a format manageable by the Heka Router [2] and forwards it to the router. For decoding the message, the Router Input uses the Router Multi-‐Decoder component, which will employ for the actual decoding either the SpecsDecoder or the SpecsRestDecoder sub-‐components. The choice between these sub-‐components depends on the data interchange format used by the event received by the Event Hub. If the event is received as a JSON object in the body of the HTTP request, then the SpecsDecoder will be used. If the event is received using the header fields of the request, then the SpecsRestDecoder will be used. For the current version only the SpecsDecoder is available. As mentioned above, this decoder expects the event to be sent as a JSON object, with the attributes defined according to the SPECS internal format. The Heka Router pipes each message to three components:
• The matching Sieve Filter. • The Router Output. • The Archive Output -‐ responsible for sending events to the Event Archiver for
persistent storage. This Heka Router is the piece that links almost all components. This implies that, for a message to get from the Router Input to any of the Sieve Filters, to the Router Output or to the Archive Output, the message must be delivered to the Heka Router. Its only endpoints are the output components. That means that messages generated by the Sieve Filters must also be delivered to the Heka Router, which will take them further to the Router-‐ and Archive-‐Output. The Router Input, Specs Decoder, Specs Multi-‐Decoder, Sieve Filters, Router Output, Specs Encoder and Specs Multi-‐Encoder are all implemented as Heka plugins. The components remaining to be implemented will also be developed as Heka plugins. A Sieve Filter can be used to group all events matching a condition specified during the configuration of the Event Hub. This condition should be expressed in terms of the SPECS internal format for the event. For example, a filter can declare a condition through which it will accept only events with the object field equal to db1, generated by a component representing a MySQL server (meaning that will filter events related to database db1). The Sieve Filter will add a so-‐called stream attribute to all received events. For the example before, a possible value of the stream attribute can be mysql-‐db1. This attribute will be used by clients

SPECS monitoring services -‐ Initial
SPECS Project – Deliverable 3.4.1
14
when requesting events from the Event Hub and is configured before starting the Event Hub, as explained in Section 3.2.1. The Router Output will receive all events that have a stream attribute and will buffer them. The Hub maintains a circular buffer for each possible stream and each buffer contains the latest n events with the respective stream. The value of n is configured before starting the Event Hub, as explained in Section 3.2.1. The Router Output buffers the events in the format used internally by the Hub and leaves the actual encoding of the event to the SPECS internal format to the HTTP Mux. Although one may expect the Router Output to do the encoding, this is not possible at this stage, because the actual encoding is client-‐dependent. One client may request that events must be delivered as JSON objects, another may request another format. When a client connects to the Hub, requesting events with a given stream attribute, the HTTP Mux will take all such events from their corresponding buffer, will encode them into the SPECS internal format and will send them to the client until the latter disconnects. The encoding is done with the help of the Specs Multi-‐Encoder. The Multi-‐Encoder chooses one of its encoder sub-‐components based on the URL used by the client for connecting to the Hub. More details about this matching can be found in Section 3.2.1. In addition to the stream attribute, the Event Hub adds to each event, a token attribute, composed of an UUID corresponding to a stream, and a sequence number. The UUID is generated the first time an event associated with the stream reaches the Router Output. If the Event Hub is restarted, the UUID will be regenerated. If the connection between a client and the Hub drops, the client can reconnect and, at reconnection time, it can specify that it wants only messages newer than the last received one. In order to do so, all it has to do is send, in its HTTP request header, the token of the last received message. When the Hub receives the token, it looks at its UUID. If it is the same as the UUID currently associated with the requested stream, it will send only events with a sequence number greater than the one in the received token. If the UUIDs do not match, the Hub will send all events, as it means that the Hub was restarted, and, surely, the client does not have any event in the Hub's buffer.
3.2.1. Installation The Event Hub can be built from sources or can be downloaded as a binary file. The source files are available in the SPECS repository [2] : https://bitbucket.org/specs-team/specs-monitoring-eventhub
The downloads section of this repository contains two already-‐built versions of the Event Hub, one executable for Microsoft Windows (x64) and another for Linux (x64). To build the Event Hub from the source code, one needs to setup a Go [3] work environment. Therefore, prior to building the Hub, Go must be installed and configured. Beside Go, since the Hub is implemented using Mozilla Heka [2] it also requires Heka for building the binary. However, one will not need to install Heka, as this task is automated by the Hub's build process, but will need to make sure that all Heka prerequisites are pre-‐installed. Moreover, since these prerequisites may change from one Heka version to another,
SPECS monitoring services -‐ Initial
SPECS Project – Deliverable 3.4.1
15
one must check the complete list of Heka prerequisites available on its website [1] . Once Go and Heka's prerequisites are installed, to build the Event Hub, only the install.sh script in the above repository is required. One should copy the install.sh somewhere on his/her computer and run it. Upon successful execution, in the same folder where the script was executed, an executable file named event-‐hub should be found. The Event Hub configuration file specifies how to handle messages received from Monitoring Adapters and other event generators, and how to send event notifications. The configuration file is in TOML format [4] . The configuration file is divided into sections. There is a section named hekad, which may contain global configuration options described in Heka's documentation. The Event Hub adds three other options to the configuration options described there, as follows:
• buffer_size (integer value, optional): The Event Hub temporarily stores events in buffers before sending them to the interested clients. This option specifies the size of these buffers. Defaults to 1024.
• handlers_configuration (string, required): This is a base64 encoded string which specifies how input messages and outputs should be handled.
• port (integer value, optional): The port on which the Event Hub will receive HTTP requests. Defaults to 8080.
Clients can send events to the Event Hub using HTTP. The output events, routed through the Hub, can be received by interested clients also using HTTP. The Hub uses the handler_configuration option in order to determine which HTTP requests are sending events to the Hub and which are actually requesting events from the Hub. We call handler a group of configuration parameters related to the way messages should be received or sent from/to clients. These handlers are used by the HTTP Mux component in order to determine the data interchange format of the received event or the stream from which a client wants events. As such, a handler is composed of a set of parameters, as follows:
• path_pattern: A regular expression to be matched against the HTTP request URI path. This pattern will be checked against the path of the received request and, in case of a match, the rest of the parameters of the handler will specify how to handle the request. This is a mandatory parameter.
• action: This will indicate if this is an input message or a request for receiving events from the Hub. This is a mandatory parameter. The only possible values are input and stream_output.
• method: A HTTP method. For now, this should be POST when sending input messages and GET when requesting messages from the Hub. This is a mandatory parameter.
• path_pattern_stream_group: An integer value indicating which group from the regular expression in the first parameter contains a stream name. This is mandatory when the action parameter is stream_output.
• decoder: Indicates the decoder used for decoding input messages. This should correspond to the name of a Heka decoder plugin. For now, the only plugin that can be used is the SpecsDecoder. This option is mandatory when the action parameter is input and is mutually exclusive with the encoder parameter.
• encoder: Indicates the encoder used for encoding events. For now, the only encoder to be used is SpecsEventEncoder. This option is mandatory when the action parameter is stream_output and is mutually exclusive with the decoder parameter.
SPECS monitoring services -‐ Initial
SPECS Project – Deliverable 3.4.1
16
• annotations: A key-‐value mapping. This is not currently used, but was defined because it will be used by the SpecsRestDecoder and SpecsRestEncoder, depicted in Figure 2. This will be implemented in the next version of the Event Hub.
The base64 decoded handlers must comply with the following syntax:
handlers.<index>.path_pattern = <regular expression describing a HTTP request URI path> handlers.<index>.action = input | stream_output handlers.<index>.method = POST | GET handlers.<index>.path_pattern_stream_group = <integer value> handlers.<index>.decoder = SpecsDecoder handlers.<index>.encoder = SpecsEventEncoder
The <index> placeholder is an integer value used for grouping the parameters of a single handler. As mentioned above, a handler will not have all the parameters in the syntax description, only those related to its associated action. Besides the global configuration section, the configuration file will contain a section for each instance of a Heka plugin, which must be loaded by the Event Hub. As mentioned in the previous section, several components of the Event Hub are implemented as Heka plugins. This section name specifies the name of the plugin, and the “type” parameter specifies the plugin type. For the Event Hub the only accepted plugin types are SieveFilter, SpecsDecoder and SpecsEncoder, which implement the components with similar names. The required plugin instances for the Router Input, Router Output and Archive Output components will be configured and started automatically at the Evnt Hub's start-‐up.
3.2.2. Usage You can start an Event Hub process based on a certain configuration by using the command:
event-hub -config=<config_file.toml>
Sending monitoring events In order to send a message to the Event Hub, a client should send a HTTP POST request with a path matching the path pattern of one of the Hub's input handlers. The request should contain a monitoring event conforming to the SPECS internal format. Receiving monitoring events A client that wants to receive events from the Event Hub, must send a HTTP GET request with a path matching the path pattern of one of the Hub's output handlers. Once the connection is established, the Event Hub will start streaming events to the client. The format of the output event is the SPECS internal format. As explained above, each event has a token attribute that uniquely identifies the message. This token can be used by the client when requesting events. To understand better how it can be used, consider the following scenario: A client connects to the Hub and starts receiving events for a certain stream. The Event Hub associates with each known stream a UUID, embedded in the token. The events are sent from the Event Hub to its client ordered by a sequence number, also embedded in the token. During the streaming, something happens and the connection is dropped. When the client reconnects, it will want to receive only the events generated for the stream, after the connection was dropped. The client knows the last event it received, so all it has to do is send the token attribute in the last received event to the Hub when it reconnects.

SPECS monitoring services -‐ Initial
SPECS Project – Deliverable 3.4.1
17
The serialized token, containing the UUID and sequence number of the token, can be sent in the SPECS-‐Heka-‐HTTP-‐Gateway-‐Stream-‐Sequence HTTP request header. If the Hub receives this header and it was not restarted in the meantime, it will send only events with sequence number greater than the one in the received token. If it was restarted, it will send all events for the stream requested by the client, no matter what token is sent.
SPECS monitoring services -‐ Initial
SPECS Project – Deliverable 3.4.1
18
4. Monitoring systems
4.1. SVA Monitoring System and Adapter As introduced in deliverable D4.1.2, the SVA Security and Control mechanism detects software vulnerabilities and misconfigurations of the installed packages. The SVA tool, applied on running VMs, detects libraries that need to be upgraded (i.e., reports about vulnerabilities and misconfigurations). The SVA Security and Control mechanism offers two security metrics, introduced in deliverable D4.3.1:
• VulnerabilityReportMaxAge: The frequency of report generation (for example “7*24h” requires that report needs to be generated at least once per week);
• VulnerabilityListMaxAge: The frequency of vulnerability list updates (for example “24h” means that list of known vulnerabilities needs to be updated at least once per day).
The main requirements covered by this mechanism are reported in deliverable D4.1.2, and the design details are present in deliverable D4.2.2. The mechanism consists of three components; the SVA Monitoring component, the SVA Enforcement component and the SVA Dashboard component. The SVA Monitoring component periodically performs a vulnerability scan on the VM it is installed on, and detects a set of vulnerabilities and misconfigurations (frequencies of scans are determined by the above-‐mentioned security metrics). The SVA Security and Control mechanism has already been implemented in month 12 (see deliverable D4.3.1 and [5] ). Here we only report the implementation details for the monitoring adapter needed for receiving and sending monitoring events related to software vulnerabilities and misconfigurations.
4.1.1. Status of integration activities The SVA monitoring system consists of two components: sva-‐agent and sva-‐adapter. The sva-‐agent has been developed in the first year and has been included in the SVA cookbook. It needs to be installed on each machine for which the software vulnerability assessment is required by SLA. It works on top of OpenSCAP [6] . According to the VulnerabilityReportMaxAge metric, the sva-‐agent periodically generates the vulnerabilities report via OpenSCAP: oscap oval eval --result results.xml /tmp/oval.xml oscap oval generate report --output report.html results.xml
The report is sent to the sva-‐adapter, which processes it and sends the processed data to the Specs Monitoring Core.
SPECS monitoring services -‐ Initial
SPECS Project – Deliverable 3.4.1
19
4.1.1.1. SVA agent -‐ Chef recipe This Chef recipe4 installs the sva-‐agent on the target machine (the machine that has to be monitored). The agent is provided as a Ruby code block, inserted directly in the recipe, and uses OpenSCAP command line utilities.
4.1.1.2. SVA adapter – Chef recipe This recipe installs the sva-‐adapter on a provisioned VM. The agent is provided as a Ruby code block, inserted directly in the recipe, and uses Ruby XML utilities to parse the report.
4.1.2. Installation The execution of the two recipes explained above needs the following prerequisites:
● All the VMs should runOpenSuse OS, 64 bit version. ● The sva-‐adapter recipe needs the TCP port 8000 to be opened on the hosted VM.
The component sva-‐agent needs OVAL [7] definition for an operating system that runs on a monitored machine. According to the VulnerabilityListMaxAge metric, the Enforcement periodically downloads from the OVAL MITRE repository [8] , the latest available list of vulnerabilities (in OVAL format) and puts it in a cookbook (file folder in sva cookbook) from which, Chef automatically transfers it to the monitored machine.
4.1.3. Usage Once the appropriate OVAL definition is transferred to the monitored machine (Chef automatically detects the operating system and sends the appropriate OVAL definition), sva-‐agent periodically scans the system and generates a report. The report is sent to the sva-‐adapter that processes it and sends it to the SPECS Monitoring Core. The two metrics supported at M12 could be extended with some new metrics, such as MaxCountOfVulnera-‐bilities (this would require appropriate comparison of the severity levels of vulnerabilities). This would enable Enforcement Remediation actions, such as replacing the existing VM (with vulnerabilities count higher than specified in the SLA) with a new one which would have a vulnerability count less than the limit agreed in the SLA.
4.2. OSSEC Monitoring System and Adapter OSSEC is an open source system that enables the monitoring and control of a system. It mixes together all the aspects of HIDS (Host-‐based Intrusion Detection Systems), log monitoring and SIM/SIEM (security information management/security information and event management) in a simple, powerful and open source solution. The internal architecture of this monitoring system and how it can be integrated with the SPECS Monitoring core components have been described in Deliverable D3.3. In the following subsections, we provide a brief description of the current status of integration activities, an installation and usage guideline, and a link to public repositories where all packages and details can be retrieved.
4.2.1. Status of integration activities The specs-‐monitoring-‐ossec security mechanism is a custom version of the open source ossec solution, adapted to run inthe SPECS framework. It is composed of one server (ossec-‐server) and one or more agents (ossec-‐agent).
4 Chef and Chef receipts are described in D1.6.1
SPECS monitoring services -‐ Initial
SPECS Project – Deliverable 3.4.1
20
The ossec-‐agent is a small program installed on the systems you desire to monitor. It will collect information in real-‐time and forward it to the ossec-‐server for analysis and correlation.
The ossec-‐server is the central component of the Ossec deployment, and monitors everything. It receives information (the file integrity checking databases, the logs, events and system auditing entries) from agents, and analyses and collects them.
Agent and Server communicate through encrypted messages (symmetric key) generated by the ossec-‐server.
The ossec-‐server manipulates the information received through the ossec-‐adapter in order to send them to the Specs monitoring core.
A typical workflow starts when a file’s integrity is compromised, or a monitored log has been updated, or a rootkit activity has been detected. The ossec-‐agent detects that something is happening and sends the event (e.g., the modified log) to the ossec-‐server that collects, analyses and generates an alert. All the alerts are stored in a log file and are sent to the ossec-‐adapter that manipulates them, according to the format defined by the SPECS Monitoring Core, and sends them to it.
Definitively, the components are: ossec-‐server, ossec-‐agent and ossec-‐adapter. These components are deployed dynamically on VMs using the chef cookbook “specs-‐monitoring-‐ossec”. These are currently available online in the SPECS public repository [9] :
https://bitbucket.org/specs-team/specs-monitoring-ossec
This cookbook contains two recipes: the “agent” one allows the installation of the ossec-‐agent, while the “server” one allows the installation of the ossec-‐server and activates the ossec-‐adapter on the same machine that hosts the ossec-‐server.
4.2.1.1. OSSEC agent -‐ Chef recipe This recipe installs the ossec-‐agent on the target machine (the machine that has to be monitored). The agent is provided as a tar.gz file (Agent.tar.gz) that is hosted together with the cookbook itself.
4.2.1.2. OSSEC server – Chef recipe This recipe installs the ossec-‐server on a provisioned VM. The component is provided as a tar.gz file (Server.tar.gz) that is hosted together with the cookbook itself. This recipe activates the adapter component, registers all the agents and sends them the symmetric key (using the ssh protocol) that the agents need to use to communicate with the ossec-‐server, and finally starts all agents.
4.2.2. Installation The execution of the two recipes introduced above has the following prerequisites: ● All the VMs should run OpenSuse OS, 64 bit version. ● It is compulsory to have a tool that is able to execute recipes (e.g., a workstation with
the knife tool installed, a software that uses Apache Jcloud Chef Api). ● The ossec-‐agent recipe has to be executed on all the agent nodes before the execution
of the server recipe.

SPECS monitoring services -‐ Initial
SPECS Project – Deliverable 3.4.1
21
● The ossec-‐server recipe needs the UDP port 1514 to be opened on the hosted VM. (e.g., On Amazon AMI: you need to: -‐ access to amazon console; -‐ add an inbound rule into the security group [Custom UDP rule]).
● The server node and the agents need to communicate using the ssh protocol without explicit password request, in order to communicate with each other in a secure way.
All the inputs necessary to execute these recipes are provided by the implementation plan that has to be uploaded on the Chef server as a data bag item into the data bag “implementation_plans”. The necessary input for the agent recipe is the following:
ossec-server IP_address; The ossec-‐server needs the following data in order to correctly execute the server, retrieved through the implementation_plan given in input: ● specs-‐monitoring-‐core IP address and port; ● List of all IP addresses and names of the VMs that hosts ossec-‐agent.
Each implementation_plan is identified by a unique id (“implementation_plan_id”) that has to be passed as node_attribute during the node bootstrapping phase (the node bootstrapping is described in D1.6.1).
The structure of the knife command to bootstrap the node and install ossec-‐agent on a target machine is:
knife bootstrap <IP_PUBLIC> -x <user_name> -P <user_password> --node-name <node_name> --run-list 'recipe['specs-monitoring-ossec::agent']' -j '{ "implementation_plan_id":"<id_value>"}'
A typical example is:
knife bootstrap 192.168.1.101 -x root -P specs --node-name agent-node1 --run-list 'recipe['specs-monitoring-ossec::agent']' -j '{ "implementation_plan_id":"1154982"}'
The structure of the knife command to bootstrap the node and install ossec-‐server on a VM is: knife bootstrap <IP_PUBLIC> -x <user_name> -P <user_password> --node-name <node_name> --run-list 'recipe['specs-monitoring-ossec::server']' -j '{ '{ "implementation_plan_id":"<id_value>"}'}'
A typical example is: knife bootstrap 192.168.1.103 -x root -P specs --node-name server-node --run-list 'recipe['specs-monitoring-ossec::server']' -j '{ "implementation_plan_id":"1154982"}'
4.2.3. Usage
If the Apache2 web server is available on the node, Ossec analyses the access and error log files. The Ossec configuration looks at those files located into the following paths:
/opt/apache2/logs/access_log, /opt/apache2/logs/error_log.

SPECS monitoring services -‐ Initial
SPECS Project – Deliverable 3.4.1
22
If the Nginx web server is available on the node, Ossec analyses the access and error log files. The Ossec configuration looks at those files located into the following paths:
/opt/nginx/logs/access.log, /opt/nginx/logs/error.logs
If the system syslog is available on the node, Ossec analyses the log file located in the following default path: /var/log/messages. If syslog is not installed or it is not running, it will be installed and run.Ossec generates a set of specs monitoring events, as reported in <specs-monitoring-ossec>/doc/monitoring_events/events.txt.
4.3. OpenVAS Monitoring System and Adapter OpenVAS is an open source framework made of several services and tools offering a comprehensive and powerful vulnerability scanning and vulnerability management solution. The internal architecture of this monitoring system and how it can be integrated with the SPECS Monitoring core components have been described in Deliverable D3.3. In the following subsections, we provide a brief description on the current status of integration activities, an installation and usage guideline and a link to public repositories where all packages and details can be retrieved.
4.3.1. Status of integration activities The specs-‐monitoring-‐openvas security mechanism is a custom version of the open source OpenVASsolution, adapted to run in the SPECS framework. It consists of a monitoring client (openvas-‐monitoring-‐client), and one or more monitoring scanners (openvas-‐monitoring-‐manager).
The openvas-‐monitoring-‐manager runs a scan on the same machine it is installed on, in order to find potential vulnerabilities. It exposes an interface useful to manage the scan and to make the reports available to the openvas-‐monitoring-‐client. The openvas-‐monitoring-‐manager is composed of the OpenVAS Scanner and the OpenVAS Manager. The former executes the actual Network Vulnerability Tests (NVTs), while the latter is the central service that consolidates plain vulnerability scanning into a full vulnerability management solution. The OpenVAS Manager controls the Scanner via OTP (OpenVAS Transfer Protocol) and offers the XML-‐based, stateless OpenVAS Management Protocol (OMP).
The openvas-‐monitoring-‐client is able to control all the openvas-‐monitoring-‐manager: in fact, it is able to start a new scan and to retrieve the results. It consists of two components: OpenVAS CLI and custom-‐openvas-‐adapter. The former contains the command line tool "omp", which enables the creation of batch processes to drive OpenVAS Manager (inside the openvas-‐monitoring-‐manager); the latter is a custom java program that uses the “omp tool” in order to have a full control of the scan of a target machine. Each time it receives a new event (that is, a new vulnerability found on the target machine and sent by the openvas-‐monitoring-‐manager), it sends the event to the specs-‐monitoring-‐core in the appropriate format. It also sends a full report when the scan finishes.
The components needed to implement and deploy all OpenVAS components are the chef-‐client and the chef-‐server. In particular, these components are dynamically deployed on VMs using the Chef cookbook named “specs-‐monitoring-‐openvas”, available online in the SPECS public repository [10] :
https://bitbucket.org/specs-team/specs-monitoring-openvas
SPECS monitoring services -‐ Initial
SPECS Project – Deliverable 3.4.1
23
The cookbook contains two recipes, client and manager, to install the necessary components.
4.3.1.1. OpenVAS Manager and Scanner -‐ Chef managers recipe This recipe installs and configures the OpenVAS Manager and OpenVAS Scanner on the target machine (the machine that has to be monitored). The agent is provided as a tar.gz file (openvas-libs-libraries-scanner-manager.tar.gz) that is hosted within the cookbook itself.
4.3.1.2. OpenVAS Client -‐ Chef client recipe This recipe installs the OpenVAS CLI and the custom-‐openvas-‐adapter on a provisioned VM. Both are provided as tar.gz files that are hosted within the cookbook itself. This recipe activates also the adapter component, starting a scan on each agent that has been previously installed.
4.3.2. Installation The execution of the two recipes introduced above has the following prerequisites: ● All the VMs should run OpenSuse OS, 64 bit version. ● The manager recipe has to be executed on all the target nodes before the execution of
the client recipe. ● It is compulsory to have a tool that is able to execute recipes (e.g., a workstation with
knife tool installed, a software that uses Apache Jcloud Chef Api). ● The agent recipe needs the TCP port 9390 to be opened on the hosted VM.
○ e.g., On Amazon AMI,you need to: (i) have access to amazon console; (ii) add an inbound rule into the security group [Custom TCP rule]
All the inputs necessary to execute these recipes are provided by the implementation plan that has to be uploaded on the chef-‐server as data bag item into data bag “implementation_plans”. The manager recipe does not need any input. The agent recipe needs the following data in order to correctly execute the manager functions, retrieved through the implementation_plan given as input: ● specs-‐monitoring-‐core ip address and port; ● List of all ip addresses and names of the VMs that hosts openvas-‐monitoring-‐manager.
Each implementation_plan is identified by a unique id (“implementation_plan_id”) that has to be passed as node_attribute during the node bootstrapping phase.
The structure of the knife command to bootstrap the node and install openvas-‐monitoring-‐manager on one target machine is:
knife bootstrap <IP_PUBLIC> -x <user_name> -P <user_password> --node-name <node_name> --run-list 'recipe['specs-monitoring-openvas::manager]' -j '{ "implementation_plan_id":"<id_value>"}'
A typical example is:
SPECS monitoring services -‐ Initial
SPECS Project – Deliverable 3.4.1
24
knife bootstrap 192.168.1.101 -x root -P specs --node-name agent-node1 --run-list 'recipe['specs-monitoring-openvas::manager]' -j '{ "implementation_plan_id":"1154982"}'
The structure of the knife command to bootstrap the node and install openvas-‐monitoring-‐client on one VM is:
knife bootstrap <IP_PUBLIC> -x <user_name> -P <user_password> --node-name <node_name> --run-list 'recipe['specs-monitoring-openvas::client]' -j '{ '{ "implementation_plan_id":"<id_value>"}'}'
A typical example is:
knife bootstrap 192.168.1.103 -x root -P specs --node-name server-node --run-list 'recipe['specs-monitoring-openvas::client]' -j '{ "implementation_plan_id":"1154982"}'
4.3.3. Usage Upon execution of the recipes explained above, all the architecture components are installed on the VMs and the vulnerability scan is launched on each target machine. The reports of each scan are collected by the openvas-‐monitoring-‐client and manipulated by the custom-‐openvas-‐adapter that formats and sends them to the specs-‐monitoring-‐core. It is possible to execute a new vulnerability scan manually, connecting via ssh to the node that hosts the openvas-‐monitoring-‐client, and launching the following script:
java -jar openvas-monitoring-client.jar <IP_MACHINE_TARGET><IP_SPECS_MONITORING_CORE> 9390 <IP_SPECS_MONITORING_PORT>
Openvas generates a set of SPECS monitoring events, as reported in <specs-monitoring-openvas>/doc/monitoring_events/events.txt.
4.4. NMAP Monitoring System and Adapter Nmap [11] is a widely-‐used command line utility for network discovery and monitoring. It can be used to scan for open ports, operating system version, service version, uptime and other characteristics of a target machine or network.
4.4.1. Status of integration activities We propose a fault tolerant distributed system based on Nmap, and possible other tools, for scanning target hosts and networks. The system will store the result for later retrieval, audit and statistics purposes.
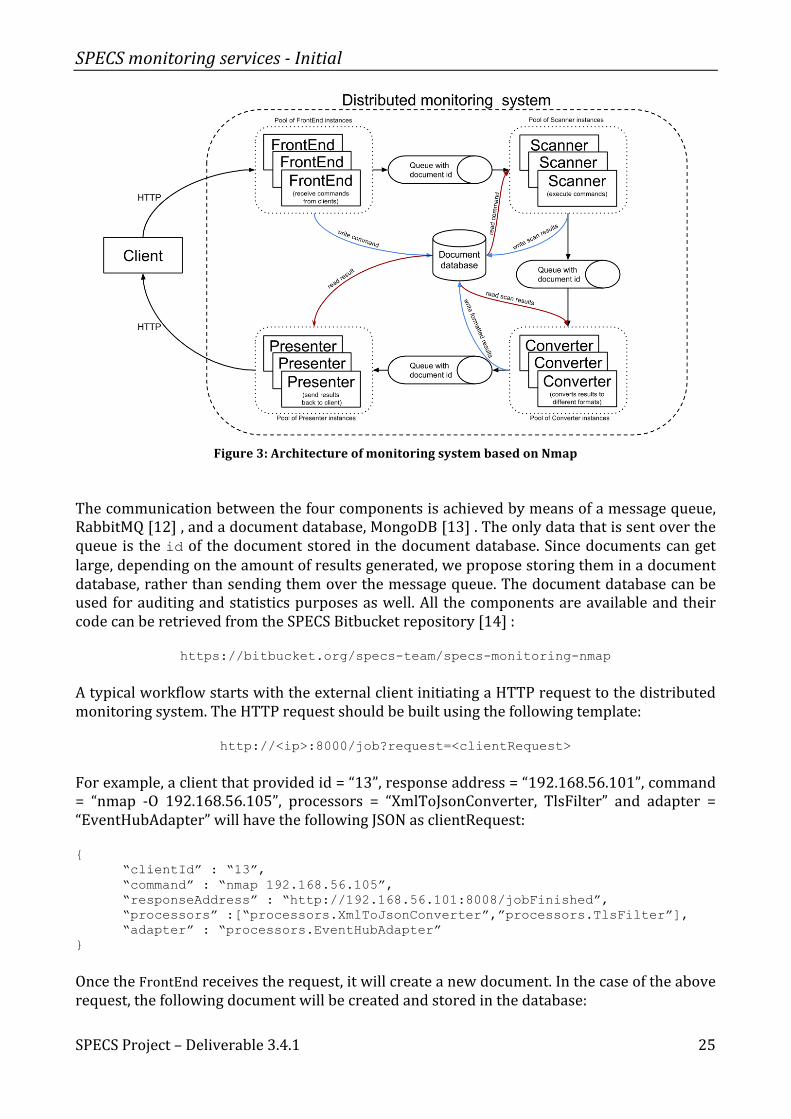
The distributed monitoring system is composed of four components, as shown in Figure 3: FrontEnd, Scanner, Converter and Presenter. Each of the four components can be replicated and distributed on multiple machines, depending on the load of that particular component. For example, we can have three FrontEnd replicas, ten Scanner replicas, five Converters replicas and three Presenter replicas.
SPECS monitoring services -‐ Initial
SPECS Project – Deliverable 3.4.1
25
Figure 3: Architecture of monitoring system based on Nmap
The communication between the four components is achieved by means of a message queue, RabbitMQ [12] , and a document database, MongoDB [13] . The only data that is sent over the queue is the id of the document stored in the document database. Since documents can get large, depending on the amount of results generated, we propose storing them in a document database, rather than sending them over the message queue. The document database can be used for auditing and statistics purposes as well. All the components are available and their code can be retrieved from the SPECS Bitbucket repository [14] :
https://bitbucket.org/specs-team/specs-monitoring-nmap A typical workflow starts with the external client initiating a HTTP request to the distributed monitoring system. The HTTP request should be built using the following template:
http://<ip>:8000/job?request=<clientRequest>
For example, a client that provided id = “13”, response address = “192.168.56.101”, command = “nmap -‐O 192.168.56.105”, processors = “XmlToJsonConverter, TlsFilter” and adapter = “EventHubAdapter” will have the following JSON as clientRequest: { “clientId” : “13”, “command” : “nmap 192.168.56.105”, “responseAddress” : “http://192.168.56.101:8008/jobFinished”, “processors” :[“processors.XmlToJsonConverter”,”processors.TlsFilter”], “adapter” : “processors.EventHubAdapter” }
Once the FrontEnd receives the request, it will create a new document. In the case of the above request, the following document will be created and stored in the database:
SPECS monitoring services -‐ Initial
SPECS Project – Deliverable 3.4.1
26
{ “id” : “56”,
“clientId” : “13”, “responseAddress” : “192.168.56.101”, “command” : “nmap –O 192.168.56.105”, “processors” :[“processors.XmlToJsonConverter”,”processors.TlsFilter”],
“adapter” : “adapters.EventHubAdapter”, “rawResult” : null, “processedResult” : null
}
Once it has saved the new document in the document database, the FrontEnd component will send the document id to the Scanner component. The Scanner component executes the command from the document and stores the results, in XML format, in the rawResult field. Once it has finished updating the rawResult field, the Scanner component will send the id of the document to the Converter component. The Converter is responsible for applying the processors and the adapter to the rawResult. After all processing is finished, the result is stored, in JSON format, in the processedResults field and the Converter component sends the id of the document to the Presenter component. The Presenter has the role of sending the result to the HTTP address provided by the client that is stored in the responseAddress field.
All the components are functional and the system can be deployed on a local machine or an IaaS cloud.
4.4.2. Installation The four components (FrontEnd, Scanner, Converter and Presenter) are written in Java and require JRE 1.8 [15] in order to run. Each component provides a configuration file, conf.properties, used to specify the IP address of the machine hosting RabbitMQ, the IP and the port for the machine hosting MongoDB, the names of the queue used in order to send and receive messages and the credentials for RabbitMQ. A conf.properties example is the following:
#RabbitMQ connection details rabbitHost = 192.168.56.102 rabbitSendQueue = xmls rabbitReceiveQueue = commands rabbitUser = specsUser rabbitPassword = specsPassword #MongoDB connection details mongoHost = 192.168.56.101 mongoPort = 27017
MongoDB version 2.6.3 or newer is required for storing the documents, RabbitMQ version 3.4.4 or newer for the message queue, and Nmap version 6.40 or newer for executing the commands.
4.4.3. Usage The distributed monitoring system can be used as a PaaS for security auditing. The client can interact with the platform via HTTP, by sending commands, processors and an adapter that will be executed by the platform and providing a HTTP address where the result can be sent after the command has finished executing. For example, curl -G "http://localhost:8000/job" --data-urlencode 'request= {
SPECS monitoring services -‐ Initial
SPECS Project – Deliverable 3.4.1
27
“clientId” : “13”, “command” : “nmap 192.168.56.105”, “responseAddress” : http://192.168.56.101:8008/jobFinished,
“processors” :[“processors.XmlToJsonConverter”,”processors.TlsFilter”], “adapter” : “adapters.EventHubAdapter” }'
The server will analyse the request and will replay with a JSON that contains the status of the request, valid or invalid, and, in case the request is valid, the id assigned to the job. For example:
{ “status” : “valid”, “jobId” : “55190d32f0027372c8034a0a” }
After accepting the request, the monitoring system will immediately start processing the request. If the message is intended to be consumed by the Event Hub, the EventHubAdapter should be used. This adapter creates a message that is compatible with the messages accepted by the hub. Since the client can choose the command to be executed, the processors to be applied, and the adapter, the structure of the response message may vary. For example:
{ "component": "551948b3545063d8ad53b743", "object": "nmap", "labels": [ "userId-13" ], "type": "ssl-enum-ciphers", "data": { "elem": [ { "key": "name", "content": "TLS_RSA_WITH_AES_128_CBC_SHA" }, { "key": "strength", "content": "strong" } ] }, "timestamp": "1427721690", "token": null }
SPECS monitoring services -‐ Initial
SPECS Project – Deliverable 3.4.1
28
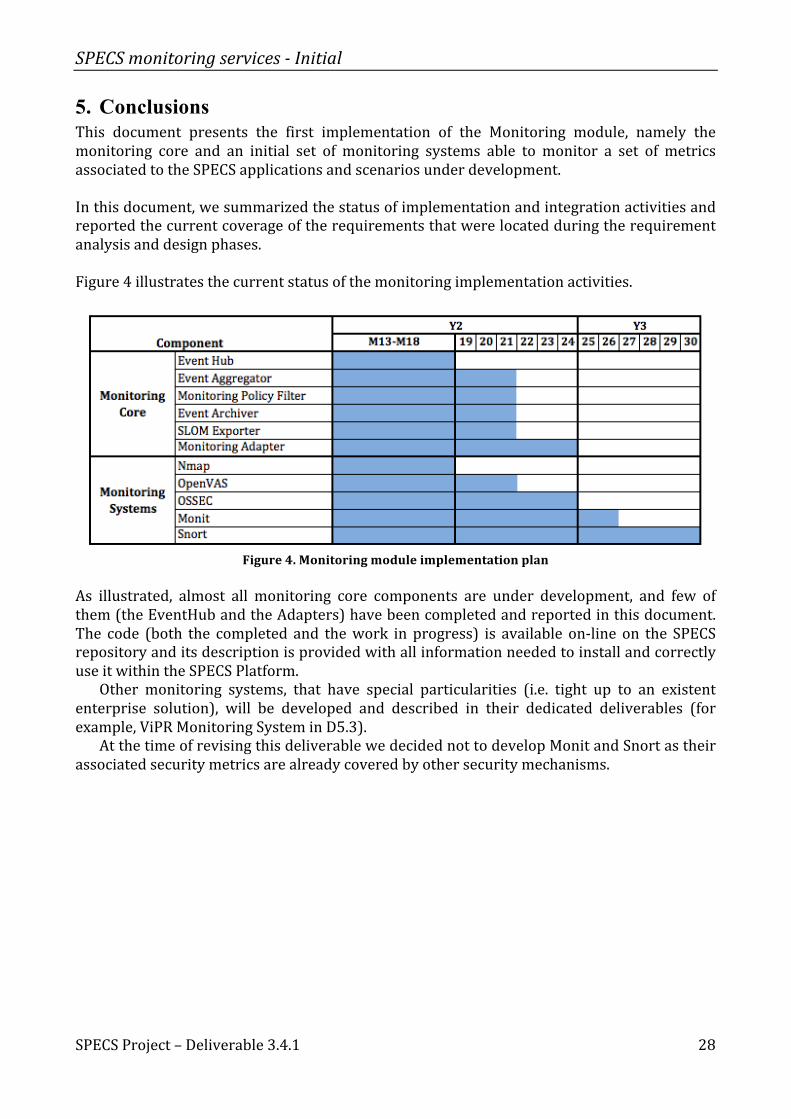
5. Conclusions This document presents the first implementation of the Monitoring module, namely the monitoring core and an initial set of monitoring systems able to monitor a set of metrics associated to the SPECS applications and scenarios under development. In this document, we summarized the status of implementation and integration activities and reported the current coverage of the requirements that were located during the requirement analysis and design phases. Figure 4 illustrates the current status of the monitoring implementation activities.
Figure 4. Monitoring module implementation plan
As illustrated, almost all monitoring core components are under development, and few of them (the EventHub and the Adapters) have been completed and reported in this document. The code (both the completed and the work in progress) is available on-‐line on the SPECS repository and its description is provided with all information needed to install and correctly use it within the SPECS Platform.
Other monitoring systems, that have special particularities (i.e. tight up to an existent enterprise solution), will be developed and described in their dedicated deliverables (for example, ViPR Monitoring System in D5.3).
At the time of revising this deliverable we decided not to develop Monit and Snort as their associated security metrics are already covered by other security mechanisms.
SPECS monitoring services -‐ Initial
SPECS Project – Deliverable 3.4.1
29
6. Bibliography
[1] http://hekad.readthedocs.org/en/v0.9.1/installing.html [2] https://bitbucket.org/specs-‐team/specs-‐monitoring-‐eventhub [3] https://golang.org/project/ [4] https://github.com/toml-‐lang/toml [5] https://bitbucket.org/specs-‐team/specs-‐enforcement-‐chef-‐repo/ [6] http://www.open-‐scap.org/page/Main_Page [7] http://oval.mitre.org/ [8] https://oval.mitre.org/repository/data/updates/latest [9] https://bitbucket.org/specs-‐team/specs-‐monitoring-‐ossec [10] https://bitbucket.org/specs-‐team/specs-‐monitoring-‐openvas [11] http://nmap.org [12] http://www.rabbitmq.com [13] https://www.mongodb.org [14] https://bitbucket.org/specs-‐team/specs-‐monitoring-‐nmap [15] http://www.oracle.com/technetwork/java/javase/downloads/jre8-‐downloads-‐
2133155.html