
Species, Habitats and Ecosystems · Species, Habitats and Ecosystems (TAG3) February, 2011 . ......
95
Washington State Integrated Climate Change Response Strategy Photo Credit: Spencer Reeder Interim Recommendations from Topic Advisory Group 3 Species, Habitats and Ecosystems (TAG3) February, 2011 Preparing for a Changing Climate: Washington State's Integrated Climate Response Strategy Publication: 12-01-004q Appendix B3
Transcript of Species, Habitats and Ecosystems · Species, Habitats and Ecosystems (TAG3) February, 2011 . ......
Washington State Integrated Climate Change Response Strategy
Photo Credit: Spencer Reeder
Interim Recommendations from
Topic Advisory Group 3
Species, Habitats and Ecosystems
(TAG3)
February, 2011
Preparing for a Changing Climate: Washington State's Integrated Climate Response Strategy Publication: 12-01-004q Appendix B3

Acknowledgments This Interim Report is a collaborative product, representing many hours of dedicated work by the
members of TAG3. Members participated actively at full group meetings, and joined subgroups to craft strategies for specific ecological systems. The co-chairs would like to express our gratitude to each and every TAG member and all those who participated in the subgroups, not only for the enormous contribution in producing this report, but for making the process itself rewarding and enriching. The TAG3 co-chairs, Lynn Helbrecht, Anna Jackson and Pene Speaks guided the TAG in its work and coordinated development of the interim report.
Special Thanks to:
Lara Whitely-Binder (Climate Impacts Group) for drafting the narrative and tables in Chapter II and in supporting the TAG’s work throughout by providing appropriate reference material when needed.
Dan Siemann and Erin Morgan (National Wildlife Foundation) for researching and preparing the four Science Summaries on Climate Impacts for specific ecological systems.
Jennie Hoffman (EcoAdapat) for assistance in framing and drafting portions of the report.
Chris Konrad, Cathy Baker, John Pierce, Pene Speaks for chairing subgroups.
Kara Nelson of TNC for her assistance with framing and supporting the TAG3 process.
TAG3 Membership
Harriet Beale, Dept. of Ecology/Water Quality
Cathy Baker, The Nature Conservancy
Wendy Brown, RCO/Executive Coordinator, Invasive Species Council
Margen Carlson, WDFW/Intergovernmental Policy
Scott Chitwood, Jamestown Tribe/Natural Resources Director
Lisa Randlette, DNR/Policy/Aquatic Resources Division
Tom Dwyer, Ducks Unlimited
Lynn Helbrecht, WDFW/Climate Change Coordinator
Anna Jackson, WDFW/Environmental Policy Lead
Bob Kehoe, Purse Seine Vessel Owners Association (comm. fishing)
John Kerwin, WDFW/Fish Program
Chris Konrad, USGS/River Science Coordinator, Global Freshwater Team.
Meade Krosby, UW/Department of Biology
Josh Lawler, UW/School of Forest Resources
Mary Mahaffy, USFWS/NPLCC Interim Science Coordinator
Kim Mellen-Mclean, USFS/Regional wildlife ecologist
Dave Peeler, People for Puget Sound
Paul Pickett, Ecology/Environmental Assessment Program
John Pierce, WDFW/Wildlife Program Chief Scientist
Mark Quinn, Washington Wildlife Federation
Kenneth Raedeke, Game Management Advisory council
Phil Rigdon, Yakama Nation/Natural Resources Director
Dan Siemann, National Wildlife Federation
Pene Speaks, DNR/Forest Resources and Conservation
Jen Steger, NOAA/Restoration Center
Ron Tressler, Seattle City Light, Environmental Affairs/Natural Resources
Jennifer Vanderhoof, Senior Ecologist, King County Water/Land Resources Division
Paul Wagner, WSDOT/Habitat Connectivity
Lara Whitely Binder, UW/Climate Impacts Group

TABLE OF CONTENTS I Introduction ................................................................................................ 1 II Ecological Consequences of Climate Change .............................................. 4
III Priority Strategies and Actions .................................................................. 16 IV Overarching Considerations and Next Steps .............................................. 29
V References Cited ....................................................................................... 33
Appendices
A. Specific Adaptation Strategies for Ecological Systems .......................... 35 Marine/Coastal ................................................................................ 35 Forests/Prairies ................................................................................ 43 Aridlands ........................................................................................... 55 Freshwater/Aquatic ......................................................................... 65
B. Summary of Climate Impacts ................................................................ 74 C. General Criteria for Prioritizing Adaptation Actions ............................. 86 D. Glossary ................................................................................................ 90
E. Science Summaries (SEPARATE DOCUMENT)

TAG3 Interim Report February/2011 1 | P a g e
I. INTRODUCTION
PURPOSE AND BACKGROUND
This document was prepared to inform the development of a statewide, integrated climate change
response strategy, as required by state legislation passed in 2009. The Steering Committee
guiding the development of that strategy formed four separate topic advisory groups (TAGs) to
develop draft recommendations for different sectors; TAG3 was directed to consider impacts,
key vulnerabilities and draft adaptation strategies for species, habitats and ecosystems across
Washington. Approximately 30 individuals representing a range of organizations and
perspectives participated in the TAG’s work.
This report should be considered as interim. The recommendations presented represent the best
thinking of the individuals participating in the TAG3 process at the time the report was drafted.
While a number of experts were consulted during development, the limited time and resources
available did not allow for extensive peer review of draft recommendations or iterative review
and comment. Ultimately, development and implementation of an effective adaptation strategy
will require more extensive participation by those charged with implementing and overseeing it.
This will ensure that adaptation strategies reflect both scientific information and the management
structure within which strategies will be carried out.
TAG3 GOALS AND ORGANIZATION
One of the first tasks of the TAG was to adopt two goals to guide its work: 1) Ensure the long-
term viability of ecosystems in Washington, including ecosystem integrity, ecosystem services,
and the ecological processes they depend on, and 2) Maintain biodiversity, with an awareness of
the needs of climate-sensitive species.
The TAG also determined early in its process that since the specific ecological consequences
from climate change will vary by ecosystems, adaptation strategies should also be evaluated
separately for each major system. The TAG therefore elected to work in four separate subgroups;
Marine/Coastal, Freshwater/Aquatic, Forests and Western Prairies, and Aridlands. Each group
reviewed current scientific literature for observed and projected impacts from climate change and
then identified a set of strategies and possible actions. Reports from each group are presented in
Appendix A. The Science Summaries used to provide current and projected impacts were
prepared by the National Wildlife Federation and are available in Appendix E, found in a
separate document.
ADDRESSING CLIMATE IMPACTS TO SPECIES AND ECOSYSTEMS IS CRITICAL
Addressing impacts to species and ecosystems is a critical component of a comprehensive state
adaptation strategy. Washington citizens rely on our many varied ecosystems for a wide range of
benefits; for provisioning services such as clean water, fiber and food, for regulating services
such as flood control and erosion control, pollination of crops, and cultural services such as

TAG3 Interim Report February/2011 2 | P a g e
outdoor recreation opportunities. Climate change puts our ecosystems, and the life supporting
benefits they provide, at risk. Chapter II discusses in more depth the ecological consequences of
projected climate impacts and how they may affect the delivery of ecosystem services to human
communities, with examples of the economic costs which occur with the disruption of ecosystem
services
KEY CONCEPTS1
There is no single best approach for developing adaptation strategies for species and ecosystems.
Depending on any number of factors, conservation practitioners may opt for one of three basic
conceptual approaches – resistance, resilience or response. TAG3 used each of these concepts
(explained below) in developing the goals and priority strategies presented in this document.
1 Additional definitions can be found in the glossary in Appendix D.
[Type a quote from the document or the
summary of an interesting point. You can
position the text box anywhere in the
document. Use the Text Box Tools tab to
change the formatting of the pull quote text
box.]
Resistance focuses on minimizing the impact of global climate change on a
particular system, either by limiting local or regional climatic changes or
minimizing the effect of changes that do occur. Examples from the built
environment include using light-colored roofs to limit heating in cities or
maintaining dikes and levees around low-lying cities to prevent flooding.
Examples from the conservation world include maintaining or restoring
riparian vegetation to reduce warming in cold water systems, or restoring
wetlands to reduce drought and flooding.
Resilience means that a population or system is able to bounce back to
something like its previous state following disturbance or change, with
ecological functions and processes still intact. Many of the recommended
strategies to address the risks of catastrophic fire for both built and natural
systems are focused on increasing the resilience of a system to recover from
the disturbance.
Response: There is some level of change beyond which a system becomes
irrevocably altered. In these situations, management can focus on facilitating
longer-term species or system responses to maintain desired resources or
ecosystem services over time. A related concept is the idea of “preserving
the canvas.” The philosophy here is essentially one of facilitating natural
responses to change rather than trying to maintain the status quo. Examples
from the built environment include rolling easements and other mechanisms
of managed retreat from sea level rise. Examples from the conservation
world include maintaining ecosystem connectivity to support species range
shifts or including likely future habitat in critical habitat designations.

TAG3 Interim Report February/2011 3 | P a g e
Another concept to consider in developing climate change adaptation strategies is the risk of
maladaptation. Most adaptation actions require some sort of trade-off. When the negatives of an
adaptation action or strategy outweigh the benefits, it becomes a maladaptation. Maladaptations
may include: strategies that benefit one sector or community at the expense of others; strategies
that decrease near-term harm but increase long-term vulnerability; strategies that result in
increased greenhouse gas emissions or otherwise increase the rate or extent of global or regional
change; economic actions or strategies that reduce incentives to adapt or set paths that limit
choices available to future generations.
HOW THIS REPORT IS ORGANIZED
There are four chapters in the main body of the report: Chapter I introduces the report, Chapter
II summarizes climate change impacts and consequences, and Chapter III includes recommended
goals, priority strategies and near-term actions. Chapter IV introduces key issues which should
be considered for further development in the context of the statewide integrated response
strategy. The appendices provide further depth and background. Appendix A includes both
narrative and tables describing adaptation strategies and actions for each of the four ecological
systems. Appendix B is a summary of projected climate impacts for Washington, provided by
the Climate Impacts Group. Appendix C includes information on prioritizing adaptation options,
Appendix D is a glossary of key terms, and Appendix E contains the four science summaries
which summarize climate impacts separately for each ecological system.

TAG3 Interim Report February/2011 4 | P a g e
II ECOLOGICAL CONSEQUENCES OF CLIMATE CHANGE
Climate change has already led to demonstrable impacts to
many species, habitats and ecosystems in Washington
State. For example, sea levels have risen along our shores,
threatening productive coastal ecosystems for our fish,
shellfish, seabirds and other species. Summer temperatures
in some rivers and streams already exceed temperature
thresholds that are stressful or fatal for coldwater fish such
as salmon and bull trout (Mantua et al. 2010).
Temperatures are continuing to rise, and scientists estimate
that, globally, approximately 20-30% of plant and animal
species assessed to date could be at an increased risk of
extinction if temperatures exceed 2.7°F to 4.5°F (IPCC
2007). These changes have the potential to fundamentally
alter many ecosystems in the state, and dramatically affect
the services and products they provide to human
communities. The following section describes anticipated
changes, the ecological impacts of those changes and some
potential effects on ecosystem services.
ECONOMIC VALUE OF ECOSYSTEM SERVICES
Washington’s diverse ecosystems, species, and habitats
provide a complex range of goods and services,
collectively referred to as ―ecosystem services,‖ that
benefit Washington residents. These services include food
production; fiber, timber, and fuel production; biodiversity;
climate regulation (e.g., carbon storage, carbon
sequestration; temperature regulation; storm protection;
maintenance of soil fertility and health; water quality;
spiritual and cultural sustenance, and recreation). A list of
common ecosystem services is provided in Box 1.
Although it is difficult to calculate the full economic value
of many ecosystem services, the economic value associated
with some aspects of ecosystem services have been calculated for Washington. For example:
Habitat provided by marine and coastal ecosystems in Washington State sustain
commercial and recreational fishing that directly and indirectly supported over 16,000
jobs and $540 million in personal income in 2006 (TCW Economics 2008).
Washington’s biodiversity supported hunting, fishing, and wildlife viewing activities that
added nearly $3.1 billion to Washington’s economy in 2006 (U.S. Department of the
Interior 2006).
Box 1. Examples of Ecosystem Services Provisioning Services:
Food production
Fiber, timber, and fuel production
Maintaining genetic resources
Regulating Services:
Climate regulation (e.g., carbon storage,
carbon sequestration; temperature
regulation)
Regulating river flows and groundwater
levels
Flood/storm protection
Water filtration/water quality
Preventing soil erosion
Soil formation
Habitat maintenance and regeneration
Providing shade, shelter, refugia
Insect/pest control
Waste absorption and breakdown
Maintaining the distribution, abundance,
and effectiveness of pollinators
Supporting Services:
Nutrient cycling (e.g., converting
nitrogen, carbon, and phosphorus from
unusable to usable forms)
Maintaining soil fertility, health
Water cycling
Cultural Services:
Recreation Aesthetic value
Education and research
Maintaining tribal cultural practices Adapted from UNEP 2006, Table 1.1; Ecosystem
Services Project (2011); Batker et al. 2010, Table 1

TAG3 Interim Report February/2011 5 | P a g e
Nitrogen removal by shellfish production in Oakland Bay (near Shelton, WA) provides
approximately $77,000 and $650,000 in annual water quality treatment benefits for
wastewater treatment facilities in the City of Shelton and the City of Olympia,
respectively (Hudson 2010).
One local study found that wetlands provide over $40,000 per acre of flood damage
protection in Renton (Leschine, 1997). A recent pilot study for King County
demonstrated that flood hazard reduction projects that widen the floodway of the Cedar
River could avoid $468 to $22,333 per acre per year in damages to homes and county
flood control facilities (Swedeen and Pittman, 2007).
A 2010 report on the annual value of ecosystem services in the Puget Sound watershed alone
conservatively estimated the partial value of 14 ecosystem services at $9.7 billion to $83 billion
annually (Batker et al. 2010). These services included gas and climate regulation, disturbance
regulation (e.g., flood control), water supply, waste treatment, and habitat refugia.
HOW CLIMATE CHANGE DRIVERS MAY IMPACT ECOSYSTEMS AND THE SERVICES THEY
PROVIDE
Provision of ecosystem services depends on preservation of key physical and ecological
relationships within a system, much as the functioning of a car relies on a specific arrangement
of car parts (Barclay et al. 2004). Climate change has the potential to impact many ecosystem
services by affecting the key relationships that support those services. For example, coastal
marshes act as important buffers against coastal erosion and infrastructure damage from storm
surge. Sea level rise may ―squeeze out‖ coastal marshes that do not have the ability to migrate
inland in response to rising water levels (for example due to the presence of paved roads or other
hard infrastructure), reducing and in some cases eliminating the natural protection they provide.
Research on Pacific Northwest climate change impacts by the University of Washington Climate
Impacts Group (e.g., Climate Impacts Group 2009) and others have identified numerous climatic
changes and associated impacts that are likely to have ecological consequences for Washington’s
ecosystems, species, and habitats and impact the ecosystem services they provide. Projected
physical changes include, but are not limited to those on the following bulleted list. Box 2
describes examples of how ecosystem services will be affected by these changes.

TAG3 Interim Report February/2011 6 | P a g e
PROJECTED PHYSCIAL CHANGES:
Increasing air temperature. Global climate models project
increases in average annual Pacific Northwest temperature
(with range) of +2.0°F (+1.1 to 3.4°F) by the 2020s, +3.2°F
(+1.6 to 5.2°F) by the 2040s, and +5.3°F (+2.8 to 9.7°F) by
the 2080s, relative to 1970-1999. Warming is expected
across all seasons with the largest warming expected in the
summer months. (Mote and Salathé 2010)
Changes in annual and seasonal precipitation. Projected
changes in annual precipitation, averaged over all models,
are small (+1 to +2% for much of the 21st century) but some
models project a stronger seasonal precipitation cycle with
wetter autumns and winters and drier summers. (Mote and
Salathé 2010)
Declining snowpack. April 1 snowpack is projected to
decline in mid and low elevation basins as warmer cool
season (Oct-March) temperatures cause more winter
precipitation to fall as rain rather than snow and earlier
spring snowmelt. Average April 1 snowpack is projected to
decline -37% (for the B1 greenhouse gas emissions scenario)
or -44% (for the A1B scenario) by the 2040s, and -53% (B1)
or -65% (A1B) by the 2080s, relative to the 1916-2006
historical average. (Elsner et al. 2010)
Changes in the timing of streamflow runoff, low flows,
and flood risk. Declining winter snowpack, shifts to more
winter rain, and earlier spring snowmelt are projected to shift
the timing of peak spring runoff earlier into the year and
reduce summer streamflows in transient (rain/snow mix) and
snow-dominant watersheds. Low elevation rain-dominant
basins are also likely to see lower summer streamflows as a
result of warmer summer temperatures, although
groundwater contributions to base streamflow may help
offset declines in late summer streamflow. Flood risk
increases in some basins, particularly transient basins west of
the Cascades, and decreases in other basins, including east-
side snowmelt dominant watersheds. In all cases, results will
vary by location and basin type. (Elsner et al. 2010; Mantua
et al. 2010; Tohver and Hamlet 2010)
Box 2. Examples of Impacts on
Ecosystem Services
Impacts on food production, due
for example, to losses in spawning
and breeding grounds for fish.
Impacts on fiber, timber, and fuel
production due for example, to
shifts in commercial timber
species, and losses from increased
disturbances, such as fire.
Reduced water quality, due for
example, from lower flows and
increased sediment and pollutant
loads.
Impacts on water supply for
communities, agriculture, and
wildlife due for example, from
declining snowpack, reduced
groundwater recharge, reduced
contributions to summer
streamflow in certain rivers and
streams.
Reduced erosion and flood
protection, particularly in unstable
areas after disturbance, or in areas
where sea level rise reduces
coastal habitats that usually
provide buffering capacity.
Impacts on recreation and related
economic activities, such as fishing
and snow skiing.
Impacts on culturally significant
species, practices, sites of
importance to tribes.

TAG3 Interim Report February/2011 7 | P a g e
Impacts on soil moisture. Warmer temperatures, declining snowpack, and related changes
in hydrology are projected to cause modest reductions overall in July 1 soil moisture, with
more significant decreases projected in the Cascades and Olympic Mountains. Some areas in
south central Washington may see slight increases in July 1 soil moisture as a result of
increasing winter and spring precipitation in some climate scenarios. (Elsner et al. 2010)
Increasing summer water temperature. Warmer summer air temperatures are projected to
increase summer stream temperatures, likely reducing the quality and extent of freshwater
habitat for coldwater adapted species such as salmon. The duration of periods that cause
thermal stress and migration barriers for salmon is projected to at least double (under the B1
greenhouse gas emissions scenario) and perhaps quadruple (for the A1B scenario) by the
2080s for many streams and lakes. As with other hydrologic impacts, results will vary by
location. (Mantua et al. 2010)
Increased risk of forest fires and impacts from insects such as the mountain pine beetle.
Due to increased summer temperature and decreased summer precipitation, the area burned
by fire regionally is projected to double by the 2040s and triple by the 2080s (relative to
1916-2006). The probability that more than two million acres will burn in a given year is
projected to increase from 5% (observed) to 33% by the 2080s. Primarily east of the
Cascades, mountain pine beetles will likely reach higher elevations and pine trees will likely
be more vulnerable to attack by beetles. (Littell et al. 2010)
Increasing sea level. Sea level is projected to increase in Washington State although specific
projections vary by location depending on differences in vertical land movement, the
influence of onshore winds, and other factors. For the three regions analyzed in Mote et al.
2008, the projected medium change (with range) in Washington sea level in 2100 is +2" (-9
to +35") for the Northwest Olympic Peninsula, +11" (+2 to 43") for the central and southern
coast, and 13‖ (+6 to 50") for Puget Sound. (Mote et al. 2008)
Potential for more extremes, including precipitation, heat, and coastal storms. More
intense precipitation is projected, although the spatial pattern of this change and the changes
in intensity are 1) highly variable, and 2) not statistically significant for much of the state
(Salathé et al. 2010). For extreme heat, the average annual number of heat events, average
heat event duration, and maximum heat event duration are expected to increase in all
scenarios and all four regions (Seattle, Yakima, Spokane, and the Tri-Cities region) evaluated
by Jackson et al. 2010. Projected intensification of mid-latitude2 winter season storm tracks
is likely to increase coastal storm intensity (i.e., precipitation and winds) (Ulbrich et al.
2008).
Increasing ocean acidification. The pH in the North Pacific, which includes the coastal
waters of Washington State, is projected to decrease 0.2 and 0.3 units with increases in the
atmospheric concentration of CO2 to 560 and 840 ppm, respectively. This projected decrease
2 Mid-latitudes‖ are the areas lying between the tropics and the polar regions, or approximately 30° to 60° north or south of the
equator.
TAG3 Interim Report February/2011 8 | P a g e
in pH is equivalent to a 100-150% increase in the hydrogen ion concentration or ―acidity‖ of
the oceans. (Feely et al. 2009)
More details about these and other impacts are provided in the four ―Science Summaries‖
prepared for each ecological system (see Appendix E), the climate impacts summary table in
Appendix B, and the individual papers cited herein. Table 2.1 illustrates how projected climatic
changes and associated impacts may produce ecological consequences that impact ecosystem
services in Washington.
Climate change is not the only issues facing ecosystems, habitats, and species, however. Existing
problems with pollution, habitat fragmentation, reduced genetic and species diversity, and
competition from invasive and exotic species can reduce the adaptive capacity of ecosystems,
habitats, and species. Human responses to climatic change and associated impacts may also
affect ecosystems, habitats, and species in negative ways. For example, increased groundwater
pumping in response to warmer temperatures and growing water demands could reduce
groundwater contributions to summer streamflow, increasing the potential for warmer summer
stream temperatures and increased thermal stress for coldwater adapted species. Water levels in
wetland systems could also be impacted. Levees installed for flood protection may restrict
channel migration, limiting the diversity of riparian habitat. Consequently, it is critical to
consider how Washington’s ecosystems, habitats, and species can adapt to both the direct and
indirect (e.g., human) impacts of climate change in the context of existing stressors.

TAG3 Interim Report February/2011 9 | P a g e
TABLE 2.1: Projected Climate Change Impacts, Ecological Consequences, and Impacts on Ecosystem Services3
Ecosystem Examples of Projected Physical and
Chemical Changes
Examples of Potential Ecological
Consequences (with primary drivers)4
Examples of Potential Impacts on
Ecosystem Services
Marine &
Coastal
1. Sea level rise. Projected increase in Puget
Sound of +6” (range: 3-22”) by 2050 and
+13” (range: 6-50”) by 2100.
2. Ocean acidification. Ocean pH is projected
to decrease in the North Pacific and Puget
Sound due to increased concentrations of
CO2 in the atmosphere.
3. Increasing sea surface temperature. Sea
surface temperature is projected to increase
+2.2°F for the 2040s.
4. Increasing coastal storm intensity projected
(i.e., more intense precipitation and winds).
5. Altered hydrology. More winter rain,
warming temperatures, and declining
snowpack are projected to significantly
increase Oct-March streamflow and reduce
April-Sept streamflow. Flood risk increases
in some basins, particularly west-side
transient (rain/snow mix) basins. These
changes will affect freshwater inflow to
Reduced and/or lost coastal habitats (1-4)
Changes in the distribution of coastal habitats (1-
5)
Loss of spawning grounds, rearing grounds, and
key foraging and resting sites (1-5)
Reduced and/or lost habitat connectivity
(1-4)
Increased coastal erosion (1,4)
Increased coastal hypoxia (3,5)
Shifts in species migration and distribution, e.g.,
salmon migration ranges may shift due to sea
surface temperature changes (1-5)
Changes in food webs, e.g., shifts in
phytoplankton diversity (1-5)
Impacts to marine and coastal water quality
(2,3,5)
Impacts on range and competitive ability of
exotic and invasive species (1-5)
Impacts on food production due, for
example, to losses in spawning and rearing
grounds for fish, losses in aquaculture
beds, and changes in marine food webs
affecting species distribution
Reduced flood, storm surge, and erosion
protection, particularly in areas where sea
level rise reduces coastal habitats that
typically provide buffering capacity
Reduced water quality, e.g., water
temperature, sedimentation, dissolved
oxygen
Impacts on biodiversity, including species
and genetic diversity, due to shifting
species composition, distribution, and
abundance, changes in habitat suitability,
disturbances, and invasive species.
Impacts on culturally significant species,
practices, sites, economic activities, etc.,
e.g., loss of species or access to coastal
3 The four ―Science Summaries‖ for each ecological system (see Appendix E) and the climate impacts summarized in Appendix B provided the references for
this table. 4 ―Primary impact drivers‖ refers to any combination of projected climate impacts identified in the first column. Primary impact drivers are impacts that play a
significant role in a specific ecological consequence but should not be interpreted as the only cause (or causes) of the identified ecological consequence. Also
note that human responses to climate change impacts will have a role in determining the extent to which ecological consequences are realized. Human impacts
are not included in this table.

TAG3 Interim Report February/2011 10 | P a g e
Ecosystem Examples of Projected Physical and
Chemical Changes
Examples of Potential Ecological
Consequences (with primary drivers)4
Examples of Potential Impacts on
Ecosystem Services
Marine &
Coastal
coastal waters. sites that are significant to tribes; loss of
community identities (and economies) tied
to aquaculture or fishing
Impacts on recreation and related
economic activities, e.g. shifts in/lost
opportunities for fishing, wildlife viewing,
or harvesting (e.g., shellfish) due to
loss/shifts in coastal habitat, changes in
species distribution.
Forests
1. Increased air temperature. Warming is
projected by all models for all seasons
through the 21st
century, with the largest
warming in the summer months.
2. Changes in precipitation. Average annual
precipitation is projected to increase slightly
with an enhanced seasonal cycle (drier
summers and wetter falls and winters) likely.
3. Reduced snowpack. Projected decline in
April 1 snowpack in the range of -37% or -
44% by the 2040s (depending on the
greenhouse gas emissions scenario) and -
53% or -65% by the 2080s.
4. Altered hydrology. More winter rain,
warming temperatures, and declining
snowpack are projected to significantly
increase Oct-March streamflow and reduce
April-Sept streamflow. Flood risk increases
Changes in forest productivity. Enhanced
productivity at upper elevations as snowpack
declines; decreasing productivity at lower
elevations where decreasing water availability is a
limiting factor (1,2,3,5,6)
Impacts on species composition, distribution,
and abundance, particularly for species less able
to move in response to habitat changes ; includes
changes in elevational boundaries (1-6)
Changes in the distribution of forest habitats,
e.g., projected declines in climatically suitable
habitat for Douglas fir and pine species;
exacerbated for alpine habitats, which have
limited ability to move upslope in response to
warming (1-6)
Reduced and/or lost habitat connectivity
(1,2,3,4)
Changes in phenology (the timing of ecological
Impacts on fiber, timber, and fuel
production due, for example, to shifts in
commercial timber species, losses from
increased disturbances (e.g., insect
outbreaks, forest fires), or drought
Impacts on biodiversity, including species
and genetic diversity, due to shifting
species composition, distribution, and
abundance, changes in habitat suitability,
disturbances, and invasive species
Reduced water quality, e.g., sediment
loads
Impacts on water supply benefits,
particularly surface and groundwater
regulation and flow
Impacts on climate regulation, e.g.,
temperature regulation, carbon storage,

TAG3 Interim Report February/2011 11 | P a g e
Ecosystem Examples of Projected Physical and
Chemical Changes
Examples of Potential Ecological
Consequences (with primary drivers)4
Examples of Potential Impacts on
Ecosystem Services
Forests
in some basins, particularly west-side
transient (rain/snow mix) basins, and
decreases in other basins, including east-
side snowmelt dominant watersheds.
5. Declining soil moisture. Modest decreases
in July 1 soil moisture are projected overall
with the largest declines projected for the
Cascades and Olympic Mountains.
6. Altered groundwater. Changes in
groundwater possible although highly
uncertain and with great spatial variation.
Shallow aquifers are more likely to be
affected than deep aquifers.
events) (1-4)
Increased susceptibility to pests and diseases (1-
6)
Impacts on the range of exotic and invasive
species (1-4)
Changes in tree moisture (1-5)
Increased frequency and duration of fires and
increase in area burned (up to double or triple
likelihood of severe fire by 2080s) (1-6)
Increased risk of drought (1-6)
carbon sequestration
Impacts on nutrient cycling and soil health
necessary to support healthy forest
ecosystems
Reduced erosion and flood protection,
particularly in unstable areas after
disturbance (e.g., forest fires, landslides)
Impacts on culturally significant species,
practices, sites, economic activities, etc.,
e.g., loss of species or access to sites that
are significant to tribes, or loss of
community identities (and economies) tied
to forest-related activities
Impacts on recreation and related
economic activities, e.g. hunting, fishing,
hiking, wildlife viewing
Freshwater/
Aquatic
1. Increased air temperature. Warming is
projected by all models for all seasons
through the 21st
century, with the largest
warming in the summer months.
2. Changes in precipitation. Average annual
precipitation is projected to increase slightly
with an enhanced seasonal cycle (drier
summers and wetter falls and winters) likely.
3. Reduced snowpack. Projected decline in
April 1 snowpack in the range of -37% or -
Shifts in aquatic community composition,
distribution, and abundance (1-9)
Changes in phenology (the timing of ecological
events) (1-9)
Reduced and/or lost freshwater/aquatic habitat,
wetlands, and floodplain connectivity (1-9)
Impacts on the range of exotic and invasive
species (aquatic vertebrates, invertebrates,
fishes) (1-4,6,8,9)
Impacts on biodiversity, including species
and genetic diversity, due to shifting
species composition, distribution, and
abundance, changes in habitat suitability,
disturbances, and invasive species
Impacts on commercial, sport, and
subsistence fisheries, shellfisheries, and
harvesting of other natural resources
derived from freshwaters
Reduced flood control and drainage

TAG3 Interim Report February/2011 12 | P a g e
Ecosystem Examples of Projected Physical and
Chemical Changes
Examples of Potential Ecological
Consequences (with primary drivers)4
Examples of Potential Impacts on
Ecosystem Services
Freshwater/
Aquatic
44% by the 2040s (depending on the
greenhouse gas emissions scenario) and -
53% or -65% by the 2080s.
4. Altered hydrology. More winter rain,
warming temperatures, and declining
snowpack are projected to significantly
increase Oct-March streamflow and reduce
April-Sept streamflow. Flood risk increases in
some basins, particularly west-side transient
(rain/snow mix) basins, and decreases in
other basins, including east-side snowmelt
dominant watersheds.
5. Declining soil moisture. Modest decreases
in July 1 soil moisture projected overall with
largest declines projected for the Cascades
and Olympic Mountains.
6. Reduced glacial size and abundance. Could
lead to short-term increases in summer
streamflow but will ultimately exacerbate
decreasing summer streamflow conditions.
7. Altered groundwater. Changes in
groundwater possible although highly
uncertain and with great spatial variation.
Shallow aquifers more likely to be affected
than deep aquifers.
8. Increased summer stream temperatures
and longer periods of warmer stream
temperatures, although with significant
Increased mortality and displacement of redds
and juvenile fish associated with flooding and
streambed changes (2-5)
Impacts on stream and river channel dynamics,
including migration, incision, aggradation, bed
texture, and mass wasting; includes upland
channels and river mouths (2-4,6,9)
Increasing sediment loads (2,4,6)
Increased salt water intrusion into coastal rivers
and streams, freshwater wetlands (4,9)
Increasing thermal stress during summer months
for coldwater adapted fish species like salmon (1-
8)
Increased nutrient loading (e.g. eutrophication)
(1,2,4)
provided by flood plains, wetlands
Impacts on water quality, e.g., water
temperature, sediment loads, dissolved
oxygen, pollutant loading
Impacts on water supply and filtration
benefits associated with wetlands, bogs,
fens, etc., including groundwater recharge
and reduced groundwater contributions to
summer streamflow in rivers and streams
near impacted wetlands.
Reduced or loss of cold water refugia for
coldwater adapted fish species such as
salmon
Impacts on culturally significant species,
practices, sites, economic activities, etc.,
e.g., loss of species or access to sites that
are significant to tribes, or loss of
community identities (and economies) tied
to forest-related activities
Impacts on recreation and related
economic activities, e.g. hunting, fishing,
wildlife viewing, rafting

TAG3 Interim Report February/2011 13 | P a g e
Ecosystem Examples of Projected Physical and
Chemical Changes
Examples of Potential Ecological
Consequences (with primary drivers)4
Examples of Potential Impacts on
Ecosystem Services
spatial variation around the state.
9. Sea level rise. Projected increase in Puget
Sound of +6” (range: 3-22”) by 2050 and
+13” (range: 6-50”) by 2100.
Aridlands
1. Increased air temperature. Warming is
projected by all models for all seasons
through the 21st
century, with the largest
warming in the summer months. Increased
length of the frost-free period expected
although impact on growing season length in
eastern Washington will be limited by water
availability.
2. Changes in precipitation. Average annual
precipitation is projected to increase slightly
with an enhanced seasonal cycle (drier
summers and wetter falls and winters) likely.
3. Altered hydrology. More winter rain,
warming temperatures, and declining
snowpack are projected to significantly
increase Oct-March streamflow and reduce
April-Sept streamflow. Spring flood risk
projected to decrease in east-side snowmelt
dominant watersheds.
4. Changes in soil moisture. Projected changes
in July 1 soil moisture in arid lands vary.
Most areas in eastern Washington show
modest decreases in July 1 soil moisture
Changes in arid lands productivity, including
reduced carbon sequestration, due to (for
example) changes in soil carbon and nitrogen
cycling, microbial biomass concentrations (1,2)
Increased risk of drought (1-5)
Reduced and/or lost arid lands habitats (1-5)
Changes in the distribution of arid lands habitats
(1-5)
Impacts on species composition, distribution,
and abundance, particularly in areas affected by
disturbance (e.g., fire, overgrazing, erosion, insect
or disease infestation) and for species less able to
move in response to habitat changes ; includes
changes in elevational boundaries (1-5)
Changes in phenology (the timing of ecological
events) (1,2,3)
Impacts on the range of exotic and invasive
species, e.g., cheatgrass, sagebrush moth,
particularly in areas affected by disturbance (1-5)
Increased risk of fire (1-4)
Increased erosion, particularly in areas affected
Impacts on biodiversity, including species
and genetic diversity, due to shifting
species composition, distribution, and
abundance, changes in habitat suitability,
disturbances, and invasive species
Impacts on water quality, e.g., water
temperature, sediment loads
Impacts on water supply benefits
associated with riparian areas, wetlands,
springs, intermittent water courses, vernal
pools. May include reduced water supply
for livestock and wildlife, reduced
groundwater recharge, reduced
groundwater contributions to summer
streamflow in rivers and streams near
impacted areas.
Impacts on nutrient cycling and soil health
necessary to support healthy arid land
ecosystems
Reduced erosion protection, particularly in
unstable areas after disturbance (e.g., fire,
overgrazing, erosion, insect or disease

TAG3 Interim Report February/2011 14 | P a g e
Ecosystem Examples of Projected Physical and
Chemical Changes
Examples of Potential Ecological
Consequences (with primary drivers)4
Examples of Potential Impacts on
Ecosystem Services
Aridlands
while some areas in south central
Washington may see slight increases as a
result of increasing winter and spring
precipitation in some climate scenarios.
5. Altered groundwater. Changes in
groundwater possible although highly
uncertain and with great spatial variation.
Shallow aquifers more likely to be affected
than deep aquifers.
6. Increased summer stream temperatures
and longer periods of warmer stream
temperatures, particularly in eastern
Washington (1-5)
by disturbance (2,3)
Increasing thermal stress during summer months
for coldwater adapted fish species using riparian
habitat in arid lands (1-5)
infestation)
Reduction or loss of cold water refugia for
coldwater adapted fish species such as
salmon using riparian habitat in arid lands.
Impacts on culturally significant species,
practices, sites, economic activities, etc.,
e.g., loss of species or access to sites that
are significant to tribes, or loss of
community identities (and economies) tied
to activities connected to arid lands
ecosystems
Impacts on recreation and related
economic activities, e.g. hunting, fishing,
hiking, wildlife viewing

TAG3 Interim Report February/2011 15 | P a g e
III PRIORITY STRATEGIES AND ACTIONS
This chapter introduces a set of priority strategies and examples of recommended near-term
actions to advance them. The strategies and actions were developed with the intent to sustain
natural systems and the critical ecological services they provide for human health and well being.
STRATGIES IDENTIFIED FOR ECOLOGICAL SYSTEMS
TAG3 members reviewed climate change risks and evaluated possible actions separately for four
major ecological systems: coastal and marine, freshwater, forests and prairies, and aridlands.
Appendix A includes the full complement of the strategies and actions identified for each
system, as well as considerations for implementation, including existing programs, new
programs or policies needed, and institutional barriers. The goal was not a comprehensive
review of all changes, vulnerabilities, and adaptation options within each system; rather, it was to
ensure that our assessment considered at some level the full range of systems and species that are
likely to be impacted in different ways. Once these strategies and actions were identified for
each of the four major ecological systems, the TAG reviewed the collective list and looked for
common themes and strategy recommendations that were important and applicable for all habitat
types.
OVERARCHING GOALS AND NEAR TERM ACTIONS
TAG3 developed ten broad goals which apply programmatically across the state and cross all
ecological systems. Drawing from the recommendations for each ecological system (Appendix
A), we identified high priority strategies and near-term actions for each goal. Near-term is
defined as 1-5 years. The criteria for determining a priority strategy or near-term action were
qualitatively applied, and included consideration of the certainty and severity of the impact
(urgency), the opportunity cost of delayed action, and whether or not other actions depended on
its completion. For a more substantive discussion on criteria for determining priorities, please
see Appendix C.
We tried to capture as many priority strategies as possible from each ecological system in the
overarching goals, strategies and actions presented in this chapter. However, some strategies and
actions that are unique to a particular habitat type may not be fully reflected. Please see the
tables found in Appendix A for all of the strategies and actions developed for each of the four
habitat areas considered.
Note that the goals, strategies and actions are numbered only to facilitate discussion and do not
indicate relative priority. When possible, we have also provided a reference to the corresponding
recommendation within a particular ecological system; more information on a given strategy can
be found in the appropriate table in Appendix A.

TAG3 Interim Report February/2011 16 | P a g e
The goals and strategies to achieve them are roughly divided into two sections. The first set
focuses on actions to facilitate the ability of natural systems to provide ecological functions and
services in the face of climate change. The second set is oriented towards building the necessary
scientific and institutional readiness to support effective adaptation.
Facilitate the Resistance, Resilience and Response of Natural Systems
1. Provide for habitat connectivity across a range of environmental gradients
2. For each habitat type, protect and restore areas most likely to be resistant to
climate change.
3. Increase ecosystem resilience to large-scale disturbances, including disease,
invasive species, catastrophic fire, flooding, and drought.
4. Address stressors contributing to increased vulnerability to climate change.
5. Incorporate climate change projections into plans for protecting sensitive and
vulnerable species.
Build Scientific and Institutional Readiness to Support Effective Adaptation
6. Fill critical information gaps and focus monitoring on climate change.
7. Build climate change into land use planning.
8. Develop applied tools to assist land managers.
9. Strengthen collaboration and partnerships.
10. Conduct outreach on the values provided by natural systems at risk from
climate change.

TAG3 Interim Report February/2011 17 | P a g e
DESCRIPTION OF PRIORITY STRATEGIES AND NEAR-TERM ACTIONS FOR EACH GOAL
The following actions are designed to facilitate the ability of natural systems to continue to
provide ecological functions and services in the face of climate change, and build scientific and
institutional readiness to support effective adaptation
GOAL #1: Provide for habitat connectivity across a range of environmental gradients
Habitat connectivity is expected to allow species and ecosystems to better withstand climate
change by allowing them to follow changes in climate across the landscape and maintain critical
ecological processes such as dispersal and gene flow. For example, sea level rise will directly
displace coastal species; therefore, their persistence will require the ability to move inland to new
habitats. In general, it is much costlier and more difficult to restore connectivity than to maintain
existing connectivity, yet ongoing development rapidly removes this opportunity. Planning for
habitat connectivity in the near term will be far more economical the sooner it is implemented.
Key Concept Identifying important areas for habitat connectivity is expected to
enhance species and ecosystem capacity to adapt by facilitating changes
in range. Connectivity should be considered along gradients in
elevation, latitude and temperature.
Priority Strategies 1. Identify and designate areas most suitable for core habitat and
connectivity in light of a changing climate.
2. Protect and restore areas most suitable for current core habitat,
likely future core habitat, and connections between them.
3. Protect and re-establish connectivity of rivers and their floodplains.
4. Adjust the size and boundaries of conservation areas (parks and
natural areas) to accommodate anticipated shifts in habitat and
species’ ranges.
5. Adjust land use designations in important connectivity areas (for
example, allowable density).
6. Facilitate inland migration of coastal habitats.
Near Term Actions 1. Secure adequately detailed elevation maps necessary to determine
areas most sensitive to sea level rise and determine areas suitable
for maintaining costal-inland connectivity. (Marine/Coastal 1.1.1)
2. Complete the habitat connectivity analyses under development by
the Washington Habitat Connectivity Group, and work to integrate
findings into land use planning activities (Forests 1.1.1)
3. Use regulatory and non-regulatory means to secure or limit
inappropriate activity in high priority buffer areas and habitat
connectivity corridors for both coastal and terrestrial systems
(Marine/Coastal 1.1.1)

TAG3 Interim Report February/2011 18 | P a g e
4. Update flood maps in floodplain and riparian areas to account for
potential climate change impacts. ( Freshwater 1.3.1)
5. Protect and restore current sediment sources and transport
processes throughout the littoral system (Marine/Coastal 1.1.2)
GOAL #2: Protect and restore areas most likely to be resistant to climate change, aiming for
a full representation of habitat types.
Broadly speaking, climate refugia are areas where climatic change is likely to occur more slowly
or to a lesser extent than other areas. The concept of refugia can be considered on different
scales; for example, the moist temperate climate of the west side of the Cascades and the high
mountains of the state will likely serve as refugia for some species at very broad spatial scales.
However, in this instance we are using the concept on a more localized scale, for example, some
refugia are created by physical landscape features, such as north-facing slopes, valleys or other
low areas that serve as sinks for cold air, or streams fed by deep coldwater springs. Other refugia
are supported by biological features, such as the ability of forests to maintain cooler, moister
conditions. Once identified and protected, refugia can help facilitate the long-term survival of
species or at least buy time for species to adapt to changing conditions. Restoration can also
target the creation of refugia, for example by reforestation or the reintroduction of beavers.
The concept of climate refugia can be expanded to apply to sea level rise as well. The rate of sea
level change within Washington State is highly variable—sea level is currently dropping around
Neah Bay but rising faster than the global average in the South Sound—so areas with slower
rates of sea level rise could be considered refugia. The rate of effective sea level rise can in some
circumstances be slowed by restoring natural or enhanced rates of sediment input and accretion
(e.g. through removing dams or restoring certain types of coastal marshes), and by limiting
groundwater withdrawals.
Current thinking suggests that high quality habitats may help to provide refugia for species under
stress from climate change. In this case, the concept of refuge is not specific to climatic change;
rather it refers to places where stressors related to habitat loss or degradation are reduced and
which ostensibly increase the ability of species to withstand or recover from stresses linked to
climate change.
Key Concept Where possible, restoration and protection programs should be
carried out in ways that help to slow the rate of climatic change
locally or regionally, and used to provide refugia for species likely to
be under stress from climate change

TAG3 Interim Report February/2011 19 | P a g e
Priority Strategies 1. Identify and protect high quality habitats that are minimally
affected by (or resistant to) climate change and most likely to act
as climate refugia, including maintaining and improving
ecological function and integrity.
Near Term Actions 1. Develop criteria to identify areas most resistant to and resilient
to climate change in different ecological systems.
2. Inventory and map important thermal refugia and snowmelt
systems in priority freshwater systems (sub-basins within WRIAs)
and prioritize for protection. (Freshwater 1.1.1)
3. Evaluate size and location of existing reserves and protected
areas to address opportunities to protect important climate
resilient habitats. (Forests 1.2.1; Aridlands 1.3.2)
GOAL #3: Increase ecosystem resilience to large scale disturbances, including disease,
invasive species, catastrophic fire, flooding and drought
Climate change will likely affect species and ecosystems both through gradual, directional
changes in climate conditions and through increased frequency and intensity of major
disturbances such as wildfire, extreme weather events such as droughts or flood, species
invasion, disease and parasite outbreaks. While reducing vulnerability to gradual changes
typically relies more on supporting resistance to change or facilitating longer-term responses to
change that maintain desired characteristics or functions, reducing vulnerability to large-scale
disturbances more often focuses on supporting resilience, that is, the ability of a system to return
to its former state after a disturbance.
Key Concept Larger, well-functioning ecosystems better withstand large-scale
disturbance than smaller ecosystems because of their greater
likelihood of containing remaining resources such as remnant seed
and vegetation sources or pockets of undisturbed animal
populations. Diverse, functioning ecosystems allow easier dispersal
of system elements to help recover impacted areas or colonize new
areas, and in this way contribute to ecosystem resilience.
Priority Strategies 1. Promote structural and landscape diversity to minimize the
impacts from catastrophic disturbances.
2. Redefine priorities for fire management in areas important to
biodiversity; priorities should shift emphasis from fire
prevention/suppression to proactive management designed to
increase resilience to fire and decrease likelihood of severe fire.
3. Protect and restore habitat to support adequate water supply,

TAG3 Interim Report February/2011 20 | P a g e
moderate temperature, and mitigate flooding impacts, through
reintroduction of beaver, wetland creation and other off-channel
water storage basins, and by protecting cold-water springs.
Near Term Actions 1. Target habitat restoration programs towards increasing species
and structural diversity and disturbance-resistant species.
2. Modify existing land management plans to promote (seral stage)
diversity such as using prescribed fire and thinning in forest
systems to promote structural complexity. (Forests 2.1.4)
3. Identify priority systems (sub-basins within WRIAs) for basin-
wide climate adaptation planning; including habitat restoration,
promoting conjunctive use of groundwater and surface water,
and integrating riparian and floodplain management.
GOAL #4 Address stressors contributing to increased vulnerability to climate change
Reducing non-climate stressors such as unsustainable harvest, pollution or habitat fragmentation
can help to increase overall ecosystem resistance and resilience to climate change. Human
responses to climate change or other existing stressors may further interact to increase or
decrease overall vulnerability. Possible interactions of non-climate stressors and increased
vulnerability to climate change include the following:
Overharvest: reduced population sizes from over-harvesting can limit the ability of a
population to adapt evolutionarily to changing condition because of the reduction in
genetic diversity. Smaller populations are also more at risk to local extinctions from
catastrophic events such as floods or droughts.
Habitat fragmentation: fragmentation reduces connectivity and thereby the ability of
individuals and species to move across the landscape in response to changing conditions.
Pollutants: the toxicity and bioavailability of many pollutants is affected by soil, air, or
water temperature and chemistry, all of which are changing as a result of climate change.
Also, some pollutants increase species’ sensitivity to high temperature or other climate-
related stressors.
Invasive species: some invasive species directly increase the climate vulnerability of the
ecosystems they invade (e.g. nutria have destroyed or degraded coastal wetlands in the
areas of the U.S. where they have become established, and this degradation increases the
vulnerability of the coastline to flooding, erosion, and the impacts of sea level rise).
Climate change in some cases will increase the success of invaders, and in other cases
potentially decrease their success and make eradication more feasible.

TAG3 Interim Report February/2011 21 | P a g e
Habitat loss: in addition to direct habitat loss as a result of climate change (e.g. coastal
habitat lost to rising seas, freshwater habitat lost to increasing drought), restoration
projects may become less successful if restoration practitioners fail to incorporate
changing climatic conditions in their plans.
It should be noted that simply addressing existing stressors will not always be an effective
adaptation strategy. In some cases this approach will work, but in others it will not (e.g. reducing
harvest levels won’t be the most effective strategy if the habitat is vulnerable to degradation) or
increasing the size of a protected area may not be the most effective strategy if the land is highly
vulnerable to sea level rise).
Key Concepts Reducing non-climate stressors such as unsustainable harvest,
pollution or habitat fragmentation can help to increase overall
ecosystem resilience to climate change.
Human responses to climate change or other existing stressors may
further interact to increase or decrease overall vulnerability
Priority Strategies 1. Evaluate and prioritize efforts to address human activities that can
exacerbate climate change impacts in vulnerable systems (for
example, stormwater pollution which impairs water quality; habitat
fragmentation from development pressure, fuel buildup from wildfire
suppression).
2. Integrate climate change into invasive species management. This may
include use of climate models to highlight areas where invasion by
particular species may become more problematic or where eradication
may be possible, as well as using existing tools and best practices.
Near Term Actions 1. Reduce non-climate stressors (such as stormwater and septic issues,
non-point and point source pollution) that contribute to hypoxic
conditions and exacerbate marine acidification. (Marine/Coastal 1.4.1)
2. Conduct vulnerability assessments to determine specific areas and/or
species most vulnerable to climate change impacts and under threat
from existing stressors.
3. Manage stormwater to protect and restore flow characteristics in light
of expected climate change impacts. (Freshwater 2.2.2)
4. Manage water withdrawals to ensure adequate stream flows and lake
levels to maintain freshwater systems. Potential tools such as
acquiring water rights, using water banks, incentives, and regulatory,
planning and policy tools.
5. Implement the Washington Invasive Species Strategic Plan .

TAG3 Interim Report February/2011 22 | P a g e
GOAL #5: Incorporate climate change into plans for protecting sensitive and vulnerable
species and the habitats they depend on
While protecting the most robust species and systems can be effective at retaining processes and
functions of ecosystems, there are multiple reasons to focus on sensitive and vulnerable species
and systems as well. These include preserving species and landscape diversity and protecting
culturally or spiritually important species. Some even argue that it can be more strategic to focus
on species whose survival is most dependent on human intervention, rather than those likely to
survive regardless. Furthermore, some existing laws mandate the protection of sensitive and
vulnerable species and systems; effectively fulfilling this mandate requires taking a climate-
smart approach. For example, focusing only on current habitat is unlikely to be successful in the
fact of climate change, given that core habitat for some threatened and endangered species is
already shifting.
Key Concepts Climate change will increase the stress on species that are already
sensitive or vulnerable, and alter what is necessary for their recovery and
protection.
Priority Strategies 1. Map, protect and restore likely future critical or important habitat for
vulnerable and at risk species based on a range of climate projections.
2. Incorporate actual and anticipated climatic changes and associated
impacts into species recovery and management plans.
Near Term Actions 1. Develop and maintain long-term, large-scale monitoring of early
warning indicators of species responses, including range shifts,
population status and changes in ecological systems functions and
processes.
2. Complete the Pacific Northwest Climate Change Vulnerability
assessment for species and habitats and integrate findings into species
conservation plans. Identify areas within vulnerable species critical
habitats that would remain relatively stable given future climate
change because of their physical characteristics.
3. Modify protection and recovery plans to accommodate individual
movements and migration as well as longer-term species range shifts
associated with climate change and its effects.
4. Coordinate among agencies, tribes and organizations to identify and
prioritize additional research needs to identify adaptation strategies
for vulnerable species.

TAG3 Interim Report February/2011 23 | P a g e
GOAL #6: Fill critical information gaps and focus monitoring programs on climate change
and impacts
Although there are many uncertainties in planning for climate change, there are key knowledge
gaps that we can fill that will help us to develop and implement climate-smart conservation and
resource management. Means of filling data gaps include vulnerability assessments that enable
prioritization of adaptation efforts, experiments, monitoring, and modeling efforts that further
our understanding of how species and ecosystems respond to climate change. Sociological
research could also fill information gaps related to developing adaptation options that integrate a
range of community values.
Monitoring is important in several ways. First, it allows managers to track how climate change is
progressing and how species and systems are responding to it. This information in turn allows us
to refine and test the models we use for projecting future changes and responses. Monitoring can
also be designed to test the assumptions underlying proposed management options and the
effectiveness of the management actions in practice. Monitoring for climatic change and
associated impacts can be carried out as a stand-alone effort or by integrating relevant variables
into existing monitoring efforts. For example, California is investigating how it might
incorporate climate change-relevant considerations into its statewide Marine Protected Area
monitoring program.
Additional suggestions for developing appropriate monitoring programs include the following:
Monitoring programs should be tied to specific management options, hypotheses, or
questions. For example, rather than monitoring for precipitation changes using some standard
or pre-existing set of precipitation-related parameters, monitor for changes in parameters that
are directly linked to planning and management decisions (e.g., timing and volume of peak
spring flooding for salmon biologists; size of 100-year flood and maximum rainfall in a 24-
hour period for road and culvert engineers).
Implement monitoring programs with sufficient coverage to track climate patterns and
changes in those patterns on management-relevant scales, as well as track changes in related
physical or chemical environmental parameters (e.g., marine pH, salinity, base stream flow,
etc.).
Implement monitoring programs that can identify changes in biota (plants and animals) and
aquatic systems and relate those changes to climate conditions, weather events, and related
physical or chemical parameters (e.g., ocean acidification).
Implement monitoring programs designed specifically to test ecological assumptions
underlying proposed adaptation actions (e.g., the assumption that pristine systems are more
resistant or resilient to change).
Implement monitoring programs designed specifically to test the effectiveness of adaptation
actions.

TAG3 Interim Report February/2011 24 | P a g e
Key Concepts Monitoring programs are needed to:
Track climate patterns and changes on management-relevant scales.
Identify changes in biota (plants and animals) and aquatic systems and
be able to relate those changes to climate conditions.
Test ecological assumptions underlying proposed adaptation actions.
Test the effectiveness of adaptation actions.
Inform management decisions.
Priority Strategies 1. Identify species and ecosystems within geographic areas most
vulnerable to climate change
2. Identify key indicators for climate change response in species and
ecosystems.
3. Design and implement monitoring programs that are sufficiently
sophisticated and precise to identify species and vegetation changes
and relate those changes to climate conditions.
4. Enhance existing monitoring of physical, chemical and biological
properties of marine systems to identify and track climate change
impacts.
5. Enhance statewide monitoring networks to document climate change
impacts on freshwater systems.
6. Coordinate data collection needs, ensure data sharing and facilitate
access to all relevant data among conservation partners (state and
federal agencies, tribes and other organizations).
Near Term Actions 1. Update hydrologic information currently used in planning to better
represent current conditions and enable adaptation to represent
future scenarios for groundwater and hydrology. (Freshwater 1.2.1)
2. Develop and maintain large scale monitoring of key early warning
indicators for species of interest such as timing of migration, changes
of population patterns, size at first reproduction, etc. (Forests 2.8)
3. Identify map and monitor essential floodplain and riparian functions at
risk from climate change, including updating flood maps, and tracking
shifts in distributions of wetland and lake dependent species and
vegetation. (Freshwater 1.3.1)
4. Conduct monitoring and research of marine acidification to
understand local extent and impacts to food web and water quality.
(Marine/Coastal 2.2)
5. Conduct a climate change vulnerability assessment for marine species.
(Marine/Coastal 2.6)

TAG3 Interim Report February/2011 25 | P a g e
GOAL #7 Incorporate climate change considerations into ocean and land use planning
The actions under this goal are designed to ensure that existing and future land and ocean use
planning policies, guidance, technical assistance and incentive programs address climate change
consequences and integrate adaptation strategies. This goal addresses one of the most immediate
and relevant approaches for building our institutional capacity to adapt to climate change impacts
on the ground.
―Land use plan‖ is intended here to be broadly defined and includes land management plans and
policy documents such as local government comprehensive plans, conservation plans, grazing
plans, Forest stewardship plans and habitat conservation plans. The concept of land use planning
as used here also includes the regulatory mechanisms that drive land use planning at the local
level, including the Growth Management Act, Shoreline Master Programs and rules to set in-
stream flows. Ocean use planning includes establishment of marine reserves, regulation of
marine harvest and recreation, and any future marine spatial planning efforts.
Key Concepts Land and ocean use policy, planning, and implementation represent a
big opportunity to institutionalize climate-smart approaches.
Priority Strategies 1. Ensure existing land and ocean management plans and regulatory
processes incorporate climate change consequences and include
adaptation strategies.
2. Integrate planning and decision making at watershed and statewide
scales to identify, avoid, or resolve conflicts among adaptation
strategies.
Near Term Actions 1. Develop mitigation requirements for habitat loss and degradation
from development related to human response to climate change
(e.g., additional water storage facilities).
2. Integrate findings from the Habitat Connectivity analysis and
vulnerability studies into planning, policy and land management
activities. (Forests 2.3.1)
3. Develop a state water plan that allows holistic planning of water
resources and responses climate change. (Freshwater 2.2.1)
4. Evaluate Shoreline Master Programs to address current practices
and institutional barriers that prevent inland migration of critical
coastal habitats at risk from inundation. Options might include
greater development setbacks, dynamic setbacks, and requiring
planning that addresses future climate change impacts prior to
allowing development projects to be built. (Marine/Coastal 2.1)
5. Build climate change into marine spatial planning from the start.
TAG3 Interim Report February/2011 26 | P a g e
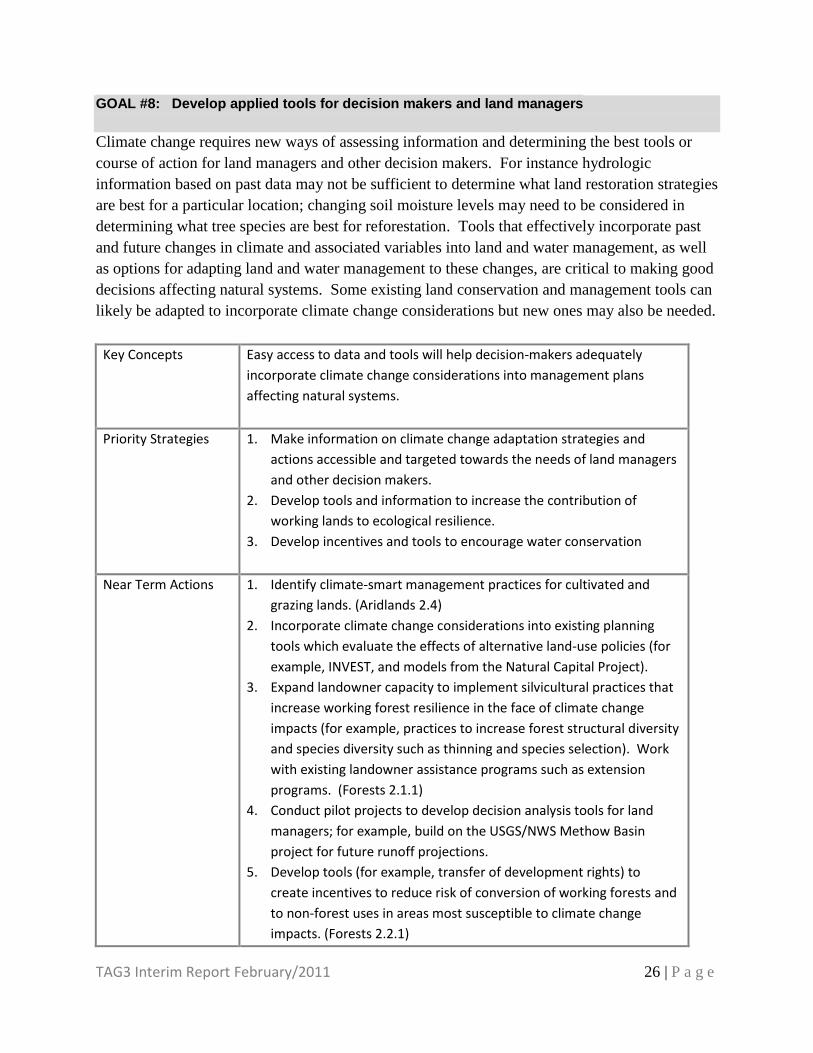
GOAL #8: Develop applied tools for decision makers and land managers
Climate change requires new ways of assessing information and determining the best tools or
course of action for land managers and other decision makers. For instance hydrologic
information based on past data may not be sufficient to determine what land restoration strategies
are best for a particular location; changing soil moisture levels may need to be considered in
determining what tree species are best for reforestation. Tools that effectively incorporate past
and future changes in climate and associated variables into land and water management, as well
as options for adapting land and water management to these changes, are critical to making good
decisions affecting natural systems. Some existing land conservation and management tools can
likely be adapted to incorporate climate change considerations but new ones may also be needed.
Key Concepts Easy access to data and tools will help decision-makers adequately
incorporate climate change considerations into management plans
affecting natural systems.
Priority Strategies 1. Make information on climate change adaptation strategies and
actions accessible and targeted towards the needs of land managers
and other decision makers.
2. Develop tools and information to increase the contribution of
working lands to ecological resilience.
3. Develop incentives and tools to encourage water conservation
Near Term Actions 1. Identify climate-smart management practices for cultivated and
grazing lands. (Aridlands 2.4)
2. Incorporate climate change considerations into existing planning
tools which evaluate the effects of alternative land-use policies (for
example, INVEST, and models from the Natural Capital Project).
3. Expand landowner capacity to implement silvicultural practices that
increase working forest resilience in the face of climate change
impacts (for example, practices to increase forest structural diversity
and species diversity such as thinning and species selection). Work
with existing landowner assistance programs such as extension
programs. (Forests 2.1.1)
4. Conduct pilot projects to develop decision analysis tools for land
managers; for example, build on the USGS/NWS Methow Basin
project for future runoff projections.
5. Develop tools (for example, transfer of development rights) to
create incentives to reduce risk of conversion of working forests and
to non-forest uses in areas most susceptible to climate change
impacts. (Forests 2.2.1)
TAG3 Interim Report February/2011 27 | P a g e
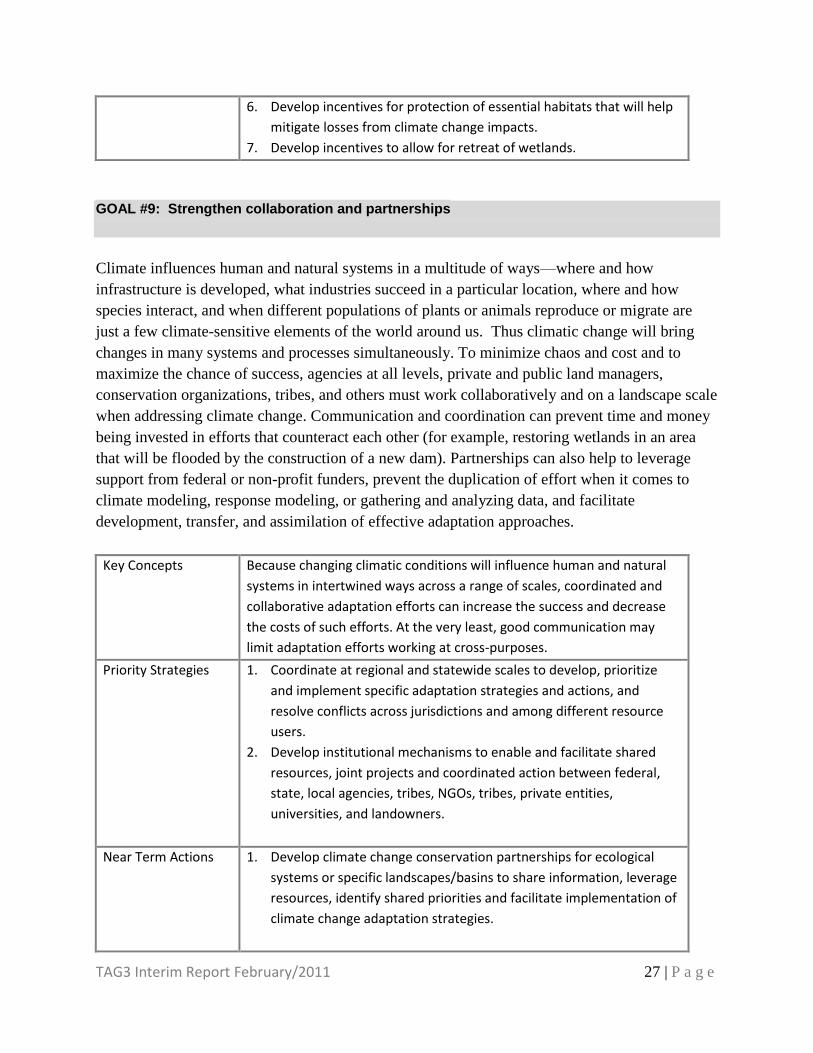
6. Develop incentives for protection of essential habitats that will help
mitigate losses from climate change impacts.
7. Develop incentives to allow for retreat of wetlands.
GOAL #9: Strengthen collaboration and partnerships
Climate influences human and natural systems in a multitude of ways—where and how
infrastructure is developed, what industries succeed in a particular location, where and how
species interact, and when different populations of plants or animals reproduce or migrate are
just a few climate-sensitive elements of the world around us. Thus climatic change will bring
changes in many systems and processes simultaneously. To minimize chaos and cost and to
maximize the chance of success, agencies at all levels, private and public land managers,
conservation organizations, tribes, and others must work collaboratively and on a landscape scale
when addressing climate change. Communication and coordination can prevent time and money
being invested in efforts that counteract each other (for example, restoring wetlands in an area
that will be flooded by the construction of a new dam). Partnerships can also help to leverage
support from federal or non-profit funders, prevent the duplication of effort when it comes to
climate modeling, response modeling, or gathering and analyzing data, and facilitate
development, transfer, and assimilation of effective adaptation approaches.
Key Concepts Because changing climatic conditions will influence human and natural
systems in intertwined ways across a range of scales, coordinated and
collaborative adaptation efforts can increase the success and decrease
the costs of such efforts. At the very least, good communication may
limit adaptation efforts working at cross-purposes.
Priority Strategies 1. Coordinate at regional and statewide scales to develop, prioritize
and implement specific adaptation strategies and actions, and
resolve conflicts across jurisdictions and among different resource
users.
2. Develop institutional mechanisms to enable and facilitate shared
resources, joint projects and coordinated action between federal,
state, local agencies, tribes, NGOs, tribes, private entities,
universities, and landowners.
Near Term Actions 1. Develop climate change conservation partnerships for ecological
systems or specific landscapes/basins to share information, leverage
resources, identify shared priorities and facilitate implementation of
climate change adaptation strategies.

TAG3 Interim Report February/2011 28 | P a g e
2. Support existing landscape scale conservation initiatives and
integrate climate change consequences and responses (for example,
Arid Lands Initiative, Landscape Conservation Cooperatives, Western
Governors Association initiatives).
3. Develop a mechanism for shared accountability for implementing
climate change adaptation.
GOAL #10: Conduct outreach and education on the values of ecosystem services at risk in
the face of climate change
Education about the importance of maintaining and restoring healthy well-functioning natural
systems is a critical climate adaptation strategy. Washington’s diverse ecosystems, species, and
habitats provide a complex range of goods and services, collectively referred to as ―ecosystem
services‖ that benefit Washington residents in numerous ways (see chapter II). Many of these
services in fact become even more valuable in the face of climate change, helping to lessen
associated impacts to human communities. Education targeted at all levels – K-20, policy
makers, general public – is essential to ensure that the value of ecosystem services is fully
recognized as we develop response strategies and take action to respond to climate change.
Key Concept Education and outreach can help ensure that the value of ecosystems
and the services they provide is considered in adapting to climate
change.
Priority Strategies 1. Conduct outreach and education on the values provided by natural
assets at risk from climate change.
2. Promote a climate literate citizenry.
3. Promote opportunities for citizens to engage in actions that will help
minimize impacts from climate change (for example, habitat
protection and restoration, citizen science programs, preventing
invasive species, etc).
Near Term Actions 1. Provide case studies and real world examples of the economic and
social benefits ecological systems provide; emphasizing the
mitigating impacts of climate change on communities and human
well being.
2. Initiate and support existing efforts to quantify value of ecological
services and natural systems particularly those comparing the
lifetime cost-effectiveness of nature-based versus engineered
adaptation options (for example, the flood protection analysis
performed by Earth Economics for the Chehalis River Basin Flood
Authority).

TAG3 Interim Report February/2011 29 | P a g e
3. Integrate messages about the value of ecological services at risk
from climate change into environmental education programs and
curriculum.
4. Consider nature-based alternatives to more typically engineered
adaptation options such as flood control, ensuring water quality and
water quantity, erosion control, etc.
5. Facilitate development of programs to engage citizens in monitoring
impacts of climate change on the landscape (for example, citizen
science monitoring network and the National Phenology Network,
nature center programs, etc.).
6. Make information about climate and climate change understandable
and accessible to the general public.

TAG3 Interim Report February/2011 30 | P a g e
IV OVERARCHING CONSIDERATIONS AND NEXT STEPS
In the course of its work, TAG3 raised a number of important issues and topics that it had
insufficient time and opportunity to adequately develop. This section introduces or reiterates
selected issues with the recommendation that they be further described, examined, and
considered as the Statewide Integrated Response Strategy is developed and implemented.
1. INTEGRATE RECOMMENDATIONS INTO POLICIES AND PROCEDURES
Ultimately, implementation of any of the recommended strategies in this report depends on
how approaches and strategies are ―mainstreamed‖; that is, integrated into existing policies,
programs and guidance. Further work is needed to identify governance and policy tools that
could help institutionalize adaptationmindset. In particular, effort is needed at the level of
implementing agencies and bodies to ensure that climate change considerations are built into
relevant processes. Examples include environmental assessment programs (for example,
building climate criteria into SEPA), state funded grant programs to acquire or restore
habitat or conservation land (for example, including criteria for climate resilience in
acquisition proposals), and land use planning guidance and technical assistance programs (for
example, providing assistance to local jurisdictions to build climatic changes and adaptation
needs into critical areas ordinances).
One important next step is for the Steering Committee to include a recommendation in its
final report that asks state agencies (and possibly local governments) to review and
incorporate climate change considerations into existing programs, policies and funding
mechanisms.
2. AVOID MALADAPTATION
As awareness about current and projected impacts from climate change grows, and as
government jurisdictions begin to craft plans and approaches for responding to these impacts,
the risk of unintended consequences of adaptation strategies increases. Most adaptation
actions require some sort of trade-off; when the negatives of an adaptation action or strategy
outweigh the benefits, it becomes a maladaptation. When an adaptation strategy becomes a
maladaptation can be subjective or contextual, and what may seem successful to one group,
at one time, or in one location may seem damaging to others or at other times and places. For
example, subsidizing or providing extra water allocation to farmers growing water-intensive
crops in areas experiencing increasingly dry summers may seem like a good adaptation
strategy in the short term, but in the long term it increases their vulnerability by reducing
incentives to shift to crops or agricultural strategies more suited to a dry location.
Similarly, subsidizing rebuilding costs for communities in coastal areas vulnerable to sea
level rise may seem like an appropriate adaptation in the near term (it reduces the harm done
by sea level rise to the community), but in the long term it encourages the community to

TAG3 Interim Report February/2011 31 | P a g e
remain in harm’s way. Building seawalls or bulkheads to protect one property often increases
the vulnerability of others by increasing erosion farther down the shoreline, and can even
worsen erosion in front of the property it is designed to protect. Developing new water
storage facilities as a response to more frequent or severe drought may increase the
vulnerability of cold-water species to climate change by increasing water temperatures both
up- and down-stream of the dam. The state’s Climate Change Response strategy should be
built on a framework that evaluates all consequences and tradeoffs before responses are
selected and seek to design up front ecosystem-based approaches that benefit both natural
and human systems.
3. PROMOTE ECOSYSTEM-BASED ADAPTATION
While some human responses to climate change will be detrimental to ecosystems, it is
important to avoid creating a false dichotomy between adaptation actions that benefit natural
systems versus actions that benefit people. For many climate impacts, it is desirable to
develop ―ecosystem-based adaptation‖ strategies that deliver benefits to people and natural
systems. Ecosystem‐based adaptation uses sustainable management, conservation, and
restoration of ecosystems to provide services that help human communities adapt to the
impacts of climate change.5 Examples of ecosystem-based adaptation include: increasing
the resilience of coastal communities by maintaining or restoring coastal wetlands to reduce
coastal flooding and coastal erosion; and increasing the resilience of forest systems by
implementing forest restoration and forest health treatments, thereby reducing the risk of
catastrophic fire and damage to people and property.
By considering impacts to both human and ecological communities and concurrently
considering a range of adaptation approaches for these two communities, adaptation
strategies are more likely to succeed. Using ecosystem-based adaptation can also be more
cost-effective than measures based on hard infrastructure and engineering, and it generates
social, economic, and cultural co-benefits.6 Many of the strategies we recommend in our
report, while they will benefit ecosystems, will also benefit people. We encourage the
Steering Committee to ensure that the Statewide Integrated Climate Response Strategy
includes adaptation actions that are in the best interests of both human and natural
communities.
5 Connecting Biodiversity and Climate Change Mitigation and Adaptation (2008), The Ad Hoc Technical
Expert Group on Climate Change and Biodiversity (AHTEG) & Ecosystem Based Adaptation.
http://www.cbd.int/doc/publications/cbd‐ts‐41‐en.pdf
6 Ibid
TAG3 Interim Report February/2011 32 | P a g e
4. INCREASE OPPORTUNITIES FOR MULTI-SECTOR, LANDSCAPE-LEVEL APPROACHES
Several recommendations in this report address the need and opportunity for collaboration at
landscape scales and across jurisdictions. This is because actions in one location may
drastically influence vulnerability to climate change in other locations. The rate of relative
sea-level rise threatening a coastal community, for example, may be influenced by dams or
diversions that can limit sediment influx to the coast or withdrawal of water from nearby
aquifers that may cause subsidence. Thus coordination should be undertaken at a level
determined by the systems and actions under consideration. This notion should be further
developed and integrated into the Climate Change Response Strategy.
5. CONSIDER IMPLEMENTATION PLANNING
TAG3 recommends that the Steering Committee include an implementation plan as part of
the final report. The implementation plan should identify lead organizations or entities for
advancing priority recommendations, and lay out specific actions and timeframes.
6. PROVIDE ONGOING LEADERSHIP AND COMMITMENT
Finally, TAG3 recognizes the imperative that the state climate response strategy be a
dynamic document; effective implementation will require continued leadership and
commitment. The 5560 Steering Committee should evaluate mechanisms for ensuring
ongoing leadership (such as a standing steering committee, a state level cabinet post on
climate change, etc.) as well as providing guidance and support for active adaptive
management that builds new science, tools and approaches.

TAG3 Interim Report February/2011 33 | P a g e
V. REFERENCES CITED
Barclay, E. D. Batker, and A. Kaler. 2004. Untold Value: Nature's Services in Washington State. Asia Pacific Environmental
Exchange (now Earth Economics), Seattle, Washington.
http://www.eartheconomics.org/FileLibrary/file/Reports/Puget%20Sound%20and%20Watersheds/Untold_Value.pdf ,
accessed February 2, 2011.
Batker, D., M. Kocian, J. McFadden, and R. Schmidt. 2010. Valuing the Puget Sound Basin: Revealing Our Best Investments
2010. Earth Economics. Tacoma, Washington.
Climate Impacts Group. 2009. The Washington Climate Change Impacts Assessment. M. McGuire Elsner, J. Littell, and L.
Whitely Binder (eds). Center for Science in the Earth System, Joint Institute for the Study of the Atmosphere and Oceans,
University of Washington, Seattle, Washington.
Ecosystem Services Project. 2011. http://www.ecosystemservicesproject.org/index.htm, accessed February 2, 2011.
Elsner, M.M., L. Cuo, N. Voisin, J. Deems, A.F. Hamlet, J.A. Vano, K.E.B. Mickelson, S.Y. Lee, and D.P. Lettenmaier. 2010.
Implications of 21st century climate change for the hydrology of Washington State. Climatic Change 102(1-2): 225-260,
doi: 10.1007/s10584-010-9855-0.
Feely, R.A., S.C. Doney, and S.R. Cooley. 2009. Ocean acidification: Present conditions and future changes in a high-CO2 world.
Oceanography 22(4):36–47.
Hudson, B. 2010. ―Environmental and Economic Benefits of Washington State Shellfish Production‖, presentation by Bobbi
Hudson, Research Biologist, Pacific Shellfish Institute, at the Aquaculture 2010 Conference, San Diego, California.
Presented Wednesday, March 3, 2010. Presentation accessed January 20, 2011 at
https://www.was.org/documents/MeetingPresentations/AQ2010/AQ2010_0363.pdf
Jackson, J.E., M.G. Yost, C. Karr, C. Fitzpatrick, B. Lamb, S.H. Chung, J. Chen, J. Avise, R.A. Rosenblatt, and R.A. Fenske.
2010. Public health impacts of climate change in Washington State: projected mortality risks due to heat events and air
pollution. Climatic Change 102(1-2): 159-186, doi: 10.1007/s10584-010-9852-3.
Leschine 1997: Thomas M. Leschine, Katharine F. Wellman, Thomas H. Green, 1997, The Economic Value of Wetlands:
Wetlands' Role in Flood Protection in Western Washington, School of Marine Affairs, University of Washington. Prepared
for the Washington Department of Ecology, Publication No. 97-100, Lacey, Washington. Available at:
http://www.ecy.wa.gov/pubs/97100.pdf
Littell, J.S., E.E. Oneil, D. McKenzie, J.A. Hicke, J.A. Lutz, R.A. Norheim, and M.M. Elsner. 2010. Forest ecosystems,
disturbance, and climatic change in Washington State, USA. Climatic Change 102(1-2): 129-158, doi: 10.1007/s10584-010-
9858-x.
Mantua, N.J., I. Tohver, and A.F. Hamlet. 2010. Climate change impacts on streamflow extremes and summertime stream
temperature and their possible consequences for freshwater salmon habitat in Washington State. Climatic Change 102(1-2):
187-223, doi: 10.1007/s10584-010-9845-2.
Mote, P.W., and E.P. Salathé. 2010. Future climate in the Pacific Northwest. Climatic Change 102(1-2): 29-50, doi:
10.1007/s10584-010-9848-z.
Mote, P.W., A. Petersen, S. Reeder, H. Shipman, and L.C. Whitely Binder. 2008. Sea Level Rise in the Coastal Waters of
Washington State. Report prepared by the Climate Impacts Group, Center for Science in the Earth System, Joint Institute for
the Study of the Atmosphere and Oceans, University of Washington, Seattle, Washington and the Washington Department
of Ecology, Lacey, Washington.
Salathé, E.P., L.R. Leung, Y. Qian, and Y. Zhang. 2010. Regional climate model projections for the State of Washington.
Climatic Change 102(1-2): 51-75, doi: 10.1007/s10584-010-9849-y.
Swedeen, P. and J. Pittman. 2007. Ecological Economic Assessment of King County’s Flood Hazard Management Plan. Earth
Economics. Report commissioned by the King County Department of Natural Resources, Seattle, WA. Available at:
http://www.floods.org/ace
iles/documentlibrary/committees/Ecological_Economics_Assessment_of_King_County_Flood_Hazard_Management_Plan.
TCW Economics. 2008. Economic Analysis of the Non-Treaty Commercial and Recreational Fisheries in Washington State.
December 2008. Sacramento, CA. With technical assistance from The Research Group, Corvallis, OR. Available at:
http://wdfw.wa.gov/publications/pub.php?id=00464 (accessed January 19, 2011)
Tohver, I. and A.F. Hamlet. 2010. Impacts of 21st century climate change on hydrologic extremes in the Pacific Northwest
region of North America. Chapter 7 in Final Report for the Columbia Basin Climate Change Scenarios Project, Climate
Impacts Group, University of Washington, Seattle, Washington.

TAG3 Interim Report February/2011 34 | P a g e
Vermeer, M. and S. Rahmstorf. 2009. Global sea level linked to global temperature. Proceedings of the National Academy of
Sciences 106(51): 21527-21532, doi: 10.1073/pnas.0907765106
Ulbrich, U., J. G. Pinto, H. Kupfer, G.C. Leckebusch, T. Spangehl, and M. Reyers. 2008. Changing Northern Hemisphere storm
tracks in an ensemble of IPCC climate change simulations. Journal of Climate 21: 1669-1679.
UNEP. 2006. Marine and Coastal Ecosystems and Human Wellbeing: A Synthesis Report Based On the Findings of the
Millennium Ecosystem Assessment. United Nations Environmental Program, Nairobi, Kenya.
U.S. Department of the Interior, Fish and Wildlife Service, and U.S. Department of Commerce, U.S. Census Bureau. 2006
National Survey of Fishing, Hunting, and Wildlife-Associated Recreation. http://www.census.gov/prod/2008pubs/fhw06-
wa.pdf

TAG3 Interim Report February/2011 35 | P a g e
APPENDIX A: SPECIFIC ADAPTATION STRATEGIES FOR ECOLOGICAL
SYSTEMS
INTRODUCTION AND FORMAT
The following section presents specific adaptation strategies for four separate ecological systems.
Each subsection begins with a narrative description of the system and projected climate impacts
and follows with a table listing the major adaptation objectives, strategies and actions identified
by the subgroups working on this system. The tables include early ideas and considerations
related to implementation, including existing programs, new programs or policies which might
be needed, and institutional barriers that may need to be addressed prior to implementation.
The narrative for each ecological system also highlights a selected number of strategies
considered more or less unique to that system. While many adaptation strategies for ecosystems
and species are similar across habitat types, some are more exclusive or applicable to a single
habitat type. Each of the following narratives thus highlight those strategies most applicable to
the specific ecological systems for which they were developed.
Marine and Coastal systems in Washington 7
Description and Distribution
Washington’s coastline stretches through 3,100 miles of diverse terrain along the shores of the
Pacific Ocean and Puget Sound. This area encompasses a variety of habitats including bays and
estuaries, coastal dunes and beaches, rocky shores, and the continental shelf.
Projected Climate impacts and consequences on marine and coastal ecosystems:
Coastal estuaries, tidal flats, beaches, dunes and other coastal habitats particularly
vulnerable to many of the projected impacts from climate change. For example:
Sea surface temperatures are projected to increase 2.2 degrees by 2030-2059, affecting
salmon migration ranges, introducing increased stress and diseases for shellfish, sea
urchins and some mammals.
Conservative estimates project a sea level rise of 6-22‖ in Puget sound by 2050, with
estimates for 2100 projected at 6-50‖. Sea level rise at the mid range of 23‖ would result
in significant loss or reduction of coastal habitats -- 65% loss of estuarine beaches, 61%
loss of tidal swamps, 44% loss of tidal flats. These changes will reduce the availability
of refuge and spawning areas for finfish, shellfish, wildlife and shorebirds.
Coastal erosion is expected to increase due to sea level rise and intensified storm activity,
resulting in lost near shore habitat and lack of sediment accretion.
7 The primary reference document for this section was ―Climate Change Effects on Marine and Coastal Habitats in
Washington State‖, prepared by the National Wildlife Federation and WDFW (Appendix E)

TAG3 Interim Report February/2011 36 | P a g e
A lack of dissolved oxygen in coastal waters, known as costal hypoxia is also expected to
increase due to more upwelling, sea surface temperature rise and changes in the delivery
of nutrients to coastal zones. Hypoxic conditions can result in fatal stresses for some
organisms, such as rockfish, Dungeness crab, and decreases in reproductive success and
growth rates for others. Coastal hypoxia is also believed to exacerbate ocean
acidification.
Ocean acidification, a decline in ocean pH, is already observed in Washington’s coastal
waters. Future projections depend on the concentrations of atmospheric CO2 , but could
be significantly increased. The reduced carbonate harms shell building species such as
corals and shellfish, as well as some plankton. Shifts in phytoplankton diversity has
potential implications for ocean food webs.
Loss of snowpack and changes in freshwater inflow to Puget Sound and ocean systems
will alter the hydrology of coastal systems; for example, increased winter flooding could
bring in increased nutrients and pollutants and salinity patterns may be altered due to
reductions in freshwater inflow.

TAG3 Interim Report February/2011 37 | P a g e
MARINE/COASTAL Existing Programs/Tools New Programs or Policies
Needed
Institutional Barriers or
Information Gaps
Support resistance, resilience and response of natural systems in the face of climate change.
OBJECTIVE 1.1: Facilitate inland migration of habitats; preserve and restore corridors.
Strategy 1.1.1: Identify, designate and protect
areas most suitable for natural habitat
migration zones.
Actions might include:
Secure better maps and modeling; know the rate of sea level rise at specific locations.
Conducting a vulnerability assessment to determine areas most sensitive to sea level rise,
Using regulatory, non-regulatory means to designate and secure natural buffer areas.
Develop non-regulatory incentive programs to protect migration corridors.
Acquire land or development rights.
Assess costs and remove incentives of maintaining at-risk development,
Use failure as an opportunity to remove or move structures and barriers versus building them back.
Designate priority habitats for
protection under GMA -- critical areas
ordinances and through state agency
conservation designations.
Build adaptation criteria into private,
federal and state grant programs for
protecting habitat. (for example
Pacific Coast Joint Ventures (private),
Washington Wildlife Recreation
Program, Salmon Recovery Funding
Board grants, ESRP (state) and USFWS
coastal grant (federal) .
Ensure climate change and the
importance of preserving habitat
migration zones is integrated into the
Puget Sound Near Shore Estuary
Restoration Program (PSNERP)
Integrate climate change
adaptation priorities into federal
and state funded agricultural
easement program.
Better maps and
characterization of sea level
rise vulnerability for WA coast.
Identification of high priority
areas for inland habitat
migration
Strategy 1.1.2: Restore priority habitat areas
most suitable for natural habitat migration
zones
– current and future.
Actions might include:
Identify priority areas for restoration,
Build adaptation criteria into private,
federal and state grant programs for
protecting habitat. (for example
Pacific Coast Joint Ventures (private),
Washington Wildlife Recreation
Program, Salmon Recovery Funding
Address potential economic
impacts to agricultural
community from removing
dikes.
Conduct cost/benefit for
Identify areas to relocate land
uses that require heroic
protection.
Resistance from development
community.

TAG3 Interim Report February/2011 38 | P a g e
MARINE/COASTAL Existing Programs/Tools New Programs or Policies
Needed
Institutional Barriers or
Information Gaps
Recover essential processes (fluvial, tidal connections, material transport).
Redesign and ultimately remove existing structures and barriers to inland migration for priority areas (for example, dikes, roads, seawalls, bulkheads).
Board grants, ESRP (state) and USFWS
coastal grant (federal) .
Habitat restoration programs focused
on dike removal (Skagit and Nisqually
deltas). Coastal erosion programs.
maintaining at risk properties
(those vulnerable to sea level
rise and storm surges).
Possible economic impacts to
agricultural community from
removing dikes.
OBJECTIVE 1.2: Maintain Shoreline Sediment Transfer Processes.
Strategy 1.2.1: Protect current sediment
sources and transport processes throughout the
littoral system.
Actions might include:
Prohibit armoring on feeder bluffs
Prohibit barriers in sediment transport in drift cells.
Protect connectivity b/w sediment sources and deposition areas.
Protect habitat structure that influences sediment processes (i.e., submerged aquatic vegetation (eelgrass beds, seafloor morphology)
Strengthen existing setback regulation in SMA and local programs.
Puget Sound Nearshore Ecosystem
Restoration project (PSNERP)
Build adaptation criteria into private,
federal and state grant programs for
protecting habitat. (for example
Pacific Coast Joint Ventures (private),
Washington Wildlife Recreation
Program, Salmon Recovery Funding
Board grants, ESRP (state) and USFWS
coastal grant (federal) .
Shoreline Management Act and the
HPA permits are existing regulatory
tools which can possibly be used to
facilitate implementation.
Ensure that data on areas
important for protection is in
useable formats for planners
and others.
Finer scale mapping of
sediment sources in coastal
areas.
Costs to preserve sediment
transport; eliminate barriers
and preserve connectivity.
Resistance from communities
and others on development
restrictions.
Strategy 1.2.2. Restore sediment sources and
transport processes that provide ecosystem
services.
Build adaptation criteria into private,
federal and state grant programs for
protecting habitat. (for example
Pacific Coast Joint Ventures (private),
Programs to mitigate the short
term impact from the
restoration action.
Finer scale mapping of
sediment sources in coastal
areas.

TAG3 Interim Report February/2011 39 | P a g e
MARINE/COASTAL Existing Programs/Tools New Programs or Policies
Needed
Institutional Barriers or
Information Gaps
Actions might include:
Prioritize areas most in need or most valuable for restoration.
Explore removal of dams and other barriers where feasible.
Explore small scale projects with significant benefit (for example, Stavis NRCA estuary restoration).
Consider beach nourishment where restoration is not possible.
Washington Wildlife Recreation
Program, Salmon Recovery Funding
Board grants, ESRP (state) and USFWS
coastal grant (federal) .
PSNERP: Prioritize areas most in need
or most valuable for restoration
Resistance from communities
and others on development
restrictions.
Objective 1.3 Protect viable populations of native species
Strategy 1.3.1: Identify and protect high quality
habitats that are resilient to climate change or
important to maintaining species diversity
(genetic, dispersal, recruitment).
Actions might include:
an inventory of coastal lands which provide high quality habitats and which are resilient to climate change and currently have inadequate protection.
Land acquisition programs (federal,
state and NGO funded).
Use regulatory mechanisms to
designate and protect lands (for
example (GMA – critical areas
ordinances, Shoreline Management
Program, HPA permits).
Employ existing voluntary programs, ,
such as tax incentives for open space.
Costs – purchase and
longterm maintenance of
lands.
Inventory of coastal lands
which provide high quality
habitats and which are
resilient to climate change and
currently have inadequate
protection
Strategy 1.3.2: Increase the resiliency of
species vulnerable to climate change by
reducing current and preventing future
stressors.
Actions might include:
Prevent fragmentation of habitats,
PSNERP addresses priorities for
protection and restoration of habitat.
Oil Spill Task Force.
Clean Water Act
Better understanding the role
and impact of non native
species.
What do priority species need
to maintain viability?

TAG3 Interim Report February/2011 40 | P a g e
MARINE/COASTAL Existing Programs/Tools New Programs or Policies
Needed
Institutional Barriers or
Information Gaps
Improve water quality,
Address invasive species
Reduce risks from consumptive uses (including harvest pressure)
Recover processes influenced by human activities and that exacerbate climate change impacts.
Invasive Species Council and programs
need to address climate change
priorities.
Objective 1.4: Preserve high water quality for humans and species.
Strategy 1.4.1: Reduce non-climate stressors
that contribute to hypoxic conditions and
exacerbate marine acidification. For example,
stormwater and septic issues, non-point and
point source pollution.
Federal and State Water Pollution
laws.
Coastal Zone and Shoreline
management laws.
Local land use laws.
Federal and state grant programs.
Enhance existing programs to
address hypoxia and
acidification.
Build the Necessary Scientific and Institutional Readiness to Support Effective Adaptation
Strategy 2.1: Address existing practices and
institutional barriers that prevent inland habitat
migration.
Actions might include review and revision
of policies, for example:
Requiring greater development set back and dynamic or adaptive setbacks such as rolling easements.
Preventing shoreline hardening through use of alternatives
Use regulatory tools to address
institutional barriers to protecting
priority areas for inland habitat
migration -- (for example (GMA –
critical areas ordinances, Shoreline
Management Program, HPA permits).
Evaluate and consider
implementation of tools such as
rolling easements.
Address possible impacts due
to increased risk of property
damage from flooding?
Better maps and
characterization of SLR
vulnerability for WA coast.
Build a better science base to
inform alternatives to hard
armoring.

TAG3 Interim Report February/2011 41 | P a g e
MARINE/COASTAL Existing Programs/Tools New Programs or Policies
Needed
Institutional Barriers or
Information Gaps
Build a better science base to inform alternatives to hard armoring.
Requiring planning that addresses future climate change impacts prior to allowing development projects to be built.
Strategy 2.2: Conduct monitoring and research
of marine acidification to understand local
extent and impacts to food web and water
quality
Existing marine monitoring programs
should address acidification.
Federal and state grants; dedicated
state and federal funding
Expanded monitoring and
research programs to
understand extent and impacts
from acidification.
Research on this subject is in
the early stages – much is not
known about impacts and
potential adaptation.
Perception that it is a federal
program.
Strategy 2.3: Address the impacts of climate
change related changes in freshwater inputs to
marine and estuarine waters.
Actions might include:
Adjust design standards for stormwater to better protect marine waters, include promoting low impact development.
Implement programs for managing instream flows to enhance resiliency of the marine and estuarine environment.
Government and academic
researchers.
Federal, State, and Tribal water quality
and habitat programs.
State and Federal grants and dedicated
funding.
Improvements to stormwater permits
and state water management
programs.
Lack of regulatory and
management structure to
address large-scale cumulative
effects.
Research, monitoring, and
modeling needed to
understand the effects of
these changes.
Strategy 2.4: Incorporate sea level rise and
increased storm events in prioritization, design
and post project maintenance of toxic cleanup
sites on shorelines.
Actions might include:
Assess degree of threat and existing efforts.
Incorporate sea level rise into federal,
State, and Tribal water quality and
toxic cleanup programs.
Enhance existing programs to
address climate impacts.
Lack of regulatory and
management structure to
address climate impacts.
Research, monitoring, and
modeling needed to
understand these impacts.

TAG3 Interim Report February/2011 42 | P a g e
MARINE/COASTAL Existing Programs/Tools New Programs or Policies
Needed
Institutional Barriers or
Information Gaps
Strategy 2.5: Enhance existing monitoring of
physical, chemical and biological properties of
the estuarine and marine water column and
sediments to monitor climate change impacts.
Actions might include:
Evaluate potential cumulative impacts with enhanced monitoring programs.
Existing marine monitoring and
research programs could be
expanded and enhanced. For
example:
Support expanded monitoring for long term oceanographic data for nearshore waters in Puget Sound, Gray’s Harbor and Willapa Bay.
Establish long term monitoring stations near the western extent of the Strait of Juan de Fuca to monitor characteristics of oceanic waters.
Establish a marine
zooplankton monitoring
program to characterize
zooplankton populations and
their vulnerability.
Strategy 2.6: Conduct a climate change
vulnerability assessment for marine species.
Actions might include:
Inventory who is doing what, conducting research to understand the productivity of food webs and species relationships among trophic levels.
Develop a management plan for maintaining most at risk species that includes actions to address climate change.
Puget Sound Partnership Action
Agenda – Science Panel.
Inventory “who is doing what”.
Need a partnership to
implement – maybe between
federal, state, tribes, academics,
NGOs
Information about species
distribution in marine
environments.
Research to understand
impacts to productivity of
food webs and relationships
among trophic levels.

TAG3 Interim Report February/2011 43 | P a g e
Forests and Western Prairies8
Description and Distribution
Forests cover close to half of Washington State. They make up the principal ecosystems and
comprise the major landscapes of the Pacific Northwest. These forest systems are dominated by
native conifers with interspersed areas of hardwoods where recent or frequent disturbance has
allowed species such as alder, maple or cottonwood to temporarily flourish. The western and
wetter eastern portions of the state have forests dominated by Douglas-fir (Pseudotsuga
menziesii), which is also the most commercially harvested species.
Thousands of acres of once mixed species stands also have been planted to Douglas-fir for
commercial purposes. Other conifer species dominate stands with areas of western hemlock,
western red cedar, Sitka spruce, or silver fir on the west side of the state and Ponderosa and
lodgepole pine becoming more dominant on the east side of the state. The ecological services
provided by the forested areas of the state include clean cold water, clean air, flood and
temperature attenuation, and nutrient and soil development, not to mention the numerous wood
and other products and resources upon which we depend.
Western Prairies
The grassland prairies of western Washington once covered tens of thousands of acres in the
lowlands and islands of Puget Sound and south to the Columbia River. They developed on soils
leftover from the retreating glaciers of the most recent ―stade‖ of the past ice age which reached
its peak 15,000 years ago. Today only about three percent of the original prairies remain. The
prairie areas existing today are threatened by encroaching tree cover, due to the suppression of
fire once used to as a management tool; continued development of residential areas and the
desire to exploit the gravel deposits that underlay them. These areas provide significant
ecological services for groundwater recharge due to the porosity of the soils on which they are
found.
Projected Climate Impacts and Consequences
Climate change is likely to bring significant changes to Washington’s forest and prairie
ecosystems. Particularly, shifts in the frequency and type of precipitation, with decreased
snowpack and warmer, wetter winters and summers that are longer with less rain and higher
temperatures, will impact the plant associations and distribution of the forests and forest types. It
is expected that an increase in the intensity and frequency of wildfires will be an outcome of
8 The primary reference document for this section was ―Climate Change Effects on Forest,
Alpine and Western Prairie Habitats in Washington State‖, prepared by the National Wildlife
Federation and WDFW (Appendix E)

TAG3 Interim Report February/2011 44 | P a g e
these shifts. Tree species also are likely to become more susceptible to pests and increased storm
intensity will bring more threats from landslides and flooding.
Drier Summers: For summer months, a majority of models projected decreases in
precipitation, with the average declining 16% by the 2080s. Some models predicted
reductions of as much as 20-40% in summer precipitation; these percentages translate to
3- 6 cm over the summer season (June/July/August).
Wetter winters: In winter, a majority of models projected increases in precipitation, with
an average value reaching +9% (about 3 cm) by the 2080s under the higher-emissions
modeling scenario (A1B); this value is small relative to interannual variability. Although
some of the models predicted modest reductions in fall or winter precipitation, others
showed very large increases (up to 42%).
In general, forest species are predicted to shift their ranges northward and higher in elevation,
with new vegetation communities developing over space and time. The predicted rates of climate
change may push the climatic boundaries of forest types northward at a rate faster than the
predicted rate of species migration, such that shifts could lag behind changes in climate.
Increases in fire frequency could result in shifts in vegetation community composition toward
more fire-tolerant species or otherwise alter plant communities that depend on a given fire
regime to persist. In addition to altering forest structure, a change in fire frequency and duration
could influence the susceptibility of forests to insect attacks (either more or less so, depending on
change).
Projected changes in climate will have impacts on western Washington prairie ecosystems as
well. Warmer springs and associated shifts in stream peak flows, longer and drier summers, and
more intense rainfall events may affect species composition and competition between native and
invasive species. While some of the impacts might be negative for vulnerable endemic species,
there might also be opportunities created for oak-woodland restoration efforts as climatic
conditions for oak growth and development improve. Longer summer drought may favor the
continuation or expansion of prairie grasslands into areas where conifer encroachment has
overtopped and changed the prairie landscape.

TAG3 Interim Report February/2011 45 | P a g e
FORESTS Existing Programs/Tools New Programs or Policies
Needed
Institutional Barriers or
Information Gaps
Support resistance, resilience and response of natural systems in the face of climate change.
OBJECTIVE 1.1: Maintain connectivity between core functioning forest habitats.
Strategy 1.1.1: Identify important connectivity areas for
plants and animals that are robust to climate change
(areas that provide connectivity across climatic
gradients, including elevational, latitudinal, and
precipitation gradients.)
Actions might include:
Complete ongoing climate change connectivity analysis at ecoregional level;
Conduct periodic update analysis to incorporate changing land use patterns and climate change science.
Washington Wildlife Habitat
Connectivity Working Group
(WWHCWG). – statewide analysis
of habitat corridors project.
The PNW Climate change
Vulnerability Assessment for
Species and Habitats.
Species movement
requirements and habitat
preferences are often highly
uncertain
OBJECTIVE 1.2: Maintain ecological services provided by forest landscapes.
Strategy 1.2.1: Adjust the size, boundaries and location
of large conservation areas (e.g. parks, wilderness,
NRCAs) to meet needs of biodiversity under climate
change impacts.
Actions might include:
Conduct study to evaluate options for changing
preserve boundaries, identify new areas that are
needed to provide core areas or important
connectivity between cores;
Identify ecological conditions that are critical for
species movements or migrations.
Agency Plans for species and
habitats; DNR’s Natural Heritage
Plan, and WDFW Lands 20/20
Regional conservation initiatives,
including Western Governors
Association Pilot Projects, NW
Forest Plan, and the WWHCWG.
Federal and State grant programs
for conservation.
PNW Climate Vulnerability Assessment
for Species and Habitats.
Studies to evaluate options for
changing preserve boundaries
in light of needs of biodiversity
in a changing climate.
Identify new areas that are
needed to provide core areas
or important connectivity
between cores;

TAG3 Interim Report February/2011 46 | P a g e
FORESTS Existing Programs/Tools New Programs or Policies
Needed
Institutional Barriers or
Information Gaps
Build necessary scientific and institutional readiness to support effective adaptation
OBJECTIVE 2.1: Increase resilience to large scale disturbances caused by fire, flooding, insects and disease.
Strategy 2.1.1: Expand landowner capacity to
implement silvicultural practices (e.g., thinning, fuel
management, underplanting) that increase forest
structural diversity and enhance species diversity.
Actions might include:
Increase outreach and information efforts. Expand WSU and County extension capacity to deliver forestry education programs and tools.
Fund Landowner Assistance program capacity, technical assistance, incentives and grant programs.
Diversify forest regional economy
Stewardship Forestry education.
Cost share programs for
landowners.
Workshops hosted by a variety of
NGOs and Universities
Modify existing programs to
accommodate climate change
priorities.
Increased public education on the
valued of forest structural
diversity
Increased markets for ecosystem
services and carbon storage
Timber value impacts of
variable density thinning
Long-term impacts on carbon
storage need to be better
quantified
Strategy 2.1.2: Implement silvicultural practices that
increase tree vigor and resistance to insects, pathogens,
and adverse weather in areas of increased risk to climate
change.
Actions might include:
Increase capacity to inform and assist small private forest landowners.
Increase biomass or other marketing options for wood products.
Reduce hazardous fuels in fire prone ecosystems.
WSU and County Extension
programs
DNR Landowner Assistance,
NRCS and Conservation Districts,
Washington Forest Protection
Association and Washington Farm
Forestry Association.
Modify existing programs to
increase forest landowner access
to federal grants and other
funding mechanisms.
Develop new ecological services
markets and/or incentives.
Expand laboratory evaluations
and test out planning
performance of native conifer
families or alternative species.
Short term impacts on species
at risk poorly
quantified/politically difficult

TAG3 Interim Report February/2011 47 | P a g e
FORESTS Existing Programs/Tools New Programs or Policies
Needed
Institutional Barriers or
Information Gaps
Strategy 2.1.3: Develop drought and disease resistance
forest ecosystem non-commercially important species.
Actions might include:
Expand funding for high priority noncommercial and commercial species genetic research and testing.
USFS Research programs,
BC Ministry of Forests, Universities.
NW Seed Orchard Managers
Association
Existing knowledge limited for
some species
Strategy 2.1.4: Promote structural and landscape
diversity to minimize likelihood of catastrophic
disturbances.
Actions might include:
Modify existing land management plans to increase seral stage diversity on landscapes.
Promote certification of lands which brings the requirement to coordinate planning on a landscape level
Forest Practices Rules
Landowner management plans,
Habitat Conservation Plans
Landscape level landowner
agreements among multiple
landowners,
Encourage forest certification
programs.
Address apprehensions from
private lands owners to coordinate
planning with public land that has
a different management goal
Strategy 2.1.5: Redefine priorities for fire management
in areas important to biodiversity and species at risk,
shifting emphasis from fire prevention/suppression to
proactive management designed to increase resilience
and decrease likelihood of severe fire.
Actions might include:
Increase fuel reduction strategic plan;
Increase fuel reduction treatments.
Public outreach.
Increase expertise and capacity in prescribed fire management.
DNR Wildfire Strategic Plan
Washington Statewide Assessment
and Strategy
USFS National Fire Plan & Cohesive
Strategy
Prioritize areas for emphasis on
fuel reduction and suppression.
Pattern of ownership will
remain an impediment to
implementation

TAG3 Interim Report February/2011 48 | P a g e
FORESTS Existing Programs/Tools New Programs or Policies
Needed
Institutional Barriers or
Information Gaps
OJBECTIVE 2.2: Maintain ecological services provided by forest landscapes
Strategy 2.2.1: Identify and implement action to
increase landscape resilience by reducing risk of
conversion to non-forest use in areas most susceptible to
climate change impacts.
Actions might include:
Purchase land or development rights in high priority areas.
Provide education and incentives to increase forest stewardship over time.
NW Environmental Forum
Cascade Land Conservancy and
other land trusts.
Forest Legacy Programs (grant
funding)
"Ties to the Land" Forest
conservation planning program
(WSU, DNR).
Provide education and incentives
to increase forest stewardship
over time.
Strategy 2.2.2: Outreach and education on values of
ecological services provided by forest lands
Actions might include:
Landowner/Public Opinion surveys
WSU and County Extension
programs
DNR Landowner Assistance,
NRCS and Conservation Districts,
Washington Forest Protection
Association and Washington Farm
Forestry Association
Develop outreach and educational
materials on value of ecosystem
services that can be shared among
organizations
Quantifying contribution of
forest ecosystem services;
identifying those at risk from
climate change.
Strategy 2.2.3: Protect specific habitat components that
are rare, are hard to replace, or provide critical spatial
and temporal habitat linkages in a time of rapid
environmental change.
Actions might include:
WSU and County Extension
programs
DNR Landowner Assistance,
NRCS and Conservation Districts,
Prepare extension material and
case studies that describe
vulnerable elements and
demonstrate protection
techniques.
Identify elements at risk
through the PNW Climate
change Vulnerability
Assessment for Species and
Habitats.

TAG3 Interim Report February/2011 49 | P a g e
FORESTS Existing Programs/Tools New Programs or Policies
Needed
Institutional Barriers or
Information Gaps
Identify elements through WDFW Vulnerability Assessment.
Prepare extension material and case studies that describe vulnerable elements and demonstrate protection techniques.
Provide special outreach to conservation area managers to communicate vulnerabilities.
Create incentives to landowners to implement conservation measures
NGOs and land trusts,
State and Federal Grant programs.
Forest Health and Heritage
Programs.
Provide special outreach to
conservation area managers to
communicate vulnerabilities.
Create incentives to landowners to
implement conservation measures
Strategy 2.2.4: Develop Decision support systems that
make climate change science and conservation needs
accessible to decision makers, landowners and
managers, NGO's and other interested public
Actions might include:
1. Expand capacity of DSS from pilot scope to statewide/
regional scope
WDFW – Priority Habitat and
Species Database; online
NOAA/USGS Pilot Project in
Methow to develop climate change
DSS for land use managers.
DataBasin
Long-term, sustainable decision
support system.
Strategy 2.2.5: Flooding Disturbance Vulnerability
Assessments
Actions might include:
Outreach to planning groups
Targeted coordination with fisheries and near shore interest groups
Increased coordination on forest management with impacts on infrastructure, fish, water supply, transportation
USFS Research programs, BC
Ministry of Forests, Universities
USDA Forest Service, Pacific
Northwest Region (Region 6)
Protection Program
Conservation Biology Institute data
basin
Modify existing programs/laws to
accommodate climate change
priorities and risks
Increased public education on the
value of forest cover and scope of
riparian influence
Relations are based on episodic
events with limited public
memory
Private resistance to increasing
riparian buffer capacity and
redundancy

TAG3 Interim Report February/2011 50 | P a g e
FORESTS Existing Programs/Tools New Programs or Policies
Needed
Institutional Barriers or
Information Gaps
Strategy 2.2.6: Conduct vulnerability assessment for
different ecological systems and key species within forest
habitats and implement findings in planning, policy and
management actions.
Actions might include:
Coordination of data use
Cooperative data collection
Development of new analysis methods
NatureServe Climate Change
Vulnerability Index (NSVI)
Climate Change Sensitivity
Database (CCSD), a part of the
Pacific Northwest Climate Change
Vulnerability Assessment (Lawler
and Case 2010),
USDA Forest Service, Pacific
Northwest Region (Region 6)
Vulnerability Assessment
underway.
Modify existing programs/laws to
accommodate results of
vulnerability assessment in terms
of protecting elements most at
risk.
Species movement
requirements and habitat
preferences are often highly
uncertain
Strategy 2.2.7:: Implement monitoring programs that
are sufficiently sophisticated and precise to identify
vegetation changes and relate those changes to climate
conditions or weather events.
Actions might include:
Coordination of existing monitoring efforts
Provide monitoring planning specifically for change species change detection
Increased data sharing extended to non federal partners
Forest Service and National Park
Service Pacific Northwest Research
Station’s Forest Inventory and
Analysis (FIA) USDA 2010.
North Coast and Cascades Network
(Woodward et al. 2004) USDA
Forest Service,
Pacific Northwest Region (Region 6)
Forest Health Protection Program
May require new interpretation of
HCP requirements/ other existing
agreements and regulations
Focus is on federal land
Funding for monitoring
programs under threat
Existing temporary monitoring
plots networks used for most
forestry inventory might be
insufficient
Strategy 2.2.8: Insect/Pest/Disease Outbreak
Vulnerability Assessments
Actions might include:
USDA Forest Service, Pacific
Northwest Region (Region 6) Forest
Health Protection Program
Forest Service Pacific Northwest
May require new agreements and
regulations
Coordination of existing
monitoring efforts and data
sharing as in the date basin
project to no federal partners

TAG3 Interim Report February/2011 51 | P a g e
FORESTS Existing Programs/Tools New Programs or Policies
Needed
Institutional Barriers or
Information Gaps
Coordination of existing monitoring efforts and data sharing as in the date basin project to no federal partners
Provide monitoring planning specifically for change species change detection
Research Station’s Western
Wildland Environmental Threat
Assessment Center based in Oregon
Strategy 2.2.9: Large scale Fire Vulnerability
Assessments
Actions might include:
Coordination of existing monitoring efforts and data sharing as in the date basin project to no federal partners
USDA Forest Service, Pacific
Northwest Region (Region 6) Forest
Health Protection Program
Interior Columbia Basin
Ecosystem Management Project
May require new agreements and
regulations
Existing temporary plots networks
used for most forestry inventory
might be insufficient
OBJECTIVE 2.3: Maintain connectivity between core functioning forest habitats.
Strategy 2.3.1: Integrate results of statewide
connectivity analyses into planning and policy and land
management activities.
Actions might include:
Conduct local planning efforts,
Develop management recommendations,
Protect/conserve key connectivity areas
WDFW Priority Habitats and
Species Database;
Growth Management Act
WWHCWG report on institutional
opportunities to implement habitat
connectivity planning.
Add capacity to existing FIA
program
Landscape-level monitoring of
species frequency and range is
a substantial undertaking

TAG3 Interim Report February/2011 52 | P a g e
FORESTS Existing Programs/Tools New Programs or Policies
Needed
Institutional Barriers or
Information Gaps
OBJECTIVE 2.4: Minimize the number of species at risk that are vulnerable to climate change impacts.
Strategy 2.4.1: Incorporate actual and anticipated
climate change impacts into species recovery or
management plans
Actions might include:
Determine genetic conservation needs for Species of Greatest Conservation Need.
Modify recovery plans to accommodate movements/migrations associated with changing habitats associated with climate change.
Habitat Conservation Plans; ESA
recovery plans.
Natural Heritage Plan
Need mechanism to encourage
the retrofitting existing HCPs and
landscape plans
Determine genetic
conservation needs for Species
of Greatest Conservation Need.

TAG3 Interim Report February/2011 53 | P a g e
ADAPTATION STRATEGIES FOR WESTERN PRAIRIES
WESTERN PRAIRIES
Strategy 1.1 Increase resistance of prairie systems to invasion by non-native grasses
Actions might include:
Invest in strategies that effectively remove invasive grasses from prairie systems Conserve and restore habitat components (native bunchgrasses) or processes (fire, soil nutrients) that improve competitive advantage
of native species Invest in and implement multi-ownership programs for early detection and rapid response to non-native grasses
Strategy 1.2 Maintain sensitive native prairie species and promote species and landscape diversity
Actions might include:
Invest in genetic research of drought and disease resistance provenances Conserve and restore species diversity Reduce existing stressors where applicable Promote landscape diversity through management and restoration to provide refugia during summer drought
Strategy 1.3 Manage prairie/grassland ecosystems so that they are more resilient to fire
Actions might include:
Implement multi-ownership landscape-level planning to prioritize areas for fire management. Collaborate with other agencies and organizations to develop technology and markets that increase economic feasibility of fire
treatments. Engage in public outreach and education opportunities that increase public awareness and support for management that promotes
fire management. Promote adaptive approach to landscape scale prairie/grassland management, including robust monitoring programs to evaluate fire
effects. Restructure how state and federal fire prevention funding is managed, shifting the emphasis from fire prevention/suppression to
proactive management designed to reduce fire risk Increase the expertise, capacity, and resources of the Department of Natural Resources to increase the use prescribed fire to promote

TAG3 Interim Report February/2011 54 | P a g e
prairie/grassland health and sustainability of fire-adapted grasslands on state and private lands Convene a state-wide multi-stakeholder group (incl. WDOE, WDNR, USFS, USEPA, TNC, WDFW, etc.) to identify current and projected
barriers to increasing the extent of prescribed burning in relation to state smoke management guidelines and national ambient air quality standards.
Conduct prescribed burning according to best management practices to achieve ecological and management goals aligned with fuel reduction and native habitat enhancement
Strategy 1.4 Maintain and restore a diversity of habitats with complex topography and functional habitat networks
Actions might include:
Collect, store and propagate seed of rare and at-risk species
Identify, preserve and/or restore diversity of habitats to provide refugia for sensitive species
Identify core and connectivity areas that are resilient to climate change effects
Identify and prioritize areas for protection that provide connectivity across climatic gradients, including latitudinal and precipitation gradients
Explore mechanisms for adjusting the size, boundaries and location of protected reserves

TAG3 Interim Report February/2011 55 | P a g e
Aridlands and Shrubstepe9
Description and Distribution
The aridlands of Washington primarily exist just beyond the east slopes of the Cascade
Mountains. The area is described as relatively well-vegetated semi-desert scrub or shrub-steppe
that occupies comparatively lower elevations in the basins, valleys, lower plateaus, foothills, and
lower mountain slopes in this region. They are composed of a number of habitat types including
sagebrush-steppe, grasslands and Palouse prairie that are punctuated or crisscrossed by perennial
or seasonal streams, springs, vernal pools and other wetland types, and some dune fields.
Aridland ecosystems in Washington receive precipitation largely during winter and spring when
evaporation and transpiration are minimal; summer storms are generally high-intensity, short-
lived events that contribute relatively little water to soils. Typical areas of native vegetation
include landscapes dominated by sagebrush (Artemesia spp.), bitterbrush (Purshiana tridentata)
and other woody shrub species along with bunch grasses, such as Idaho fescue (Festuca
idahoensis) or bluebunch wheatgrass (Pseudoroegneria spicata) and forbs adapted to dry
climatic conditions.
The aridlands of Washington are dominated by large areas of land converted to a variety of
agricultural uses such as wheat fields and row crops, fruit orchards, vineyards, and livestock
feeds like alfalfa. Others areas are used extensively for livestock grazing. Towns and other
population centers are generally small and widely dispersed. Public lands are broadly
interspersed with private lands with some private land holdings including blocks of thousands of
acres in a single ownership.
Projected Climate Impacts and Consequences
The effects of climate change in the Pacific Northwest are expected to include impacts to the
dry-adapted ecosystems in eastern Washington. In broad terms, temperatures will increase both
seasonally and year-over-year. Spring and summer seasons will likely see greater temperature
increases and the annual number of frost free days will continue to increase. Projections for
changes in precipitation include a small change in annual rainfall but some models predict a
trend toward wetter winters and drier summers with winter precipitation increasingly coming in
the form of rain instead of snow. The increasing levels of CO2 in the atmosphere could also have
effects on vegetation growth for both native plant populations and agricultural crops potentially
increasing productivity.
Changes in soil, water and air temperatures coupled with changes in precipitation will
undoubtedly have impacts on the native plant and animal populations that have adapted to past
conditions in the state’s aridlands. The consequences of climate change on aridlands species and
9 The primary reference document for this section was ―Climate Change Effects on Grassland and Aridland Habitats
in Washington State‖, prepared by the National Wildlife Federation and WDFW (Appendix E)
TAG3 Interim Report February/2011 56 | P a g e
ecosystems will likely include degradation and loss of plant and animal habitats, spatial shifts in
habitats and species, increased frequency and intensity of wildfires, increased soil erosion and
conditions favorable for invasive species and changes in plant and animal phenology resulting in
potential disruption in life cycles. A compounding factor that also must be considered when
analyzing impacts from climate change on natural systems is how humans will respond with
changes to infrastructure, water use and agricultural practices. These impacts may be ―indirect‖
but may magnify the effects of strictly climate-driven changes to the environment. To minimize
the potential detrimental consequences of climate change on the native plant and animal
populations of Washington’s arid land environment, a number of strategies and actions should be
adopted and implemented in order to protect and maintain the state’s biodiversity.

TAG3 Interim Report February/2011 57 | P a g e
Table 4.3
ARIDLANDS
Existing Programs/Tools
New Programs or Policies
Needed
Institutional Barriers or
Information Gaps
GOAL 1: Support resistance, resilience and response of natural systems in the face of climate change.
OBJECTIVE 1.1: Minimize and mitigate for loss of habitat due to climate change
Strategy 1.1.1: Protect habitat/areas most resilient to
climate change and that contribute to core habitat and
connectivity.
Actions might include:
Prioritize and evaluate areas for protection o Develop criteria to identify areas most
resilient to climate change and which contribute to core habitat and connectivity importance
o Identify areas important to biodiversity and species retention
Protect prioritized areas o Consider what tools are best – acquisition,
incentives, changes in regulation o identify best entity to implement
protection
State and Federal grant programs for
habitat acquisition (for example,
WWRP, National Resource
Conservation Service, USFWS).
Regulatory Tools, such as Growth
Management Act and the Priority
Habitat and Species lists.
Landscape level planning initiatives
with potential to address climate
change: Arid lands initiative, Western
Governors Association projects,
Landscape Conservation Cooperative,
and the Washington Habitat
Connectivity Working Group.
Agency strategic plans for land and
species protection, including the
Natural Heritage Plan, The
Comprehensive Wildlife Conservation
Strategy, WDFW lands 20/20 and the
Habitat and Recreation Lands
Coordinating Group.
Modify existing grant program
criteria to incorporate climate
change.
More complete
ecosystem/habitat inventory
information, where resilient
habitats exist, criteria for
prioritizing areas for
protection
In general there is a lack of
understanding of the value of
aridlands and a lack of
incentives for protecting
lands.
Bias toward individual wildlife
species rather than plants and
ecosystems.
Lack of criteria for habitat
protection within GMA

TAG3 Interim Report February/2011 58 | P a g e
ARIDLANDS
Existing Programs/Tools
New Programs or Policies
Needed
Institutional Barriers or
Information Gaps
OBJECTIVE 1.2: Maintain or increase the resilience of aridland ecosystems to climate change at both local and landscape levels.
Strategy 1.2.1: Maintain or improve ecological
function/integrity of those high priority areas
(see objective 1.1)
Actions might include:
Evaluate the current ecological condition of important areas
Develop restoration goals based on changing conditions
Provide incentives for restoration on private lands o Retool CRMP to address ecological
concerns
Federal and state grant programs for
land management and restoration
(USFWS, NRCS, WWRP)
Ecological Integrity Assessments,
currently underway through the
Natural Heritage Program, WDFW and
State Parks.
Existing range condition
methodologies
Broader adoption and
implementation of
Environmental Impact
Assessments (or something
similar)
Need for common language and
metrics for assessing ecological
function /integrity/condition.
Research on the trajectory of
change for ecosystems under
climate change. What new
aggregations of species can
we expect?
Strategy 1.2.2: Increase the ability of plants and animals
to move across the landscape.
Actions might include:
Protect critical spatial and temporal linkages that accommodate climate-influenced patterns of change
Assess current connectivity and prioritize important linkage areas for conservation (may be accomplished through the Columbia Plateau project of the WHCWG).
Adopt policies to avoid development (energy, residential) in those areas.
Incorporate connectivity concerns into proposals for new transmission lines (direct impact, plus enabler for wind and solar development)
WHCWG statewide and Columbia
Plateau analyses;
Western Governors Association Pilot
Projects;
Arid Lands Initiative.
Farm Bill programs (NRCS,FSA)
Local jurisdiction comprehensive
plans
Arid lands wide mitigation
program (funds from
development, conversion due to
new or enhanced water storage
projects; alternative energy
development, transmission lines,
etc.).
Incentives targeting connectivity
conservation as a climate change
adaptation strategy
Need agreed-upon priorities
for connectivity conservation
for all species, ecosystems
and habitats

TAG3 Interim Report February/2011 59 | P a g e
ARIDLANDS
Existing Programs/Tools
New Programs or Policies
Needed
Institutional Barriers or
Information Gaps
Strategy 1.2.3: Decrease threat from invasive species
and other non-climate stressors
Actions might include:
Improve invasive species management o Establish early detection protocols o Develop invasive species tracking tools and
alerts for landowners o Encourage coordinated and strategic
control – Weed Management Areas? o Support innovation in control methods o Increase funding for management and
weed control o Improve reporting of new and known
invasive species.
State and county weed board,
Washington Invasive Species Council,
Farm Bill programs (NRCS, FSA)
Develop a program to support
invasive species management
and monitoring costs when
acquiring land
Establish an early detection/rapid
response program for new
species
Address inadequate funding for
weed control and stewardship on
public lands
Develop a shared accessible
database of invasive species
detections and effective
treatments
OBJECTIVE 1.3: Maintain biodiversity by minimizing the number of species at risk
Strategy 1.3.1: Maintain high value and vulnerable (rare
and endemic) species in the face of threats from climate
change.
Actions might include
Identify and prioritize places that support ‘high value’ and ‘vulnerable’ species.
Protect prioritized places (including core habitats, connectivity needs, etc.)
Evaluate full range of conservation mechanisms for each prioritized place.
Identify organization(s)/agency(ies) best-suited for each conservation mechanism and for each place.
Apply appropriate tool(s) to priority places.
State and Federal Grant programs
aimed at habitat protection, including
WWRP, USFWS
Regulatory tools, including GMA
(priority habitats and species
database), hunting and fishing laws,
GMA and County comprehensive
plans.
Agency plans for species and habitat
protection, including Natural Heritage
plan and Comprehensive Wildlife
Conservation Strategy
Need to aggressively apply
tools to increase our
understanding of impacts of
climate change on individual
species.
Need to develop better trend
data for at-risk and endemic
species.

TAG3 Interim Report February/2011 60 | P a g e
ARIDLANDS
Existing Programs/Tools
New Programs or Policies
Needed
Institutional Barriers or
Information Gaps
Climate change vulnerability
assessments currently underway
through UW and at NatureServe.
Strategy 1.3.2: Explore mechanisms for adjusting the
size, boundaries and location of protected reserves
Actions might include:
Conduct study to evaluate options for changing preserve boundaries, identify new areas that are needed to provide core areas or important connectivity between cores;
Identify ecological conditions that are critical for species movements or migrations
Agency planning documents
addressing protected areas, including:
Natural Heritage Plan, WDFW Lands
20/20, Northwest Forest Plan,
Regional Conservation Planning
Initiatives, including Arid Lands
Initiative, Western Governors
Association Pilot Projects,
Existing protected areas managed by
agencies, including WDFW wildlife
refuges, DNR natural areas and State
Parks,
Modify existing programs to
incorporate climate change
considerations.
Create tools to make results
of the UW vulnerability
assessment widely accessible
to planners and land use
managers.
Strategy 1.3.3: Protect specific habitat components that
are rare or hard to replace
Actions might include:
Identify and prioritize hard to replace habitat components.
Create a spatially explicit inventory/database
Identify/evaluate protection needs
Agency planning documents
addressing protected areas, including:
Natural Heritage Plan, WDFW Lands
20/20, Northwest Forest Plan,
Species and Ecosystem databases,
including Natural Heritage Program
(DNR), Priority Habitat and Species
Database (WDFW)
Need a better understanding
of how climate change will
impact small-patch habitats
and of how small-patch
habitats might either migrate
or be constructed if
necessary.
GOAL 2: Build necessary scientific and institutional readiness to support effective adaptation

TAG3 Interim Report February/2011 61 | P a g e
ARIDLANDS
Existing Programs/Tools
New Programs or Policies
Needed
Institutional Barriers or
Information Gaps
Strategy 2.1: Establish a conservation partnership, to
address climate change and other stressors, for the
aridlands of Washington (including agricultural lands)
that includes public and private stakeholders.
Actions might include:
Support existing landscape conservation initiatives efforts to address climate change consequences and responses (for example ALI, LCC, WGA, etc.)
Evaluate and fill gaps in coordination to ensure current initiatives are able to adequately address climate change issues
Develop mechanism to share information and coordinate outcomes
Coordinate implementation of strategies across the full scope of arid lands
Develop institutional mechanisms to enable and facilitate shared resources, joint projects and coordinated action between federal, state, local agencies, NGOs, tribes, private entities and landowners.
Develop mechanism for shared accountability for conservation actions and effectiveness
Provide funding to coordinated projects, and empower main conservation initiative/s through management of that funding
Aridands Initiative
Regional Conservation Planning
Initiatives, including: Landscape
Conservation Cooperatives, Western
Governors Association Projects.
Tools such as the BLM rapid
ecosystem assessment
Aridlands version of the Puget
Sound Partnership,
Create better incentives for
coordinating conservation efforts
Modify existing planning process,
to incorporate climate change
consequences
Strategy 2.2: Ensure existing land management plans
and regulatory processes address climate change
consequences and include adaptation strategies.
Actions might include:
Local jurisdiction comprehensive
plans;
DNR Strategic Plan for Agriculture.
Arid lands wide mitigation
framework (funds from
development, conversion due to
new or enhanced water storage
projects; alternative energy
Resistance to changing
objectives for land use.
Concern about implementing
conservation strategies on
priate lands

TAG3 Interim Report February/2011 62 | P a g e
ARIDLANDS
Existing Programs/Tools
New Programs or Policies
Needed
Institutional Barriers or
Information Gaps
Determine how best to incorporate climate change adaptation strategies in existing land management plans.
Evaluate existing land management plans, and work with the appropriate planners and implementers to integrate CC adaptation strategies.
o county planning o private land management plans o state and federal land management plans
Develop mitigation requirements for habitat loss from development directly related to human response to climate change
o Develop a mitigation framework for development o Create standards applicable to energy, conversion,
residential development. o Develop replacement or enhancement acreage
equivalencies
Habitat Conservation Plans.
development, transmission lines,
etc. Funds to agreed-upon
priority areas that increase
resilience).
Strategy 2.3: Improve and better coordinate fire
management, in light of increasing risk from climate
change.
Actions might include:
o Coordinate fire management across jurisdictions,
and focus on agreed-upon priorities.
o Prioritize areas for fire management and protection
Increase public awareness and decrease human ignition sources
o Expand public awareness campaigns o Increase enforcement of restrictions of high
risk activities during fire season.
Reduce impact of fires that occur o Increase ability to implement effective post-fire
rehabilitation through:
Existing agency fire management
programs and resources for agency
managed lands -- DNR, BLM, USFWS
Local funding for fire districts
Program coordinating fire
management resources and use.
Funding programs for climate-
smart fire management and
enforcement of current
restrictions
Develop a wildland firefighter
training and recruitment
program?
Develop agreed-upon priorities
for fire management based on
ecological role of fire.
Inadequate coordination of
fire management activities
across the whole landscape
Perception of native systems
not being “valuable
resources”
Inadequate enforcement of
restrictions of high risk
activities during fire season
Inadequate funding and
capacity to manage fire in
native systems
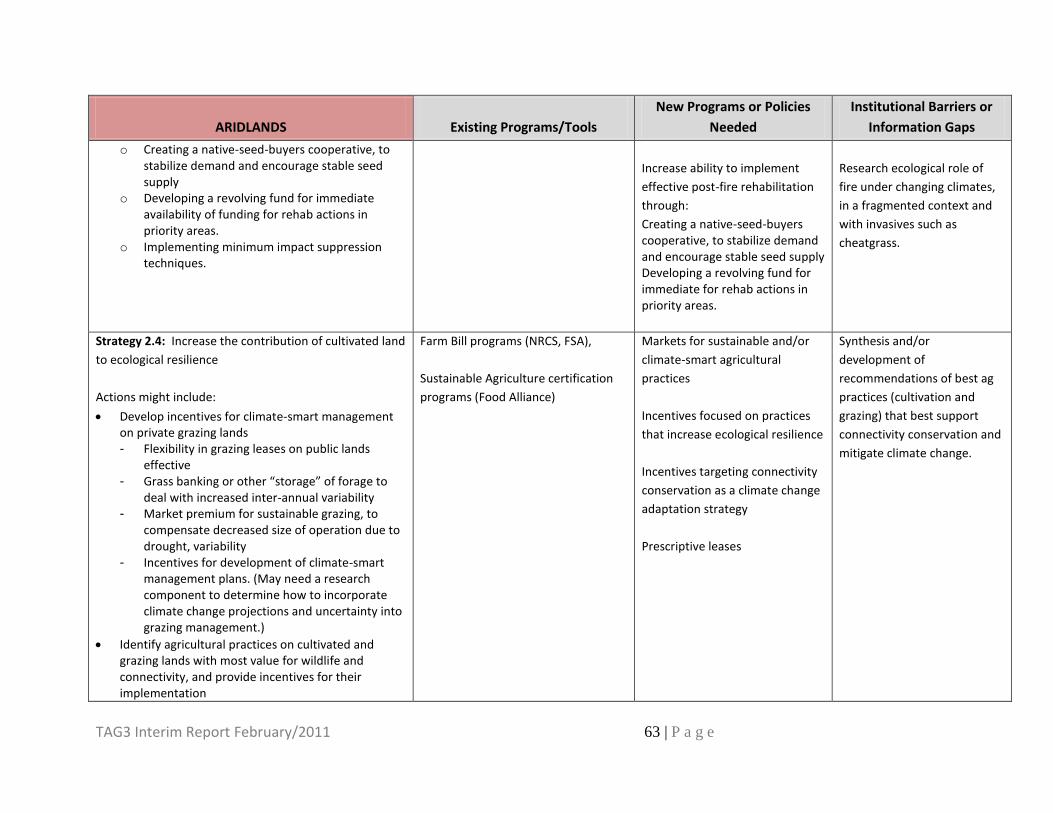
TAG3 Interim Report February/2011 63 | P a g e
ARIDLANDS
Existing Programs/Tools
New Programs or Policies
Needed
Institutional Barriers or
Information Gaps
o Creating a native-seed-buyers cooperative, to stabilize demand and encourage stable seed supply
o Developing a revolving fund for immediate availability of funding for rehab actions in priority areas.
o Implementing minimum impact suppression techniques.
Increase ability to implement
effective post-fire rehabilitation
through:
Creating a native-seed-buyers cooperative, to stabilize demand and encourage stable seed supply Developing a revolving fund for immediate for rehab actions in priority areas.
Research ecological role of
fire under changing climates,
in a fragmented context and
with invasives such as
cheatgrass.
Strategy 2.4: Increase the contribution of cultivated land
to ecological resilience
Actions might include:
Develop incentives for climate-smart management on private grazing lands - Flexibility in grazing leases on public lands
effective - Grass banking or other “storage” of forage to
deal with increased inter-annual variability - Market premium for sustainable grazing, to
compensate decreased size of operation due to drought, variability
- Incentives for development of climate-smart management plans. (May need a research component to determine how to incorporate climate change projections and uncertainty into grazing management.)
Identify agricultural practices on cultivated and grazing lands with most value for wildlife and connectivity, and provide incentives for their implementation
Farm Bill programs (NRCS, FSA),
Sustainable Agriculture certification
programs (Food Alliance)
Markets for sustainable and/or
climate-smart agricultural
practices
Incentives focused on practices
that increase ecological resilience
Incentives targeting connectivity
conservation as a climate change
adaptation strategy
Prescriptive leases
Synthesis and/or
development of
recommendations of best ag
practices (cultivation and
grazing) that best support
connectivity conservation and
mitigate climate change.

TAG3 Interim Report February/2011 64 | P a g e
ARIDLANDS
Existing Programs/Tools
New Programs or Policies
Needed
Institutional Barriers or
Information Gaps
Strategy 2.5: Implement a genetic conservation program
Strategy 2.6: Incorporate actual and anticipated climate
changes in species recovery or species management
plans
Strategy 2.7: Address information gaps to allow better
understanding of how climate change can impact
aridlands habitats and species
Strategy 2.8: Develop and maintain a long-term, large
scale monitoring plan of key early warning indicators of
species responses (including range shifts, population
status) and changes in ecological systems functions and
processes
Actions might include:
Design/develop long term monitoring protocol
Create Citizen Science Monitoring Network (includes Agency, Higher Ed, K-12, Adult volunteers)) to implement monitoring plan
Biodiversity Scorecard
Agency species monitoring programs,
Various citizen science efforts,
Modify scorecard/dashboards to
include climate change
indicators.
Develop new programmatic
citizen science monitoring
network to provide mechanism
to collect large scale long-term
data sets. Will require strong
formal science partnership
between, professionals, NGOs,
local citizen groups.
Citizen Science Network can
serve all ecosystems. Once
network is in place it can be
used for collection of data and
analysis of additional
questions beyond monitoring.
Strategy 2.9: Develop mechanism for feeding that
information back to decision makers at all levels (from
policy to individual landowners) to inform management
and policy decisions

TAG3 Interim Report February/2011 65 | P a g e
Freshwater and Aquatic10
Description and Distribution
Washington State is blessed with abundant freshwater resources. The Cascade and Olympic
Mountains influence the precipitation patterns from weather moving in from the Pacific Ocean
along the state’s western edge and store large quantities of water in the form of ice and snow.
They also create precipitation ―shadows‖ creating areas of low rainfall and arid conditions along
and beyond their eastern slopes. This is most noticeable in the dry eastern portions of the state.
The result is strongly divided climate regimes with the western part of the state having an
abundance of lakes, streams, ponds and wetlands and generally cool damp conditions much of
the year and the eastern part of state experiencing semi-desert conditions with more ephemeral
ponds and streams with large river systems, like the Columbia, Snake or Okanogan Rivers
providing much of the water resources for agriculture and other human uses.
Projected Climate Impacts and Consequences
The impacts of climate change are likely to create significant changes to the patterns and
processes affecting Washington’s freshwater ecosystems. Washington relies on cool season
precipitation (October through March) and resulting snowpack to sustain warm season
streamflows (April through September). Approximately 75% of the annual precipitation in the
Cascades falls during the cool season. Small changes in air temperature can strongly affect the
balance of precipitation falling as rain and snow, depending on a watershed’s location, elevation,
and aspect. Based on information found in WACCIA (CIG 2009), PAWG (2008) and Karl
(2009), the major climate driven effects on Washington’s hydrology appear to be:
Reduced snowpack and altered runoff regimes
Reduced summer streamflows
Increased flooding
Increased water temperature
Increased water pollution
Altered soil moisture
Altered groundwater
Reduced glacial size and abundance
These effects are already being seen, for instance, in changes to hydrology in the Puget Sound
Basin. Snover et al. (2005) report that freshwater inflow to Puget Sound has changed over the
period 1948-2003 in the following ways:
A 13% decline in total inflow due to changes in precipitation
A 12 day shift toward earlier onset of snowmelt
An 18% decline in the portion of annual river flow entering Puget Sound during the
summer
An increase in the likelihood of both low and unusually high daily flow events.
10
The primary reference document for this section was ―Climate Change Effects on Freshwater, Aquatic and
Riparian Habitats in Washington State‖, prepared by the National Wildlife Federation and WDFW (Appendix E)

TAG3 Interim Report February/2011 66 | P a g e
Freshwater systems may also be affected by human response to climate change. Changes to
infrastructure to address changes in water use, to manage stormwater runoff and to support
agricultural practices may create ―indirect‖ but significant impacts and may magnify the effects
of strictly climate-driven changes to the environment. Those indirect impacts are not addressed
with specific strategies in this section, however, they should be considered when developing
strategies to address climate change impacts to other sectors.
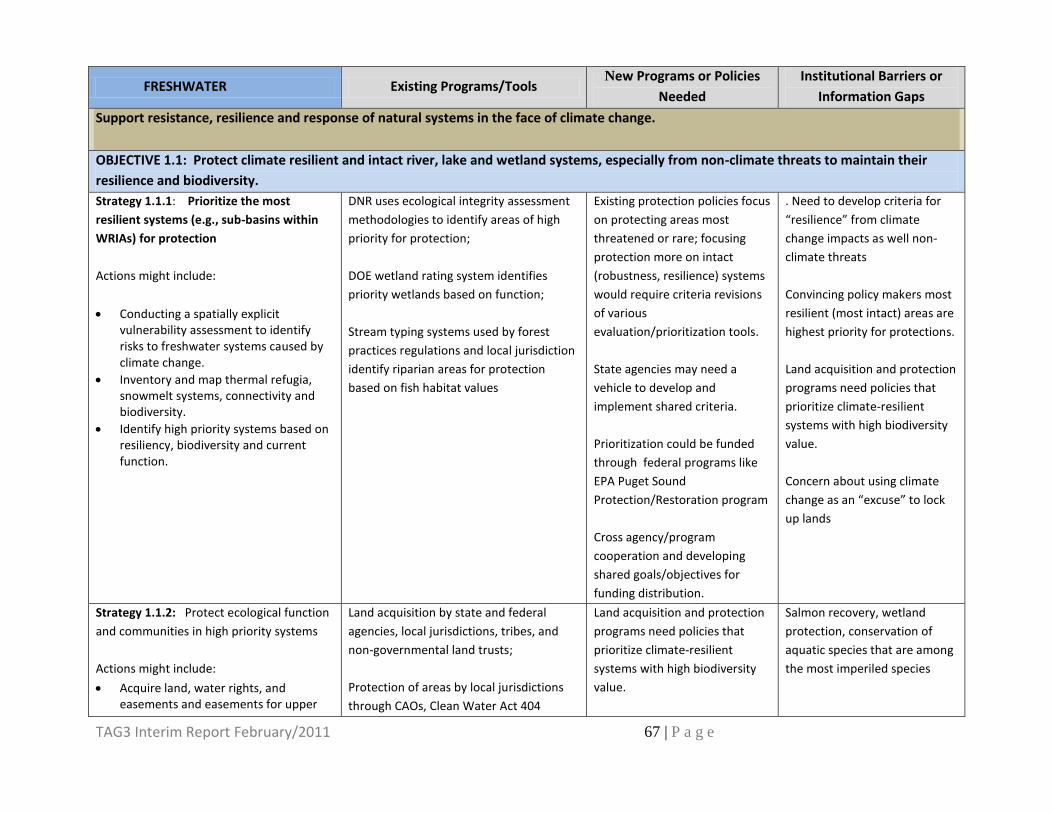
TAG3 Interim Report February/2011 67 | P a g e
FRESHWATER Existing Programs/Tools New Programs or Policies
Needed
Institutional Barriers or
Information Gaps
Support resistance, resilience and response of natural systems in the face of climate change.
OBJECTIVE 1.1: Protect climate resilient and intact river, lake and wetland systems, especially from non-climate threats to maintain their
resilience and biodiversity.
Strategy 1.1.1: Prioritize the most
resilient systems (e.g., sub-basins within
WRIAs) for protection
Actions might include:
Conducting a spatially explicit vulnerability assessment to identify risks to freshwater systems caused by climate change.
Inventory and map thermal refugia, snowmelt systems, connectivity and biodiversity.
Identify high priority systems based on resiliency, biodiversity and current function.
DNR uses ecological integrity assessment
methodologies to identify areas of high
priority for protection;
DOE wetland rating system identifies
priority wetlands based on function;
Stream typing systems used by forest
practices regulations and local jurisdiction
identify riparian areas for protection
based on fish habitat values
Existing protection policies focus
on protecting areas most
threatened or rare; focusing
protection more on intact
(robustness, resilience) systems
would require criteria revisions
of various
evaluation/prioritization tools.
State agencies may need a
vehicle to develop and
implement shared criteria.
Prioritization could be funded
through federal programs like
EPA Puget Sound
Protection/Restoration program
Cross agency/program
cooperation and developing
shared goals/objectives for
funding distribution.
. Need to develop criteria for
“resilience” from climate
change impacts as well non-
climate threats
Convincing policy makers most
resilient (most intact) areas are
highest priority for protections.
Land acquisition and protection
programs need policies that
prioritize climate-resilient
systems with high biodiversity
value.
Concern about using climate
change as an “excuse” to lock
up lands
Strategy 1.1.2: Protect ecological function
and communities in high priority systems
Actions might include:
Acquire land, water rights, and easements and easements for upper
Land acquisition by state and federal
agencies, local jurisdictions, tribes, and
non-governmental land trusts;
Protection of areas by local jurisdictions
through CAOs, Clean Water Act 404
Land acquisition and protection
programs need policies that
prioritize climate-resilient
systems with high biodiversity
value.
Salmon recovery, wetland
protection, conservation of
aquatic species that are among
the most imperiled species

TAG3 Interim Report February/2011 68 | P a g e
FRESHWATER Existing Programs/Tools New Programs or Policies
Needed
Institutional Barriers or
Information Gaps
watershed forests and meadows that act as natural water and snow storage.
Provide incentives for property owners/managers.
Use current regulatory systems to reduce non-climate stressors and increase system resiliency. For example, review and amend CWA to address changing ecosystem conditions, Forest Practices, GMA, SEPA, SMA, HPA and providing support to local jurisdictions with strengthened critical areas.
Coordinate and fund planning and policies to protect high priority systems.
permitting
Existing Funding Options: Clean Water State Revolving Funds (US EPA), Habitat Conservation and Restoration Grants (Recreation and Conservation Office), Cooperative Endangered Species Conservation Fund (USFWS)
Consider establishing watershed
authorities to manage funds for
restoration and protection.
Authority could be funded by
land use development fees
based on percentage of area
hardened.
OBJECTIVE 1.2: Protect and restore streamflow and water levels for ecological function
Strategy 1.2.1: Develop hydrologic information that better represents current conditions and can be adapted to represent future scenarios – for groundwater, hydroecology, hydrologic modeling. Actions might include: 1. Map groundwater recharge and
discharge as critical areas. 2. Monitor water levels in shallow
aquifers that support freshwater systems.
3. Determine system specific streamflow targets that support ecological function.
4. Develop statewide network of flow
GMA Critical Aquifer Recharge Areas (CARAs) or instream flows for water rights.
Groundwater Assessment Program (GAP) maintains data on locations and data for groundwater withdrawals in the state and assesses each for vulnerability to degradation. Ecology TMDL studies often assess
groundwater discharge into surface waters
Ecology’s River and Stream Water Quality
Monitoring Program collects data on 62 long-term stations and 20 basin (rotating) stations.
Expand groundwater inventory of recharge and discharge areas as critical areas through Ecology GAP, TMDL, watershed plans, and local jurisdiction GMA and SMP.
Increase River and Stream Water Quality Monitoring sites and IMWs to address basins most at risk from climate change.
Explore options with watershed leads to set streamflow targets for ecological functions.
Address lack of site-specific knowledge about the timing, location, and degree of exchange between groundwater and surface water systems (dry-season seepage evaluation and instream piezometer surveys). Current CAOs address CARAs for drinking water protection; “base flows” in streams are considered but not adequately for include ecosystem services and ecological functions. There is currently no state-level

TAG3 Interim Report February/2011 69 | P a g e
FRESHWATER Existing Programs/Tools New Programs or Policies
Needed
Institutional Barriers or
Information Gaps
monitoring stations to research impacts of climate change on stream hydrology.
5. Develop synthetic rainfall, temperature time series to represent future conditions.
6. Apply hydrologic models to basin-scale analysis of stormwater retrofits in priority basins.
7. Ensure sufficient data is collected on water supply, use and discharge to allow comprehensive water budgets at the watershed scale.
3. Hydrologic modeling a. Hydrologic Analysis and Flow Control
Design/BMPs; Stormwater hydrology models rely on hourly precipitation data for sizing stormwater control facilities. Low Impact Develop (LID) approaches are given credit
Assess WRIA documents to verify that climate change projections, ground-surface water, ecological instream flows are addressed. Revise regulatory statistical flows (such as critical low flows, design storms and flood frequencies) to account for climate change Increasing demand for additional groundwater from aquifers requires long-term monitoring of recharge areas and ground-surface water interaction at representative sites in selected basins. Explore options for funding
WRIA grants after 2013 for
salmon habitat restoration
activities that also incorporate
development of ground-surface
water information in critical
watersheds.
program to monitor and assess larger-scale ambient groundwater conditions. Ensure sufficient data are collected on water supply, use, and discharge to allow for comprehensive water budgets at watershed scale including forecasting
OJBECTIVE 3: Maintain and restore riparian, floodplain, wetland and lake functions.
Strategy 1.3.1: Identify, map, and monitor essential functions at risk from climate change Actions might include: 1. For floodplain and riparian areas,
update flood maps to account for potential climate change impacts,

TAG3 Interim Report February/2011 70 | P a g e
FRESHWATER Existing Programs/Tools New Programs or Policies
Needed
Institutional Barriers or
Information Gaps
a. map historic and future floodplains and riparian zones,
b. Monitor distribution of focal animal species, changes to vegetation, nutrient levels,
c. Identify floodplain areas at increased risk of inundation,
d. Identify channels at increased risk of bank erosion and channel migration – reconnect historical channels to reduce damage and provide compensating refugia.
e. Identify in-stream bedload transport areas that pose increased susceptibility to direct habitat loss.
f. Identify potential areas for long-term habitat enhancement to offset loss.
2. For wetlands, monitor shifts in distribution of wetland-dependent animal species and changes to vegetation.
3. For lakes, monitor shifts in distribution of lake-dependent, animal species and changes to vegetation.
Strategy 1.3.2: Re-establish connectivity of rivers and floodplains Actions might include: 1. Acquiring flood easements, 2. Restore floodplain capacity by
removing artificial constrictions such as levees, tide gates, and undersized culverts.
3. Support barrier and dam removal and
1) WWRP, ALEA, and LWCF Grants for Critical Habitat, Riparian Protection and Natural Areas and Farmland Preservation (RCO)
2) Fish Passage Barrier Removal Program
– dedicated I-4 funds, Highway Construction Program (WSDOT / WDFW)
Existing Programs to include criteria that give priority to riparian and floodplain connectivity. Policies to address the timing of acquisition and spatial relation of properties for optimal riverine and habitat connectivity.

TAG3 Interim Report February/2011 71 | P a g e
FRESHWATER Existing Programs/Tools New Programs or Policies
Needed
Institutional Barriers or
Information Gaps
river restoration where appropriate. 4. Increase groundwater infiltration by
reducing nearby impervious areas. 5. Update floodway regulations to reflect
climate change impacts. 6. Incorporate climate change
considerations into long range and emergency planning.
3) Flood Damage Protection Grants (WSECY)
4) Floodplain Development Permits – (Local governments, based on National Flood Insurance Program)
5) Washington State Land Acquisition Coordination Board (RCO)
Strategy 1.3.3: Increase resilience of lakes and wetlands to climate change impacts by maintaining and restoring functions. Actions might include: 1. Establishing buffers, 2. Controlling invasive species 3. Addressing water quality 4. Creating new wetlands to offset
anticipated loss or degradation of refugia elsewhere,
5. Managing water levels to reduce fluctuations and to maintain water temperature & chemistry (identify and reduce water diversions, and reintroduce native species such as beaver.
State water pollution laws and regulations
State water resources laws and regulations
Lake Management Districts
Lake Management Plans
SMA
Noxious weed laws and programs
Volunteer lake monitoring
Dam licensing
Statewide lake monitoring program
Remote sensing methodologies for lakes
Data on lakes sufficient to support adaptation is limited.
Monitoring and modeling would be resource intensive to provide statewide coverage of major lakes.
Build necessary scientific and institutional readiness to support effective adaptation
OBJECTIVE 2.1: Protect and restore streamflow and water levels for ecological function
Strategy 2.2.1: Manage water uses for adequate flows that maintain freshwater systems at risk from climate change.
Water acquisition program
Water banks and trusts
State water resources laws and regulations
Statewide rollout of water banking, trusts, and acquisition programs
Statewide rollout and update
Improved water monitoring and forecasting (both water users and basin hydrology)

TAG3 Interim Report February/2011 72 | P a g e
FRESHWATER Existing Programs/Tools New Programs or Policies
Needed
Institutional Barriers or
Information Gaps
Actions might include: 1. Acquiring water rights to put back in
streams, lakes, ponds. 2. Establish water banks and improve
legal and fiscal frameworks to allow water transfers without increasing climate related stressors.
3. Consider incentives such as fee for water use, promoting conjunctive use of groundwater and surface water, encouraging water conservation, water banks.
4. Employ regulatory tools such as instream flow rules, industrial and agricultural conservation standards, and enforcement of existing regulatory programs.
5. Use planning and policy tools, such as integrating water resource management, stormwater management and land use planning.
Federal dam licensing
Flow monitoring and modeling programs
FUNDING OPTIONS
Water rights fee program
State general fund, grants and loans
Mitigation credit sales Watershed-based tax district
of instream flow rules
Statewide quantification and adjudication of water rights
Statewide enforcement of water resources laws
Improved regulation of groundwater withdrawals
Stricter water conservation standards
Build prioritization into state program implementation based on climate impacts
Inclusion of instream flow benefits into water infrastructure projects, such as ASR, dams, desalinization, etc.
Integrated watershed, regional and State Water Plans that provide for holistic Integrated Water Resource Management
Insufficient data is available on water use (permitted, exempt, and illegal), stream flows, ground water use, and interactions between ground water and surface water.
Conduct studies, such as the potential for desalination as a water supply and developing integrated water supply and demand forecasting to inform targeted flow restoration efforts.
Strategy 2.2.2: Manage stormwater to protect and restore flow characteristics in light of expected climate change impacts. Actions might include: 1. Creating incentives for more efficient
stormwater management, 2. Modifying stormwater regulations to
adapt to uncertain future hydrologic conditions,
3. Acquiring land for priority stormwater
State water pollution laws and regulations
State and federal NPDES stormwater permit programs
Watershed and riparian restoration programs
Stormwater Technical Resources Center (WSU/UW)
Eastern and Western WA Stormwater Manuals
Local government stormwater programs
Puget Sound Partnership LID program
State and Federal LID performance standards and requirements
Adapt stormwater hydrologic models to changing climate conditions
Stormwater retrofit program for land, design, construction.
Incentive program for stormwater management
Improve Stormwater TMDL Clean up plans
Understanding of relationship between surface flows, interflows, and deep groundwater.
Basin-scale stormwater hydrologic models
Climate risk analysis plans
Local hydrologic basin modeling data for retrofits

TAG3 Interim Report February/2011 73 | P a g e
FRESHWATER Existing Programs/Tools New Programs or Policies
Needed
Institutional Barriers or
Information Gaps
retrofits. FUNDING OPTIONS
State and Federal grant programs
Dedicated State and Federal funding (e.g. permit fees, hazardous waste fees)
Local Stormwater Utility Fees
Flood District Fees Clean Water District Fees
Table 4.4

TAG3 Interim Report February/2011 74 | P a g e
APPENDIX B
Summary of Projected Changes in Major Drivers of Pacific Northwest Climate Change Impacts
Prepared by the University of Washington Climate Impacts Group
December 16, 2010
The information provided below is largely assembled from work completed for the 2009 Washington Climate Change Impacts
Assessment. Other sources have been used where relevant but this summary should not be viewed as a comprehensive literature
review of Pacific Northwest (PNW) climate change impacts. Confidence statements are strictly qualitative with the exception of IPCC
text regarding rates of 20th century global sea level rise. Note that periods of months are abbreviated by each month’s first letter, e.g.,
DJF = Dec, Jan, Feb.
Climate Variable
General Change Expected
Specific Change Expected Size of Projected Change Compared to Recent Changes
Information About Seasonal Patterns of Change
Confidence Sources
Temperature
Increasing temperatures expected through 21st century
Projected multi-model change in average annual temperature (with range) for specific benchmark periods: • 2020s: +2°F (1.1 to 3.4°F)** • 2040s: +3.2°F (1.6 to 5.2°F) • 2080s: +5.3°F (2.8 to 9.7°F) These changes are relative to the average annual temperature for 1970-1999. The projected rate of warming is an average of 0.5°F per decade (range: 0.2-1.0°F). ---------------------------- ** Mean values are the weighted (REA) average of all 39 scenarios. All range values are the lowest and highest of any individual global climate model and greenhouse gas emissions scenario coupling (e.g., the PCM1 model run with the B1
Projected warming by the end of this century is much larger than the regional warming observed during the 20th century (+1.5°F), even for the lowest scenarios.
Warming expected across all seasons with the largest warming in the summer months (JJA) Mean change (with range) in winter (DJF) temperature for specific benchmark periods, relative to 1970-1999: • 2020s: +2.1°F (0.7 to 3.6°F)** • 2040s: +3.2°F (1.0 to 5.1°F) • 2080s: +5.4°F (1.3 to 9.1°F) Mean change (with range) in summer (JJA) temperature for specific benchmark periods, relative to 1970-1999: • 2020s: +2.7°F (1.0 to 5.3°F)** • 2040s: +4.1°F (1.5 to 7.9°F) • 2080s: +6.8°F (2.6 to 12.5°F)
High confidence that the PNW will warm as a result of increasing greenhouse gas emissions. All models project warming in all scenarios (39 scenarios total) and the projected change in temperature is statistically significant.
Mote and Salathé 2010

TAG3 Interim Report February/2011 75 | P a g e
Climate Variable
General Change Expected
Specific Change Expected Size of Projected Change Compared to Recent Changes
Information About Seasonal Patterns of Change
Confidence Sources
emissions scenario).
Precipitation (extreme
precipitation addressed in separate field)
A small increase in average annual precipitation is projected (based on the multimodel average, Mote and Salathé 2010), although model-to-model differences in projected precipitation are large (see “Confidence”). Potentially large seasonal changes are expected.
Projected change in average annual precipitation (with range) for specific benchmark periods: • 2020s: +1% (-9 to 12%)** • 2040s: +2% (-11 to +12%) • 2080s: +4% (-10 to +20%) These changes are relative to the average annual temperature for 1970-1999. ---------------------------- ** Mean values are the weighted (REA) average of all 39 scenarios. All range values are the lowest and highest of any individual global climate model and greenhouse gas emissions scenario coupling (e.g., the PCM1 model run with the B1 emissions scenario).
Projected increase in average annual precipitation is small relative to the range of natural variability observed during the 20th century and the model-to-model differences in projected changes for the 21
st century
Summer: Majority of global
climate models (68-90% depending on the decade and emissions scenario) project decreases in summer (JJA) precipitation. Mean change (with range) in JJA precipitation for specific benchmark periods, relative to 1970-1999: • 2020s: -6% (-30% to +12%) ** • 2040s: -8% (-30% to +17%) • 2080s: -13% (-38% to +14%) Winter: Majority of global
climate models (50-80% depending on the decade and emissions scenario) increases in winter (DJF) precipitation. Mean change (with range) in DJF precipitation for specific
Low confidence. The uncertainty in future precipitation changes is large given the wide range of natural variability in the PNW and uncertainties regarding if and how dominant modes of natural variability may be affected by climate change. Additional uncertainties are derived from the challenges of modeling precipitation globally. Model to model differences are quite large, with some models projecting decreases in winter and annual total precipitation and
Mote and Salathé 2010; Salathé et al. 2010

TAG3 Interim Report February/2011 76 | P a g e
Climate Variable
General Change Expected
Specific Change Expected Size of Projected Change Compared to Recent Changes
Information About Seasonal Patterns of Change
Confidence Sources
benchmark periods, relative to 1970-1999: • 2020s: +2% (-14% to +23%)** • 2040s: +3% (-13% to +27%) • 2080s: +8% (-11% to +42%)
others producing large increases. Expect that the region will continue to see years that are wetter than average and drier than average even as that average changes over the long term.
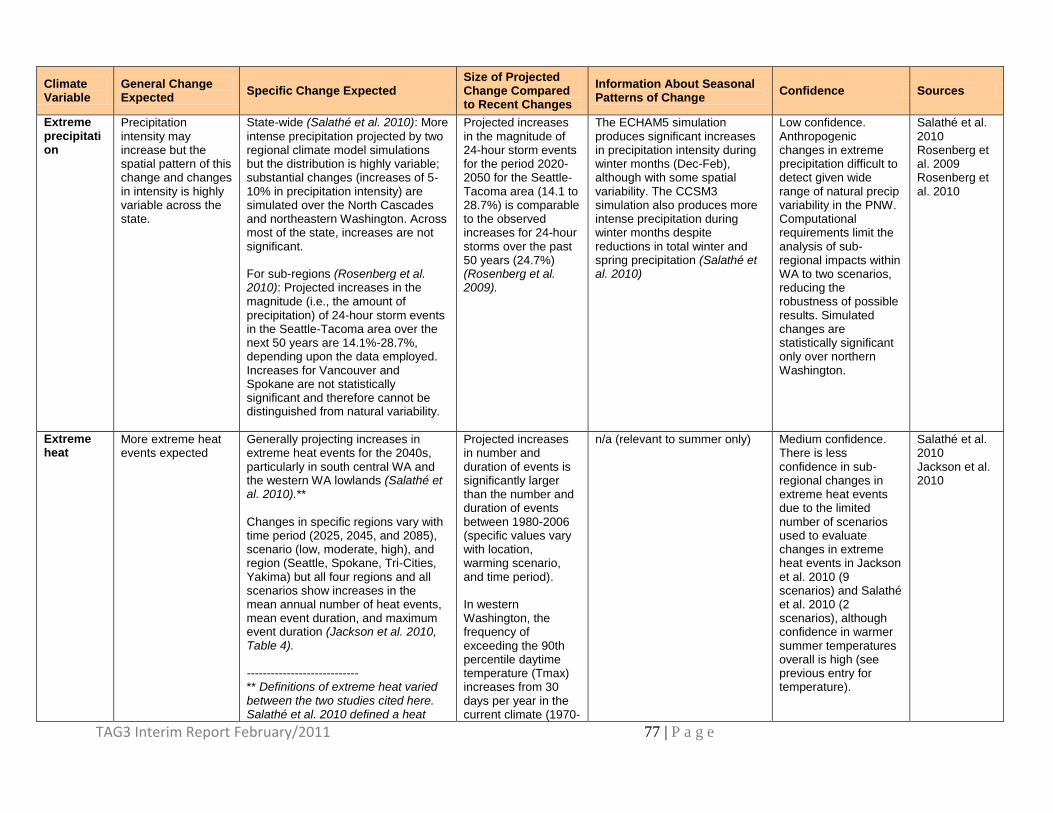
TAG3 Interim Report February/2011 77 | P a g e
Climate Variable
General Change Expected
Specific Change Expected Size of Projected Change Compared to Recent Changes
Information About Seasonal Patterns of Change
Confidence Sources
Extreme precipitation
Precipitation intensity may increase but the spatial pattern of this change and changes in intensity is highly variable across the state.
State-wide (Salathé et al. 2010): More
intense precipitation projected by two regional climate model simulations but the distribution is highly variable; substantial changes (increases of 5-10% in precipitation intensity) are simulated over the North Cascades and northeastern Washington. Across most of the state, increases are not significant. For sub-regions (Rosenberg et al. 2010): Projected increases in the magnitude (i.e., the amount of precipitation) of 24-hour storm events in the Seattle-Tacoma area over the next 50 years are 14.1%-28.7%, depending upon the data employed. Increases for Vancouver and Spokane are not statistically significant and therefore cannot be distinguished from natural variability.
Projected increases in the magnitude of 24-hour storm events for the period 2020-2050 for the Seattle-Tacoma area (14.1 to 28.7%) is comparable to the observed increases for 24-hour storms over the past 50 years (24.7%) (Rosenberg et al. 2009).
The ECHAM5 simulation produces significant increases in precipitation intensity during winter months (Dec-Feb), although with some spatial variability. The CCSM3 simulation also produces more intense precipitation during winter months despite reductions in total winter and spring precipitation (Salathé et al. 2010)
Low confidence. Anthropogenic changes in extreme precipitation difficult to detect given wide range of natural precip variability in the PNW. Computational requirements limit the analysis of sub-regional impacts within WA to two scenarios, reducing the robustness of possible results. Simulated changes are statistically significant only over northern Washington.
Salathé et al. 2010 Rosenberg et al. 2009 Rosenberg et al. 2010
Extreme heat
More extreme heat events expected
Generally projecting increases in extreme heat events for the 2040s, particularly in south central WA and the western WA lowlands (Salathé et al. 2010).** Changes in specific regions vary with time period (2025, 2045, and 2085), scenario (low, moderate, high), and region (Seattle, Spokane, Tri-Cities, Yakima) but all four regions and all scenarios show increases in the mean annual number of heat events, mean event duration, and maximum event duration (Jackson et al. 2010, Table 4). ---------------------------- ** Definitions of extreme heat varied between the two studies cited here. Salathé et al. 2010 defined a heat
Projected increases in number and duration of events is significantly larger than the number and duration of events between 1980-2006 (specific values vary with location, warming scenario, and time period). In western Washington, the frequency of exceeding the 90th percentile daytime temperature (Tmax) increases from 30 days per year in the current climate (1970-
n/a (relevant to summer only) Medium confidence. There is less confidence in sub-regional changes in extreme heat events due to the limited number of scenarios used to evaluate changes in extreme heat events in Jackson et al. 2010 (9 scenarios) and Salathé et al. 2010 (2 scenarios), although confidence in warmer summer temperatures overall is high (see previous entry for temperature).
Salathé et al. 2010 Jackson et al. 2010

TAG3 Interim Report February/2011 78 | P a g e
Climate Variable
General Change Expected
Specific Change Expected Size of Projected Change Compared to Recent Changes
Information About Seasonal Patterns of Change
Confidence Sources
wave as an episode of three or more days where the daily heat index (humidex) value exceeds 90°F. Jackson et al. 2010 defined heat events as one or more consecutive days where the humidex was above the 99th percentile.
1999) to 50 days per year in the 2040s (2030-2059).
Snowpack (SWE)
Decline in spring (April 1) snowpack expected
The multi-model means for projected changes in mean April 1 SWE for the B1 and A1B greenhouse gas emissions scenarios are: • 2020s: -27% (B1), -29% (A1B) • 2040s: -37% (B1), -44% (A1B) • 2080s: -53% (B1), -65% (A1B) All changes are relative to 1916-2006. Individual model results will vary from the multi-model average.
Projected declines for the 2040s and 2080s are greater than the snowpack decline observed in the 20th century (based on a linear trend from 1916-2006).
n/a (relevant to cool season [Oct-Mar] only)
High confidence that snowpack will decline even though specific projections will change over time. Projected changes in temperature, for which there is high confidence, have the most significant influence on SWE (relative to precipitation).
Elsner et al. 2010
Streamflow
Expected seasonal changes include increases in winter streamflow, earlier shifts in the timing of peak streamflow in snow dominant and rain/snow mix (transient) basins, and decreases in summer streamflow. Increasing risk of extreme high and low flows also expected. In all cases, results will vary by location and basin type.
The multi-model averages for projected changes in mean annual runoff for Washington state for the B1 and A1B greenhouse gas emissions scenarios are: • 2020s: +2% (B1), 0% (A1B) • 2040s: +2% (B1), +3% (A1B) • 2080s: +4% (B1), +6% (A1B) All changes relative to 1916-2006; numbers rounded to nearest whole value (Elsner et al. 2010) The risk of lower low flows (e.g., lower 7Q10** flows) increases in all basin types to varying degrees. The decrease in 7Q10 flows is greater in rain dominant and transient basins relative to snow-dominant basins, which generally see less snowpack decline and (as a result) less of a decline in summer streamflow than
During the period from 1947-2003 runoff occurred earlier in spring throughout snowmelt influenced watersheds in the western U.S. (Hamlet et al. 2007).
Projected changes in mean cool season (Oct-Mar) runoff for WA state: • 2020s: +13% (B1), +11% (A1B) • 2040s: +16% (B1), +21% (A1B) • 2080s: +26%(B1), +35% (A1B) Projected changes in mean warm season (Apr-Sept) runoff for WA state: • 2020s: -16% (B1), -19% (A1B) • 2040s: -22% (B1), -29% (A1B) • 2080s: -33%(B1), -43% (A1B) All changes relative to 1916-2006; numbers rounded to nearest whole value. (Elsner et al. 2010)
Regarding changes in total annual runoff: There is high confidence in the direction of projected change in total annual runoff but low confidence in the specific amount of projected change due to the large uncertainties that exist for changes in winter (Oct-Mar) precipitation. The large uncertainties in winter precipitation are due primarily to uncertainty about the timing of, and any changes in, dominant models of natural decadal variability that influence precipitation
Elsner et al. 2010 Hamlet et al. 2007 Mantua et al. 2010 Tohver and Hamlet 2010

TAG3 Interim Report February/2011 79 | P a g e
Climate Variable
General Change Expected
Specific Change Expected Size of Projected Change Compared to Recent Changes
Information About Seasonal Patterns of Change
Confidence Sources
transient basins. (Mantua et al. 2010; Tohver and Hamlet 2010) Changes in flood risk vary by basin type. Spatial patterns for the 20-year and 100-year flood ratio (future/historical) indicate slight or no increases in flood risk for snowmelt dominant basins due to declining spring snowpack. There is a progressively higher flood risk through the 21st century for transient basins, although changes in risk in individual transient basins will vary. Projections of flood risk for rain dominant basins do not indicate any significant change under future conditions, although increases in winter precipitation in some scenarios nominally increase the risk of flooding in winter. (Tohver and Hamlet 2010, in draft) ---------------------------- ** 7Q10 flows are the lowest stream flow for seven consecutive days that would be expected to occur once in ten years.
patterns in the PNW (e.g. the Pacific Decadal Oscillation) as well as changes in precipitation caused by climate change. Regarding streamflow timing shifts: There is
high confidence that peak streamflow will shift earlier in the season in transient and snow-dominant systems due to projected warming and loss of April 1 SWE. There is less confidence in the specific size of the shift in any specific basin given uncertainties about changes winter precipitation (see previous comment). Regarding summer streamflows: Overall, there is high confidence that summer streamflow will decline due to projected decreases in snowpack (relevant to snow dominant and transient basins) and increasing summer temperatures (relevant to all basin types). There is medium confidence that late summer streamflow will decline given 1) the sensitivity of late

TAG3 Interim Report February/2011 80 | P a g e
Climate Variable
General Change Expected
Specific Change Expected Size of Projected Change Compared to Recent Changes
Information About Seasonal Patterns of Change
Confidence Sources
summer streamflow to uncertain precipitation changes, and 2) uncertainties about if and how groundwater contributions in any given basin may affect late summer flows. For all changes in streamflow, confidence in specific projected values is low due to high uncertainty about changes in precipitation and decadal variability.
Sea level rise
Varying amounts of sea level rise (or decline) projected in Washington due to regional variations in land movement and coastal winds.
Projected global change (2090-2099) according to the IPCC: 7-23", relative to 1980-99 average (Solomon et al. 2007)**
2050: Projected medium change in Washington sea level (with range) (Mote et al. 2008):
• NW Olympic Pen: 0" (-5-14") • Central & So. Coast: 5" (1-18") • Puget Sound: 6" (3-22") 2100: Projected medium change in WA sea level (with range) (Mote et al. 2008):
• NW Olympic Peninsula: 2" (-9-35") • Central & So. Coast: 11" (2-43") • Puget Sound: 13" (6-50") ---------------------------- ** Since 2008, numerous peer-reviewed studies have offered alternate estimates of global sea level rise. The basis for these updates are
Relative change in Washington varies by location. Globally, the average rate of sea level rise during the 21st century very likely
‡ (>90%)
exceeds the 1961-2003 average rate (0.07 + 0.02 in/year) (Solomon et al. 2007)
----------------------------
‡ = as defined by the
IPCC's treatment of uncertainties (Solomon et al. 2007, Box TS1)
Wind-driven enhancement of PNW sea level is common during winter months (even more so during El Niño events). On the whole, analysis of more than 30 scenarios found minimal changes in average wintertime northward winds in the PNW. However, several models produced strong increases. These potential increases contribute to the upper estimates for WA sea level rise. (Mote et al. 2008)
High confidence that sea level will rise globally. Confidence in the amount of change at any specific location in Washington varies depending on the amount of uncertainty associated with the global and local/regional factors affecting rates of sea level rise. Regionally, there is high confidence that the NW Olympic Peninsula is experiencing uplift at >2 mm/yr. There is less confidence about rates of uplift along the central and southern WA coast due to
Mote et al. 2008 Solomon et al. 2007

TAG3 Interim Report February/2011 81 | P a g e
Climate Variable
General Change Expected
Specific Change Expected Size of Projected Change Compared to Recent Changes
Information About Seasonal Patterns of Change
Confidence Sources
known deficiencies in the IPCC’s 2007 approach to calculating of global sea level rise, including assumptions of a near-zero net contribution from the Greenland and Antarctic ice sheets to 21st century sea level rise. A comparison of several studies in Rahmstorf 2010 (Figure 1) shows projections in the range of 1.5ft to over 6ft. Overall, recent studies appear to be converging on projected increases in the range of 2-4ft (e.g., Vermeer and Rahmstorf (2009), Pfeffer et al. 2008, Grinsted et al. 2009, Jevrejeva et al. 2010).
sparse data, but available data generally indicate uplift in range of 0-2mm/yr. There is high uncertainty about subsidence, and rates of subsidence where it exists, in the Puget Sound region. Although annual rates of current and future uplift and subsidence (a.k.a. "VLM") are well-established at large geographic scales, determining rates at specific locations requires additional analysis and/or monitoring. Uncertainties around future rates are unknown and would be affected by the occurrence of a subduction zone earthquake.

TAG3 Interim Report February/2011 82 | P a g e
Climate Variable
General Change Expected
Specific Change Expected Size of Projected Change Compared to Recent Changes
Information About Seasonal Patterns of Change
Confidence Sources
Wave Heights
Increase in “significant wave height” ** expected in the near term (through 2020s) based on research showing that a future warmer climate may contain fewer overall extra-tropical cyclones but an increased frequency of very intense extra-tropical cyclones (which may affect the extreme wave climate). ------------------ ** “Significant wave height” is defined as the average of the highest 1/3 of the measured wave heights within a (typically) 20 minute period
Based on extrapolation of historical data
‡ and assumptions that the
historical trends continue into the future, the 25, 50, and 100 year significant wave height events are projected to increase approximately 0.07m/yr (2.8 in/yr) through 2020s. ---------------------------- ‡ the five highest significant wave
heights measured at Washington NDBC Buoy #46005 (at the WA/OR border)
Projected changes through 2020 are comparable to the observed increase in the average of the five highest significant wave heights for the mid 1970s-2007 (0.07m/yr, or 2.6 in/yr). More on past changes: Over the last 30 years, the rate of increase for more extreme wave heights has been greater than the rate of increase in average winter wave height. For the WA/OR outer coast (mid 1970s-2007):
The average of all winter significant wave heights increased at a rate of 0.023m/yr (0.9 in/yr)
Annual maximum significant wave height increased 0.095m/yr (3.7 in/yr).
These findings relate to the winter season (Oct-March), which is the dominant season of strong storms
Regarding general trend: There is low confidence that significant wave height will increase given the dependence of this increase on a limited number of studies showing potential increases in the intensity of the extra-tropical cyclones that can affect the extreme wave climate. Regarding specific projected increases in wave height: There is
low confidence in the calculated trend for 25, 50, and 100 year significant wave height events given that this calculation is based on extrapolation of historic data and assumptions of continued historical trends rather than physical modeling.
Ruggiero et al. 2010

TAG3 Interim Report February/2011 83 | P a g e
Climate Variable
General Change Expected
Specific Change Expected Size of Projected Change Compared to Recent Changes
Information About Seasonal Patterns of Change
Confidence Sources
Sea surface temperature (SST)
Warmer SST expected
Increase of +2.2°F projected for the 2040s (2030-59) for coastal ocean between 46°N and 49°N. Changes are relative to 1970-99 average.
Projected change is substantially outside the range of 20th century variability.
No information currently available
Medium to low confidence in the degree of warming expected for the summertime upwelling season. Global climate models do not resolve the coastal zone and coastal upwelling process very well, and uncertainty associated with summertime upwelling winds also brings uncertainty to coastal SSTs in summer.
Mote and Salathé 2010
Coastal upwelling
Little change in coastal upwelling expected
The multimodel average mean change in winds that drive coastal upwelling is minimal
Comparable to what has been observed in the 20th century
Little change in seasonal patterns.
Low confidence given the fact that this hasn't been evaluated with dynamical downscaling of many climate model scenarios at this point.
Mote and Salathé 2010
Ocean acidification
Continuing acidification expected in coastal Washington and Puget Sound waters
The global surface ocean is projected to see a 0.2 - 0.3 drop in pH by the end of the 21
st century (in addition to
observed decline of 0.1 units since 1750) (Feely et al. 2010). pH in the North Pacific, which includes the coastal waters of Washington State, is projected to decrease 0.2 and 0.3 units with increases in the atmospheric concentration of CO2 to 560 and 840 ppm, respectively (Feely et al. 2009). pH in Puget Sound is projected to decrease, with ocean acidification accounting for an increasingly large part of that decline. Feely et al. 2010 estimated that ocean acidification accounts for 24-49% of the pH
Projected global changes are larger than the decrease of 0.1 units since 1750, and greater than the trend in last 20 years (0.02 units/decade). The observed decrease of 0.1 units since 1750 is equivalent to an overall increase in the hydrogen ion concentration or “acidity” of about 26%.
The contribution of ocean acidification to Dissolved Inorganic Carbon (DIC) concentrations within the Puget Sound basin can vary seasonally. Ocean acidification has a smaller contribution to the subsurface increase in DIC concentrations in the summer (e.g., 24%) compared to winter (e.g., 49%) relative to other processes (Feely et al. 2010).
For global changes, confidence that oceans will become more acidic is high. Results from large-scale ocean CO2 surveys and time-series studies over the past two decades show that ocean acidification is a predictable consequence of rising atmospheric CO2 that is independent of the uncertainties and outcomes of climate change (Feely et al. 2009).
Feely et al. 2009 Feely et al. 2010

TAG3 Interim Report February/2011 84 | P a g e
Climate Variable
General Change Expected
Specific Change Expected Size of Projected Change Compared to Recent Changes
Information About Seasonal Patterns of Change
Confidence Sources
decrease in the deep waters of the Hood Canal sub-basin of Puget Sound relative to estimated pre-industrial values. Over time, ocean acidification from a doubling of atmospheric CO2 could account for 49-82% of the pH decrease in Puget Sound subsurface waters.
For Puget Sound, estimates of the contribution of ocean acidification to future pH decreases in Puget Sound have very high uncertainty since other changes that may occur over the intervening time were not taken into account when calculating that estimate (a percentage) (Feely et al. 2010).
Sources
Elsner, M.M., L. Cuo, N. Voisin, J. Deems, A.F. Hamlet, J.A. Vano, K.E.B. Mickelson, S.Y. Lee, and D.P. Lettenmaier. 2010. Implications of 21st century
climate change for the hydrology of Washington State. Climatic Change 102(1-2): 225-260, doi: 10.1007/s10584-010-9855-0.
Feely, R.A., S.C. Doney, and S.R. Cooley. 2009. Ocean acidification: Present conditions and future changes in a high-CO2 world. Oceanography 22(4):36–47.
Feely, R.A., S.R. Alin, J. Newton, C.L. Sabine, M. Warner, A. Devol, C. Krembs, and C. Maloy. 2010. The combined effects of ocean acidification, mixing, and
respiration on pH and carbonate saturation in an urbanized estuary. Estuarine, Coastal and Shelf Science 88(4): 442-449, doi:10.1016/j.ecss.2010.05.004.
Grinsted, A. J.C. Moore, and S. Jevrejeva. 2009. Reconstructing sea level from paleo and projected temperatures 200 to 2100 AD. Climate Dynamics 34:461–
472, doi: 10.1007/s00382-008-0507-2.
Hamlet, A.F., P.W. Mote, M.P. Clark, and D.P. Lettenmaier. 2007. 20th century trends in runoff, evapotranspiration, and soil moisture in the Western U.S.
Journal of Climate 20(8): 1468-1486. DOI: 10.1175/JCLI4051.1
Jackson, J.E., M.G. Yost, C. Karr, C. Fitzpatrick, B. Lamb, S.H. Chung, J. Chen, J. Avise, R.A. Rosenblatt, and R.A. Fenske. 2010. Public health impacts of
climate change in Washington State: projected mortality risks due to heat events and air pollution. Climatic Change 102(1-2): 159-186, doi:
10.1007/s10584-010-9852-3.
Jevrejeva, S., J. C. Moore, and A. Grinsted. 2010. How will sea level respond to changes in natural and anthropogenic forcings by 2100? Geophys. Res. Lett., 37,
L07703, doi:10.1029/2010GL042947.
Mantua, N.J., I. Tohver, and A.F. Hamlet. 2010. Climate change impacts on streamflow extremes and summertime stream temperature and their possible
consequences for freshwater salmon habitat in Washington State. Climatic Change 102(1-2): 187-223, doi: 10.1007/s10584-010-9845-2.
Mote, P.W., and E.P. Salathé. 2010. Future climate in the Pacific Northwest. Climatic Change 102(1-2): 29-50, doi: 10.1007/s10584-010-9848-z.
Mote, P.W., A. Petersen, S. Reeder, H. Shipman, and L.C. Whitely Binder. 2008. Sea Level Rise in the Coastal Waters of Washington State. Report prepared by
the Climate Impacts Group, Center for Science in the Earth System, Joint Institute for the Study of the Atmosphere and Oceans, University of
Washington, Seattle, Washington and the Washington Department of Ecology, Lacey, Washington.

TAG3 Interim Report February/2011 85 | P a g e
Pfeffer, W.T., J. T. Harper, and S. O’Neel. 2008. Kinematic constraints on glacier contributions to 21st-century sea-level rise. Science 321: 1340, doi:
10.1126/science.1159099.
Rahmstorf, S. 2010. A new view on sea level rise. Nature Reports Climate Change Vol. 4: 44-45, doi:10.1038/climate.2010.29
Rosenberg, E.A., P.W. Keys, D.B. Booth, D. Hartley, J. Burkey, A.C. Steinemann, and D.P. Lettenmaier. 2009. Precipitation extremes and the impacts of climate
change on stormwater infrastructure in Washington State. Chapter 9 in The Washington Climate Change Impacts Assessment: Evaluating Washington's
Future in a Changing Climate, Climate Impacts Group, University of Washington, Seattle, Washington.
Rosenberg, E.A., P.W. Keys, D.B. Booth, D. Hartley, J. Burkey, A.C. Steinemann, and D.P. Lettenmaier. 2010. Precipitation extremes and the impacts of climate
change on stormwater infrastructure in Washington State. Climatic Change 102(1-2): 319-349, doi: 10.1007/s10584-010-9847-0.
Ruggiero, P., P.D. Komar, and J.C. Allan. 2010. Increasing wave heights and extreme-value projections: the wave climate of the U.S. Pacific Northwest, Coastal
Engineering 57: 539-552, doi:10.1016/j.coastaleng.2009.12.005.
Salathé, E.P., L.R. Leung, Y. Qian, and Y. Zhang. 2010. Regional climate model projections for the State of Washington. Climatic Change 102(1-2): 51-75, doi:
10.1007/s10584-010-9849-y.
Solomon, S., D. Qin, M. Manning, R.B. Alley, T. Berntsen, N.L. Bindoff, Z. Chen, A. Chidthaisong, J.M. Gregory, G.C. Hegerl, M. Heimann, B. Hewitson, B.J.
Hoskins, F. Joos, J. Jouzel, V. Kattsov, U. Lohmann, T. Matsuno, M. Molina, N. Nicholls, J. Overpeck, G. Raga, V. Ramaswamy, J. Ren, M. Rusticucci,
R. Somerville, T.F. Stocker, P. Whetton, R.A. Wood and D. Wratt. 2007. Technical Summary. In: Climate Change 2007: The Physical Science Basis.
Contribution of Working Group I to the Fourth Assessment Report of the Intergovernmental Panel on Climate Change [Solomon, S., D. Qin, M. Manning,
Z. Chen, M. Marquis, K.B. Averyt, M. Tignor and H.L. Miller (eds.)]. Cambridge University Press, Cambridge, United Kingdom and New York, NY,
USA.
Tohver, I. and A.F. Hamlet. 2010. Impacts of 21st century climate change on hydrologic extremes in the Pacific Northwest region of North America. Chapter 7
in Final Report for the Columbia Basin Climate Change Scenarios Project, Climate Impacts Group, University of Washington, Seattle, Washington.
Vermeer, M. and S. Rahmstorf. 2009. Global sea level linked to global temperature. Proceedings of the National Academy of Sciences 106(51): 21527-21532,
doi: 10.1073/pnas.0907765106

TAG3 Interim Report February/2011 86 | P a g e
APPENDIX C: Criteria for Prioritizing Adaptation Actions
Note: Thanks to Lara Whitely-Binder and Dan Siemann for guiding the TAG in developing this criteria.
The following criteria were developed by TAG 3 for selecting and, where relevant, prioritizing
adaptation objectives, strategies, and actions. The TAG used these criteria as general guidelines
rather than in any kind of strict or quantitative fashion. TAG3 recommends that as
implementation is advanced for natural resource climate adaptation strategies, these guidelines
continue to be refined.
These criteria were selected because they were helpful in assessing:
The degree to which a climate change impact needs to be addressed in the state’s current
adaptation planning effort (Urgency);
If the objective, strategy, or action reflects key characteristics associated with increased
climate resiliency, e.g., objectives, strategies, or actions that help reduce vulnerability to
climate change while being able to adapt to the changing nature of projected climate change
(Robustness, Flexibility/Reversibility);
If, where, and how the benefits of the objective, strategy, or action are likely to be realized
(Risk of Unintended Consequences, Geographic Distribution of Benefits, Secondary Benefits,
No/Low Regrets);
Considerations for implementing the objective, strategy, or action (Time Frame for
Implementation, Capacity, Window of Opportunity, Geographic Distribution of Benefits,
Secondary Benefits, No/Low Regrets); and, ultimately,
Whether the objectives, strategies, and actions meet the goals and guiding principles of the
TAG (all of the criteria).
The criteria are divided into two categories: 1) criteria that broadly evaluate the adaptive nature
and relevance of an objective, strategy, or action (―general criteria‖); and 2) criteria that relate
more specifically to implementation considerations (―implementation criteria‖). More
information on each of the criteria is provided below and summarized in Tables 1 and 2.
General Criteria (Table 1)
1. Urgency – The urgency metric asks whether it is important to implement the objective,
strategy, or action now as opposed to waiting. The need for urgency may be due to the fact
that:
the impact (e.g., habitat loss) is occurring now, regardless of whether the presumed cause
is climate change or some other driver (e.g., development or growing dominance of an
invasive species);
it may take time to get all the necessary pieces in place to implement an action (e.g.,
legislative authorities, funding, and relevant technical data);
a specific action is necessary to accomplish other priority objectives, strategies, or
actions; and/or
TAG3 Interim Report February/2011 87 | P a g e
the opportunity cost of not acting in the near-term is high (e.g., opportunities to preserve
critical habitat may be lost while waiting to for sea level to rise a certain amount before
taking action)
2. Robustness – asks whether the objective, strategy, or action is likely to be effective for a
broad range of plausible future climate change projections rather than a single or narrow
range of projections. Note that a limited range of robustness does not necessarily eliminate a
specific objective, strategy, or action; a limited range of robustness may acceptable if, for
example, the objective, strategy, or action is flexible and/or easily reversible or the projected
impact being addressed by the objective, strategy, or action has potentially significant
consequences (i.e., the urgency is high).
3. Flexibility/Reversibility – asks whether the objective, strategy, or action can be easily
adjusted or reversed if future research or other factors indicate that climate impacts are likely
to occur in ways not previously anticipated.
4. Risk of Unintended Consequences – asks whether the objective, strategy, or action could
lead to unintended consequences. The potential for unintended consequences may be
acceptable if the objective, strategy, or action is flexible or reversible. Risk tolerance will
also be a factor in deciding whether the potential for unintended consequences is significant
enough to warrant a different choice.
Implementation Criteria (Table 2)
5. Time Frame for Implementation – this metric is specific to actions and refers to the point in
time that the action is considered ―up-and-running‖. Work on securing the things required to
implement an action (e.g., changes in law, funding, staffing, partnership building etc) could
be happening in the interim period.
6. Capacity – asks whether current capacity for implementing an objective, strategy, or action is
sufficient. Capacity may be determined by many factors, including the availability of
funding, staff, and relevant information; access to necessary technical resources; and existing
program requirements or limitations.
7. Window of Opportunity – refers to a unique (and presumably limited) opportunity for
implementing an objective, strategy, or action. The window may include an upcoming
revision of a strategic plan, law, or policy; allocation of a new funding source; enhancement
of on-going initiatives, or other unique opportunities for integrating a recommended
objective, strategy, or action into programs or other planning frameworks.

TAG3 Interim Report February/2011 88 | P a g e
8. Geographic Distribution of Benefits - asks whether the objective, strategy, or action benefits
to a small or large range and/or number of critical ecological functions11 or uniquely
valuable species. Having a limited range of benefits does not necessarily reduce the value of
that objective, strategy, or action since a place-specific ecological function or uniquely
valuable species is important in its own right. The metric is simply a reflection of how
broadly the objective, strategy, or action applies.
9. Secondary Benefits - asks whether the objective, strategy, or action provides benefits to
other program or community goals beyond the primary goal of helping critical ecological
functions or uniquely valuable species adapt to climate change. For example, ―Re-establish
connectivity of rivers and floodplains‖ (Freshwater/Aquatic Strategy) has the primary goal of
improving habitat for aquatic and terrestrial species but also provides secondary benefits that
include reducing flood risk and improving water quality. The absence of secondary benefits
does not negate the value of the objective, strategy, or action, but could be a factor when
prioritizing for implementation.
10. No/Low Regrets – asks whether an objective, strategy, or action is likely to provide
adaptation or other benefits if climate change impacts occur in ways not previously
anticipated. Although similar to ―Secondary Benefits‖, this metric recognizes that both
no/low regrets and high regrets objectives, strategies, and actions can provide secondary
benefits. Consequently, ―No/Low Regrets‖ is listed as a separate criterion that may be
particularly useful when deciding which subset of objectives, strategies, and actions will be
implemented in the near term.
Table 1: General Criteria
Note: “Action” should be interpreted as “objective, strategy, or action” depending on what is
being evaluated.
CRITERIA Low Medium High
Urgency Low Medium High
Robustness The action is effective for a
narrow range of plausible
future climate scenarios
(this cell left intentionally
blank)
The action is effective for a
wide range of future
climate scenarios
Flexibility/
Reversibility
The action cannot be
easily adjusted and/or
reversed
The action is somewhat
adjustable and/or
reversible
The action can be easily
adjusted and/or reversed
Risk of Unintended
Consequences
The action has a high
known risk of causing
negative unintended
consequences
The action has some
known risk of causing
negative unintended
consequences
The action has little to no
known risk of causing
negative unintended
consequences

TAG3 Interim Report February/2011 89 | P a g e
Table 2: Implementation Criteria
Table note: “Action” should be interpreted as “objective, strategy, or action” with the exception
of “Time Frame for Implementation”, which applies specifically to actions.
CRITERIA Low Medium High
Time Frame for
Implementation
The action is not likely to
be implemented for 5 or
more years
The action is likely to be
implemented in 3-5 years
The action can be
implemented in 1-3 years
Capacity Current capacity
insufficient and gaps
cannot be easily
addressed.
Gaps exist in one or more
areas but can be
addressed.
Current capacity is largely
sufficient.
Window of Opportunity There is currently no
window of opportunity for
implementing the action
A window of opportunity
can be created for
implementing the action
A window of opportunity
exists for implementing
the action
Geographic Distribution
of Benefits
The action benefits a very
small geographic range
and/or number of species
(e.g. site specific)
The action benefits a
sizeable geographic range
and/or number of species
(e.g., regional)
The action benefits a very
wide geographic range
and/or number of species
(e.g., statewide)
Secondary Benefits The action has no
additional benefit(s)
beyond the initial goal of
helping critical ecological
functions or uniquely
valuable species adapt to
climate change.
(this cell left intentionally
blank)
The action provides
additional benefit(s)
beyond the initial goal of
helping critical ecological
functions or uniquely
valuable species adapt to
climate change.
No/Low Regrets The action has no
adaptation benefit(s) if
climate change impacts
occur in ways not
previously anticipated
(this cell left intentionally
blank)
The action provides
adaptation benefit(s) even
if climate change impacts
occur in ways not
previously anticipated
Note that some metrics presented here are binary in nature and therefore do not have a ―medium‖
description. For example, it is easier (absent the use of models for testing) to qualitatively assess
if an objective, strategy, or action is robust for a small vs. large range of future climate scenarios
than to try to determine robustness for a small, medium, and large range of scenarios. Similarly,
trying to distinguish between a medium versus high level of benefit would be hard to do in a
meaningful way. Consequently, the Secondary Benefits and No/Low Regrets criteria simply ask
if benefits are, or are not, expected.

TAG3 Interim Report February/2011 90 | P a g e
APPENDIX D: GLOSSARY OF CLIMATE CHANGE ADAPTATION CONCEPTS AND
TERMS12
Note that this glossary defines these terms specifically in the context of climate change and that
many have different or broader meanings in other contexts.
Adaptation – Adjustment in natural or human systems in response to actual or expected climatic changes and associated effects that minimizes harm or takes advantage of beneficial opportunities. Adaptive Capacity – The ability of a system to adjust to climatic changes and associated effects (including social, economic, and ecological), to moderate potential damages, to take advantage of opportunities, and to cope with the consequences.i Climate Change – Any long-term change in average climate conditions in a place or region, whether due to natural causes or as a result of human activity. (Climate) Impacts Assessment – The practice of identifying and evaluating the detrimental and beneficial consequences of climate change on natural and human systems. Climate Variability – Variations in the mean state of the climate and other statistics (such as standard deviations, the occurrence of extremes, etc.) on all temporal and spatial scales beyond that of individual weather events, such as the occurrence of a particularly wet or dry year. Co-benefits – Benefits that go beyond the primary intended benefits of a particular policy, or benefits of policies designed to address multiple concerns simultaneously. For example, restoring wetlands to minimize flood risk has the co-benefit of increasing waterfowl habitat. Reducing greenhouse gas emissions from driving has the co-benefit of improving air quality. Impact (of climate change)– Any consequence of climate change on a system, species, etc., including effects on structure, composition, or function. Maladaptation - An action or strategy that increases rather than decreases vulnerability to
climate change or its effects.
Mitigation – In the climate change community, a human intervention to reduce the sources or improve the uptake (sinks) of greenhouse gases. In the disaster community, human intervention to minimize harm. No-regrets policy – A policy that would generate net social benefits regardless of climate change or the effectiveness of the policy in achieving its primary goal. Refugium (pl. refugia) - An area where climatic change is relatively less rapid or extreme (e.g., due to physical landscape features, such as north-facing slopes, valleys or other low areas that
12
Definitions adapted from the California Climate Adaptation Strategy, 2009, and also provided by TAG3 members.

TAG3 Interim Report February/2011 91 | P a g e
serve as sinks for cold air, or streams fed by deep coldwater springs). Refugia can serve as strongholds for species that can no longer survive elsewhere. Resilience – The ability of a population or system to bounce back to something like its previous state following disturbance or change. Resilience can also applied to managing ecosystems and species to make them more able to recover from disturbance. Resistance – The ability of a population or system to remain relatively unaffected by climatic change and associated effects. Resistance can also be applied to managing ecosystems and species to make them more able to resist the effects of global climate change. Response – In the context of adaptation, the longer-term shifts in ecosystems or species as a result of climate change or its effects, for example changes in a species’ geographic range or in the species and systems that make up an ecosystem. Response can also be applied to managing species or system responses to maintain desired resources or ecosystem services over time. The philosophy is essentially one of facilitating natural responses to change rather than trying to maintain the status quo. Risk (climate-related) – The possibility of interaction of physically defined hazards with the exposed systems; the combination of the likelihood of an event and its consequences – i.e., the probability of climate hazard occurring multiplied the consequences a given system may experience. System – A human community or an ecosystem; a social, economic, cultural, or natural complex; a group of interacting natural resources, species, infrastructure, or other assets. Vulnerability – In the most general sense, susceptibility to harm or change. More specifically, the degree to which a system is exposed to, sensitive to, and unable to cope with the adverse effects of climate change, including climate variability and extremes. Vulnerability is a function of the character, magnitude, and rate of climate variation to which a system is exposed, as well as of non-climatic characteristics of the system, including its sensitivity, and its coping and adaptive capacity. Vulnerability Assessment – A practice that identifies who and what is sensitive to change, how much change they are exposed to, and how able a given system is to respond to the changes that occur (including variability and extremes). A vulnerability assessment considers the intrinsic and extrinsic factors that govern the exposure and sensitivity of species, communities, or ecosystems to change, and the ability of the species or system to successfully adapt (evolutionarily, behaviorally, physiologically, socially, economically, and so on).

TAG3 Interim Report February/2011 92 | P a g e
APPENDIX E: Science Summaries for four ecological systems
(NOT INCLUDED IN THIS DOCUMENT)


