Species diversity in the Florida Everglades, USA - Environmental
24
Aquat. Sci. 68 (2006) 254–277 1015-1621/06/030254-24 DOI 10.1007/s00027-006-0854-1 © Eawag, Dübendorf, 2006 Aquatic Sciences Overview Article Species diversity in the Florida Everglades, USA: A systems approach to calculating biodiversity Mark T. Brown*, Matthew J. Cohen, Eliana Bardi and Wesley W. Ingwersen Center for Environmental Policy, Dept. of Environmental Engineering Sciences, University of Florida, Gainesville FL 32611-0510, USA Received: 15 June 2005; revised manuscript accepted: 11 January 2006 Abstract. The Everglades, a complex wetland mosaic bounded by human development at the southern tip of the Florida Peninsula, is home to a wide array of species, including 68 threatened or endangered animal species. Species richness within Everglades National Park, at the southern extreme of the Greater Everglades ecosystem, is 1033 plant taxa, 60 reptile taxa, 76 mammal taxa, 432 fish taxa, 349 bird taxa and 38 amphibian taxa. This pa- per briefly introduces the flora and fauna of the Greater Everglades, focusing on species of special conservation concern and those non-native species that are altering na- tive ecology. While there is conservation utility in cata- loging biodiversity, we argue that counts of species alone are inadequate descriptors of ecosystem condition be- cause they fail to effectively indicate emergent ecosystem properties (resilience, productivity). We develop an ap- proach to calculating biodiversity based on systems theo- ry that can be applied across trophic levels to provide a condition benchmark that accounts for food web interac- tions. The Everglades, for which detailed flow data be- tween ecosystem components have been compiled as part of ongoing modeling efforts (DeAngelis et al., 1998), is among the few ecosystems globally for which this tech- nique is currently feasible. Flow data are coupled with exogenous forcing energies (in emergy units – Odum, 1996) to compute transformity values (Odum, 1988) for biotic and abiotic components of an Everglades grami- noid marsh community. We calculate across-trophic level biodiversity using the Shannon information equation ap- plied to ecosystem emergy flows. Results suggest that the graminoid marsh is operating at 42 % of theoretical maximum ecosystem flow diversity. By comparing ob- served flows with theoretical maximum flows, we pro- vide a measure of component conservation value; we observe strong overlap between species with lower than expected emergy-based importance and those known to be currently threatened or endangered. A significant positive association between this conservation value and transformity in the marsh suggests systematic upper- trophic level biodiversity degradation. * Corresponding author phone: +1 352 392 2309; fax: +1 352 392 3624; e-mail: mtb@ufl.edu Published Online First: August 22, 2006 Key words. Biodiversity; Everglades; transformity; emergy; network analysis; ecosystem. Introduction At approximately 26 degrees north latitude, the Everg- lades of south Florida occupies the tip of the Florida Pe- ninsula, a limestone plateau that is the southeastern ex- tension of the North American continent (Fig. 1). The Everglades is the only subtropical preserve in North America, the largest sawgrass prairie in the world, the largest mangrove complex in the Western Hemisphere, and home to 68 threatened or endangered animal species. As a result of this unique biological value, the Everglades is currently the focus of a major restoration effort (www.evergladesplan.org) aimed, in part, at alleviating the effects of numerous impacts from surrounding land
Transcript of Species diversity in the Florida Everglades, USA - Environmental

Aquat. Sci. 68 (2006) 254–2771015-1621/06/030254-24DOI 10.1007/s00027-006-0854-1© Eawag, Dübendorf, 2006
Aquatic Sciences
Overview Article
Species diversity in the Florida Everglades, USA: A systems approach to calculating biodiversityMark T. Brown*, Matthew J. Cohen, Eliana Bardi and Wesley W. Ingwersen
Center for Environmental Policy, Dept. of Environmental Engineering Sciences, University of Florida, Gainesville FL 32611-0510, USA
Received: 15 June 2005; revised manuscript accepted: 11 January 2006
Abstract. The Everglades, a complex wetland mosaic bounded by human development at the southern tip of the Florida Peninsula, is home to a wide array of species, including 68 threatened or endangered animal species. Species richness within Everglades National Park, at the southern extreme of the Greater Everglades ecosystem, is 1033 plant taxa, 60 reptile taxa, 76 mammal taxa, 432 fi sh taxa, 349 bird taxa and 38 amphibian taxa. This pa-per briefl y introduces the fl ora and fauna of the Greater Everglades, focusing on species of special conservation concern and those non-native species that are altering na-tive ecology. While there is conservation utility in cata-loging biodiversity, we argue that counts of species alone are inadequate descriptors of ecosystem condition be-cause they fail to effectively indicate emergent ecosystem properties (resilience, productivity). We develop an ap-proach to calculating biodiversity based on systems theo-ry that can be applied across trophic levels to provide a condition benchmark that accounts for food web interac-tions. The Everglades, for which detailed fl ow data be-
tween ecosystem components have been compiled as part of ongoing modeling efforts (DeAngelis et al., 1998), is among the few ecosystems globally for which this tech-nique is currently feasible. Flow data are coupled with exogenous forcing energies (in emergy units – Odum, 1996) to compute transformity values (Odum, 1988) for biotic and abiotic components of an Everglades grami-noid marsh community. We calculate across-trophic level biodiversity using the Shannon information equation ap-plied to ecosystem emergy fl ows. Results suggest that the graminoid marsh is operating at 42 % of theoretical maximum ecosystem fl ow diversity. By comparing ob-served fl ows with theoretical maximum fl ows, we pro-vide a measure of component conservation value; we observe strong overlap between species with lower than expected emergy-based importance and those known to be currently threatened or endangered. A signifi cant positive association between this conservation value and transformity in the marsh suggests systematic upper-trophic level biodiversity degradation.
* Corresponding author phone: +1 352 392 2309; fax: +1 352 392 3624; e-mail: mtb@ufl .eduPublished Online First: August 22, 2006
Key words. Biodiversity; Everglades; transformity; emergy; network analysis; ecosystem.
Introduction
At approximately 26 degrees north latitude, the Everg-lades of south Florida occupies the tip of the Florida Pe-ninsula, a limestone plateau that is the southeastern ex-
tension of the North American continent (Fig. 1). The Everglades is the only subtropical preserve in North America, the largest sawgrass prairie in the world, the largest mangrove complex in the Western Hemisphere, and home to 68 threatened or endangered animal species. As a result of this unique biological value, the Everglades is currently the focus of a major restoration effort (www.evergladesplan.org) aimed, in part, at alleviating the effects of numerous impacts from surrounding land

Aquat. Sci. Vol. 68, 2006 Overview Article 255
uses. Cumulative impacts over the last century have cul-minated in the system’s natural fl ow of water being con-trolled by 1,000 miles of manmade canals, 720 miles of levees, 16 pump stations and 200 gates that divert 6.4 million m3 of water daily from the Everglades to the sur-rounding seas. The biological consequences of hydro-logic and water quality modifi cation have been dramatic: approximately 90–95 % of the wading bird population has been lost since the 1930’s (Ogden, 1997) and major changes in ecosystem composition, structure and func-tion have been widely documented (Davis and Ogden, 1997; Forys and Allen, 2002).
The Everglades National Park (ENP), established Dec. 6th 1947 as the fi rst park in the national system se-lected primarily for biological attributes, lies within the larger Everglades system (Greater Everglades). In addi-tion to its federal protection status, the park, which cov-ers an area over 600,000 hectares at the extreme southern tip of the Florida peninsula, is recognized as a Natural
World Heritage site and a Ramsar Convention site, and forms the heart of a group of protected areas in the South Florida ecosystem (including Big Cypress National Pre-serve, Biscayne Bay National Park, Dry Tortugas Na-tional Park, Key Largo National Marine Sanctuary, sev-eral National Wildlife Refuges and the Florida Keys National Marine Sanctuary).
We begin with an ecological characterization of the Everglades and an overview of the historic and current system with a short discussion on the restoration efforts. Next, we present a literature review of biodiversity in the Everglades and provide an extensive species list for plants and major animal groups. Finally, we introduce a systems approach to calculating biodiversity across trophic scales using one Everglades community as the case study, ending with a discussion on integrating trophic interactions into biodiversity calculations.
Ecological characterization of the Everglades The Florida peninsula is the result of several alternating episodes of submergence and emergence in response to the rise and fall of sea level over the past 40 million years. At high sea level the plateau acted as a marine shelf and limestone was deposited. During times of low sea level, acidic freshwaters from decomposition of or-ganic matter dissolved and eroded the limestone creating the riddled solution features that characterize the lime-stone underlying the Everglades (Lane, 1994; Randazzo and Jones, 1997). Overlaying the limestone in the central portions of the Everglades is a thin veneer of organic peat of varying depth, generally decreasing from about 4–5 m in thickness in the northernmost parts of the Everglades, south of Lake Okeechobee, to only several centimeters deep at its southern extreme. The age of these peats (about 5,000 years) suggests that only recently condi-tions have been favorable for the establishment of the current vegetative communities (Gleason and Stone, 1994). Soils in nearly half of the Everglades, along both the east and west margins, are characterized as calcitic muds that resulted from deposition from calcareous blue-green algae periphyton associations in the alkaline waters of the Everglades (Gleason, 1974).
The climate of southern Florida is described as sub-tropical and humid. Average temperatures range in the mid 20s °C with lows in the winter averaging 15 °C and highs in the summer averaging about 27 °C. Average an-nual rainfall over the Everglades is between 100 and 165 cm (Duever et. al, 1994). The rainfall pattern (Fig. 2) generally is characterized by a dry season that extends from November to April or May and a wet season from June to September or October (Fernald and Purdum, 1998). The wet season usually accounts for more than half of yearly rainfall and is dominated by convective systems, while storms in the winter months are usually
Figure 1. Major physiographic areas of south Florida, showing wide, arching Everglades slough bounded on the east by the Atlantic Coastal Ridge and on the west by the Big Cypress Swamp. To the north of the Everglades is Lake Okeechobee, the second largest in-land freshwater lake in the USA. The Everglades’ watershed is more than twice its size extending more than 350 km from north to south (from McPherson and Halley, 1997).

256 M. T. Brown et al. Ecosystem biodiversity in the Florida Everglades
the result of frontal activity. Rainfall is highly variable both from season to season and year to year, often punc-tuated by very dry years corresponding to El Niño events and hurricanes that can bring as much as 50 cm of rainfall in a short period of time (Fernald and Purdum, 1998).
The historic Everglades system. The historic Everglades was a wide arching, sawgrass (Cladium jamaicense) dominated “River of Grass” (Douglas, 1947), centrally located within the southern portion of the Florida penin-sula (Fig. 1). The Everglades “River of Grass” covered approximately 10,100 km2 and was the lower segment of a much larger drainage system (the Greater Everglades watershed) of approximately 23,300 km2 (Gleason and Stone, 1994) stretching about 350 km from central Flori-da to the southern tip at Florida Bay. The southern region of the Everglades had nearly imperceptible slope from Lake Okeechobee southward to Florida Bay, averaging around 3 cm/km. On the east, the Everglades was bound-ed by a low sand-covered limestone ridge dominated by pine and tropical hardwood forests known as the Atlantic Coastal Ridge. The ridge was approximately 8–10 km in width with elevations averaging less than 10 m, and was breached in numerous locations by drainage ways carry-ing rainy season waters eastward to the Atlantic Ocean. To the west was the region known as the “Big Cypress Swamp”, presumably named because of the dominance of cypress trees (Taxodium spp.) intermixed with saw-grass prairies. As Figure 1 suggests, the Big Cypress Swamp area was a separate hydrologic unit from the Ev-erglades except during extremely wet years when waters may have fl owed from one system to the other in either direction.
To the north of the Everglades, Lake Okeechobee (surface area = 1,732 km2) received surface infl ows from a drainage area of about 9,600 km2 that extended from the
central Florida highlands through a drainage way domi-nated by nearly level marshy wetlands and the meander-ing Kissimmee River (SFWMD, n.d.). The Lake was hydrologically connected to the Everglades and as lake levels rose in response to wet season rains, lake water would over-top the natural levee on its southern shore and sheet fl ow into the river of grass. Parker (1974) sug-gested that the timing of water levels in the overall Kiss-immee-Everglades system was such that as the dry sea-son approached in South Florida, the previous wet season rains in the northern portions of the basin were just arriv-ing in Lake Okeechobee, which would then over-top the southern levee and sheet-fl ow into the Everglades main-taining water levels through the dry season.
The water that sheet-fl owed across the Everglades was derived primarily from rainfall and thus was very low in nutrients. Nutrients from upland areas that entered the system in runoff were quickly taken up by vegetation or immobilized by soils. The result was that vast ex-panses of the Everglades were considered oligotrophic (nutrient poor) wetlands that developed under conditions of severe phosphorus (P) limitation (McCormick et al., 1998).
The Everglades system functioned as an intercon-nected mosaic of wetland habitats interspersed with sea-sonally saturated “tree islands” and pinelands, covering nearly 90 % of southern Florida (Odum and Brown, 1975). Minor variation in topography created a highly heterogeneous landscape mosaic and infl uenced the di-versity of both fl ora and fauna. The alternating periods of wet and dry seasons regulated the life cycles of animal populations, while depths and duration of inundation re-sulting from the varying topography regulated primary production.
The Everglades system today. The Everglades of today bears little resemblance to the historic system. The spa-tial extent of the original Everglades has been reduced by approximately 50 % (Fig. 3). Over 4,000 km2 of the Everglades south of Lake Okeechobee have been con-verted to agricultural lands. Areas along the eastern edge of the Everglades have been converted to various urban uses, including rock quarries, commercial and residential development, and agriculture. In all, ap-proximately 12,000 km2 of the original Greater Everg-lades (including the Kissimmee River watershed) have been converted to human uses (USACE and SFWMD, 1999).
Surrounded by developed lands and crisscrossed by roads, canals, and dikes, water no longer fl ows unob-structed from Lake Okeechobee to the Florida Bay and the Gulf of Mexico. Instead, water fl ow is highly man-aged through a series of canals, locks, and pumps which direct it to controlled Water Conservation Areas (WCA), thus altering the basic fl ows and storages of water and
Average Rainfall
0
5
10
15
20
25
30
J F M A M J J A S O N D
Month
Rain
fall (
cm)
Figure 2. Average monthly rainfall (1961–1990) in the central Ever-glades (Fernald and Purdum, 1998).

Aquat. Sci. Vol. 68, 2006 Overview Article 257
1998 for the restoration of the Greater Everglades eco-system (USACE & SFWMD, 2005). Described as the world’s largest ecosystem restoration project, the CERP includes restoring the natural fl ows of water and histori-cal hydroperiods and improving water quality within the remaining natural areas of the Everglades system. In ad-dition, the program will address water supply and fl ood protection needs in the urban and agricultural regions of south Florida surrounding the Everglades system. The estimated cost of the restoration effort is $7.8 billion; with annual operation and maintenance costs, including assessment and monitoring, of about $182 million (US-CAE and SFWMD, 1999).
Biodiversity of different plant and animal groupsWhile “River of Grass” is an apt description for much of the ecosystem, where vast, predominantly monotypic stands of sawgrass (Cladium jamaicense) are common, much of the celebrated diversity of the ecosystem results from a landscape mosaic that also contains sloughs, wet prairies, cypress swamps, mangrove swamps, pinelands and tree islands. The Everglades represents a unique in-terface between sub-tropical species and those more characteristic of the Caribbean tropics. With a legendary capacity to support bird and fi sh life, and by providing a home for an array of charismatic mega-fauna (e.g. alliga-tors, Florida panthers, snail kites), the biological value of the Everglades system is widely cited in efforts to protect and restore this ecosystem.
The Everglades is home to numerous species spanning the breadth of its heterogeneous ecosystem-types. Species richness has not been reliably quantifi ed for the system as a whole, but within Everglades National Park there are 1033 species of plants, 60 species of reptiles, 38 species of amphibians, 76 species of mammals, 432 species of fi sh, and 459 species of birds (Table 2; ICE, 2004). The diver-sity of the Greater Everglades is substantially higher when one considers the cypress (Taxodium spp.) systems in Big Cypress National Preserve, the tree island systems of the northern Everglades (the Water Conservation Areas – Fig. 3), the preserved areas of Lake Okeechobee and the Kiss-immee River, and the coastal marine preserves, including Florida Bay, Biscayne Bay and the Florida Keys.
Plants. The fl ora of the South Florida ecosystem was a primary factor in the original creation of Everglades Na-tional Park (ENP) (Robertson, 1959). Of the estimated 1600 species that are found in South Florida, more than 1000 have been cataloged in Everglades National Park alone (Avery and Loope, 1983). Over 150 families are represented, with Poaceae (124 taxa), Asteraceae (81), Fabaceae (69), Cyperaceae (53), Euphorbiaceae (45) and Orchiadeae (42) the most diverse; 111 families are repre-sented by fewer than fi ve taxa. Of the fl ora richness in
causing serious impact on both fl ora and fauna. Water management has also affected nutrient regimes with the release of urban stormwater and nutrient laden runoff from agricultural areas, increasing nutrient concentra-tions in the once oligotrophic Everglades and resulting in shifts in plant community structure. Stober et al. (1996) listed 6 critical issues facing the Florida Everglades in-cluding eutrophication, mercury contamination, habitat alteration and loss, hydropattern modifi cation, and en-dangered and exotic species. They suggest that “the greatest threat to the Everglades ecosystem is to assume the issues are independent” (Stober et al., 1996).
The Comprehensive Everglades Restoration Plan. Rec-ognizing that the Everglades was in peril, the United States federal government in partnership with the State of Florida developed a plan to reverse trends, restore the vi-ability of the Everglades, and assist the recovery of sev-eral targeted species (Table 1) . The Comprehensive Ev-erglades Restoration Plan (CERP) was implemented in
Figure 3. South Florida today. After more than 100 years of human “management” the hydrology of the greater Everglades systems is controlled by a network of canals and control structures that direct the fl ows of water (indicated by arrows) (from McPherson and Hal-ley, 1997).

258 M. T. Brown et al. Ecosystem biodiversity in the Florida Everglades
ENP, the majority (664) are dicotyledons, with 316 monocotyledons; over 45 ferns (and fern allies) have also been cataloged (Avery and Loope, 1983). While the plant diversity of Everglades is large, it is distributed unevenly in space. The diverse ecosystem mosaic (at both land-scape and regional scales) leads to high β-diversity (Whittaker, 1975) even where α-diversity may be low in many of the particular patches.
Much of the plant life (>60 %) in the South Florida ecosystem is of tropical affi nity, and local endemism rates are high (65 taxa are endemic, mostly concentrated in the rocky pinelands on the eastern Everglades) (Long and Lakela, 1976). Most of the communities found in the re-gion are unique to North America, with closer analogs throughout the Caribbean, and many of the tropical species found are at the northward extent of their habitat range.
Table 1. Targeted Species in the CERP’s South Florida Multi-Species Recovery Plan (MSRP).
Status Species Scientifi c name
MammalsE Key deer Odocoileus virginianus claviumE Key Largo cotton mouse Peromyscus gossypinus allapaticolaE Key Largo woodrat Neotoma fl oridana smalli
BirdsT Audubon‘s crested caracara Polyborus plancus auduboniiE Cape Sable seaside sparrow Ammodramus (= Ammospiza) maritimus mirabilisE Snail kite Rostrhamus sociabilis plumbeusE Florida grasshopper sparrow Ammodramus savannarum fl oridanus
ReptilesE American crocodile Crocodylus acutusT Bluetail (blue-tailed) mole skink Eumeces egregius lividusT Sand skink Neoseps reynoldsi
InvertebratesE Schaus swallowtail butterfl y Heraclides (= Papilio) aristodemus ponceanusT Stock Island tree snail Orthalicus reses
PlantsE Avon Park harebells Crotalaria avonensisE Beach jacquemontia Jacquemontia reclinataE Beautiful pawpaw Deeringothamnus pulchellusE Carter‘s mustard Warea carteriE Crenulate lead-plant Amorpha crenulataE Deltoid spurge Chamaesyce (= Euphorbia) deltoideaE Florida perforate cladonia Cladonia perforataE Florida ziziphus Ziziphus celataE Four-petal pawpaw Asimina tetrameraE Fragrant prickly-apple Cereus eriophorus var. fragransT Garber’s spurge Chamaesyce (= Euphorbia) garberiE Garrett’s mint Dicerandra christmaniiE Highlands scrub hypericum Hypericum cumulicolaE Key tree-cactus Pilosocereus (= Cereus) robiniiE Lakela’s mint Dicerandra immaculataE Lewton’s polygala Polygala lewtoniiE Okeechobee gourd Cucurbita okeechobeensis ssp. okeechobeensisT Papery whitlow-wort Paronychia chartacea (= Nyachia pulvinata)T Pigeon wings Clitoria fragransE Pygmy fringe-tree Chionanthus pygmaeusE Sandlace Polygonella myriophyllaE Scrub blazing star Liatris ohlingeraeE Scrub mint Dicerandra frutescensE Short-leaved rosemary Conradina brevifoliaE Small’s milkpea Galactia smalliiE Snakeroot Eryngium cuneifoliumE Tiny polygala Polygala smalliiE Wireweed Polygonella basiramia (=ciliata var. b.)
Source: “Notice of Availability of a Technical/Agency Draft Implementation Schedule for the South Florida Multi-Species Recovery Plan” [Federal Register: April 2, 2004 (Volume 69, Number 64)]

Aquat. Sci. Vol. 68, 2006 Overview Article 259
The fl ora can be divided into several structural com-munity-types, driven largely by exogenous factors, in-cluding hydroperiod and inundation depth, fi re frequency, soil substrate (peat or marl soils, the distribution of which refl ects hydrology and water source), anthropogenic nu-trient enrichment and salinity. Small differences in sur-face elevation can result in dramatic shifts in community type, composition and richness. Davis (1943) classifi ed the vegetation into seven communities ranging from high pinelands along the eastern ridge to coastal beach and dunes systems along the Florida Bay and Gulf of Mexico coast. Long (1974) identifi ed 13 communities and tabu-lated the approximate number of plant species in each as follows: scrub vegetation, 76 species; hammocks/tree is-lands, 306; freshwater swamps, 188; dry pinelands, 303; seasonally wet pineland, 361; mangrove, 13; salt marsh, 23; wet prairies, 172; dry prairies, 303; coastal strands and dunes, 115; ruderal or disturbed lands 250; aquatic marshland, 119; and marine waters, 5. The total richness was estimated to be 1,647 species of vascular plants rep-resenting 177 families, though Gunderson (1994) citing Avery and Loope (1983) suggested the number in the southern Everglades was closer to half that number (830 species). Long (1974) further suggested that the vegeta-tion that makes up these plant communities could be categorized into four main groups based on their origin: tropical species, non-tropical species, endemic species, and exotic and introduced species. Gunderson (1994) hi-erarchically grouped fl oral assemblages based on what he termed hydro-edaphic conditions (soil saturation and sa-linity) and growth form (forested versus graminoid). His classifi cation contained nine classes including rockland pine forests, tropical hardwood hammocks, bayheads, willow heads, cypress forests, sawgrass marshes, wet prairies, ponds and creeks, and slough (having little or no emergent vegetation).
Of particular interest for biodiversity, tree islands, which persist on topographic high points within the wet-land mosaic, support a wide diversity of tropical woody species and facultative herbaceous species (Sklar and Van der Valk, 2003); these systems act as ecological cent-
ers, attracting wildlife from areas with longer inundation. They are also particularly vulnerable to replacement by introduced species. Tree island or hammocks are domi-nated by hardwood species of both tropical and temper-ate affi nities, including mahogany (Swietenia mahogoni), gumbo limbo (Bursera simaruba), and cocoplum (Chrys-obalanus icaco) and more temperate species of live oak (Quercus virginiana), red maple (Acer rubum), and hack-berry (Celtis laevigata). Also present are royal palm (Roystonea alata), cabbage palm (Sabal pametto) and 12 other palm species. Bayheads, which exist in saturated but rarely inundated areas, contain isolated stands of Carolina willow (Salix caroliniana) on slight elevations, or bald-cypress (Taxodium distichum) in organic matter fi lled depression. The warm, humid environment within tree islands and bayheads is ideal for supporting numer-ous orchids, bromeliads and ferns, some of which are endemic to the region.
The marsh complex that is the most well-known im-age of the Everglades is comprised of some 100 species, primarily graminoid, that are adapted to extended inun-dation (>200 days/year). Sawgrass (Cladium jamaicense) tends to dominate in shallower regions, often in the ab-sence of any co-dominants. Historic sawgrass communi-ties were responsible for the deposition, over 5000+ years, of deep peat soils south of Lake Okeechobee; the farming of these soils over the last 50 years has led to serious oxidation of those peat stocks. In areas with an-thropogenically-elevated levels of nutrients (phosphorus in particular) and extended hydroperiod, sawgrass is be-ing replaced by monotypic stands of cattails (Typha domingensis).
Ridges of sawgrass are interspersed with fl ow-ori-ented, deeper (30 60 cm) channels, called sloughs, which support only those macrophytes adapted to deeper water and longer inundation. Along the gradient of mean water depth and inundation period, wet prairies fall between ridges and sloughs. A typical slough is dominated by water lilies (Nymphaea odorata) and bladderworts (Utri-cularia spp.), while Tracy’s beaksedge (Rhynchospora tracyi), spikerush (Eleocharis cellulosa), muhley grass (Muhlenbergia fi lipes) and maidencane (Panicum hemi-tomon) are co-dominants in the wet-prairie habitat. Also critically important to local biogeochemical cycling are periphytic algal mats, which are a complex assemblage of photosynthetic algae, bacteria, and zooplankton that are central in carbon, calcium and phosphorus cycling and strongly sensitive to nutrient enrichment.
Other ecosystem types persist in the Greater Everg-lades, largely driven in composition, productivity and ge-ography by prevailing hydrologic patterns/elevation and geologic substrate. Among these other ecosystems are the cypress swamps of the Big Cypress National Preserve, an oligotrophic wetland mosaic dominated by Taxodium spp. (cypress). Within Big Cypress, the character of the woody
Table 2. Species richness in Everglades National Park.
Group # Species Location
Invertebrates 590 WCA 1-3 and ENP1 Plants 1033 Everglades National Park2
Reptiles 60 Everglades National Park2
Mammals 76 Everglades National Park2
Fish 432 Everglades National Park2
Birds 349 Everglades National Park2
Amphibians 38 Everglades National Park2
1 – Shuford, R., SWFWMD, unpublished data.2 – ICE, n.d. – note that the lists include anomalous, extirpated spe-
cies, and those for which presence is listed as unreliable.

260 M. T. Brown et al. Ecosystem biodiversity in the Florida Everglades
ter invertebrates because of limits on habitat types and possibly historically fl uctuating climate. Table 3 lists composition and richness of major aquatic invertebrates native to the Everglades. Of the larger aquatic crusta-ceans and mollusks, only one species each of crayfi sh (Procambarus alleni), freshwater prawn (Palaemonetes paludosus) and amphipod (Hyalella azteca) have been found (Gunderson and Loftus, 1993). In their book the Mayfl ies of Florida, Berner and Pescador (1988) show no stonefl ies and only two mayfl ies in the Everglades, com-pared to 16 species found in South Florida (Table 4). The
vegetation varies from hat-rack cypress (dwarf trees due to nutrient limitations) to large luxurious strands (e.g. Fakahatchee Strand) in landscape depressions where nu-trients and water accumulate. Another geographically signifi cant ecosystem is the rocky pinelands of the south-eastern Everglades, which is also nutrient poor, and in many cases exhibits limited soil development due to fl ood-drought cycles and frequent fi re. Pinelands are dominated by South Florida slash pine (Pinus elliottii var. densa), with saw palmetto (Serenoa repens) a common understory dominant, but are the most diverse habitat in the Everglades, consisting of over 300 varieties of prima-rily tropical plants (Loope et al., 1979).
The freshwater ecosystems of the Everglades grade slowly into tidally-infl uenced ecosystems as water gener-ally fl ows from north to south. Mangrove forests present throughout the coastal areas in the region (forming the largest mangrove complex outside of Australasia) are dominated by three species of mangroves (red – Rhizo-phora mangle, black – Avicennia germinans, and white – Laguncularia racemosa) that compete along an in-creasing salinity gradient. A complement of herbaceous wetland and dune species also persists in the tidally-in-fl uenced region that provides critical ecosystem services as a fi sh and shrimp nursery.
Thirty-fi ve species of plants are listed as rare, threat-ened, endangered or of special concern by various moni-toring agencies in and around the Everglades system. Twenty-eight of these have been identifi ed as specifi c management targets by the CERP (Table 1); most are herbaceous and threatened by nutrient enrichment, hydro-logic change, fi re suppression and introduced species.
Invertebrates. Unlike most of the vertebrates, little is known about the richness of invertebrates in the Everg-lades. With the exception of a few key species, data re-lated to the ecological relationships and autecology of terrestrial and aquatic invertebrates is scarce. It is fairly well known that aquatic invertebrates play an important role in freshwater food webs. Schomer and Drew (1982) suggested that periphyton communities tended to have high concentrations of invertebrates because of high food availability and dissolved oxygen (DO) concentra-tions. Yet, Turner et al. (1999) found that standing stocks of invertebrates in the Everglades were among the lowest when compared with values from the litera-ture as averages over large spatial areas and across sea-sons.
Gunderson and Loftus (1993) suggested that inverte-brates have had little, if any, basic systematic inventory in the Everglades, with most information collected for the larger terrestrial and aquatic invertebrates. They further suggested that, generally, the Everglades was depauper-ate in aquatic invertebrates. Lodge (1994) proposed that the Everglades does not have a great diversity of freshwa-
Table 3. Composition and richness of invertebrates native to the Everglades*.
Group Total Species Species Rich Taxa Depauperate Taxa
Crustaceans Unknown Cladocerans (~37) Crayfi shes (1)Copepods (>10) Prawns (1)
Insects Unknown Odonates (~40) Mayfl ies (2)Water beetles (~55)
Midges (~76)
Snails Aquatic (21) Physids (5) Pilids (1)Planorbids (7) Hydrobiids (2)
* After Gunderson and Loftus (1993)
Table 4. Family, genus and species for 5 insect orders in South Florida (compiled from Lenkzewski, 1980; Opler et al., 1985; Fer-guson et al., 1999; Kondratieff, 2000a and 2000b; Hoback et al., 2001)
Order Family Genera Species
Dragonfl ies and Aeshnidae 7 11Damselfl ies Calopterygidae 2 3
Coenagrionidae 7 25Corduliidae 3 5Gomphidae 6 8Lestidae 1 4Libellulidae 19 39
Butterfl ies Hesperiidae 26 35Lycaenidae 8 12Nymphalidae 19 27Papilionidae 3 7Pieridae 8 14Riodinidae 1 1
Tiger Beetles Cicindelae 2 13
Moths Arctiinae 15 21Lithosiinae 7 10Notodontidae 14 24Pericopinae 1 1Saturniidae 9 12Sphingidae 29 50Syntominae 8 10
Mayfl ies Baetidae 5 8Caenidae 2 3Ephemerellidae 1 1Ephemeridae 1 1Heptageniidae 1 1Leptophlebiidae 1 1
Metretopodidae 1 1

Aquat. Sci. Vol. 68, 2006 Overview Article 261
Florida applesnail (Pomacea paludosa) deserves special mention as an important freshwater mollusk in the Ever-glades due to its predation by a variety of wildlife includ-ing young alligators and numerous birds (Kushlan, 1975). The most notable of these birds is the snail kite, which feeds exclusively on the applesnail (Lodge, 1994). It is generally held that the chydorid, cladocerans, odo-nates, and dipterans are diverse (Gunderson and Loftus, 1993).
Freshwater invertebrates are critical in transfer of en-ergy through the Everglades system. The invertebrate community operates at several trophic levels in the wet-lands, some as primary herbivores of plant material and consumers of detritus and others as carnivores. Some species, such as the crayfi sh and apple snail, are major prey for fi shes and other predatory species, including some endangered animals. Factors that infl uence inverte-brate numbers, biomass, and even community composi-tion therefore may have signifi cant effect on energy transfer through the Everglades. Obviously, the ecology and life histories of aquatic invertebrates are affected by the hydrology of the Everglades marsh, which has in-creasingly been altered and managed by human practices. The distributions and overall abundance of invertebrates appear to be adversely affected by changes in fl ood re-leases, diversion of water, and impoundments (Science Subgroup, 1996). Compound these changes by natural disturbances such as hurricanes and droughts, and the net result is dramatically reduced standing stocks of inverte-brates, sometimes for years following the events (Science Subgroup, 1996).
Fishes. The Everglades National Park is home to 432 spe-cies of fi sh from 91 families; approximately 260 species are observed frequently. The most diverse families are Cyprinidae (minnows and shiners – 32 species), Centra-rchidae (bass/sunfi sh/crappie – 24), Sciaenidae (drum/kingfi sh – 18), Percidae (darter/perch – 17), Clupeidae (shad – 16), Cyprinidontidae (topminnows/killifi sh – 16) and Gobiidae (gobys – 16) (Table 5). A large fraction of the regional fi sh diversity inhabits the marine and estua-rine waters; only 30 species are native to fresh water. Of those, there are several important game species that at-tract thousands of anglers to the park each year, including tarpon (Megalops atlantica), and largemouth bass (Micro-pterus salmoides). The latter is particularly in peril due to bioaccumulation of mercury and crowding out by exotic species. Several smaller fi sh species are extremely impor-tant as food source for wading birds and larger fi sh. Mos-quitofi sh (Gambusia holbrooki) are the most common freshwater fi sh in the Everglades and are found through-out the park. Several marine species are also important for recreational fi shing, including snook (Centropomus un-decimalis), red drum (Sciaenops ocellatus), and spotted seatrout (Cynoscion nebulosus)(Schmidt et al., 2002).
Currently, no fi sh species are listed as threatened or endangered. However, a health advisory is in effect for six species of marine fi sh found in northern Florida bay, including the spotted seatrout, gafftopsail catfi sh (Trachi-notus goodei), crevalle jack (Caranx hippos), ladyfi sh (Elops saurus), and bluefi sh (Pomatomus saltatrix), as their average mercury level is in excess of the state limit for human consumption (Schmidt et al., 2002).
Amphibians and reptiles. Among the more emblematic features of the Everglades ecosystem is the presence of the American alligator (Alligator mississippiensis). However, the Everglades is home to almost 100 other species of amphibians and reptiles, many of which are threatened by the large-scale changes in ecosystem dynamics and habitat that have occurred with development pressure and water management. The breakdown into groups of species found in Everglades National Park shows 60 reptile taxa, with snakes (both Viperidae and Colubridae), skinks, anoles, geckos, and freshwater turtles the richest families (Table 6). Of the 38 amphibian taxa, the salamander (Pletho-dontidae) and frog (Hylidae and Ranidae) families are the richest.
The list of threatened and endangered species in this group includes several large species that receive global conservation attention (sea turtles – Hawksbill, Kemp’s Ridley, Green, Loggerhead, Leatherback; American alli-gator; American crocodile – Crocodylus acutus), some that receive state-wide attention (gopher tortoise – Go-pherus polyphemus, Eastern indigo snake – Drymarchon corais couperi) and others that are highly specifi c to the Everglades (Florida snapping turtle – Chelydra serpen-tine, Alligator snapping turtle – Macroclemys temminckii, bluetail mole skink – Eumeces egregius lividus, sand skink – Neoseps reynoldsi) (Table 7). Over 30 exotic spe-cies have been catalogued in the South Florida ecosys-tem, and are becoming increasingly signifi cant as agents of ecosystem change.
Birds. The large and heterogeneous area of protected habitat, subtropical climate, and position as a gateway between North and South America contribute to making the Everglades a hotspot for bird biodiversity. The offi -cial Everglades National Park (ENP) birdlist records 349 species (Table 2 – after Robertson et al., 1994), though richness across the entire South Florida region is un-doubtedly higher (estimated greater than 400 – ENP, n.d.). Many of these birds, including ducks (Anseri-forms), rails (Gruiforms), wading birds (Ciconiiformes), skimmers (Charadriiformes), plovers, avocets, oyster-catchers, sandpipers, gulls, and terns, depend on wetland areas for their survival (Table 8). The winter season is the period of greatest bird abundance in the Everglades, with 294 winter resident species in the ENP, many of which migrate from the eastern United States and Canada to

262 M. T. Brown et al. Ecosystem biodiversity in the Florida Everglades
exploit the concentrated food source that occurs during the dry season. Less than half of the wintering species stay in the Everglades year-round. Others are neotropical migrants that only stop temporarily before crossing over the Gulf of Mexico to other regions in the Caribbean, Central and South America in the fall season, or while returning to North America in the spring.
The Everglades has historically served as a haven for wading birds (Ciconiiformes), with 16 residents found in ENP. While wading birds are abundant in the region to-day, population numbers were signifi cantly higher 150 years ago. Despite having suffered enormous losses due to plume hunters at the end of the 19th and early part of the 20th century, the abundance of birds was still remark-able and in 1930 the number of wading birds nesting in the Everglades was estimated as 300,000 (McCally, 1999). However, changes in the hydrologic regime stem-ming from the Central and South Florida Project of 1949, which created compartmentalization of water fl ows that is presently being restored, have and continue to reduce wading birds populations. By the early 1990s, only 10,000–50,000 wading birds were estimated to nest in the Everglades (Ogden, 1997).
Due to alteration of the water fl ows and resulting shifts in plant community, two habitat specifi c residents of the Everglades are now endangered. The endemic
Table 5. Species (n = 431) in each of 90 fi sh families in the Everglades. Numbers in parentheses indicate the number of species (n = 256) in each family for which the record in the region is considered reliable.
Family Species Family Species Family Species
Cyprinidae 32 ( 8) Sparidae 5 (5) Sphyraenidae 2 (2)Centrarchidae 24 ( 3) Belonidae 4 (1) Stromateidae 2 (2)Sciaenidae 18 (18) Centropomidae 4 (3) Synodontidae 2 (1)Percidae 17 ( 7) Cichlidae 4 (4) Albulidae 1 (1)Clupeidae 16 ( 4) Lepisosteidae 4 (1) Amiidae 1 (0)Cyprinodontidae 16 ( 1) Ophidiidae 4 (3) Anguillidae 1 (0)Gobiidae 16 (15) Scombridae 4 (4) Antennariidae 1 (1)Carangidae 14 (13) Batrachoididae 3 (0) Aphredoderidae 1 (0)Syngnathidae 13 ( 7) Dasyatidae 3 (2) Aplocheilidae 1 (1)Serranidae 12 ( 9) Echeneidae 3 (1) Callionymidae 1 (1)Bothidae 11 (11) Eleotridae 3 (1) Chaetodontidae 1 (1)Ictaluridae 10 ( 2) Labridae 3 (3) Clariidae 1 (0)Poeciliidae 9 ( 1) Sphyrnidae 3 (2) Coryphaenidae 1 (1)Scaridae 9 ( 9) Triglidae 3 (3) Ephippidae 1 (1)Atherinidae 8 ( 4) Acipenseridae 2 (1) Gobiesocidae 1 (0)Haemulidae 8 ( 8) Apogonidae 2 (2) Lobotidae 1 (1)Balistidae 7 ( 7) Ariidae 2 (0) Loricariidae 1 (0)Catostomidae 7 ( 1) Bythitidae 2 (2) Mobulidae 1 (1)Blenniidae 6 ( 6) Elopidae 2 (0) Molidae 1 (1)Carcharhinidae 6 ( 3) Esocidae 2 (0) Polynemidae 1 (1)Characidae 6 ( 0) Lamnidae 2 (2) Pomatomidae 1 (1)Engraulidae 6 ( 1) Muraenidae 2 (2) Priacanthidae 1 (1)Exocoetidae 6 ( 4) Myliobatidae 2 (1) Pristidae 1 (1)Gerreidae 6 ( 6) Ogcocephalidae 2 (1) Rachycentridae 1 (1)Lutjanidae 6 ( 6) Ostraciidae 2 (2) Rajidae 1 (1)Ophichthidae 6 ( 5) Percichthyidae 2 (0) Rhinobatidae 1 (1)Tetraodontidae 6 ( 6) Petromyzontidae 2 (0) Torpedinidae 1 (1)Clinidae 5 ( 5) Pomacentridae 2 (2) Trichiuridae 1 (1)Mugilidae 5 ( 4) Rhincodontidae 2 (2) Umbridae 1 (1)Soleidae 5 ( 4) Scorpaenidae 2 (2) Xiphiidae 1 (1)
Table 6. Families and species counts for reptiles and amphibians of the Everglades.
Reptile Families Count Amphibian Families Count
Alligatoridae 2 Ambystomatidae 3Anguidae 3 Amphiumidae 2Cheloniidae 1 Bufonidae 3Chelydridae 1 Hylidae 10Colubridae 17 Leptodactylidae 2Crocodylidae 1 Microhylidae 1Emydidae 5 Plethodontidae 8Gekkonidae 5 Proteidae 1Iguanidae 2 Ranidae 6Kinosternidae 1 Salamandridae 1Phrynosomatidae 2 Sirenidae 1Polychridae 5Rhineuridae 1Scincidae 6Teiidae 2Testudinidae 1Trionychidae 1Tropiduridae 2Viperidae 2
Cape Sable seaside sparrow (Ammodramus maritima) breeds only in marl prairies covered with select marsh grasses (Muhlenbergia spp. or sparse Cladium jamai-cense) (Nott and Comiskey, n.d.). The snail kite (Ros-trhamus sociabilis plumbeus), a resident of subtropical

Aquat. Sci. Vol. 68, 2006 Overview Article 263
marshes, eats only snails of the genus Pomacea (apple-snails) which are themselves restricted to subtropical graminoid marshes (Alsop, 2001). Other endangered bird
species include the Florida grasshopper sparrow (Ammo-dramus savannarum fl oridanus), the Kirtland’s warbler (Dendroica kirtlandii), the wood stork (Mycteria ameri-
Table 7. Federally Protected Species in the Everglades region (USFWS, 1994).
Common Name Scientifi c Name USFWS Status1
Amphibians And ReptilesAmerican alligator Alligator mississippiensis T-S/AAtlantic loggerhead turtle Caretta caretta caretta TAtlantic green turtle Chelonia mydas mydas EAmerican crocodile Crocodylus acutus ELeatherback turtle Dermochelys coriacea EAtlantic hawksbill turtle Eretmochelys imbricata imbricata EGopher tortoise Gopherus polyphemus C2Southern hognose snake Heterodon simus C2Atlantic ridley turtle Lepidochelys kempii EGulf salt marsh snake Nerodia clarkii C2Island glass lizard Ophisaurus compressus C2Florida pine snake Pituophis melanoleucus mugitus C2Gulf hammock dwarf siren Pseudobranchus striatus lustricolus C2Florida crawfi sh frog Rana capito aesopus C2Florida scrub lizard Sceloporus woodi C2Miami black-headed snake Tantilla oolitica C2
BirdsCape Sable seaside sparrow Ammodramus maritima EFlorida grasshopper sparrow Ammodramus savannarum fl oridanus EFlorida scrub jay Aphelocoma coerulescens coerulescens TPiping plover Charadrius melodus TWhite-crowned pigeon Columba leucocephala TKirtland‘s warbler Dendroica kirtlandii EReddish egret Egretta rufescens C2Arctic peregrine falcon Falco peregrinus tundrius TSoutheastern American kestrel Falco sparverius paulus C2Bald eagle Haliaeetus leucocephalus TMigrant loggerhead shrike Lanius ludovicianus migrans C2Wood stork Mycteria americana ERed-cockaded woodpecker Picoides borealis EAudubon‘s crested caracara Polyborus plancus audubonii TSnail kite Rostrhamus sociabilis plumbeus ERoseate tern Sterna dougallii T
MammalsSherman‘s short-tailed shrew Blarina carolinensis (=brevicauda) shermani C2Florida mastiff bat Eumops glaucinus fl oridanus C1Florida panther Felis concolor coryi ERound-tailed muskrat Neofi ber alleni C2Florida mouse Peromyscus (= Podomys) fl oridanus C2Southeastern big-eared bat Plecotus rafi nesquii C2Englewood mole Scalopus aquaticus bassi C2Mangrove fox squirrel Sciurus niger avicennia C2West Indian manatee Trichechus manatus latirostris EKey Largo woodrat Neotoma fl oridana smalli EKey deer Odocoileus virginianus clavium ESilver rice rat Oryzomys argentatus EKey Largo cotton mouse Peromyscus gossypinus allapaticola ELower Keys marsh rabbit Sylvilagus palustris hefneri ESoutheastern beach mouse Peromyscus polionotus niveiventris EFlorida black bear Ursus americanus fl oridanus C2
InvertebratesSchaus’ swallowtail butterfl y Heraclides aristodemus ponceanus EStock Island tree snail Orthalicus reses TBartram‘s hairstreak butterfl y Strymon acis bartrami C2
1 – E: Endangered; T: Threatened; C1: A candidate for Federal listing, with enough substantial information on biological vulnerability and threats to support proposals for listing; C2: A candidate for listing, with some evidence of vulnerability, but for which not enough data exist to support listing; T-S/A: Threatened due to Similarity of Appearance

264 M. T. Brown et al. Ecosystem biodiversity in the Florida Everglades
cana) and the red-cockaded woodpecker (Picoides bore-alis) (Table 7).
Mammals. Mammalian distributions, evolution, and ecol-ogy (like those of the other vertebrates) are infl uenced by the geographic, geological, and environmental character-istics of South Florida (Robertson and Federick, 1994). Geographic factors affecting mammalian distributions and abundances include: 1) the relative isolation of south Florida from the main North American land mass because of its location at the end of a long peninsula, 2) the fact that it is the only subtropical area on the continent, cut off from direct land contact with other tropical and subtropi-cal areas, and 3) the relative close proximity of the Carib-bean Islands just off the coast. Means and Simberloff (1987) have suggested a fourth factor contributing to spe-cies numbers; the reduced area of uplands in southern Florida (known as “the Everglades effect”). South Flori-da’s geologically recent emergence from the sea has direct bearing on its present assemblage of land mammals, as do the landscape mosaic of vegetative communities, marked seasonal fl uctuations in water levels, and pulsing events like fi res and hurricanes. In recent times, human infl uenc-es, through both direct and indirect resource use, have been a major force affecting the distribution and abun-dance of many of the mammals of the region. Encroaching urban development, agricultural expansion, drainage, wa-ter diversion, and the introduction of pollution and non-native species have had deleterious effects on many spe-cies. In all, thirty-fi ve species of native land mammals
have been regularly recorded in south Florida and the Ev-erglades (Layne, 1974; Stevenson, 1976; Brown, 1997); an additional 41 species have either been recorded outside the wetland areas of the Everglades (e.g., seals, whales), have been so infrequently observed to be considered unre-liable records (e.g., spotted skunk, river otter), or have been locally extirpated (e.g., bison, wolves). In addition to the native land mammals, about ten introduced species are known to be established and about eight others have been recorded (Layne, 1974). Table 9 lists mammals of Everg-lades National Park and indicates their status.
In general, raccoons (Procyon lotor) and marsh rab-bits (Sylvilagus palustris) are the most common mam-mals in the Everglades and rodents the most abundant. The opossum (Didelphis virginiana) is the only marsu-pial in North America and is found throughout the Ever-glades. White-tailed deer are common throughout the Everglades (Miller, 1993). Lynne (1978) suggested that the Everglades mink (Mustela vison evergladensis), while rare, is found in the Everglades region of South Florida. The rarest mammal in the Everglades is the Florida panther (Felis concolor coryi), whose preferred habitat may be the drier portions of the western Everg-lades and Big Cypress (Smith and Bass, 1994), regions also preferred by the bobcat (Lynx rufus) (Labisky and Boulay, 1995).
Layne (1974) identifi ed four major patterns of mam-mal distribution in the mainland of South Florida: cos-mopolitan, east coastal, divided, and disjunct. Cosmo-politan species, or those that are widespread throughout
Table 8. Birds of Everglades National Park.
Order Common Name(s) Aquatic Transient Permanent
Anseriforms Ducks, Swans, Geese 32 1 5Apodiformes Swifts, Hummingbirds 0 1 1Caprimulgiformes Nightjars, Poorwills 0 0 2Charadriiformes Gulls, Terns, Plovers, Sandpipers 61 7 30Ciconiiformes Herons, Ibises, Bitterns 19 1 20Columbiformes Doves 6 0 6Coraciiformes Kingfi shers 1 0 1Cuculiformes Cuckoos 0 0 4Falconiforms Hawks, Eagles, Kites, Falcons 1 1 6Galliformes Turkey, Quail 0 0 2Gaviiforms Loons 2 0 0Gruiformes Rails, Limpkin, Cranes 12 0 7Passeriformes Warblers, Sparrows, Mimics, etc. 14 21 28Piciformes Woodpeckers 7 0 5Pelecaniforms Pelicans, Boobies, Comorants 8 0 5Phoenicopteriformes Flamingos 1 0 1Podicipediformes Grebes 3 0 1Procelliiforms Shearwaters, Storm-petrels 2 0 0Psittaciformes Parrots 0 2 0Strigiformes Owls 0 0 4
TOTAL 169 34 128
List from Robertson et al. (1994). Classifi cation based on Alsop (2001). Aquatic species are found predominantly in open water or wetland habitat. Transient species are neotropical migrants that occur only in Fall or Spring. Permanent species are non-migratory year-round resi-dents.

Aquat. Sci. Vol. 68, 2006 Overview Article 265
the landscape, include: opossum (Didelphis virginiana), cotton rat (Sigmodon hispidus), bobcat (Lynx rufus), white-tailed deer (Odocoileus virginia), and raccoon (Procyon lotor). Species that are confi ned to the east coast include oldfi eld mouse (Peromyscus polionotus) and Florida mouse (P. fl oridanus). Many of the land mammals are more terrestrial in their affi nity for habitat types and thus do not occur in great numbers throughout the wetland portions of the Everglades. A considerable number of species have divided ranges, with populations on the east and west sides of the Everglades in the more terrestrial environments. Examples include short-tailed shrew (Blarina brevicauda), eastern cottontail (Sylvila-gus fl oridanus), grey squirrel (Sciurus carolinensis), southern fl ying squirrel (Glaucomys volans), cotton mouse (Peromyscus gossypinus) and marsh rabbit (Sylvi-lagus palustris). The Everglades mink (Mustela vison evergladensis) is the only mammal having two well-sep-arated disjunct populations.
There is only limited information on population trends and population ecology of most Everglades mam-mals. While presently there is little or no empirical data to document population trends of most species of mam-mals in the Everglades basin, it is widely speculated that several species dependent on freshwater marsh habitats have substantially declined as a result of human induced changes (Science Sub-group, 1996). Two species of prin-cipal concern are the round-tailed muskrat (Neofi ber al-leni) and the river otter (Lutra canadensis). Two endan-gered species with habitat within Everglades National Park are the Key Largo wood rat (Neotoma fl oridana smalli) and the Key Largo cotton mouse (Peromyscus gossypinus allapaticola). Other more upland species such as the three native squirrels (gray (Sciurus carolin-ensis), fox (Sciurus niger), and southern fl ying (Glauco-mys volans)) and the black bear (Ursus americanus fl ori-danus) have become greatly reduced in numbers and range as a result of human development activities (Table
Table 9. Mammals of Everglades National Park.*
Species Status
Opossum (Didelphis virginiana) Locally common Short-tailed shrew (Blarina brevicauda) Locally common Least shrew (Cryptotis parva) Locally common Eastern mole (Scalopus aquaticus) HypotheticalSeminole bat (Lasiurus seminolus) HypotheticalFlorida yellow bat (Lasiurus intermedius) HypotheticalEvening bat (Nycticeius hymeralis) HypotheticalBrazilian free-tailed bat (Tadarida brasiliensis) HypotheticalFlorida mastiff bat (Eumops glaucinus) HypotheticalMarsh rabbit (Sylvilagus palustris) CommonEastern cottontail (Sylvilagus fl oridanus) Rare to commonGray squirrel (Sciurus carolinensis) Rare to locally commonFox squirrel (Sciurus niger) UncommonSouthern fl ying squirrel (Glaucomys volans) Uncommon Rice rat (Oryzomys palustris) Common Cotton mouse (Peromyscus gossypinus) Common Cotton rat (Sigmodon hispidus) Common Roundtail muskrat (Neofi ber alleni) Locally common Grey fox (Urocyon cineroargenteus) Rare Black bear (Ursus americanus) RareRaccoon (Procyon lotor) Common Everglades mink (Mustela vison) Uncommon Long-tailed weasel (Mustela frenata) Hypothetical. Eastern spotted skunk (Spirogale putorius) HypotheticalStriped skunk (Mephitis mephitis) Rare River otter (Lutra canadensis) Uncommon.Florida panther (Felis concolor) Endangered subspecies (F.c.coryi).Bobcat (Lynx rufus) Common White-tailed deer (Odocoileus virginianus) Common Nine-banded armadillo (Dasypus novemcinctus Linnaeus) Introduced. Somewhat common Roof rat (Rattus rattus) Introduced. Uncommon House mouse (Mus musculus) Introduced. Common Norway rat (Rattus norvegicus) Introduced. Hypothetical. Red fox (Vulpes vulpes) Introduced. Rare Coati (Nasua narica) Introduced. Rare.Domestic dog (Canis familiaris) Introduced. RareDomestic cat (Felis domesticus) Introduced. Rare Domestic pig (Sus scrofa) Introduced. Rare
* after Florida National Parks & Monuments Association (n.d.)

266 M. T. Brown et al. Ecosystem biodiversity in the Florida Everglades
7). The ecological consequences of increasing population of introduced feral cats, dogs, and pigs, while of minor consequence on mammal populations, may have signifi -cant consequences to other wildlife populations.
Introduced species. The South Florida ecosystem, and the Florida Everglades in particular, is a regional hot-spot for invasive exotic taxa. The orientation and length of the Florida peninsula result in many of the species native to the South Florida region being at the southward extent of their habitat range. An estimated 221 species of intro-duced plants have growing or naturalized populations in the region, perhaps as a result of this geographic condi-tion coupled with the substantial changes in regional hy-drology and the large human population. Listed in Table 10 are some of the more signifi cant adventive plant taxa. Among the most expensive, both with respect to ecologi-cal and fi nancial costs, are melaleuca (Melaleuca quin-quenervia) and Brazilian pepper (Schinus terebinthifo-lius); both are increasing coverage, particularly in disturbed areas of the South Florida ecosystem.
A number of non-native mammal species have been accidentally or intentionally introduced in South Florida. Layne (1974) listed the following species as known or suspected to have become established in south Florida: Nine-banded armadillo (Dasypus novemcinctus Linnae-us), red-bellied squirrel, (Sciurus aureogaster) black rat (Rattus rattus), coyote (Canis latrans), red fox (Vulpes vulpes), and jaguarundi (Herpailurus yaguarondi). In ad-dition, along the fringes of the Everglades, the feral dogs (Canis familiaris) and cats (Felis domesticus) are some-what common.
Exotic fi shes, of which there are 32 established spe-cies and 43 additional observed species in the State of Florida (found at http://myfwc.com/Fishing/Fishes/Exotic%20List.html on Mar. 7, 2005; P. Shafl and), in-clude the walking catfi sh (Clarias batrachus), blue and spotted tilapia (Oreochromis aurea and Tilapia mariae), oscar (Astronotus ocellatus), and Mayan cichlid (Cichla-soma urophthalmus). These species pose a threat to na-tive fi sh populations through predation and competition for nesting sites (McCann et al., 1996). Similarly, the in-troduced house fi nch (Carpodacus mexicanus), house sparrow (Passer domesticus), European starling (Sturnus vulgaris), monk parakeet (Myiopsitta monachus), iguana (Iguana iguana), Cuban tree frog (Osteopilus septentri-onalis) and wild hog (Sus scrofa) are causing both physi-cal damage and community shifts in the native ecosys-tems. Other organisms whose impact is less well documented include Burmese pythons (Python molurus bivittatus), vervet monkeys (Cercopithecus aethiops), and boa constrictors (Constrictor constrictor).
A systems approach to calculating biodiversityRichness and diversity. Assessments of biodiversity at the ecosystem scale typically rely on counts of species in different classes (e.g., avian richness or herbivore rich-ness). Our introduction to the diversity of the Everglades illustrates the critical need for conservation, but raises several conceptual and practical problems related to de-scribing and comparing ecosystems and setting conserva-tion priorities. First, biodiversity databases assembled from a variety of sources can be misleading when differ-ent areas have been sampled with different sampling in-tensities, which leads to inherent collection bias, or ob-servations reported with different confi dence (Peet, 1974; Fagan and Kareiva, 1997). Further, while some correla-tion can be found between plant species richness and animal species richness, areas rich in plant species diver-sity do not always coincide with richness at other trophic levels (Mares, 1992). Consequently, biodiversity hotspots identifi ed based on richness at one trophic level alone may miss areas of major conservation importance (Mares, 1992; Harcourt, 2000; Kareiva and Marvier, 2003). Finally, when designing conservation strategies using diversity as the indicator of ecosystem service, there is ambiguity in the defi nition of diversity (e.g., cla-distics, species, genetic), which can lead to confounded conservation priorities (Angermeier and Karr, 2004).
In addition, the effort to equate the number of differ-ent actors in an ecosystem with the functional value of that ecosystem is a perilous one: empirical studies have uncovered limited evidence to support this hypothesis (although see Tilman and Downing, 1994), and modeling studies suggest that ecosystem function can be main-tained with only a fraction of the species varieties (Grime, 1997; Schwartz et al., 2000). Smith et al. (1993) suggest that conservation programs designed according to spe-cies richness, and not evolutionary processes, will fail to protect the most critical habitat with respect to genetic information. Further, and possible most important, sim-ple counts of organism variety in a region fundamentally fail to capture the networks of ecological interactions and feedbacks that produce ecosystem properties (e.g., pro-ductivity, stability) (Ulanowicz, 2001; Worm and Duffy, 2003), which are frequently cited as one motivation for biodiversity conservation. Angermeier and Karr (1994) discuss problems with associating ecological diversity
Table 10. Most Dominant Invasive Plants (Thayer et al., 2000).
Scientifi c Name Common Name
Melaleuca quinquenervia Melaleuca treeLygodium microphyllum Old World climbing fernSchinus terebinthifolius Brazilian pepperCasuarina equisetifolia Australian pineColubrina asiatica Latherleaf, Asian snakerootEichhornia crassipes Water hyacinth

Aquat. Sci. Vol. 68, 2006 Overview Article 267
with ecological integrity, arguing that the latter is the goal for which the former is a poor indicator.
To address the information limitations of species richness as an ecosystem indicator, ecologists frequently turn to diversity indices, derived originally from informa-tion theory. Such indices, well known in the ecological literature, are adaptations of information theory used to describe the organization of ecosystems which began with MacArthur (1955), who used the Shannon diversity formulation (Eq. 1) to compare fl ows within an ecosys-tem. The use of physical stocks (biomass, abundance, cover, frequency) of system actors as a metric of ecosys-tem condition began with Margalef (1961), and is now a standard component of ecological theory and practice (Peet, 1974; Krebs, 2000). The typical formulation is:
H = – j
Σi = 1
pi *log[pi] (1)
where H is the diversity, pi is the probability of observing component i in a system of j components. Observation probabilities (pi) are typically measures of relative physi-cal stocks for each ecosystem component. Ulanowicz (2001) suggests that the application of information theory to ecosystems using Eq. 1 with physical stocks has met with mixed success; no consistent association between Shannon diversity and ecosystem function or stability has been demonstrated. As a result, some ecologists have tended to disregard the tools of information theory for the description of ecosystems (Ulanowicz, 2001).
There are two limitations of conventional application of the Shannon diversity index that lead to its failure to effectively predict ecological properties (condition, sta-bility, resilience, productivity). The fi rst is that the origi-nal conceptualization of Shannon diversity was directed at the determinacy of fl ows within a system (MacArthur, 1955), theorizing that the fl ows of energy and materials between components was indicative of information trans-fer between components. Yet, subsequent applications of Shannon diversity replaced fl ows with physical stocks. The reasons and drawbacks for this convenient but unfor-tunate tangent are discussed in detail in Ulanowicz (2001).
A second limitation of the standard Shannon diversity metric is that it ignores ecosystem food web hierarchy. Given a fi xed number of ecosystem components, the Shannon equation (Eq. 1) is maximized (Hmax) when the probability of observing each component (pi) is equal; that is, evenness in physical stocks increases diversity. However, given typical trophic transfer effi ciencies (i.e., Lindeman effi ciencies), and even differences in effi cien-cy between organisms within the same trophic level, this benchmark of maximum ecosystem condition at maxi-mum evenness in ecosystem physical stocks is erroneous. The result is that Shannon diversity using physical stocks is appropriate only within a single trophic level and can-
not be used at the ecosystem scale or even within groups (e.g., avifauna) populating multiple trophic levels. While we advocate the replacement of stocks with fl ows as per Macarthur’s (1955) original intent, a similar argument for computing diversity using physical fl ows (energy, carbon) can be made. That is, evenness of physical fl ows is not the expected condition for an entire food web be-cause the energy/carbon throughput decreases geometri-cally with increasing trophic level.
To address these two limitations, we propose that a diversity index is necessary that: 1) accounts for the ex-pected hierarchical distribution in the magnitudes of physical stocks across trophic levels and 2) accommo-dates the observed hierarchical distribution of fl ows in ecosystem food web networks. In the following sections we use energy systems theory (Odum, 1994) to develop modifi cations of the Shannon diversity index that incor-porate “quality adjusted fl ows” (defi ned below) to com-pute an ecosystem scale diversity index for the Everg-lades.
An ecosystem application – the Florida Everglades. The Florida Everglades has been the focus of detailed eco-logical enumeration for many years, and data compiled for the Across Trophic Level Systems Simulation (ATLSS – DeAngelis et al., 1998) and matrix synthesis provided by Ulanowicz et al. (2000 and 1997; http://cbl.umces.edu/%7eatlss/ATLSS.html) represent perhaps the most disaggregated and complete ecological network data available. Using carbon as the network numeraire, bilateral interactions between system components (i.e., species, groups of species or abiotic compartments) have been described using published data and fi eld measure-ments organized into material fl ow input/output matrices. Bilateral interactions are defi ned as the allocation of available energy between biotic and abiotic compart-ments; cybernetic feedbacks are excluded from this defi -nition, a point we return to later. While fl ow matrices have been compiled for four ecosystem types in the Ever-glades, graminoid marsh, cypress swamp, mangrove swamp, and Florida Bay, we focus on the graminoid marsh in this study, employing the data presented in Hey-mans et al. (2002) and Ulanowicz et al. (2000), and inte-grating emergy theory (Odum, 1996) with fl ow matrices to develop an ecosystem-scale measure of biodiversity.
Emergy synthesis and ecosystem networks. Network analysis, where a standard physical quantity (e.g., car-bon, available energy) is used to describe bilateral inter-actions, implicitly assumes that the energy in all those interactions is directly comparable. Emergy theory (Odum, 1994; Odum, 1996) suggests that this assump-tion is an ecological oversimplifi cation; different forms of energy have different qualities that refl ect their differ-ential abilities to perform work within an ecosystem. For

268 M. T. Brown et al. Ecosystem biodiversity in the Florida Everglades
example, insolation and carnivore metabolism may be reported in similar units (Joules per time), but have dra-matically different properties and potentials within an ecosystem. Odum (1996) concludes that energy alone is an insuffi cient numeraire for describing the fl ows in self-organizing complex systems.
Emergy, formally defi ned as the energy of one form (usually solar energy) required through all processes and transformations to make a product or fl ow, provides a numeric framework for comparison of species contribu-tions to ecosystem organization in directly comparable units (solar emjoules, or sej). Emergy is often referred to as energy memory, refl ecting that this system synthesis approach is effectively a form of accounting that traces energy fl ow and dissipation back through all necessary transformations to scale all fl ows relative to a common energy benchmark (solar equivalent energy). Emergy synthesis allows comparison of energy fl ows of different form; Odum (1996) argues that different forms of energy have different qualities that arise from the energy re-quired to make them. In a self-organizing adaptive sys-tem, he argues, forms of energy that require larger invest-ment per unit available energy (i.e., exergy) must provide commensurate higher quality cybernetic work in the form of feedback control. Transformity is an index of quality and quantifi es the emergy invested per unit avail-able energy produced (i.e., emergy per exergy, sej/J) for each fl ow in a system of interest. Direct comparison of energy fl ows, both within and across the system bounda-ry, is misleading until physical fl ows have been adjusted by their transformity values that refl ect the work neces-sary for their production.
In the context of evaluating ecosystem biodiversity, the emergy framework suggests that evaluating species importance based on biomass or available energy throughput alone, without adjusting for transformity, will tend to dramatically underestimate the system-scale con-trol potential of energy fl ows in upper trophic levels, where only a small fraction of total system physical throughput is incorporated. That is, the importance of up-per trophic levels with respect to carbon or energy throughput is small compared with their actual role in ecosystem function, which includes cybernetic control (e.g., control of population at lower trophic levels, seed dispersal, commensal relationships, ecosystem structural attributes). For example, Terborgh et al. (2001) show dramatic changes in vegetative community composition in the absence of predators, suggesting top-down ecosys-tem control. Pandolfi et al. (2003) similarly illustrate the infl uence of removing upper trophic level consumers in coral reef degradation. Odum (1996) argues that methods for energy fl ow analysis should incorporate the relative energetic contributions (i.e., importance value) of each component by adjusting for transformity (quality) to avoid misrepresenting their infl uence.
Biodiversity index at the ecosystem scale. The Shannon diversity index (Eq. 1) disaggregates diversity into two components: 1) richness or variety and 2) evenness or dominance. That is, more taxa variety or more evenness among the taxa present will increase H (the index quan-tity); the maximum value of H (Hmax) is observed when observation probabilities (pi) are equal across all taxa. When pi are defi ned based on physical stocks, the im-plicit assumption is that a basis for ecosystem condition can be inferred from the deviation a system displays from maximum evenness of all compartments. Since the intent of pi for ecosystem evaluation is to capture the impor-tance of each component within the ecosystem (not within a single trophic level), physical stocks are a poor surrogate for the functional role any actor plays. In par-ticular, the expectation of evenness in physical stocks or fl ows is inappropriate when comparing across trophic levels; the sequential reduction in energy (or biomass, cover, abundance) through repeated transformations (Fig. 4) serve to make higher trophic level importance values increasingly small relative to lower trophic levels. The association between richness (component 1) and trophic level is complex (e.g., typically, richness of in-sects > plants > mammals; this does not hold for the Ev-erglades graminoid marshes that are strongly monotypic in their plant community), but the effect of trophic dy-namics on dominance (component 2), when measured using either physical stocks or fl ows, is dramatic.
To compensate for this problem, we depart from the standard Shannon diversity implementation in two ways. First, by applying the index to network fl ows rather than standing stocks, we follow the original intent of the infor-mation theoretic approach in ecology (MacArthur, 1955). Since only fl ows can actually transmit information within an ecosystem setting, their determinacy is of considerably more ecological interest than the distributions of biomass compartments (Ulanowicz, 2001). A second departure, following Odum (1996), is that the Shannon diversity should be computed based on fl ows that have been scaled by appropriate scaling values (transformities) to adjust for the expected decline in physical stock dominance with sequential energy transformation (Fig. 4).
A transformity-adjusted index of compartment im-portance offers informative characteristics with respect to the balance of emergy fl ows throughout a system only when provided in contrast to some theoretical bench-mark. The Shannon diversity computation in ecology is benchmarked against the maximum possible value given the number of species observed, a condition obtained when compartments are equally important. When evalu-ated with respect to the emergy throughput for each com-ponent, this corresponds with the condition postulated to exist in adaptive systems that maximize power during ecological succession (Odum, 1996). The maximum power principle (Odum and Pinkerton, 1955; Odum,

Aquat. Sci. Vol. 68, 2006 Overview Article 269
1994; and restated as the maximum empower principle in Odum, 1996) postulates that network systems will de-velop component interconnections that make maximum use of available energy gradients, adjusted to refl ect their energy quality. In adaptive systems, this means that higher energy quality translates into increased feedback control potential because systems maximizing emergy throughput will select those components whose service to whole-system function are commensurate with what was required to make them, while selective pressure will tend to remove those components that fail to provide such service. The expected result is that adaptive systems will exhibit approximately equal emergy fl ows on all pathways. The standard Shannon diversity benchmark (Hmax) becomes more meaningful as a basis for evaluat-ing system condition (with degradation indicated by de-viation from the maximum) when applied across trophic levels in light of this expected emergy fl ow equality.
On a component-wise basis, this also allows compari-son between observed emergy fl ows and those expected at the theoretical optima. Those compartments that are more or less important than expected given the bench-mark of emergy fl ow evenness can be identifi ed, and systematic trends in importance can be examined. We view deviation from emergy fl ow expectation to be a measure of conservation value; that is, species processing less emergy than expected are those which may warrant conservation attention, and, further, that the magnitude of the deviation prioritizes that attention. While it is clear that, even in healthy ecosystems, some organisms will be more and other less abundant than expected, we hypoth-esize that healthy ecosystems will show no systematic trend of deviation from expectation with trophic level.
Our specifi c objectives in this paper are to compute transformity values from complex network data in order to assign component importance adjusted for energy
quality, develop an index of biodiversity at the system-scale that accounts for energy quality, and develop an index that allows inference of each components deviation from expected ecosystem importance.
Materials and methods
Network dataNetwork data, consisting of carbon fl ows (g C/yr) were compiled from published data for both wet and dry sea-son conditions for the Everglades graminoid marsh sys-tem (details for accounting, aggregation and assumptions in Ulanowicz et al., 1997; Ulanowicz et. al, 2000). There were 66 ecosystem compartments in the graminoid marsh. Not all of these compartments are living; ecosys-tem pools include labile and refractory detritus. Further, the primary production pools were partitioned into root, and leaf compartments. Many of the lower trophic level compartments represent aggregations of species (due to lack of data); for example, mesoinvertebrates, macroin-vertebrates, centrarchid fi sh, snakes and passerine birds are lumped categories for the marsh system.
The original data were presented in a “To… From” matrix of carbon exchanges from one component (i.e., species or group of species where aggregations were nec-essary) of the network to another, where each cell in the matrix represents a material transfer. An energy systems depiction (Fig. 5a) of a generic energy/material network containing biotic and abiotic components includes organ-isms feeding at multiple trophic levels and on both pho-tosynthetic and detrital food chains. Cybernetic feed-backs are not included in the matrix data, and are omitted from this fi gure. For each component in Fig. 5a, fi ve fl ows describe bilateral interactions (e.g., consumption, gross production, net production/transfer, respiration and
Figure 4. Energy, emergy and transformity in a typical food chain. The maximum empower principle predicts that feedback controls from a component (inferred from transformity) are commensurate with the emergy invested in supporting that component. If emergy fl ows on each pathway are equal, quality-adjusted diversity is maximized.
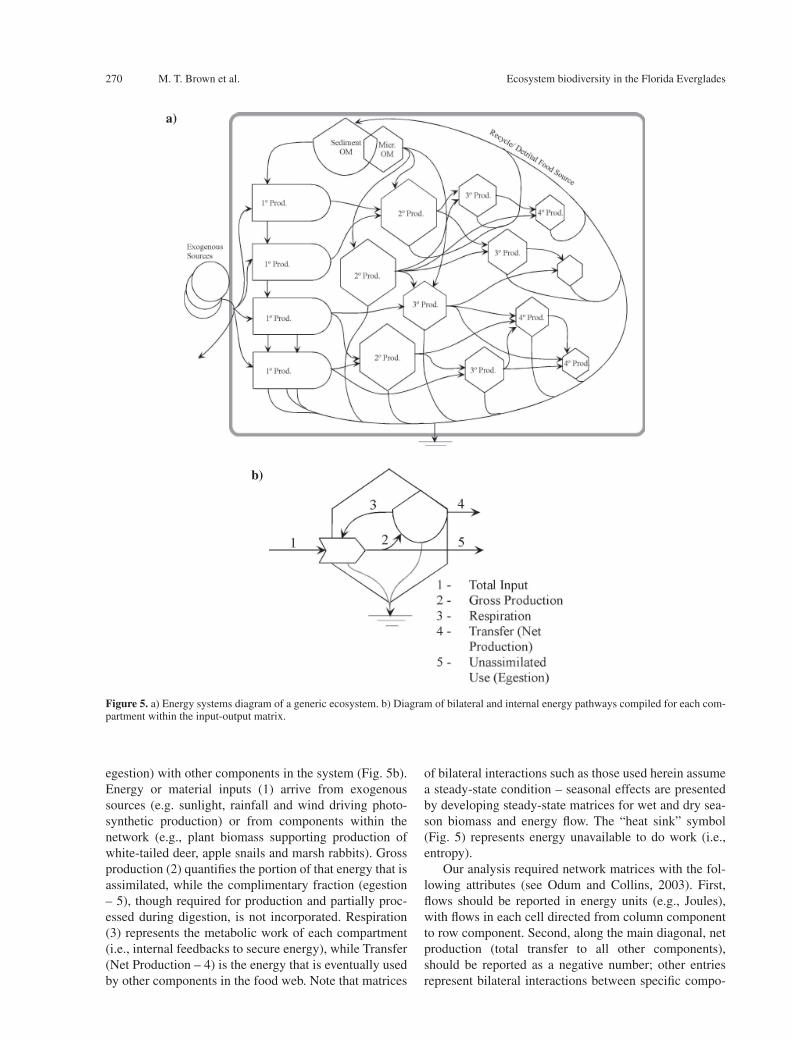
270 M. T. Brown et al. Ecosystem biodiversity in the Florida Everglades
egestion) with other components in the system (Fig. 5b). Energy or material inputs (1) arrive from exogenous sources (e.g. sunlight, rainfall and wind driving photo-synthetic production) or from components within the network (e.g., plant biomass supporting production of white-tailed deer, apple snails and marsh rabbits). Gross production (2) quantifi es the portion of that energy that is assimilated, while the complimentary fraction (egestion – 5), though required for production and partially proc-essed during digestion, is not incorporated. Respiration (3) represents the metabolic work of each compartment (i.e., internal feedbacks to secure energy), while Transfer (Net Production – 4) is the energy that is eventually used by other components in the food web. Note that matrices
of bilateral interactions such as those used herein assume a steady-state condition – seasonal effects are presented by developing steady-state matrices for wet and dry sea-son biomass and energy fl ow. The “heat sink” symbol (Fig. 5) represents energy unavailable to do work (i.e., entropy).
Our analysis required network matrices with the fol-lowing attributes (see Odum and Collins, 2003). First, fl ows should be reported in energy units (e.g., Joules), with fl ows in each cell directed from column component to row component. Second, along the main diagonal, net production (total transfer to all other components), should be reported as a negative number; other entries represent bilateral interactions between specifi c compo-
Figure 5. a) Energy systems diagram of a generic ecosystem. b) Diagram of bilateral and internal energy pathways compiled for each com-partment within the input-output matrix.
a)
b)

Aquat. Sci. Vol. 68, 2006 Overview Article 271
nents. The original material fl ow matrices (Ulanowicz et al., 2000; Ulanowicz et al., 1997) were processed to achieve these requirements as follows: 1) Flows, initially reported in g C/m2/yr were con-
verted to J/m2/yr assuming an energy content of 18.8 J/g C (organic).
2) The matrices were transposed (inputs, or energy fl ows, to each component along rows, allocation of net production, or transfer, from each compo-nent along columns)
3) Component steady state net production values (Flow 4 in Fig. 5b) were assigned to the main di-agonal as negative numbers. This precluded any component (e.g. alligators) securing any portion of its diet from other individuals of the same com-ponent.
4) Emergy fl ows were added as inputs. Exogenous emergy fl ows were split between primary produc-ers based on steady-state standing stocks (g/m2) of photosynthetically active material (i.e. leaves, but not wood and roots). These emergy inputs were inferred from Brown and Bardi (2001), and were 5.2 × 10¹¹ and 1.3 × 10¹¹ sej/m2/yr for the wet and dry seasons for the graminoid marsh.
5) Flows of egested material were introduced in the matrix (they were omitted from the original matri-ces because that carbon was unassimilated; it is, however, a necessary component of each compart-ment’s production). To do this, each bilateral fl ow was multiplied by 2.5; it was assumed that an organism’s assimilation effi ciency (gross production/total input) was constant across its sources of food. The sensitivity of the method to this assumption was not tested within the scope of this work.
Transformity calculationsTo compute transformities from these network fl ow data, we used a linear optimization technique that ma-nipulates a set of unknowns (transformity values) to meet a set of constraints (emergy infl ow = emergy out-fl ow). This particular set of constraints makes the tacit assumption that there are no co-production modules in the ecosystem; the method can be extended to allow co-production, but this was unnecessary for the current data set.
An example optimization table is given in Figure 6. Each row in Figure 6 represents a system component. The constraints to the right of each row follow from the equality of emergy infl ow and emergy outfl ow. Specifi -cally, the energy inputs multiplied by appropriate trans-formity values (unknowns in this case) equal the net production or transfer of energy multiplied by its trans-formity:
Emergy Infl owj = Σi Xij *ri = Σ
i Xji *rj = Emergy Outfl owj (2)
where Xij is the energy transfer from component i to com-ponent j, and τi is the transformity value of respective fl ows.
To avoid artifi cial overestimation of the transformity of fecal/senescent biomass contributions to detritus from high-quality components, we applied the following rules: 1) The transformity (sej/J) of a compartment is the
emergy (sej) from incoming fl ows driving biotic production (Flow 1, Fig. 5b) divided by the energy (J) remaining for trophic transfer (Flow 4 in Fig. 5b).
2) Where fl ows converge to abiotic components (e.g. detrital pools), the transformity of the incoming fl ow is adjusted to the level of the detrital pool storage.
A simple linear optimization method (Bardi et al., 2005) was applied to the processed matrix to estimate unknown transformities (sej/J) for each component. Hillier and Lieberman (1990) discuss the potential for “guess-and-check” methods to locate non-global solu-tions; because input/output matrices used herein are square (# rows = # columns) and no linearity assumptions are violated, this was considered impossible. The identi-fi cation of feasible solutions for the large number of constraints for all analyses required slight relaxation of the default precision for the Microsoft Excel Solver (Bardi et al., 2005).
We compared transformity values across season (wet and dry) and examined the stability of computed trans-formities by statistically comparing an estimated regres-sion slope to unity using standard inferential tech-niques.
System-level diversity indexQuality-adjusted Shannon diversity is computed using Eq. 1 in the typical manner in ecology, except relative importance value (pi
in Eq. 1) is defi ned as the proportion of total system emergy fl ow (sej/yr) allocated to each component. We refer to relative value calculated in this manner as the Emergy Importance Value (EIV) and com-pute it as follows:
NPi *riEIVi = (3) Σj NPj *rj
where NPj is the net production (J/yr) and τj (sej/J) is the computed transformity of component i. In this formula-tion, importance value is the relative contribution of each component to the total emergy fl ow through all biotic components (i.e., denominator of Eq. 3), computed by summing net production times derived transformity over all components.

272 M. T. Brown et al. Ecosystem biodiversity in the Florida Everglades
It follows that an ecosystem Shannon diversity index (following Eq. 1) is:
Biodiversity = – j
Σi = 1
EIVi *log[EIVi] (4)
The maximum possible value for this index occurs when the emergy on each pathway, and therefore each compo-nent’s EIV, is equal.
A deviation from Hmax for the conventional applica-tion of the Shannon index indicates some degree of dominance structure in the community. When physical fl ows are adjusted for quality, fl ow evenness across all ecosystem components is expected; indeed, it is the pos-tulated goal condition for network systems that are maxi-mizing power (Odum, 1994). Across all components in a healthy ecosystem, therefore, we expect to see no asso-ciation between emergy throughput and trophic level. We therefore use the fractional diversity index (observed di-versity: maximum diversity) as a measure of an ecosys-tems condition. It is also informative to see which par-ticular components deviate from the expected importance. To measure this deviation from expectation, we compute a ratio between expected and observed emergy through-put (EOET) for each component:
TET / NEOETi = (5) NPi *ri
where TET is total emergy throughput in the entire sys-tem, N is the number of biotic compartments and NP and τ are as in Eq. 3. The resulting values are natural log transformed to linearize the response; consequently, val-ues larger than 0 indicate a component less important than the expected value of 1 (i.e., equal emergy fl ows on all network pathways). EOET values were compared qualitatively with normative judgments of species im-portance (e.g., conservation value), and systematic vari-ability in EOET values (e.g., association with transform-ity or trophic level) was examined using regression analysis.
Results
Transformity values for the graminoid a system are given in Table 11. These values represent an average between wet and dry seasons. While there was a strong correlation between seasons (r = 0.81) (Fig. 7), higher transformities were observed in the wet season coincident with greatly increased emergy input without commensurate response in biomass production (5.2 × 10¹¹ and 1.3 × 10¹¹ sej/m2/yr for wet and dry, respectively; contrasted with primary production of 6.27 × 10³ g C/m2/yr in the wet season vs. 3.47 × 10³ g C/m2/yr in the dry season).
Table 12 summarizes quality-adjusted diversity, the theoretical maximum diversity and the relative diversity as a percent of maximum for the graminoid marsh. We observe that the marsh ecosystem is operating at 42 % of its maximum potential diversity.
Figure 8 shows that as component transformities in-crease, the Expected-to-Observed Emergy Throughput of a component becomes increasingly small relative to the expected value, thus yielding a higher EOET ratio; the
Transformities Tr1 Tr2 … Trn To From Solar Emergy Comp. 1 Comp. 2 … Comp. n Constraints Comp. 1 - P1 Comp1 (Flowsi*Tri) = 0 Comp. 2 C1 -to- C2 - P2 Cn -to- C2 Comp2 (Flowsi*Tri) = 0
… … … Comp. n C1 -to- Cn C2 -to- Cn - Pn Comp3 (Flowsi*Tri) = 0 Pi values are total component production minus respiration Ci -to- Cj values are energy transfers from comp. i to comp. j Objective Contraints = 0
Figure 6. Schematic of input/output matrix form. Transformity values (top row) represent unknowns in the simultaneous equations defi ned by the constraints. For fully specifi ed systems (i.e. # equations = # unknown transformities) the objective function is redundant.
Figure 7. Seasonal association of computed component transform-ity values. Transformity values are consistently higher in the wet season (Pr [slope = 1.0] < 0.001), during which emergy infl ows are substantially increased.

Aquat. Sci. Vol. 68, 2006 Overview Article 273
association is strongly statistically signifi cant (p<0.001). Those organisms that exhibit lower than expected emergy throughput coincide substantially with normative judg-ments of rarity and high conservation value (Bobcats, Florida panthers, Kites and Hawks, Minks, Black Bears all have high EOET values; conversely, Vultures, Detri-tus, Invertebrates, Ibis and Periphyton are more impor-tant than expected with low EOET values).
Discussion
Biodiversity assessments at the ecosystem scale have traditionally taken the form of species catalogs, sorted by different classes, but without addressing important troph-ic interactions that actually stimulate the emergence of ecosystem properties. This study presents a new way to calculate across trophic level ecosystem diversity that takes into account trophic interactions and derives energy quality adjusted importance values of each species or component. In so doing, we hope to bridge the gap be-tween biological diversity assessments and the ultimate objective of assessing ecological function (Angermeier and Karr, 1994).
The method described cannot be applied in a large number of cases; in fact, the required level of compart-ment specifi city and fl ow detail is somewhat unprece-dented in ecosystem studies. However, the original effort to link information theory (MacArthur, 1955) with eco-system phenomenology requires this level of detail. Our approach follows that original effort by both making use of fl ows, not stocks, and extends it by recognizing the need to adjust fl ows by their energy quality to better re-fl ect their cybernetic role in ecosystem function.
Transformity offers a useful indicator of this cyber-netic role within an ecosystem. However, the accuracy of our computation is dependent on the validity of the source data. One area that poses potential theoretical problems is the dramatically different transformities ob-served within a given system between seasons. Specifi -
Table 11. Computed transformity values for graminoid marsh matrix in rank order by transformity.
Ecosystem Component Transformity (sej/J) Ecosystem Component Transformity (sej/J)
Periphyton 3.56E+03 Small frogs 1.07E+05Labile Detritus 6.43E+03 Muskrats 1.08E+05Flagfi sh 1.24E+04 Medium frogs 1.09E+05Floating Vegetation 1.25E+04 White Tailed Deer 1.10E+05Utricularia spp. 1.51E+04 Salamander larvae 1.11E+05Living Sediments 1.59E+04 Catfi sh 1.18E+05Other Macroinvertabrates 1.91E+04 Gruiformes 1.28E+05Apple snail 1.97E+04 Large frogs 1.30E+05Mesoinverts 2.02E+04 Alligators 1.34E+05Macrophytes 2.08E+04 Spotted sunfi sh 1.36E+05Poecilids 2.23E+04 Cichlids 1.36E+05Lizards 2.67E+04 Warmouth 1.38E+05Tadpoles 2.91E+04 Rabbits 1.41E+05Crayfi sh 3.04E+04 Other Large Fishes 1.45E+05Freshwater Prawn 3.87E+04 Turtles 1.51E+05Bluefi n killifi sh 4.14E+04 Largemouth Bass 1.52E+05Chubsuckers 4.26E+04 Snailkites 1.62E+05Mosquitofi shes 4.35E+04 Raccoons 1.63E+05Other Small Fishes 4.37E+04 Grebes 1.76E+05Shiners & Minnows 5.35E+04 Salamanders 1.79E+05Killifi shes 5.68E+04 Cape Sable Seaside Sparrow 1.85E+05Large Aquatic Insects 6.37E+04 Fishing spider 1.99E+05Terrestrial Inverts 6.74E+04 Passerines 2.13E+05Topminnows 7.51E+04 Gar 2.17E+05Bluespotted Sunfi sh 8.38E+04 Rats&Mice 2.28E+05Pigmy Sunfi sh 8.42E+04 Bitterns 2.40E+05Opossum 8.63E+04 Otter 4.00E+05Dollar Sunfi sh 8.71E+04 Mink 4.38E+05Redear Sunfi sh 8.83E+04 Nighthawks 5.39E+05Snakes 9.62E+04 Panthers 1.35E+06Ducks 1.01E+05 Bobcat 3.30E+06Other Centrarchids 1.03E+05
Table 12. System scale indices of biodiversity for the Everglades graminoid marsh. Indices are computed in this study; exogenous emergy inputs are from Brown and Bardi (2001).
Quality Adjusted Diversity (bits) 1.73Theoretical Maximum Diversity (bits) 4.14Relative Diversity (%) 42 %Exogenous Emergy Inputs (sej/ha/yr) 5.2E11 (wet), 1.3E11 (dry)

274 M. T. Brown et al. Ecosystem biodiversity in the Florida Everglades
cally, the nearly order of magnitude difference between wet and dry season transformities – with dry seasons ex-hibiting signifi cantly lower transformity values – indi-cates dramatic differences in resource consumption rates and process effi ciencies that may be artifacts of the data used. While there is considerable uncertainty in the spe-cifi c values computed for each component, we note that the transformity values obtained are in strong agreement with similar calculations made using other techniques (Odum, 1996).
While network analyses (Ulanowicz, 1986; Dame and Patten, 1981) and emergy refi nements proposed herein offer little insight into the particular cybernetic controls provided by each species in the system, trans-formity has been proposed as an informative measure of the expected importance of each component (Odum, 1996). Ulanowicz (1980), in developing the ecosystem concept of ascendency, recognized the need to scale fl ow diversity at the system scale by total system throughput to adequately compare between systems. We propose that system-scale fl ow diversity further requires adjustment for energy quality (transformity) before meaningful cross-trophic comparisons of importance and between-system comparisons of development or stress can be achieved. As such, we propose an emergy-based ascend-ency framework as an avenue of further research (see Christensen, 1994, for a preliminary effort).
Deviance from the Shannon index maximum, as ap-plied herein, may be a useful indicator of system condi-tion. This may be true at the ecosystem scale and at the scale of particular ecosystem component. Our effort to
identify specifi c organisms that exhibit deviation from expected importance (EOET, measured as a fraction of expected productivity adjusted for quality) showed in-creases in EOET with transformity. This observation suggests that the ecosystem is systematically depauper-ate in the upper trophic levels, a conclusion consistent with the documented losses in wading bird populations, alligators and top carnivores. Notably, those species with high normative value in society (i.e., those for which wildlife management plans and on which considerable public scrutiny are focused) are generally those with high EOET values, indicating their rarity relative to expected emergy fl ow contributions. For purposes of evaluating ecosystem condition, we would expect that during recov-ery the trend of EOET with transformity would tend to-wards no association (r2 ~ 0). However, were the ecosys-tem to continue to degrade, we would expect an increasingly signifi cant positive association between EOET and transformity as lower quality ecosystem com-ponents are selected for, and ecosystem hierarchy and organization diminish.
While we would not postulate that all components of an ecosystem would be present in equal importance (and therefore there might be signifi cant variability in EOET even in healthy ecosystems), we do expect that intact ecosystems would demonstrate approximately equal emergy at all trophic levels, and consequently no sys-tematic association between EOET and transformity. If this were not the case, net production at one trophic level would be failing to generate production at the next trophic level.
Figure 8. Expected-to-Observed Emergy Throughput (EOET) vs. Transformity for the graminoid marsh.

Aquat. Sci. Vol. 68, 2006 Overview Article 275
The overlap between an emergy based approach to ecosystem evaluation and network analysis/ascendency is fertile ground for ongoing research. It is critical that the fi ndings of this paper be extended in two ways. First, coupling emergy and ascendency should be viewed as a priority as a result of the implicit assumption in ascend-ency analysis (and other ecological fl ow analyses – e.g. Dame and Patten, 1981) that energy fl ows on all bilateral pathways are directly comparable (i.e., equal quality), a conclusion at odds with energy systems theory. This can be achieved using simple systems that have already been carefully examined as part of previous research efforts (see Ulanowicz, 1997; Odum and Collins, 2003; Bardi et al., 2005 for widely cited examples).
Second, we believe this technique should be extended to numerous systems with varying levels of disturbance and successional state, and in so doing, additional met-rics of system development and status should be quantifi -able. Wetlands differ in their capacity to support higher trophic level organisms (e.g., the Okavanago has a much higher grazer and predator biomass than the Everglades) and it is currently unknown how the EOET responds in other ecosystems, nor how effective the cross-trophic level diversity indices are at capturing whole system con-dition. The data required to develop these indices are not widely collected; in particular, acquiring the necessary level of compartment specifi city and fl ow detail is re-source intensive. However, as part of a global effort to understand and quantify the condition of large wetland ecosystems like those described in this volume, the nec-essary data are identifi able and methods for their estima-tion could be easily standardized.
Summary
A brief overview of the rich biota of the Greater Everg-lades system was given across groups (plants, mammals, insects, fi sh, birds). While these are considered vital for conservation prioritization, we argue that such catalogs are of limited value for assessing ecological systems. An alternative approach is the application of information theoretic indices, an endeavor with a long history in ecol-ogy. We present two critical limitations of the conven-tional application of the Shannon diversity equation, and offer energy-quality adjustment of ecosystem fl ows as a theoretical advance that allows application of this index at the ecosystem scale. This revised index has the addi-tional value of making the index benchmark of maximum evenness more realistic within an ecosystem context. When applied to individual ecosystem components (EOET), the index can be contrasted with the condition of maximum fl ow evenness to yield a measure of conser-vation value for each ecosystem component. We observed that deviation from expected importance corresponded
well with normative judgments of conservation value. We observed a signifi cant positive association between trans-formity and EOET for the graminoid system and sug-gested that this relates to ecosystem-degradation.
References
Alsop, F. J. III, 2001. Birds of North America: Eastern region, Dor-ling Kindersley Limited in association with the Smithsonian Institution, New York, New York, 751 pp.
Angermeier, P. L. and J. R. Karr, 1994. Biological integrity versus biological diversity as policy directives: Protecting biotic re-sources. Bioscience 44: 690–697.
Avery, G. N. and L. L. Loope, 1980. Endemic taxa in the fl ora of South Florida, Technical Report T-558, U.S. National Park Service, South Florida Research Center, Everglades National Park, Homestead, Florida, 39 pp.
Avery, G. N. and L. L. Loope, 1983. Plants of the Everglades Na-tional Park: A preliminary checklist of vascular plants, 2nd ed., Technical Report T-574, U.S. National Park Service, South Florida Research Center, Everglades National Park, Homestead, Florida, 41 pp.
Bardi, E., M. J. Cohen and M. T. Brown, 2005. A linear optimization method for computing transformities from ecosystem energy webs. In: M. T. Brown, E. Bardi, D. Campbell, V. Comar, S. Huang, T. Rydberg et al. (eds.), Emergy Synthesis 3: Proceed-ings of the 3rd Biennial Emergy Research Conference, Center for Environmental Policy, University of Florida, Gainesville, Florida, pp. 63–74.
Berner, L. and M. L. Pescador, 1988. The mayfl ies of Florida, Uni-versity Presses of Florida, Gainesville, Florida, 415 pp.
Brown, L. N., 1997. Mammals of Florida, Windward Publishing, Miami, Florida, 224 pp.
Brown, M. T. and E. Bardi, 2001. Emergy of Ecosystems, Folio #3 in Handbook of Emergy Evaluation, Center for Environmental Policy, Gainesville, Florida, 93 pp.
Brown, M. T. and R. A. Herendeen, 1996. Embodied energy analy-sis and emergy analysis: A comparative view. Ecological Eco-nomics 19: 219–235.
Christensen, V., 1994. Emergy-based ascendency. Ecological Mod-elling 72: 129–144.
Dame, R. F. and B. C. Patten, 1981. Analysis of energy fl ows in an intertidal oyster reef. Marine Ecology Progress Series 5: 115–124.
Davis, J. H. Jr., 1943. The natural features of Southern Florida, es-pecially vegetation and the everglades, Florida Geological Sur-vey Bulletin No. 25, Tallahassee, Florida, 311 pp.
Davis, S. M. and J. C. Ogden, 1997. Everglades: The ecosystem and its restoration, St. Lucie Press, Delray Beach, Florida, 826 pp.
DeAngelis, D., L. J. Gross, M. A. Huston, W. F. Wolff, D. M. Flem-ing, E. J. Comiskey et al., 1998. Landscape modeling for Ever-glades Ecosystem Restoration. Ecosystems 1: 64–75.
Douglas, M. S., 1947. The Everglades: River of grass, Mockingbird Books, Inc., Covington, Georgia, 406 pp.
Duever, M. J., J. F. Meeder, L. C. Meeder and J. M. McCollom, 1994. The climate of south Florida and its role in shaping the Everglades ecosystem. In: S. M. Davis and J. C. Ogden (eds.), Everglades: The ecosystem and its restoration, St. Lucie Press, Delray Beach, Florida, pp. 225–248.
ENP, (n.d.). Everglades National Park Strategic Plan 2001–2005. Everglades National Park. Retrieved January 30, 2005 from http://www.nps.gov/ever/current/report.htm
Fagan, W. F. and P. M. Kareiva, 1997. Using compiled species lists to make biodiversity comparisons among regions: A test case using Oregon butterfl ies. Biological Conservation 80: 249–259.

276 M. T. Brown et al. Ecosystem biodiversity in the Florida Everglades
Fernald, E. A. and E. D. Purdum, 1998. Water resources atlas of Florida, Institute of Science and Public Affairs, Florida State University, Tallahassee, Florida, 312 pp.
Ferguson, D. C., C. E. Harp, P. A. Opler, R. S. Peigler, M. Pogue, J. A. Powell et al., 1999. Moths of North America, Northern Prairie Wildlife Research Center Online, Jamestown, North Dakota, http://www.npwrc.usgs.gov/resource/distr/lepid/moths/mothsusa.htm (Version 12DEC2003).
Florida National Parks and Monuments Association, (n.d.). Check list of mammals of Everglades National Park, retrieved January 30, 2005, from http://www.nps.gov/ever/eco/mammals.htm.
Forys, E. A. and C. R. Allen, 2002. Functional group change within and across scales following invasions and extinctions in the Everglades ecosystem. Ecosystems 5: 339–347.
Gleason, P. J., 1974. Calcareous periphyton and water chemistry in the Everglades. In: P. J. Gleason (ed), Environments of South Florida: Past and present, Miami Geological Society, Miami, Florida, pp. 146–181.
Gleason, P. J. and P. Stone, 1994. Age, origin, and landscape evolu-tion of the Everglades peatland. In: S. M. Davis and J. C. Ogden (eds), Everglades: The Ecosystem and its restoration, St. Lucie Press, Boca Raton, Florida, pp. 149–197.
Grime, J. P., 1997. Biodiversity and ecosystem function: The debate deepens. Science 277: 1260–1261.
Gunderson, L. H., 1994. Vegetation of the Everglades: Determinants of community composition. In: S. M. Davis and J. C. Ogden (eds), Everglades: The Ecosystem and its restoration, St. Lucie Press, Boca Raton, Florida, pp. 323–340.
Gunderson, L. H. and W. F. Loftus, 1993. The Everglades. In: W. H. Martin, S. G. Boyce, and A. C. Echternacht (eds.), Biodiversity of the southeastern United States: Terrestrial communities, John Wiley & Sons, New York, New York, 502 pp.
Heymans, J. J., R. E. Ulanowicz and C. Bondavalli, 2002. Network analysis of the South Florida Everglades graminoid marshes and comparison with nearby cypress ecosystems. Ecological Modelling 149: 5–23.
Hillier, F. S and G. J. Lieberman, 1990. Introduction to operations research (5th Ed), McGraw Hill Publishing Company, New York, New York, 998 pp.
Hoback, W. W., and J. J. Riggins, 2001. Tiger beetles of the United States, Northern Prairie Wildlife Research Center Online, Jamestown, North Dakota, http://www.npwrc.usgs.gov/resource/distr/insects/tigb/tigbusa.htm (Version 12DEC2003)
ICE (Information Center for the Environment), 2004. Species in parks: Flora and fauna database, online query system, Univer-sity of California, Davis, retrieved February 9, 2005 from http://ice.ucdavis.edu/nps/sbypark.html.
Krebs, C. J., 2000. Ecological methodology, Addison Wesley Long-man, Inc., Menlo Park, California, 541 pp.
Kondratieff, B. C. (coordinator), 2000a. Dragonfl ies and damselfl ies (Odonata) of the United States, Northern Prairie Wildlife Re-search Center Online, Jamestown, North Dakota, http://www.npwrc.usgs.gov/resource/distr/insects/dfly/dflyusa.htm (Version 12DEC2003).
Kondratieff, B. C. (coordinator), 2000b. Mayfl ies of the United States, Northern Prairie Wildlife Research Center Online Jamestown, North Dakota, http://www.npwrc.usgs.gov/resource/distr/insects/mfl y/mfl yusa.htm (Version 12DEC2003).
Kushlan, J. A., 1975. Population changes of the apple snail (Pomacea paludosa) in the southern Everglades. Nautilus 89: 21–23.
Labisky R. F. and M. C. Boulay, 1998. Behaviors of bobcats preying on white-tailed deer in the Everglades. American Midland Nat-uralist 139: 275–281.
Lane, E. (ed.), 1994. Florida’s geological history and geological re-sources, Special Publication No. 35, Florida Geological Survey, Tallahassee, Florida, 66 pp.
Layne, J. N., 1978. Volume 1: Mammals. In: P. C. H. Prichard, (se-ries ed.), Rare and endangered biota of Florida, University Presses of Florida, Gainesville, Florida, 342 pp.
Lenczewski, B., 1980. Butterfl ies of Everglades National Park, Technical Report T-588, U.S. National Park Service, South Florida Research Center, Everglades National Park, Homestead, Florida, 110 pp.
Lodge, T., 1994. The Everglades handbook: Understanding the eco-system, St. Lucie Press, Boca Raton, Florida, 228 pp.
Long, R. W., 1974. Origin of the vascular fl ora of southern Florida. In: P. J. Gleason (ed.), Environments of south Florida: Past and present, Miami Geological Society, Miami, Florida, pp. 28–36.
Long, R. W. and O. Lakela, 1976. A fl ora of tropical Florida (2nd ed.), Banyan Books, Miami, Florida, 962 pp.
Loope, L. L. and Avery, G. B. 1979. A preliminary report on rare plant species in the fl ora of National Park Service areas of south Florida, South Florida Research Centre Report M-548. U.S. National Park Service, South Florida Research Center, Everg-lades National Park, Homestead, Florida, 42 pp.
Loope, L. L., D. W. Black, S. Black and G. N. Avery, 1979. Distribu-tion and abundance of fl ora in limestone rockland pine forests of southeastern Florida, Technical Report T-547, U.S. National Park Service, South Florida Research Center, Everglades Na-tional Park, Homestead, Florida, 38 pp.
MacArthur, R., 1955. Fluctuations of animal populations and a measure of community stability. Ecology 36: 533–536.
Mares, M. A., 1992. Neotropical mammals and the myth of Amazo-nian biodiversity. Science 255: 976–979.
Margalef, R., 1961. Communication of the structure of planktonic populations. Limnology and Oceanography 6: 124–128.
McCally, D., 1999. The Everglades: An environmental history, Uni-versity Press of Florida, Gainesville, Florida, 215 pp.
McCormick, P., S. Newman, S. Miao, R. Reddy, D. Gawlik, C. Fitz et al., 1998. Chapter 3: Ecological Needs of the Everglades. In: G. Redfi eld (ed), Everglades interim report, South Florida Wa-ter Management District, West Palm Beach, Florida, pp. 3.1–3.63.
McPherson, B. F. and R. Halley, 1997. The South Florida Environ-ment. USGS Circular No. 1134. USGS Information Services, P. O. Box 25286, Denver CO. 61 pp.
Means, D. B. and D. Simberloff, 1987. The peninsula effect: Habitat correlated species declines in Florida’s herpetofauna. Journal of Biogeography 14: 551–568.
Nott, M. P. and C. J. Comiskey, (n.d.). ATLSS SESI model, Cape Sable seaside sparrow breeding potential index, retrieved Feb-ruary 9, 2005 from http://sofi a.usgs.gov/projects/summary_sheets/sparrowsum.html.
Odum, H. T., 1994. Ecological and general systems, University of Colorado Press, Niwot, Colorado, 644 pp.
Odum, H. T., 1996. Environmental accounting: Emergy and envi-ronmental decision making, John Wiley and Sons, New York, New York, 384 pp.
Odum, H. T. and M. T. Brown (eds.), 1975. Carrying capacity for man and nature in south Florida, Final report to National Park Service, U.S. Dept. of Interior and State of Florida, Division of State Planning, Center for Wetlands, University of Florida, Gainesville, Florida, 886 pp.
Odum, H. T. and D. Collins, 2003. Transformities from ecosystem energy webs with the eigenvalue method. In: M. T. Brown, D. Campbell, V. Comar, S. Huang, T. Rydberg, D. Tilley, and S. Ulgiati (eds), Emergy Synthesis 2: Proceedings of the 2nd Bien-nial Emergy Research Conference, Center for Environmental Policy, University of Florida, Gainesville, Florida, pp. 203–220.
Odum, H. T. and R. C. Pinkerton, 1955. Time’s speed regulator: the optimum effi ciency for maximum power output in physical and biological systems. American Scientist 43: 331–343.
Ogden, J., 1997. Wading birds and the water cycle, retrieved January 31, 2005 from http://www.nps.gov/ever/eco/wading.html.
Opler, P. A., H. Pavulaan and R. E. Stanford (coordinators), 1995. Butterfl ies of North America. Northern Prairie Wildlife Re-search Center Online, Jamestown, North Dakota, http://www.npwrc.usgs.gov/resource/distr/lepid/bfl yusa/bfl yusa.htm (Version 12DEC2003).

Aquat. Sci. Vol. 68, 2006 Overview Article 277
Pandolfi , J. M., R. H. Bradbury, E. Sala, T. P. Hughes, K. A. Bjorn-dal, R. G. Cooke et al., 2003. Global trajectories of the long-term decline of coral reef ecosystems. Science 301: 955–958.
Parker, G. G., 1974. Hydrology of the pre-drainage system of the Everglades in southern Florida. In: P. J. Gleason (ed), Environ-ments of south Florida: Past and present, Miami Geological Society, Miami, Florida, pp. 18–27.
Peet, R. K., 1974. The measurement of biodiversity. Annual Review of Ecology and Systematics 5: 285–307.
Randazzo, A and D. Jones (eds.), 1997. The geology of Florida, University Presses of Florida, Gainesville, Florida, 327 pp.
Robertson, W. B., 1959. Everglades: The park story, University of Miami Press, Coral Gables, Florida, 88 pp.
Robertson, W. B. Jr., O. L. Bass, Jr. and M. Britten, 1984. Birds of Everglades National Park, Florida National Parks and Monu-ments Association in cooperation with the National Park Serv-ice, Homestead, Florida, 1 pp.
Robertson, W. B. and P. C. Frederick, 1994. The faunal chapters; contexts, synthesis and departures. In: S. M. Davis and J. C. Ogden (eds.), Everglades: The ecosystem and its restoration, St. Lucie Press, Delray Beach, Florida, pp. 709–737.
Schwartz, M. W., C. A. Brigham, J. D. Hoeksema, K. G. Lyons, M. H. Mills and P. J. van Mantgem, 2000. Linking biodiversity to ecosystem function: implications for conservation ecology. Oecologia 122: 297–305.
Schmidt, T. W., J. Osborne, J. Kalafarski and C. Greene, 2002. Year 2001 annual fi sheries report, Everglades National Park. South Florida Natural Resources Center, Everglades National Park, Homestead, Florida, 56 pp, retrieved February 9, 2005 from http://www.nps.gov/ever/current/report.htm.
Schomer, N. S. and R. D. Drew, 1982. An ecological characteriza-tion of the Lower Everglades, Florida Bay and the Florida Keys, FWS/OBS-82/58.1, U.S. Fish and Wildlife Service, Offi ce of Biological Services, Washington D.C., 246 pp.
Science Subgroup, 1996. South Florida ecosystem restoration: sci-entifi c information needs, Report to the working group of the south Florida ecosystem restoration task force, retrieved Janu-ary 30, 2005, from http://www.evergladesplan.org/.
SFWMD, (n.d.). Lake Okeechobee, retrieved January 30, 2005, from http://www.sfwmd.gov/org/wrp/wrp_okee/.
Sklar, F. H. and A. Van der Valk, 2003. Tree islands of the Everglades, Kluwer Academic Publishers, Boston, Massachusetts, 541 pp.
Smith, T. B., M. W. Bruford and R. K. Wayne, 1993. The preserva-tion of process: The missing element of conservation programs. Biodiversity Letters 1: 164–167.
Smith, T. R. and O. L. Bass, 1994. Landscape, white-tailed deer, and the distribution of Florida panthers in the Everglades. In: S. M. Davis and J. C. Ogden (eds.), Everglades: The ecosystem and its restoration, St. Lucie Press, Delray Beach, Florida, pp. 693–708.
Stevenson, H. M., 1976. Vertebrates of Florida: Identifi cation and distribution, University Presses of Florida, Gainesville, Florida, 607 pp.
Stober, J., D. Scheidt, R. Jones, K. Thornton, R. Ambrose and D. France, 1996. South Florida ecosystem assessment monitoring for adaptive management: Implications for ecosystem restora-tion (interim report), EPA 904-R-96-008, U.S. Environmental Protection Agency, Washington, D.C., 27 pp.
Terborgh, J., L. Lopez, P. Nunez, M. Rao, G. Shahabuddin, G. Ori-huela et al., 2001. Ecological meltdown in predator-free forest fragments. Science 294: 1923–1926.
Thayer, D., A. Ferriter, M. Bodie, K. Langeland, K. Serbestoff, D. Jones et al., 2000. Exotic plants in the Everglades. In: G. Red-fi eld (reported ed.), The Everglades consolidated report, South Florida Water Management District, West Palm Beach, Florida, pp. 14.1–14.28.
Tilman, D. and J. A. Downing, 1994. Biodiversity and stability in grasslands. Nature 367: 363–365.
Turner, A. M., J. C. Trexler, C. F. Jordan, S. J. Slack, P. Geddes, J. H. Chick et al., 1999. Targeting ecosystem features for conser-vation: Standing crops in the Florida Everglades. Conservation Biology 13: 898–912.
Ulanowicz, R. E., 1980. A hypothesis on the development of natural communities. Journal of Theoretical Biology 85: 223–245.
Ulanowicz, R. E., 1986. Growth and development: Ecosystem phe-nomenology, Springer Verlag, New York, New York, 224 pp.
Ulanowicz, R. E., 2001. Information theory in ecology. Computers and Chemistry 25: 393–399.
Ulanowicz, R. E. and J. J. Kay, 1991. A package for the analysis of ecosystem fl ow network. Environmental Software 6: 131–142.
Ulanowicz, R. E., 1997. Ecology: The ascendent perspective, Com-plexity in ecological systems series, Columbia University Press, New York, New York, 201 pp.
Ulanowicz, R. E., C. Bondavalli and M. S. Egnotovich, 1997. Net-work analysis of trophic dynamics in south Florida ecosystems FY96: The cypress wetland ecosystem. Annual Report to USGS/BRD, Coral Gables, Florida, retrieved January 30, 2005, from http://cbl.umces.edu/~atlss/cyp701.html.
Ulanowicz, R. E., J. J. Heymans and M. S. Egnotovich, 2000. Net-work analysis of trophic dynamics in south Florida ecosystems FY99: The graminoid ecosystem. Annual Report to USGS/BRD, Coral Gables, Florida, retrieved January 30, 2005, from http://cbl.umces.edu/~atlss/swgras701.html.
USACE and SFWMD, 1999. Central and southern Florida project comprehensive review study: Final integrated feasibility report and programmatic environmental impact statement, CD-ROM, U.S. Army Corps of Engineers, Jacksonville, Florida.
USACE and SFWMD, 2005. Offi cial website of the Comprehensive Everglades Restoration Plan (CERP), retrieved January 30, 2005, from http://www.evergladesplan.org/
Worm, B. and J. E. Duffy, 2003. Biodiversity, productivity and sta-bility in real food webs. Trends in Ecology and Evolution 18: 628–632.
Whittaker, R. H., 1975. Communities and ecosystems, MacMillan Press, New York, New York, 385 pp.


![Biodiversity and conservation Genetic diversity: within species variation (e.g corn [Zea mays] in North vs. Central America) Species diversity: species.](https://static.fdocuments.net/doc/165x107/56649db45503460f94aa4ef5/biodiversity-and-conservation-genetic-diversity-within-species-variation.jpg)