Speciation in Vireos. I. Macrogeographic Patterns of ...
17
The Condor 97:903-919 0 The Cooper Ornithological Society 1995 SPECIATION IN VIREOS. I. MACROGEOGRAPHIC PATTERNS OF ALLOZYMIC VARIATION IN THE VIREO SOLITARIUS COMPLEX IN THE CONTIGUOUS UNITED STATES NED K. JOHNSON Museum of Vertebrate Zoologyand Department of IntegrativeBiology, University of California, Berkeley,CA 94720-3160 Abstract. Using allozymes, I examined genetic variation in 23 populationsof four cur- rently recognizedsubspecies of the Solitary Vireo (Vireo solitarius solitarius. V. s. alticola, V. s. cassinii, and V. s. plumbeus), with emphasis on the latter two taxa. Eighteen of 38 genetic loci (47.4%) were polymorphic. Intrataxon Nei’s genetic distances were low (D = 0.0008) among populations of V. s. cassinii and I/ s. plumbeus. Average intertaxon Nei’s D ranged from zero (V. s. solitarius vs. V. s. alticola) to 0.0030 (V s. solitariusvs. V. s. cassinii), 0.0033 (V. s. cassinii vs. V. s. alticola), 0.0283 (V. s. plumbeus vs. V. s. solitarius), 0.0288 (V. s. plumbeus vs. V. s. alticola), and 0.0294 (V. s. plumbeus vs. V. s. cassinii). Nei’ s D between the Yellow-throated Vireo (Vireo flavifrons) and the four taxa of Solitary Vireo rangedfrom 0.0430-0.0743. A mean F,, value of 0.289 over all populationsof V. solitarius, and across combined populationsof V. s. cassinii and V. s.plumbeus, indicated pronounced genetic discontinuity between these two forms. Gene flow estimates between populations representing the subset of V. s. cassinii and V. s.plumbeus rangedfrom one individual every two generations(Wright’s 1951 formula) to an average of 12 immigrants per generation over all populations (Slatkin’s rare allele method). Based on strong allozymic divergence from the three other allopatric forms treated here, the PlumbeousVireo (Vireo plumbeus) is a species. Although similar allozymically, the Cassin’s Vireo (Vireo cassinii) and the Blue- headed Vireo (V. s. solitarius plus the “Mountain Vireo,” V. s. alticola) also may deserve species statusbecause data published by others demonstratetrenchant differences in voice and mtDNA base sequences. Key words: Speciation; allozymes; geographic variation; gene flow; Vireonidae; Solitary Vireo; Vireo solitarius; Blue-headed Vireo; Mountain Vireo; CassinSVireo; Plumbeous Vireo. INTRODUCTION The ongoing discovery of previously unrecog- nized, probable or definite cryptic species of Vi- reonidae (Johnsonand Zink 1985, Johnson et al. 1988, Willis 1991, Cicero and Johnson 1992) suggests that the group has been taxonomically undersplit and that additional forms need mod- em biosystematic attention. The various taxa currently included in the Solitary Vireo (Vireo solitarius), a common passerineof mixed conif- erous-deciduous woodlands across North Amer- ica, comprise a complex deserving such detailed study. Each form is strongly characterizedin fea- tures of size, coloration, habitat selection, and voice. This unusual combination of attributes allows a multidimensional examination of vari- ation across geography that would clarify the na- ture of characterchangein the vicinity of bound- aries between these taxa. In turn, this informa- tion could illuminate both the current taxonomic ’ Received 23 February 1995.Accepted17 July 1995. statusand the evolutionary history of the several allopatric units. The present paper initiates such a study by presenting the results of a broad-scale population analysis of allozymic variation based on an electrophoretic survey of protein-coding loci. Future papers, based on research in prog- ress, will examine geographic variation in mtDNA nucleotide sequences, morphology, col- oration, and male advertising songand will focus on the two most divergent forms in the complex, V. s. cassinii and V. s. plumbeus. This paper does not treat the several additional named subspecies that breed in Mexico and Belize. I discussfour taxa. Vireo s. alticola, a large, dorsally blackish-gray form with bright yellowish sides, lives in forests of mixed hardwoods and conifers in Appalachia. Vireo s. solitarius, a smaller, gray-headed form with an olive-green back and rump and yellow flanks, inhabits sim- ilar open woods across the northeastern United States and southern Canada. Vireo s. cassinii, although basically similar to the previous form, is paler and has a lesscontrasting head and dor- I9031
Transcript of Speciation in Vireos. I. Macrogeographic Patterns of ...
The Condor 97:903-919 0 The Cooper Ornithological Society 1995
SPECIATION IN VIREOS. I. MACROGEOGRAPHIC PATTERNS OF ALLOZYMIC VARIATION IN THE VIREO SOLITARIUS COMPLEX
IN THE CONTIGUOUS UNITED STATES
NED K. JOHNSON Museum of Vertebrate Zoology and Department of Integrative Biology, University of California,
Berkeley, CA 94720-3160
Abstract. Using allozymes, I examined genetic variation in 23 populations of four cur- rently recognized subspecies of the Solitary Vireo (Vireo solitarius solitarius. V. s. alticola, V. s. cassinii, and V. s. plumbeus), with emphasis on the latter two taxa. Eighteen of 38 genetic loci (47.4%) were polymorphic. Intrataxon Nei’s genetic distances were low (D = 0.0008) among populations of V. s. cassinii and I/ s. plumbeus. Average intertaxon Nei’s D ranged from zero (V. s. solitarius vs. V. s. alticola) to 0.0030 (V s. solitarius vs. V. s. cassinii), 0.0033 (V. s. cassinii vs. V. s. alticola), 0.0283 (V. s. plumbeus vs. V. s. solitarius), 0.0288 (V. s. plumbeus vs. V. s. alticola), and 0.0294 (V. s. plumbeus vs. V. s. cassinii). Nei’s D between the Yellow-throated Vireo (Vireo flavifrons) and the four taxa of Solitary Vireo ranged from 0.0430-0.0743. A mean F,, value of 0.289 over all populations of V. solitarius, and across combined populations of V. s. cassinii and V. s. plumbeus, indicated pronounced genetic discontinuity between these two forms. Gene flow estimates between populations representing the subset of V. s. cassinii and V. s. plumbeus ranged from one individual every two generations (Wright’s 195 1 formula) to an average of 12 immigrants per generation over all populations (Slatkin’s rare allele method). Based on strong allozymic divergence from the three other allopatric forms treated here, the Plumbeous Vireo (Vireo plumbeus) is a species. Although similar allozymically, the Cassin’s Vireo (Vireo cassinii) and the Blue- headed Vireo (V. s. solitarius plus the “Mountain Vireo,” V. s. alticola) also may deserve species status because data published by others demonstrate trenchant differences in voice and mtDNA base sequences.
Key words: Speciation; allozymes; geographic variation; gene flow; Vireonidae; Solitary Vireo; Vireo solitarius; Blue-headed Vireo; Mountain Vireo; CassinS Vireo; Plumbeous Vireo.
INTRODUCTION
The ongoing discovery of previously unrecog- nized, probable or definite cryptic species of Vi- reonidae (Johnson and Zink 1985, Johnson et al. 1988, Willis 1991, Cicero and Johnson 1992) suggests that the group has been taxonomically undersplit and that additional forms need mod- em biosystematic attention. The various taxa currently included in the Solitary Vireo (Vireo solitarius), a common passerine of mixed conif- erous-deciduous woodlands across North Amer- ica, comprise a complex deserving such detailed study. Each form is strongly characterized in fea- tures of size, coloration, habitat selection, and voice. This unusual combination of attributes allows a multidimensional examination of vari- ation across geography that would clarify the na- ture of character change in the vicinity of bound- aries between these taxa. In turn, this informa- tion could illuminate both the current taxonomic
’ Received 23 February 1995. Accepted 17 July 1995.
status and the evolutionary history of the several allopatric units. The present paper initiates such a study by presenting the results of a broad-scale population analysis of allozymic variation based on an electrophoretic survey of protein-coding loci. Future papers, based on research in prog- ress, will examine geographic variation in mtDNA nucleotide sequences, morphology, col- oration, and male advertising song and will focus on the two most divergent forms in the complex, V. s. cassinii and V. s. plumbeus. This paper does not treat the several additional named subspecies that breed in Mexico and Belize.
I discuss four taxa. Vireo s. alticola, a large, dorsally blackish-gray form with bright yellowish sides, lives in forests of mixed hardwoods and conifers in Appalachia. Vireo s. solitarius, a smaller, gray-headed form with an olive-green back and rump and yellow flanks, inhabits sim- ilar open woods across the northeastern United States and southern Canada. Vireo s. cassinii, although basically similar to the previous form, is paler and has a less contrasting head and dor-
I9031
904 NED K. JOHNSON
sum. It breeds in open ponderosa pines and pine- oak woodland from British Columbia south- eastward to western Montana and southward to California. A fourth taxon, V. s. plumbeus, a rel- atively large, clean gray and white form, nests in arid pinyon-juniper and open ponderosa pine- scrub oak woodland from central Montana south through the interior of the western United States.
Since first described, all forms have been treat- ed as subspecies in the Check-list of North Amer- ican birds (American Ornithologists’ Union 1886, 1889, 1895, 1910, 1931, 1957, 1983). Nonethe- less, the vernacular names used for subspecies in four editions of that series also have been applied commonly in other literature: “Blue-headed Vir- eo” (V. s. solitarius), “Mountain Solitary Vireo” or “Mountain Vireo” (V. s. alticola), “Cassin’s Vireo” (V. s. cassinii), and “Plumbeous Vireo” (I’. s. plumbers). Furthermore, with the excep- tion of r s. alticola, relatively unworn adults of the North American forms can often be identi- fied safely under ideal field conditions and are occasionally illustrated separately in field guides. Such treatment by both the professional and pop- ular literature implies a degree of distinctiveness greater than that usually associated with subspe- cies. The statement in American Ornithologists’ Union (1983:594) that more than one species may be presently included under V. solitarius and the treatment of V. s. solitarius, V. s. cassinii, and V. s. plumbeus as separate species by Sibley and Monroe (1990) and Monroe and Sibley (1993) are based upon results of the present paper and others in progress.
METHODS AND MATERIALS
COLLECTION OF SPECIMENS
This study was based upon 335 specimens taken on their breeding grounds during the spring and early summer of 1977-1987. I divided this total into 23 sample areas for analysis (Fig. 1). Eleven sample areas (Ravalli through Shaver Lake) rep- resent V. s. cassinii, nine (Wassuk-Paradise through Mogollon) represent V. s. plumbeus, two (Minnesota and Maine) are of V. s. solitarius, and one composite sample area (Virginia-North Carolina) represents V. s. alticola.
ALLOZYME ELECTROPHORESIS
I analyzed 38 protein-coding loci in tissue ex- tracts using standard techniques described by Se- lander et al. (197 1) and Yang and Patton (198 l), with the slight modifications of Johnson et al.
(1984). Protein assays were prepared according to Harris and Hopkinson (1976) and Selander et al. (1971). Electromorphs (alleles) at each locus were designated alphabetically in order of de- creasing mobility. Six additional loci (Acp, Ak, Ck-3, Est-2, Lap, and Mdh- 1) could not be scored consistently and were excluded. Two specimens of the Yellow-throated Vireo (Vireo j’avifons) from Louisiana were used as an outgroup. With 335 specimens from 23 populations at 38 loci (two alleles per locus per individual), 25,460 al- leles were scored.
STATISTICAL ANALYSES
Using BIOSYS- 1 (Swofford and Selander 198 l), I calculated observed and expected heterozygos- ities for each sample, Chi-square tests for de- partures from Hardy-Weinberg equilibrium, al- lelic frequencies, genetic distances (with the methods of Nei 1978, Rogers 1972, and Cavalli- Sforza and Edwards 1967, as modified by Nei 1983), and Wright’s F, (1965), using the modi- fications of Wright (1978) for small sample size and of Nei (1975) for multiple alleles. Because observed values of heterozygosity (Hobs.) did not differ from expected values based on Hardy- Weinberg equilibrium (Nei 1975) in any com- parison, only values for Hobs. are presented.
Based on Nei ( 198 3) modified arc distances of Cavalli-Sforza and Edwards (1967) I produced two trees depicting relationships among popu- lations: a UPGMA dendrogram (with BIOSYS- 1 [Swofford and Selander 19811) and a neighbor- joining (N-J) tree (with the method of Saitou and Nei [ 19871) by application of the program MEGA (Kumar et al. 1993). Using the same distance values, interpopulation genetic variation was further examined through multidimensional scaling (MDS) with the program ALSCAL (SPSS Inc. 1990). Lessa (1990) discussed the merits of ordination techniques such as MDS, as opposed to hierarchical approaches, to analyze allelic variation across geography.
Contemporary levels of gene flow were esti- mated with Wright’s (195 1) formula, Nm = 54 (l/F,, - l), and with Slatkin’s (1981, 1985a, 1985b) rare allele method, which uses the for- mulalnp(1) = -0.505 ln(Nm) + (-2.44), where p(l) is the average frequency of private alleles and Nm is the product of the population size and immigration rate. Because sample sizes differed among populations, I applied Slatkin’s (1985a) recommended correction, in which Nm is divid-

SPECIATION IN SOLITARY VIREO COMPLEX 905
Minnesota (21) Maine (22)
Uncompahgre (18) I
+-_l~
FIGURE 1. Gross approximation of the nesting distributions of V. s. cussinii (dark shading) and I’. s. plumbeus (pale shading) in the contiguous western United States. Within the shaded regions, areas which are actually occupied by either form consist of irregular islands of suitable habitat surrounded by vast regions of unsuitable terrain. Specimen sampling sites are identified by solid dots (V. s. cussiniz], and solid squares (K s. plumbeus). The two sampling sites for I’. s. solitaries (open circles) and the single combined site for V. s. alticola (triangle), in the eastern United States, are not mapped.
ed by the ratio of the average sample size to 25. Thus, Nm, = Nm(I?/25)-I, where &J = (Z NJn), the average sample size. N, is the number of spec- imens in a given sample and n is the number of samples studied. For my average sample size of N= 14.6, the correction factor was 0.584. Slatkin and Barton (1989) verified the suitability of both FS’,, and rare alleles, as opposed to maximum like- lihood methods, for estimating the average level of gene flow in natural populations.
RESULTS
VARIATION AMONG LOCI AND HETEROZYGOSITY
Eighteen of 38 storable loci (47.4%) were poly- morphic. Twenty loci were monomorphic: AB-
1,2,3,4; ALD; CK- 1,2; EST- 1; GAPDH; GDA; GLO; GLUD; GOT-2; GPT; G-6-PDH; ICD-2; LDH- 1, 2; MDH-2; SDH.
Levels of genetic variability within popula- tions of the Vireo solitarius complex are listed in Table 1. Observed heterozygosity ranged from 0.023 (Virginia-North Carolina) to 0.056 (Wal- lowa). Average Hobs. was 0.039. Percentage of polymorphic loci ranged from 7.9% (four pop- ulations) to 2 1.1% (Pozo), with a mean of 12.94%. Mean number of alleles per locus ranged from 1.1 (three populations) to 1.4 (Clover), with an average of 1.23. Mean Hobs. for V. s. cassinii (0.0438) was significantly different from that for V. s. plumbeus (0.0350) based on a Mann-Whit- ney-U statistic of 82 (0.05 > P > 0.02). Sample

906 NED K. JOHNSON
TABLE 1. Genetic variability measures for 23 samples representing four taxa of the Vireo solitaries complex.
1. Ravalli 2. Okanogan 3. Wallowa 4. Rogue River 5. Siskiyou-Warner 6. Shasta 7. Lake 8. Monterey 9. PO20
10. Markleeville 11. Shaver Lake 12. Wassuk-Paradise 13. Chimney Peak 14. Inyo 15. Clover 16. Coconino 17. Powder River 18. Uncompahgre 19. Truchas 20. Mogollon 2 1. Minnesota 22. Maine 23. Virginia-North Carolina Mean
21 11 16 14 11 19 18 13 10
1.3 13.2 1.2 7.9
0.036 ? 0.014 0.038 + 0.018 0.056 f 0.022 0.041 f 0.020 0.043 f 0.020 0.047 + 0.018 0.050 * 0.019 0.030 + 0.017 0.045 f 0.019
1.2 15.8 1.2 1.2
10.5 10.5
1.3 1.3 1.1 1.2
18.4 15.8 7.9
21.1
2: 1.1 1.3
13.2 10.5 13.2 13.2 15.8
0.053 + 0.024 0.043 + 0.021
1.1 0.030 + 0.016 10 1.2 16 1.3
0.037 + 0.017 0.030 + 0.013
27 1.4 18.4 0.036 + 0.013 20 1.3 13.2 0.030 + 0.011 18 1.2 13.2 0.041 + 0.019 16 1.3 13.2 0.030 + 0.012 15 1.3 13.2 0.037 + 0.015 15 1.3 10.5 0.044 & 0.020 6 1.2 13.2 0.039 * 0.024
11 1.2 7.9 0.041 ? 0.018 18 1.2 7.9 0.023 k 0.012 14.6 1.23 12.94 0.039 1
* Frequency of most common allele 5 0.95.
size was uncorrelated (P > 0.05) with either mean observed heterozygosity (r = -0.1783) or per- centage of polymorphic loci (r = 0.2129), but was significantly correlated with mean number of alleles per locus (r = 0.7952; P c 0.01). The lack of dependence of either mean levels of H or percentage of polymorphic loci on sample size, when the number of loci surveyed is relatively large, agrees with both the theoretical predictions of Nei (1978) and the empirical results of Gor- man and Renzi (1979).
GEOGRAPHIC TRENDS IN ALLELIC FREQUENCY
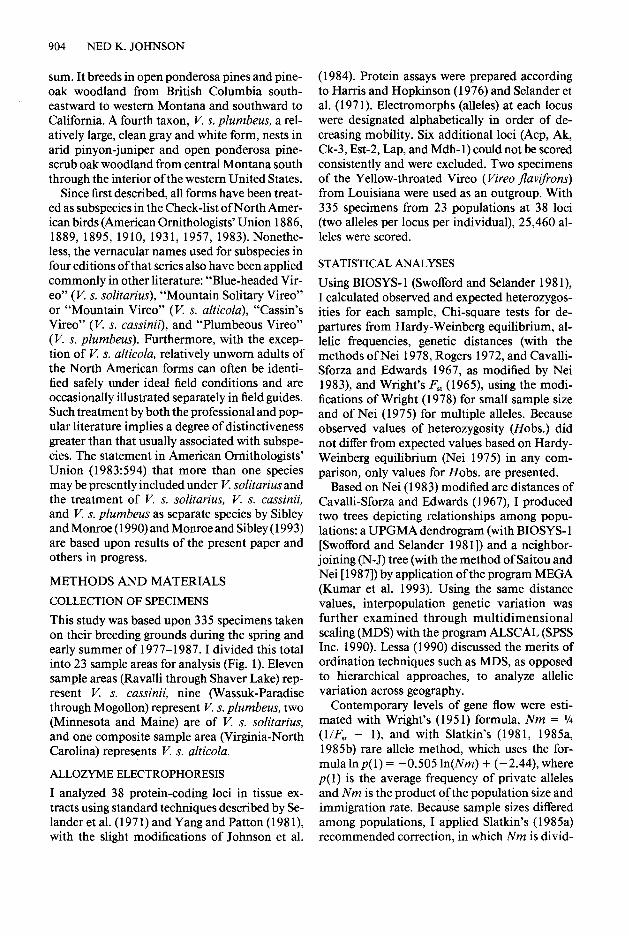
A pronounced pattern in the frequency of alleles occurred at two loci, Acon and 6-Pgd (Table 2, Fig. 2). Acon b was fixed in all populations of V. s. cassinii, V. s. solitarius, V. s. alticola and in the outgroup, V. jlavifrons. In sharp contrast, seven samples of V. s. plumbeus, were fixed at Acon a and in two others (Inyo, Clover) was nearing fixation. At 6-Pgd, allele a occurred in V. s. cassinii at a frequency of 16.7-54.5%, with a mean of 37.71%. In V. s. plumbeus, the same allele occurred from 10.0-44.4% (mean 2 1.4%). The frequency of 6-Pgd a was much reduced in
V. s. solitarius, at 6.4%, and this allele was almost lost (2.8%) in the single population of V. s. al- ticola. A geographic difference also occurred at Lgg, where allele d was found in only one of 11 populations of V. s. cassinii, but turned up in seven of nine samples of V. s. plumbeus and was missing in V. s. solitarius and V. s. alticola. Elev- en populations had unique (private) alleles. Al- though their distribution was probably random, an unusual concentration occurred at Ravalli (4) and Lake (3). Chimney Peak had two unique alleles. Unexpectedly, the number of private al- leles was uncorrelated with either sample size (r = 0.215; P > 0.05) or with Hobs. (r = -0.054; P > 0.05). The outgroup, V. _flavijYons, showed major allelic frequency differences from V. so- litarius at Ada, Gpi and Np.
GENETIC DISTANCES
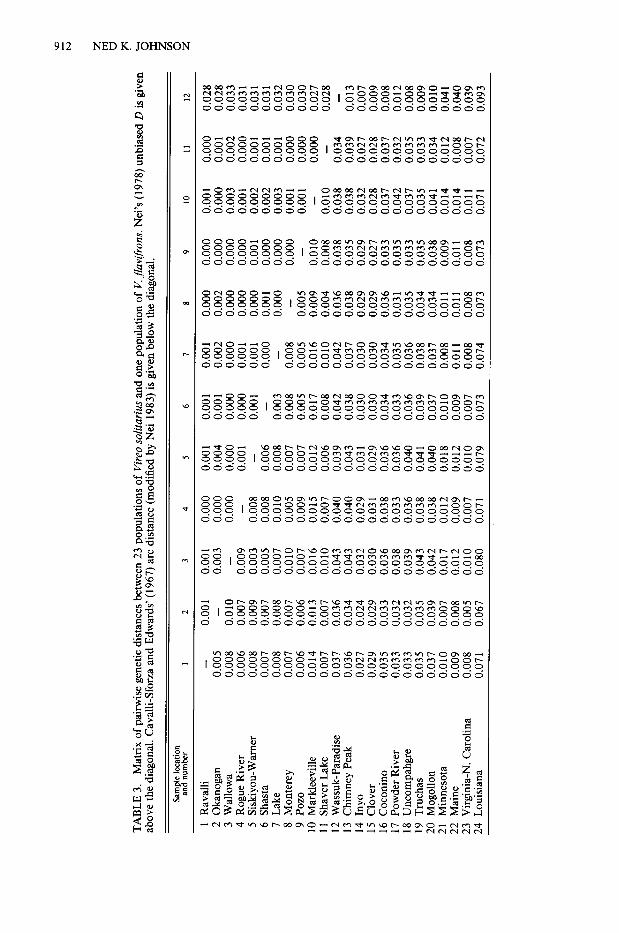
Matrices of 276 paitwise comparisons of Nei’s (1978) genetic distances and Nei’s (1983) mod- ification of Cavalli-Sforza and Edward’s (1967) arc distances are presented in Table 3. Mean in- trataxon population differences in Nei’s D were 0.0008 + 0.00013 (V. s. cassinii), 0.0008 + 0.000 19 (I’. s. plumbeus), and zero between the
SPECIATION IN SOLITARY VIREO COMPLEX 907
FIGURE 2. Geographic and taxonomic occurrence and percentage frequency of alleles at Acon (upper) and 6-Pgd (lower) in the Vireo solitarius complex. The key to alleles is located in the lower right of each map. Note that at 6-Pgd a single private allele (c) occurred in the sample from Chimney Peak and that allele b is nearly fixed in the three samples from the eastern United States. Sample sizes are given in Table 1.

908 NED K. JOHNSON
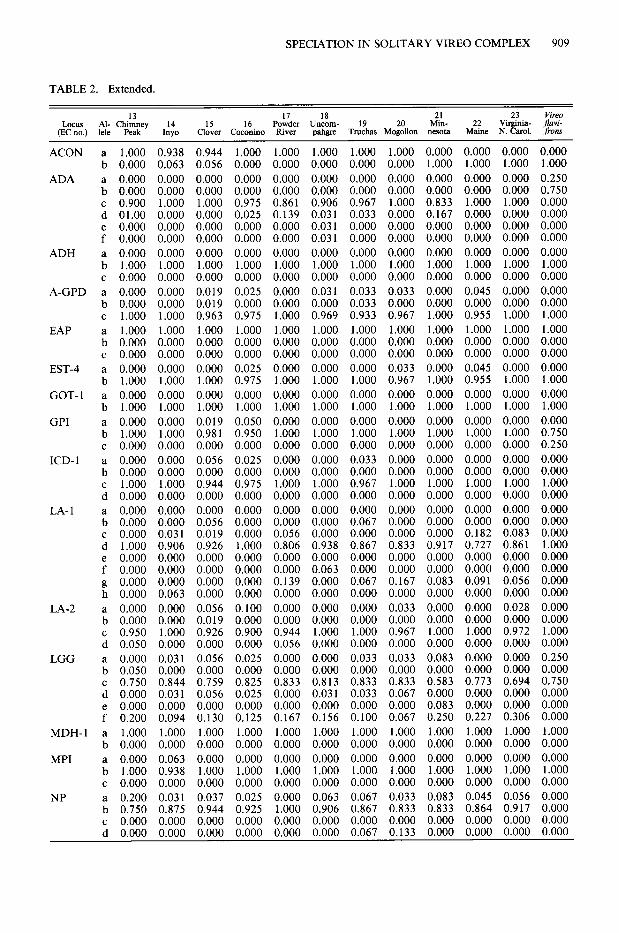
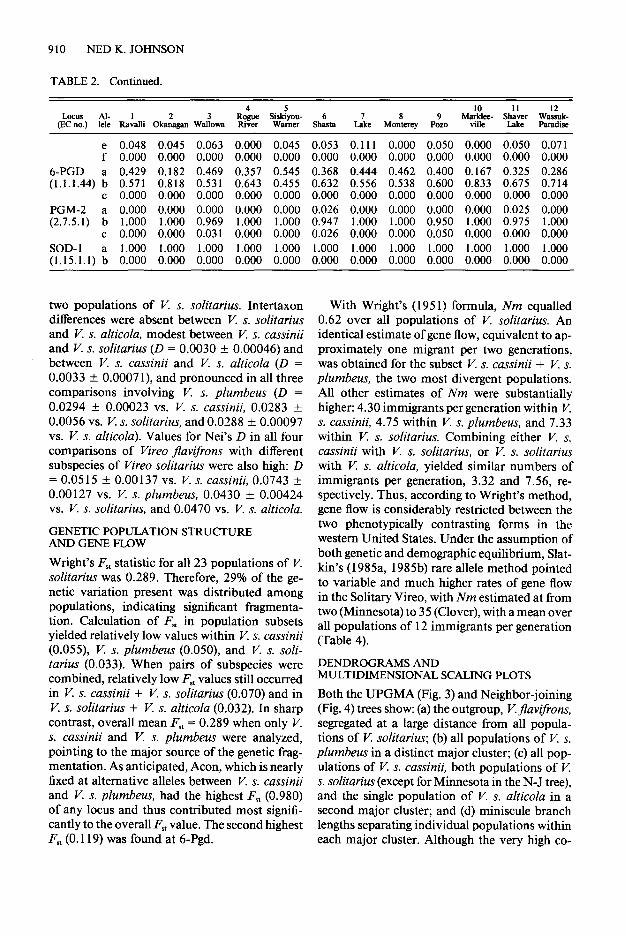
TABLE 2. Allelic frequencies at 18 variable loci in 23 populations of Vireo solitaries and one population of V. flavifrons.
4 5 10 11 12 Locus Al-
(EC no.) lele Ra&lli Oka~&gan W&w “&?:; “id&o;- 6
dke 8 9 Marklee- Shaver Wassuk-
Shasta Monterey POZO ville Lake PXdiSe
ACON a (4.2.1.3) b
ADA (3.4.4.4) :
:
;
ADH (1.1.1.1) :
C
A-GPD a (1.1.1.8) b
C
EAP (3.1.3.2) :
C
EST-4 (3.1.1.1) :
GOT-l a (2.6.1.1) b
GPI (5.3.1.9) :
C
ICD- 1 (1.1.1.42) :
:
LA- 1 (3.4.11) :
:
;
g h
LA-2 (3.4.11) :
:
LGG (3.4.11) :
:
;
MDH-1 a (1.1.1.37) b
MPI (5.3.1.8) :
0.000 1 .ooo
0.000 1.000
0.000 1.000
0.000 0.000 1 .ooo 0.000 0.000 0.000
0.000
0.000 0.000 0.000 0.000 0.000 0.000 0.000 1.000 1.000 1.000 1.000 1.000 1.000 1.000
0.000 0.000 0.000 0.000 0.000 0.000 0.000 0.000 0.000 0.000 0.000 0.000 0.000 0.000 0964 1.000 0.921 0.944 1.000 0.950 1.000 0.000 0.000 0.079 0.056 0.000 0.050 0.000 0.036 0.000 0.000 0.000 0.000 0.000 0.000 0.000 0.000 0.000 0.000 0.000 0.000 0.000
0.000 1.000
0.000
1.000 0.000
0.000 0.000 0.000 0.000 0.000 0.929 0.909 0.048 0.09 1 0.024 0.000 0.000 0.000
0.000 0.000
0.000 1 .ooo
0.000 1 .ooo
0.000 0.000 0.000 0.000 0.000 0.000 0.000 0.000 1.000 1.000 0.000 0.000
0.000 0.000 0.000 0.000 1.000 1.000
1.000 0.929 0.000 0.07 1 0.000 0.000
0.000 0.000 1 .ooo 1 .ooo
0.036 0.000 0.000 0.000 0.000 0.000 0.000 0.893 1.000 1.000 1.000 1.000 1.000 1.000 0.071 0.000 0.000 0.000 0.000 0.000 0.000
0.000 0.000 0.000 0.000 0.000 0.000 0.000 0.000 0.000 0.000 0.000 0.000 0.000 0.000 1.000 1.000 1.000 1.000 1.000 1.000 1.000
1.000 1.000 1.000 0.972 1.000 1.000 1.000 0.000 0.000 0.000 0.000 0.000 0.000 0.000 0.000 0.000 0.000 0.028 0.000 0.000 0.000
0.000 0.000 0.000 0.000 0.000 0.000 0.000 1 .ooo 1.000 1.000 1.000 1.000 1.000 1.000
0.000 0.000 0.000 0.028 0.000 0.000 0.000 1 .ooo 1.000 1.000 0.972 1.000 1.000 1.000
0.000 0.045 0.000 0.000 0.000 0.000 0.167 0.964 0.955 0.974 1.000 1.000 1.000 0.833 0.036 0.000 0.026 0.000 0.000 0.000 0.000
0.000 0.000 0.000 0.000 0.000 0.050 0.000
1.000 0.000
1.000 0.000
1 .ooo 0.000
0.000 0.000 0.000 0.000 1 .ooo
0.000 1.000
0.000 1.000
1 .ooo 0.000 0.000
0.000 1 .ooo
0.000 1.000
0.000 1.000 0.000
0.024 0.000 0.976 0.000
0.024 0.000 0.095 0.88 1 0.000 0.000
1.000 0.000 0.000
0.000 1.000
0.000 1 .ooo
0.094 0.906 0.000
0.03 1 0.000 0.969 0.000
0.000 0.000 0.188
1 .ooo 0.000 0.000
0.000 1 .ooo
0.000 1 .ooo
0.000 1 .ooo 0.000
0.000 0.000 0.955 0.045
0.000 0.000 0.045 0.955 0.000 0.000 0.000 0.000
0.000 0.000 1.000 0.000
0.000 0.000 0.727 0.000 0.000 0.273
1 .ooo 0.000
0.045 0.955 0.000
0.000 0.955 0.000 0.000
0.000 1 .ooo
0.000 1 .ooo
0.000 0.000 1 .ooo 0.000
1 .ooo 0.000
0.000 0.000 0.000 0.000 0.000 0.000 0.000 0.000 0.000 0.025 0.000 1.000 1.000 1.000 1.000 1.000 0.950 1.000 0.975 1.000 0.000 0.000 0.000 0.000 0.000 0.000 0.000 0.000 0.000
0.000 0.000 0.000 0.000 0.000 0.000 0.000 0.000 0.000 0.000 0.091 0.000 0.000 0.077 0.050 0.333 0.125 0.071 0.107 0.227 0.079 0.028 0.000 0.000 0.000 0.075 0.000 0.857 0.682 0.868 0.889 0.846 0.950 0.667 0.125 0.929 0.000 0.000 0.000 0.028 0.000 0.000 0.000 0.000 0.000 0.000 0.000 0.000 0.000 0.000 0.000 0.000 0.000 0.000 0.036 0.000 0.053 0.056 0.077 0.000 0.000 0.075 0.000 0.000 0.000 0.000 0.000 0.000 0.000 0.000 0.000 0.000
0.000 0.136 0.211 0.167 0.000 0.050 0.000 0.000 0.000 0.000 0.000 0.000 0.000 0.000 0.000 0.000 0.000 0.000 1.000 0.864 0.789 0.833 1.000 0.950 1.000 0.975 1 .ooo
0.781 0.000 0.031
0.000 0.000
0.000 0.000
0.000 0.000 1.000 0.000
0.000 0.000
0.156 0.000 0.844 0.000
0.000 0.000 0.563 0.000 0.000 0.438
1.000 0.000
0.000 1 .ooo 0.000
0.000 0.938 0.000 0.000
0.000 0.000 0.000 0.000 0.000 0.000 0.000 0.000 0.000 0.000 0.028 0.000 0.000 0.000 0.000 0.000 0.000 0.000 0.000 0.000 0.000 0.607 0.727 0.632 0.583 0.654 0.600 0.833 0.000 0.000 0.000 0.000 0.000 0.000 0.000 0.000 0.000 0.000 0.000 0.000 0.000 0.000 0.393 0.273 0.368 0.389 0.346 0.400 0.167
1 .ooo 1.000 1.000 1.000 1 .ooo 1 .ooo 1.000 0.000 0.000 0.000 0.000 0.000 0.000 0.000
0.000 0.000 0.000 0.000 0.000 0.000 0.000 1 .ooo 1 .ooo 1.000 1.000 1 .ooo 1.000 1 .ooo 0.000 0.000 0.000 0.000 0.000 0.000 0.000 0.000 0.000 0.026 0.056 0.000 0.050 0.167
0.025 0.000
0.000 0.000
0.000 0.000
0.786 0.000
0.750 0.929 0.07 1 0.000 0.000
1 .ooo 0.000
0.000 1 .ooo 0.000
0.000 0.929 0.000 0.000
0.025 0.000 0.225
1 .ooo 0.000
0.000 1 .ooo 0.000
0.000 0.925 0.000 0.025
0.000 0.214
0.976 0.024
0.000 0.976 0.024
0.024 0.881 0.024 0.024
NP (2.4.2.1) :
:
1.000 0.955 0.921 0.833 1.000 0.900 0.833 0.000 0.000 0.000 0.000 0.000 0.000 0.000 0.000 0.000 0.000 0.000 0.000 0.000 0.000
SPECIATIONINSOLITARYVIREOCOMPLEX 909
TABLE 2. Extended.
13 17 18 Locus
(EC no.) Al- chgy 14 15 16 Powder Uncom- lele IWO Clover Gxonino River &we
ACON
ADA
a 1.000 0.938 0.944 1.000 1.000 1.000 1.000 1.000 0.000 0.000 0.000 0.000 b 0.000 0.063 0.056 0.000 0.000 0.000 0.000 0.000 1.000 1.000 1.000 1.000 a 0.000 0.000 0.000 0.000 0.000 0.000 0.000 0.000 0.000 0.000 0.000 0.250 b 0.000 0.000 0.000 0.000 0.000 0.000 0.000 0.000 0.000 0.000 0.000 0.750 c 0.900 1.000 1.000 0.975 0.861 0.906 0.967 1.000 0.833 1.000 1.000 0.000 d 01.00 e 0.000 f 0.000 a 0.000 b 1.000 c 0.000
0.000 0.000 0.000 0.000 0.000 0.000 0.000 0.000
0.025 0.139 0.000 0.000 0.000 0.000 0.000 0.000 1.000 1.000 0.000 0.000 0.025 0.000
0.031 0.031
0.033 0.000 0.000
0.000 0.000 0.000 0.000 1.000
0.167 0.000 0.000 0.000 1.000 0.000 0.000 0.000 1.000 1.000 0.000 0.000 0.000 1.000 0.000 1.000
0.000 0.000 0.000 0.000 1.000 0.000
0.000 0.000 0.000 0.000 0.000 0.000
0.000 0.000 1.000 1.000 0.000 0.000
0.031 0.000 1.000 0.000 0.031
ADH
A-GPD
EAP
EST-4
GOT-l
GPI
ICD-1
0.000 1.000 1.000 1.000
0.000 0.000 0.000 0.033 0.033 0.933 1.000
0.000 0.033 0.000 0.967 1.000 0.000 0.000 0.033 0.967 0.000 1.000
a 0.000 0.000 0.019 b 0.000 0.000 0.019 c 1.000 1.000 0.963 a 1.000 1.000 1.000 b 0.000 0.000 0.000 c 0.000 0.000 0.000 a 0.000 0.000 0.000 b 1.000 1.000 1.000 a 0.000 0.000 0.000 b 1.000 1.000 1.000
0.045 0.000 0.955 1.000 0.000 0.000 0.045 0.955 0.000 1.000
0.000 0.000 0.000 0.000 0.000 0.000 0.000
0.975 1.000 0.969 1.000 1.000 1.000 0.000 0.000
1.000 1.000 1.000 1.000 0.000 0.000 0.000 0.000
0.000 0.000
0.000 0.000
0.000 0.000
0.025 0.000 0.000 0.000 0.975 1.000 1.000 1.000 0.000 0.000 0.000 0.000 1.000 1.000 1.000 1.000
0.000 0.000 1.000 1.000 0.000 0.000 1.000 1.000
a 0.000 0.000 0.019 0.050 0.000 0.000 0.000 b 1.000 1.000 0.981 0.950 1.000 1.000 1.000 c 0.000 0.000 0.000 0.000 0.000 0.000 0.000 a 0.000 0.000 0.056 0.025 0.000 0.000 0.033 b 0.000 0.000 0.000 0.000 0.000 0.000 0.000 c 1.000 1.000 0.944 0.975 1.000 1.000 0.967 d 0.000 0.000 0.000 0.000 0.000 0.000 0.000
0.000 0.000 0.000 0.000 0.000 1.000 1.000 1.000 1.000 0.750 0.000 0.000 0.000 0.000 0.250 0.000 0.000 0.000 0.000 0.000 0.000 0.000 0.000 0.000 0.000 1.000 1.000 1.000 1.000 1.000 0.000 0.000 0.000 0.000 0.000 0.000 0.000 0.000 0.000 0.000 0.000 0.000 0.000 0.000 0.000
a 0.000 0.000 0.000 0.000 0.000 0.000 0.000 b 0.000 0.000 0.056 0.000 0.000 0.000 0.067
LA-l
: e
0.000 1.000 0.000 0.000 0.000 0.000 0.000 0.000 0.950 0.050 0.000 0.050
0.031 0.906 0.000 0.000 0.000 0.063
0.019 0.926 0.000 0.000 0.000 0.000 0.056 0.019 0.926 0.000 0.056 0.000
0.000 1.000 0.000 0.000 0.000 0.000 0.100 0.000 0.900 0.000 0.025 0.000
0.056
0.000
0.000
0.000 0.000
0.806
0.063 0.139
0.938
0.000 0.000 0.000 0.000 0.000 0.000 0.000 0.944 1.000 0.056 0.000 0.000 0.000 0.000 0.000
0.000
0.000
0.067
0.867 0.000
0.000 0.833
0.000 0.000
0.167
0.000 0.182 0.083 0.917 0.727 0.861 0.000 0.000 0.000 0.000 0.000 0.000 0.083 0.091 0.056 0.000 0.000 0.000
0.000 1.000 0.000 0.000 0.000 0.000 0.000 0.000 1.000 0.000 0.250 0.000
0.000 0.000 0.000 1.000 0.000 0.033 0.000
0.000 LA-2 0.000
0.000 1.000 0.000 0.031 0.000
0.033 0.000 0.000 0.028 0.000 0.000 0.000 0.000 0.967 1.000 1.000 0.972 0.000 0.000 0.000 0.000 0.033 0.083 0.000 0.000 0.000 0.000 0.000 0.000
LGG
c 0.750 0.844 d 0.000 0.031 e 0.000 0.000 f 0.200 0.094 a 1.000 1.000 b 0.000 0.000
0.759 0.825 0.833 0.813 0.833 0.833 0.583 0.773 0.694 0.750 0.056 0.025 0.000 0.031 0.033 0.067 0.000 0.000 0.000 0.000 0.000 0.000 0.000 0.000 0.000 0.000 0.083 0.000 0.000 0.000 0.130 0.125 0.167 0.156 0.100 0.067 0.250 0.227 0.306 0.000 1.000 1.000 1.000 1.000 1.000 1.000 1.000 1.000 1.000 1.000 0.000 0.000 0.000 0.000 0.000 0.000 0.000 0.000 0.000 0.000 0.000 0.000 0.000 0.000 0.000 0.000 0.000 0.000 0.000 0.000 1.000 1.000 1.000 1.000 1.000 1.000 1.000 1.000 1.000 1.000 0.000 0.000 0.000 0.000 0.000 0.000 0.000 0.000 0.000 0.000 0.037 0.025 0.000 0.063 0.067 0.033 0.083 0.045 0.056 0.000 0.944 0.925 1.000 0.906 0.867 0.833 0.833 0.864 0.917 0.000 0.000 0.000 0.000 0.000 0.000 0.000 0.000 0.000 0.000 0.000
a 0.000 0.063 b 1.000 0.938 c 0.000 0.000 a 0.200 0.031 b 0.750 0.875 c 0.000 0.000 d 0.000 0.000 0.000 0.000 0.000 0.000 0.067 0.133 0.000 0.000 0.000 0.000
MDH-1
MPI
NP
910 NED K. JOHNSON
TABLE 2. Continued.
e 0.048 f 0.000
6-PGD a 0.429 (1.1.1.44) b 0.571
c 0.000
PGM-2 a 0.000 (2.7.5.1) b 1.000
c 0.000
SOD- 1 a 1.000 (1.15.1.1) b 0.000
A
0.045 0.000
0.182 0.818 0.000
0.000 1 .ooo 0.000
1.000 0.000
0.063 0.000 0.045 0.053 0.111 0.000 0.050 0.000 0.050 0.07 1 0.000 0.000 0.000 0.000 0.000 0.000 0.000 0.000 0.000 0.000
0.469 0.357 0.545 0.368 0.444 0.462 0.400 0.167 0.325 0.286 0.531 0.643 0.455 0.632 0.556 0.538 0.600 0.833 0.675 0.714 0.000 0.000 0.000 0.000 0.000 0.000 0.000 0.000 0.000 0.000
0.000 0.000 0.000 0.026 0.000 0.000 0.000 0.000 0.025 0.000 0.969 1 .ooo 1.000 0.947 1 .ooo 1 .ooo 0.950 1.000 0.975 1 .ooo 0.03 1 0.000 0.000 0.026 0.000 0.000 0.050 0.000 0.000 0.000
1 .ooo 1 .ooo 1 .ooo 1.000 1.000 1 .ooo 1.000 1 .ooo 1 .ooo 1 .ooo 0.000 0.000 0.000 0.000 0.000 0.000 0.000 0.000 0.000 0.000
two populations of V. s. solitarius. Intertaxon differences were absent between V. s. solitarius and V. s. alticola, modest between V. s. cassinii and V. s. solitarius (D = 0.0030 + 0.00046) and between V. s. cassinii and V. s. alticola (D = 0.0033 f 0.0007 l), and pronounced in all three comparisons involving V. s. plumbeus (D = 0.0294 f 0.00023 vs. V. s. cassinii, 0.0283 f 0.0056 vs. V. s. solitarius, and 0.0288 k 0.00097 vs. V. s. alticola). Values for Nei’s D in all four comparisons of Vireo jlavifrons with different subspecies of Vireo solitarius were also high: D = 0.05 15 f 0.00137 vs. V. s. cassinii, 0.0743 f 0.00127 vs. V. s. plumbeus, 0.0430 + 0.00424 vs. V. s. solitarius, and 0.0470 vs. V. s. alticola.
GENETIC POPULATION STRUCTURE AND GENE FLOW
Wright’s F,, statistic for all 23 populations of V. solitarius was 0.289. Therefore, 29% of the ge- netic variation present was distributed among populations, indicating significant fragmenta- tion. Calculation of F,, in population subsets yielded relatively low values within V. s. cassinii (O.OSS), V. s. plumbeus (O.OSO), and V: s. soli- tarius (0.033). When pairs of subspecies were combined, relatively low F,, values still occurred in V. s. cassinii + V. s. solitarius (0.070) and in V. s. solitarius + V. s. alticola (0.032). In sharp contrast, overall mean F, = 0.289 when only V. s. cassinii and V. s. plumbers were analyzed, pointing to the major source of the genetic frag- mentation. As anticipated, Acon, which is nearly fixed at alternative alleles between K s. cassinii and V. s. plumbeus, had the highest F, (0.980) of any locus and thus contributed most signifi- cantly to the overall F, value. The second highest F,, (0.119) was found at 6-Pgd.
With Wright’s (195 1) formula, Nm equalled 0.62 over all populations of V. solitarius. An identical estimate of gene flow, equivalent to ap- proximately one migrant per two generations, was obtained for the subset V. s. cassinii + V. s. plumbeus, the two most divergent populations. All other estimates of Nm were substantially higher: 4.30 immigrants per generation within Y s. cassinii, 4.75 within V. s. plumbeus, and 7.33 within V. s. solitarius. Combining either V. s. cassinii with V. s. solitarius, or V. s. solitarius with V. s. alticola, yielded similar numbers of immigrants per generation, 3.32 and 7.56, re- spectively. Thus, according to Wright’s method, gene flow is considerably restricted between the two phenotypically contrasting forms in the western United States. Under the assumption of both genetic and demographic equilibrium, Slat- kin’s (1985a, 1985b) rare allele method pointed to variable and much higher rates of gene flow in the Solitary Vireo, with Nm estimated at from two (Minnesota) to 35 (Clover), with a mean over all populations of 12 immigrants per generation (Table 4).
DENDROGRAMS AND MULTIDIMENSIONAL SCALING PLOTS
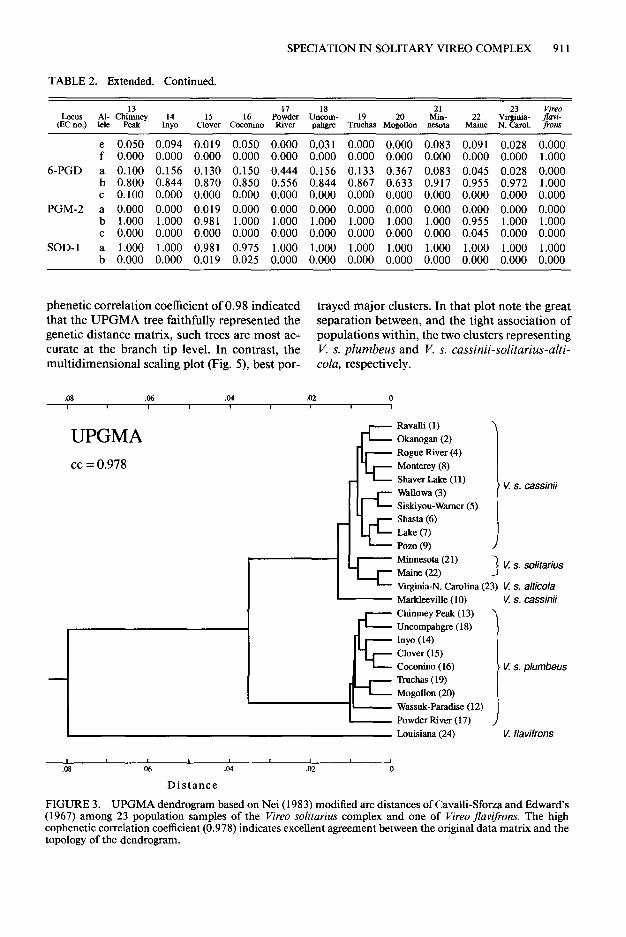
Both the UPGMA (Fig. 3) and Neighbor-joining (Fig. 4) trees show: (a) the outgroup, V.flavifrons, segregated at a large distance from all popula- tions of K solitarius; (b) all populations of K s. plumbers in a distinct major cluster; (c) all pop- ulations of V. s. cassinii, both populations of V. s. solitarius (except for Minnesota in the N-J tree), and the single population of V. s. alticola in a second major cluster; and (d) miniscule branch lengths separating individual populations within each major cluster. Although the very high co-
SPECIATION IN SOLITARY VIREO COMPLEX 911
TABLE 2. Extended. Continued.
13 Locus Al- Chimney 14
(EC no.) lele Peak Inyo
; 6-PGD a
b C
PGM-2 a b C
SOD- 1 :
0.050 0.094 0.019 0.050 0.000 0.03 1 0.000 0.000 0.083 0.091 0.028 0.000 0.000 0.000 0.000 0.000 0.000 0.000 0.000 0.000 0.000 0.000 0.000 1 .ooo 0.100 0.156 0.130 0.150 0.444 0.156 0.133 0.367 0.083 0.045 0.028 0.000 0.800 0.844 0.870 0.850 0.556 0.844 0.867 0.633 0.917 0.955 0.972 1 .ooo 0.100 0.000 0.000 0.000 0.000 0.000 0.000 0.000 0.000 0.000 0.000 0.000 0.000 0.000 0.019 0.000 0.000 0.000 0.000 0.000 0.000 0.000 0.000 0.000 1.000 1 .ooo 0.981 1 .ooo 1 .ooo 1 .ooo 1 .ooo 1 .ooo 1 .ooo 0.955 1.000 1 .ooo 0.000 0.000 0.000 0.000 0.000 0.000 0.000 0.000 0.000 0.045 0.000 0.000 1 .ooo 1 .ooo 0.981 0.975 1 .ooo 1 .ooo 1.000 1 .ooo 1 .ooo 1.000 1 .ooo 1 .ooo 0.000 0.000 0.019 0.025 0.000 0.000 0.000 0.000 0.000 0.000 0.000 0.000
phenetic correlation coefficient of 0.98 indicated trayed major clusters. In that plot note the great that the UPGMA tree faithfully represented the separation between, and the tight association of genetic distance matrix, such trees are most ac- populations within, the two clusters representing curate at the branch tip level. In contrast, the V. s. plumbeus and V. s. cassinii-solitarius-alti- multidimensional scaling plot (Fig. 5) best por- cola, respectively.
.08 .sm .04 .02 0 I I I 1 I I a I
UPGMA
cc = 0.978
Ravalli (1) okanogan (2) Rogue River (4) Monterey (8) Shaver Lake (11) Wallowa (3) Siskiyou-Warner (5) Shasta (6)
Lake (7) Pozn (9)
V s. cassinii
J Minnesota (21) Maine (22) 3
K s. solitarius
Virginia-N. Carolina (23) V. s. alticola - Markleeville (10)
-E
Chimney Peak (13) Uncompahgre (18) Inyo (14) Clover (15) Cwonino (16) Truchas (19) Mogollon (20) Wassuk-Paradise (12) Powder River (17)
I Louisiana (24) K flavifrons
I
.08 I , I I I I I
.06 .04 .02 0
Distance
V s. cassinii
1/. s. plumbeus
FIGURE 3. UPGMA dendrogram based on Nei (1983) modified arc distances of Cavalli-Sforza and Edward’s (1967) among 23 population samples of the Vireo solitarius complex and one of Vireo flavifons. The high cophenetic correlation coefficient (0.978) indicates excellent agreement between the original data matrix and the topology of the dendrogram.


914 NED K. JOHNSON
TABLE 4. Number and average frequency of private alleles and estimates of gene flow in populations of Vireo solitarius. See Table 1 for sample size of each population. Average sample size was 14.6. Only pop- ulations with private alleles were included in the anal- ysis.
Ravalli 4 0.024 Okanogan 1 0.045 Rogue River Lake :
0.036 0.028
Shaver Lake 1 0.025 Wassuk-Paradise 1 0.07 1 Chimney Peak 2 0.075 Inyo 1 0.063 Clover 1 0.019 Uncompahgre 1 0.03 1 Minnesota 1 0.083 Mean 1.5 0.0455
22.02 6.34 9.86
16.23 20.31 2.57 2.31 3.26
34.96 13.26 1.89
12.092
= Nm, = Nm corrected for sample size.
Because of its proximity to the Wassuk-Par- adise sample of V. s. plumbeus in western Ne- vada, placement of the small sample (3 birds) of K s. cassinii from Markleeville was of unusual interest. In the UPGMA tree this sample fell somewhat outside the principal cluster of V. s. cassinii. In the MDS plot, however, Markleeville is clearly included within that taxon.
DISCUSSION AND CONCLUSIONS
GENETIC VARIATION, POPULATION STRUCTURE, AND GENE PLOW
The overall level of genetic variability in I’. so- litarius (Hobs. = 3.9%) is lower than the value of 5.3% given in the most recent compilation by Barrowclough (1983). Moreover, the values for V. s. alticola (2.3%) and V. s. plumbeus (3.5%) are both significantly lower than that for V. s. cassinii (4.40/o), possibly indicating past popula- tion bottlenecks (Nei et al. 1975). Excluding V. s. alticola, which was represented by only a single sample area, each of the three other taxa was remarkably uniform, reflecting an overall cohe- siveness and essential lack of genetic population structure. Such intra-taxon uniformity stands in sharp contrast to the abrupt genetic discontinuity between V. s. plumbeus and the other forms.
Gene flow estimates for many populations of the V. solitarius complex are comparable to other recent figures (Zink and Remsen 1986; Rockwell and Barrowclough 1987; Johnson and Marten 1988, 1991) and are in keeping with Barrow-
clough and Johnson’s (1988) conclusion that North American temperate zone birds are char- acterized by moderate to large effective popu- lation sizes and significant levels of gene how. Nonetheless, several aspects of the gene flow es- timates provided here are perplexing. First, the contrast between values provided by Wright’s formula versus Slatkin’s rare allele method re- mains to be explained. Second, the geographic occurrence of private alleles, whose frequency forms the basis for the rare allele method, ap- pears to be stochastic. That such unique alleles are sensitive to weak selection (Slatkin 1985b) implies a vulnerability to random extinction with an unknown consequence to gene flow estimates. Third, values of Nm calculated by the rare allele approach vary widely, from 2-35. Although such variance in estimates could reflect real differ- ences in gene flow among populations, several (e.g., Ravalli and Clover at 22 and 35, respec- tively) are probably unrealistically high. A likely explanation is that some populations of vireos are neither in demographic nor genetic equilib- rium, an important assumption of the rare allele approach. Evidence for demographic non-equi- librium is seen clearly in I’. s. plumbeus. In recent decades this form has vigorously expanded its nesting distribution westwardly (Johnson 1994) an incursion that continues. Another source of unusually high estimates of gene flow could be the use of data from allozymes. Mitton (1994), for example, summarized evidence from studies of organisms as diverse as horseshoe crabs, oys- ters, and coniferous trees in which DNA markers pointed to much greater population differentia- tion than did allozymes, suggesting significantly less gene flow than indicated by the latter meth- od. Indeed, in some examples the allozyme re- sults cited by Mitton (1994) pointed to substan- tial gene flow among certain populations where genetic contact would have been impossible. One pair of taxa analyzed here, V. s. solitarius and V. s. cassinii, may illustrate the phenomenon de- scribed by Mitton (1994). Although both forms are very similar allozymically, Murray et al. (1994, Table 3) reported tallies of mtDNA base substitutions equivalent to 4.7%, suggesting sig- nificant genetic subdivision between these taxa. This value is intermediate between levels of se- quence difference derived from comparisons of two other species pairs, the (Black-whiskered Vireo [V. altiloquus] vs. Red-eyed Vireo [V. oli- vaceus], 4.0%) and (White-eyed Vireo [V. gri-
SPECIATION IN SOLITARY VIREO COMPLEX 915
Siskiyou-Warner (5)
K s. cassinii
- Okanogan (2)
r Maine (22)
Virginia-North Carolina (23)
- Markleeville (10)
V: s. solitarius
l! s. akicda
K s. cassinii
Powder River (17)
Chimney Peak (13)
Wassuk-Paradise (12
Mogollon (20) _
V. s. plumbeus
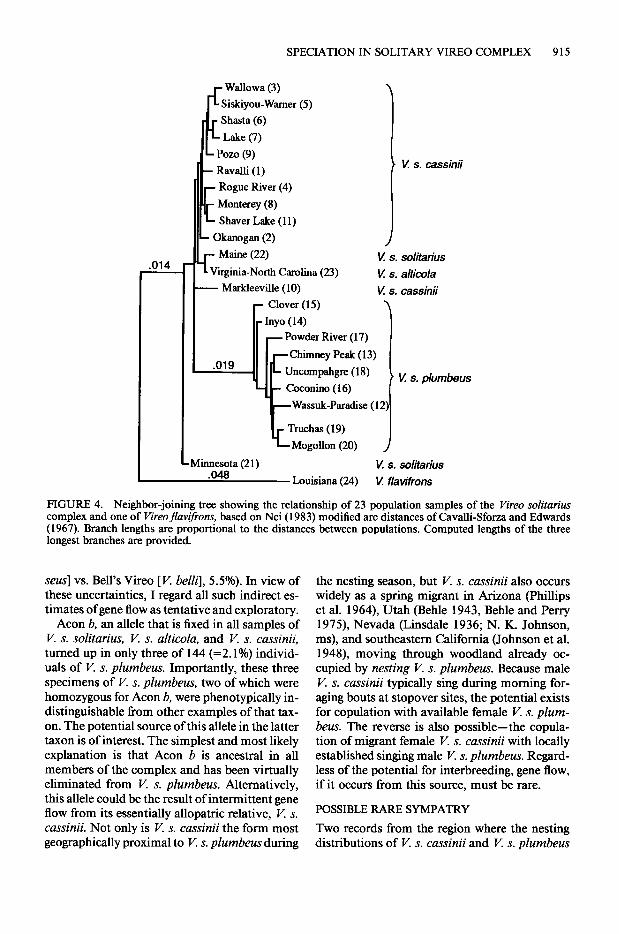
FIGURE 4. Neighbor-joining tree showing the relationship of 23 population samples of the Vireo solitarius complex and one of Vireoflavifrons, based on Nei (1983) modified arc distances of Cavalli-Sforza and Edwards (1967). Branch lengths are proportional to the distances between populations. Computed lengths of the three longest branches are provided.
Minnesota (21) ^*A K s. solitarius .ww Louisiana (24) K flaviffons
seus] vs. Bell’s Vireo [V. belli], 5.5%). In view of these uncertainties, I regard all such indirect es- timates of gene flow as tentative and exploratory.
Acon b, an allele that is fixed in all samples of V. s. solitarius, V. s. alticola, and V. s. cassinii, turned up in only three of 144 (=2.1%) individ- uals of V. s. phmbeus. Importantly, these three specimens of V. s. plumbeus, two of which were homozygous for Acon b, were phenotypically in- distinguishable from other examples of that tax- on. The potential source of this allele in the latter taxon is of interest. The simplest and most likely explanation is that Acon b is ancestral in all members of the complex and has been virtually eliminated from V. s. plumbeus. Alternatively, this allele could be the result of intermittent gene flow from its essentially allopatric relative, K s. cassinii. Not only is V. s. cassinii the form most geographically proximal to V. s. plumbeus during
the nesting season, but V. s. cassinii also occurs widely as a spring migrant in Arizona (Phillips et al. 1964), Utah (Behle 1943, Behle and Perry 1975), Nevada (Linsdale 1936; N. K. Johnson, ms), and southeastern California (Johnson et al. 1948), moving through woodland already oc- cupied by nesting V. s. plumbeus. Because male F’. s. cassinii typically sing during morning for- aging bouts at stopover sites, the potential exists for copulation with available female F! s. plum- beus. The reverse is also possible-the copula- tion of migrant female l’. s. cassinii with locally established singing male V. s. plumbeux Regard- less of the potential for interbreeding, gene flow, if it occurs from this source, must be rare.
POSSIBLE RARE SYMPATRY
Two records from the region where the nesting distributions of V. s. cassinii and V. s. plumbeus
916 NED K. JOHNSON
D i
m e n s 1 0 n
I
1
0
-1
-2
* V s solitarius
@
. .
2 V s. alticola
V: s. cassinii
V. s. plumbeus
I -1 0
Dimension II
1
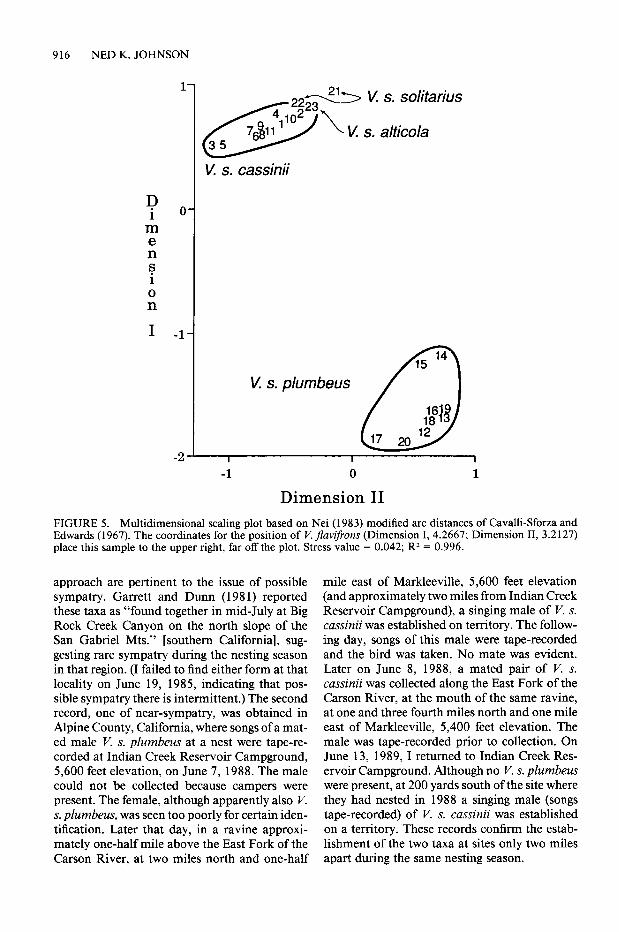
FIGURE 5. Multidimensional scaling plot based on Nei (1983) modified arc distances of Cavalli-Sforza and Edwards (1967). The coordinates for the position of V. fruvifrons (Dimension I, 4.2667; Dimension II, 3.2127) place this sample to the upper right, far off the plot. Stress value = 0.042; R2 = 0.996.
approach are pertinent to the issue of possible mile east of Markleeville, 5,600 feet elevation sympatry. Garrett and Dunn (198 1) reported (and approximately two miles from Indian Creek these taxa as “found together in mid-July at Big Reservoir Campground), a singing male of V. s. Rock Creek Canyon on the north slope of the cassinii was established on territory. The follow- San Gabriel Mts.” [southern California], sug- ing day, songs of this male were tape-recorded gesting rare sympatry during the nesting season and the bird was taken. No mate was evident. in that region. (I failed to find either form at that Later on June 8, 1988, a mated pair of I’. s. locality on June 19, 1985, indicating that pos- cassinii was collected along the East Fork of the sible sympatry there is intermittent.) The second Carson River, at the mouth of the same ravine, record, one of near-sympatry, was obtained in at one and three fourth miles north and one mile Alpine County, California, where songs of a mat- east of Markleeville, 5,400 feet elevation. The ed male V. s. plumbeus at a nest were tape-re- male was tape-recorded prior to collection. On corded at Indian Creek Reservoir Campground, June 13, 1989, I returned to Indian Creek Res- 5,600 feet elevation, on June 7, 1988. The male ervoir Campground. Although no V. s. plumbeus could not be collected because campers were were present, at 200 yards south of the site where present. The female, although apparently also I’. they had nested in 1988 a singing male (songs s. plumbeus, was seen too poorly for certain iden- tape-recorded) of V. s. cassinii was established tification. Later that day, in a ravine approxi- on a territory. These records confirm the estab- mately one-half mile above the East Fork of the lishment of the two taxa at sites only two miles Carson River, at two miles north and one-half apart during the same nesting season.
SPECIATION IN SOLITARY VIREO COMPLEX 917
TAXONOMIC AND EVOLUTIONARY STATUS OF POPULATIONS
This study focussed on the genetic relationships of V. s. cassinii and V. s. plumbeus, with limited comparative data from the eastern North Amer- ican forms, V. s. solitarius and V. s. alticola. A mean genetic distance of 0.0294 between V. s. cassinii and V. s. plumbeus is comparable to the value 0.0440 distinguishing species of other birds and is much higher than the mean value of 0.0048 for subspecies (Barrowclough 1980). Further- more, the cohesive population structure within each taxon, the lack of known intergrades where nesting populations closely approach, and the probability of at least limited sympatry further support the view that I? s. cassinii and V. s. plumbeus are independent evolutionary units. I conclude that V. s. plumbeus is a fully-differen- tiated species.
In contrast, V. s. cassinii and V. s. solitarius are similar allozymically and would not deserve species status based solely on their degree of pro- tein divergence. Nonetheless, these taxa differ substantially in number of base pair substitu- tions in mtDNA (Murray et al. 1994) and show a degree of differentiation equivalent to that of at least two other definite species pairs of Vireo (see above). Furthermore, vocal differences are profound between V. s. cassinii and I? s. soli- tarius, leading Borror (1972) to state that “The songs of the eastern and western members of this species . . . are different enough to be from two different species.” Although Barlow and Hardy (198 1) and James (198 1) corroborated this dif- ference, the latter author concluded that such “does not indicate that eastern and western birds may be separate species.” Moreover, James (198 1) reported intermediate birds, apparently defined wholly on the basis of male song, in northern British Columbia. It is evident that populations in this supposed region of contact between V. s. cassinii and V. s. solitarius need intensive study before firm conclusions can be reached on the nature of their interaction and possible species status. Detailed data on voice and displays, supported by analysis of specimens of mated pairs, would be especially relevant.
ACKNOWLEDGMENTS
G. F. Barrowclough, J. G. Groth and R. M. Zink helped collect specimens. M. M. Frelow, J. A. Marten and C. Cicero assisted with laboratory and computer analyses. R. E. Jones provided important field supplies. J. C. Barlow, S. W. Cardiff, C. V. Davis, D. M. Finch, K.
Garrett, R. S. Hoffman, J. P. Hubbard, R. E. Johnson, C. D. Littlefield, M. G. Raphael, J. V. Remsen, S. Rothstein. the late P. D. Skaar. J. Verner and W. W. Weathers provided valuable information on the local occurrence of vireos and their habitats. C. Cicero read and improved a draft of the manuscript. Permits for the collection of specimens were issued by the U. S. Fish and Wildlife Service and by state wildlife officials in Arizona. California. Colorado, Maine, Minnesota, Montana, Nevada, New Mexico, North Carolina, Or- egon, Virginia and Washington. Travel and laboratory expenses were met in part by grants from the Com- mittee on Research, University of California, Berkeley; the Annie M. Alexander Fund, Museum of Vertebrate Zooloav: and from the National Science Foundation through grants DEB-79-20694 and DEB-79-09807. I sincerely appreciate the assistance of these individuals and agencies.
LITERATURE CITED
AMERICAN ORNITHOLOGISTS’ UNION. 1886. The code of nomenclature and check-list of North American birds. American Ornithologists’ Union, New York.
AMERICAN ORNITHOLOGIS-~~’ UNION. 1889. Check- list of North American birds. Abridged ed. Amer- ican Ornithologists’ Union, New York.
AMERICAN ORNITHOLOGISTS’ UNION. 1895. Check- list of North American birds. 2nd ed. American Ornithologists’ Union, New York.
AMERICAN ORNITHOLCGISTS’ UNION. 19 10. Check- list of North American birds. 3rd ed. American Ornithologists’ Union, New York.
AMERICAN ORNITHOLOGISTS UNION. 193 1. Check- list of North American birds. 4th ed. American Ornithologists’ Union, Lancaster, PA.
AMERICAN ORNITHOLOGISTS’ UNION. 1957. Check- list of North American birds. 5th ed. American Ornithologists’ Union, Baltimore, MD.
AMERICAN ORNITHOLOGISTS’ UNION. 1983. Check- list of North American birds. 6th ed. American Ornithologists’ Union, Washington, DC.
BARLOW, J. C., AND J. W. HARDY. 198 1. Songs of the vireos and their allies. Ara Records, 1615 NW 14th Ave., Gainesville, FL.
BA~~~OWCLQUGH, G. F. 1980. Genetic and phenotyp- ic differentiation in a wood warbler (genus Den- droica) hvbrid zone. Auk 97:655-668.
BARROW&&H, G. F. 1983. Biochemical studies of microevolutionary processes, p. 223-261. In A. H. Brush and G. A. Clark, Jr. [eds.], Perspectives in ornithology. Cambridge Univ. Press, Cam- bridge, U.K.--
BARROWCLOUGH. G. F.. AND N. K. JOHNSON. 1988. Genetic structure of North American birds. Acta XIX Congressus Internationalis Ornithologici 2:1630-1638, 1669-1673.
BEHLE, W. H. 1943. Birds of Pine Valley Mountain region, southwestern Utah. Bull. Univ. Utah, Biol. Ser. 7:1-85.
BEHLE, W. H., AND M. L. PERRY. 1975. Utah birds: check-list, seasonal and ecological occurrence charts and guides to bird finding. Utah Museum of Nat- ural History, Univ. of Utah, Salt Lake City, UT.
BORROR, D. J. 1972. Yellow-green Vireo in Arizona, with notes on vireo songs. Condor 74:80-86.
918 NED K. JOHNSON
CAVALLI-SFORZA, L. L., AND A.W.F. EDWARDS 1967. Phylogenetic analysis: models and estimation pro- cedures. Evolution 21550-570.
CICERO, C., AND N. K. JOHNSON. 1992. Genetic dif- ferentiation between populations of Hutton’s Vir- eo (Aves: Vireonidae) in disjunct allopatry. South- west. Nat. 37:344-348.
Garrett, K., and J. Dunn. 1981. Birds of southern California, status and distribution. Los Angeles Audubon Society.
GORMAN, G. C., AND J. RENZI, JR. 1979. Genetic distance and heterozygosity estimates in electro- phoretic studies: effects of sample size. Copeia 19791242-249.
HARRIS, H., AND D. A. HOPK~NSON. 1976. Handbook of enzyme electrophoresis in human genetics. North Holland Publishing, Amsterdam.
JAMES, R. D. 198 1. Factors affecting variation in the primary song of North American solitary vireos (Aves: Vireonidae). Can. J. Zool. 59:2001-2009.
JO&SON, D. H., M. D. BRYANT, AND A. H. MILLER. 1948. Vertebrate animals of the Providence Mountains area of California. Univ. Calif. Publ. Zool. 48:221-376.
JOHNSON, N. K. 1994. Pioneering and natural ex- pansion ofbreeding distributions in western North American birds, p. 27-44. In J. R. Jehl and N. K. Johnson [eds.], A century of avifaunal change in western North America. Stud. Avian Biol. No. 15.
JOHNSON, N. K., AND J. A. MARTEN. 1988. Evolu- tionary genetics of flycatchers. II. Differentiation in the Emoidonax di#icilis comdex. Auk 105: 177- 191. _ _ -
JOHNSON, N. K., AND J. A. MARTEN. 1991. Evolu- tionary genetics of flycatchers. III. Variation in Emuidonax hammondii (Aves: Tyrannidae). Can. J. Zool. 691232-238. -
JOHNSON. N. K.. AND R. M. ZONK. 1985. Genetic evidence for relationships among the Red-eyed, Yellow-green, and Chivi Vireos. Wilson Bull. 97: 421-435.
JOHNSON, N. K., R. M. ZINK, G. F. BARROWCLXXJGH, AND J. A. MARTEN. 1984. Suggested techniques for modem avian systematics. Wilson Bull. 96: 543-560.
JOHNSON, N. K., R. M. ZONK, AND J. A. MARTEN. 1988. Genetic evidence for relationships in the avian family Vireonidae. Condor 90:428445.
KUMAR, S., K. TAMURA, AND M. NEI. 1993. MEGA. Molecular Evolutionary Genetic Analysis, version 1 .O 1. Institute of Molecular Evolutionary Genet- ics, Pennsylvania State University, University Park, PA.
LESSA, E. P. 1990. Multidimensional analysis of geo- graphic genetic structure. Syst. Zool. 39:242-252.
LINSDALE. J. M. 1936. The birds of Nevada. Pacific Coast Avifauna 23:1-145.
MIT~ON, J. B. 1994. Molecular approaches to pop- ulation bioloav. Annu. Rev. Ecol. Svst. 25:45-69.
MONROE, B. L., Ji:, AND C. G. SIBLEY. 1993. A world checklist of birds. Yale Univ. Press, New Haven, CT.
MURRAY, B. W., W. B. MCGILLIVRAY, J. C. BARLOW, R. N. BEECH, AND C. STROBECK. 1994. The use
of cytochrome B sequence variation in estimation of phylogeny in the Vireonidae. Condor 96: 1037- 1054.
NEI, M. 1975. Molecular population genetics and evolution. North Holland Publishing, Amster- dam.
NEI, M. 1978. Estimation of average heterozygosity and genetic distance from a small number of in- dividuals. Genetics 89:583-590.
NEI, M. 1983. Accuracy of estimated phylogenetic trees from molecular data. II. Gene frequency data. J. Mol. Evol. 19:153-170.
NEI, M., T. MARUYAMA, AND R. CHAKRAB ORTY. 1975. The bottleneck effect and genetic variability in populations. Evolution 29: l-10.
PHILLIPS, A. R., J. MARSHALL, AND G. MONSON. 1964. The birds of Arizona. Univ. of Ariz. Press, Tuc- son, AZ.
ROCKWELL, R. F., AND G. F. BARROWCLOUGH. 1987. Gene flow and the genetic structure ofpopulations, p. 223-255. In F. Cooke and P. A. Buckley [eds.], Avian genetics: a population and ecological ap- proach. Academic Press, Orlando, FL.
ROGERS, J. S. 1972. Measures of genetic similarity and genetic distance. Univ. Texas Stud. Genet. 7:145-153.
SAITOU, N., AND M. NEI. 1987. The neighbor-joining method: a new method for reconstructing-phyla- genetic trees. Mol. Biol. Evol. 4:406-425.
SELA~ER, R. K., M. H. SMITH, S. Y. YANG, W. E. JOHNSON, AND J. B. GENTRY. 197 1. Biochemical polymorphism and systematics in the genus Pero- myscus. I. Variation in the old-field mouse (Pero- myscuspolionotus). Univ. Texas Stud. Genet. 6:49- 90.
SIBLEY, C. G., AND B. L. MONROE, JR. 1990. Distri- bution and taxonomy of birds of the world. Yale Univ. Press, New Haven, CT.
SLATKIN, M. 198 1. Estimating levels of gene flow in natural nonulations. Genetics 99:323-335.
SLATXIN, M.‘ lb85a. Rare alleles as indicators of gene how. Evolution 39153-65.
SLATKIN, M. 1985b. Gene flow in natural popula- tions. Annu. Rev. Ecol. Syst. 16:393-430.
SLATK~N, M., AND N. H. BARTON. 1989. A compar- ison of three indirect methods for estimating av- erage levels ofgene flow. Evolution 43: 1349-l 368.
SPSS I&. 1990. SPSS User’s Guide. SPSS Inc., Chi- cago.
SWOFFDRD, D. L., AND R. B. SELANDER. 198 1. BIO- SYS-1: a FORTRAN program for the compre- hensive analysis of genetic data in population ge- netics and systematics. J. Hered. 72:281-283.
WILLIS, E. 0. 199 1. Sibling species of greenlets (Vi- reonidae) in southern Brazil. Wilson Bull. 103: 559-567.
WRIGHT, S. 1951. The genetical structure of popu- lations. Ann. Eugen. 15:323-354.
WRIGHT, S. 1965. The interpretation of population structure by F-statistics with special regard to sys- tems of mating. Evolution 19:395-420.
WRIGHT, S. 1978.-Evolution and the genetics of nat- ural populations. Vol. 4. Variability within and
SPECIATION IN SOLITARY VIREO COMPLEX 919
among natural populations. Univ. of Chicago Press, ZINK, R. M., AND J. V. REMSEN, JR. 1986. Evolu- Chicago, IL. tionary processes and patterns of geographic vari-
YANG, S. Y., AND J. L. PATTON. 198 1. Genie vari- ation in birds, p. l-69. In R. F. Johnston [ed.], ability and differentiation in the Galapagos finch- Current ornithology. Vol. 4. Plenum Press, New es. Auk 98:230-242. York.