Special Purpose Example Financial Statements · special purpose financial statements and to provide...
42
Example special purpose financial statements Grant Thornton CLEARR Example Pty Ltd For the year ended 30 June 2016
Transcript of Special Purpose Example Financial Statements · special purpose financial statements and to provide...
Example special purpose financial statements Grant Thornton CLEARR Example Pty Ltd For the year ended 30 June 2016

Example special purpose financial statements For the year ended 30 June 2016
© 2016 Grant Thornton Australia Limited. All rights reserved.
Page intentionally left blank.
Example special purpose financial statements i For the year ended 30 June 2016
© 2016 Grant Thornton Australia Limited. All rights reserved.
Foreword
Welcome to the June 2016 edition of Example Financial Statements.
The preparation of financial statements in accordance with Australian Accounting Standards (AASBs) and International Financial Reporting Standards (IFRSs) is challenging. Each year new standards and amendments are published by the Australian Accounting Standards Board and the International Accounting Standards Board with the potential to significantly impact both the presentation of the primary financial statements and the accompanying disclosures.
The annual (and interim) reporting period ending 30 June 2016 represents relatively little change in terms of accounting standards which is a welcome relief for many Australian businesses. However, businesses need to be wary of the next oncoming wave of changes currently unfolding in the next few years with the completion of the various major projects by the International Accounting Standards Board (IASB) and Australian Accounting Standards Board. Recently issued major standards on revenue (IFRS/AASB 15) and financial instruments (IFRS/AASB 9) become effective for annual reporting periods on or after 1 January 2018. While the effective date of 2018 may seem a long way off, we strongly encourage businesses to start evaluating these new standards sooner rather than later as they may have significant impact on many entities.
Businesses also need to pay attention to the new Leases Standard (IFRS/AASB 16 Leases) which brings in all leases on balance sheet, with exemptions for short-term leases and leases of low value assets. Even though this standard does not come into effective until 1 January 2019, its impact is likely to be significant for many businesses. It will affect most companies that report under Australian Accounting Standards and are involved in leasing, and will have a substantial impact on businesses that lease ‘big-ticket’ assets such as property and high value equipment. Whatever your views on the new Leases Standard, businesses would be well advised to start an impact analysis sooner rather than later.
Should preparers like to discuss these financial reporting changes or recent developments and how these may impact upon your business, please contact your local Grant Thornton Australia relationship partner, or the National Accounting Support (NAS) Team on [email protected]. There are also various publications (Technical Accounting Alerts [TA Alerts] and IFRS Quarterly Newsletters [IFRS News]) on our website www.grantthornton.com.au which provide an overview of these developments.
Example special purpose financial statements ii For the year ended 30 June 2016
© 2016 Grant Thornton Australia Limited. All rights reserved.
The June 2016 edition of Example Financial Statements is based on the recent Grant Thornton International publication, however has been tailored to suit the Australian financial reporting and regulatory environment. This publication is intended to illustrate the ‘look and feel’ of Australian special purpose financial statements and to provide a realistic example of their presentation.
This publication is based on the activities and results of Grant Thornton CLEARR Example Pty Ltd (‘the Company’); a fictional IT entity that has been preparing special purpose financial statements for several years. The form and content of these financial statements depend of course on the activities and transactions of each entity. Our objective in preparing Example Financial Statements was to illustrate one possible approach to financial reporting by an entity engaging in transactions that are ‘typical’ across a range of non-specialist sectors.
However, as with any example, this illustration does not envisage every possible transaction and cannot therefore be regarded as comprehensive. Management are responsible for the fair presentation of financial statements and therefore may find other approaches more appropriate in their specific circumstances.
These Example Financial Statements have been reviewed and updated to reflect changes in Australian Accounting Standards that are effective for the year ending 30 June 2016. However, no account has been taken of any new developments published after 1 April 2016. The Grant Thornton website contains any updates that are relevant for 30 June 2016 financial statements including our Technical Accounting Alert titled “Accounting standards issued but not yet effective for June 2016”.
Using this publication In some areas alternative presentation and disclosure approaches are also illustrated in the appendices.
For further guidance on the Standards and Interpretations applied, reference is made to Australian Accounting Standards and Interpretations sources throughout the document on the left hand side of each page.
The use of this publication is not a substitute for the use of a comprehensive and up-to-date disclosure checklist to ensure completeness of the disclosures in the financial statements.
Matt Adam-Smith National Managing Partner – Service Lines Grant Thornton Australia Limited April 2016

Example special purpose financial statements iii For the year ended 30 June 2016
© 2016 Grant Thornton Australia Limited. All rights reserved.
Contents
Page
Foreword i
Directors’ Report 1
Auditor’s Independence Declaration 5
Statement of Profit or Loss and Other Comprehensive Income 7
Statement of Financial Position 9
Statement of Changes in Equity 11
Statement of Cash Flows 12
Notes to the Financial Statements 14 1 Statement of significant accounting policies 14 2 Revenue 25 3 Other income 25 4 Result for the year 26 5 Income tax expense 26 6 Auditor’s remuneration 26 7 Dividends 26 8 Cash and cash equivalents 27 9 Trade and other receivables 27 10 Inventories 27 11 Other assets 27 12 Property, plant and equipment 28 13 Intangible assets 28 14 Trade and other payables 29 15 Borrowings 29 16 Taxation 29 17 Employee benefits 30 18 Provisions 30 19 Issued capital 30 20 Reserves 31 21 Capital and leasing commitments 31 22 Contingent assets and contingent liabilities 32 23 Cash flow information 32 24 Events after the reporting date 32 25 Company details 33
Directors’ Declaration 34
Independent Auditor’s Report 35

Example special purpose financial statements iv For the year ended 30 June 2016
© 2016 Grant Thornton Australia Limited. All rights reserved.
Page intentionally left blank.
Example special purpose financial statements 1 For the year ended 30 June 2016
© 2016 Grant Thornton Australia Limited. All rights reserved.
Directors’ Report
Your Directors present their report on Grant Thornton CLEARR Pty Ltd (‘the Company’ or ‘Grant Thornton CLEARR’) for the financial year ended 30 June 2016.
Directors The names of the Directors in office at any time during or since the end of the year are:
• Mr Blake Smith • Ms Beth King • Mr Simon Murphy • Mrs Alison French • Mr William Middleton (appointed 28 May 2016)
Directors have been in office since the start of the financial year to the date of this report unless otherwise stated.
Review of operations and financial results A review of the operations of the Company during the financial year and the results of those operations found that the changes in market demand and competition have seen an increase in sales of 7.1% to $472,149,000. The profit of the Company for the financial year after providing for income tax amounted to $32,757,000 (2015: $21,849,000).
Significant changes in state of affairs No significant changes in the Company’s state of affairs occurred during the financial year.
Principal activities The principal activities of the Company during the financial year were:
• sale, customisation and integration of IT and telecommunication systems • maintenance of IT and telecommunications systems; and • internet based selling hardware and software products
There have been no significant changes in the nature of these activities during the year.
Events arising since the end of the reporting period No matters or circumstances have arisen since the end of the financial year which significantly affected or may significantly affect the operations of the Company, the results of those operations, or the state of affairs of the Company in future financial years.
CA 298(1)
CA 299(2)(b)
CA 300(1)(c)
CA 299(1)(ii)
CA 299(1)(b)
CA 299(1)(c)
CA 299(1)(d)
Example special purpose financial statements 2 For the year ended 30 June 2016
© 2016 Grant Thornton Australia Limited. All rights reserved.
Future development, prospects and business strategies Based on the expected growth in online sales, as predicted by a number of prominent economic commentators, and the demand from customers for the latest technology, we expect significant increase in online sales for next few years. We have a number of strategies to benefit from this growth, including:
• upgrading our online sales portal • further expanding our distribution networks • further reducing manufacturing costs; and • a strong marketing campaign
We have instigated an urgent upgrade of the Company’s website and online sales portal. We have allocated $3.8m for this upgrade, which will mostly be funded from retained earnings. We expect the upgrade to be completed in the next twelve (12) months, to be followed by a strong marketing campaign.
We are continually considering ways of reducing the Company’s cost of manufacturing. The Directors are giving consideration to a major upgrade of production-line technology to improve efficiency. The Directors expect to receive the results of a feasibility study within the next six (6) months, and the various options will be considered at that time.
Looking ahead, the Company is currently engaged in a competitive tender process to supply the Australian government $50m IT and telecommunication systems and offer integration and maintenance services over the next ten (10) years. If successful, manufacture and supply are expected to commence next year, significantly affecting future revenues. Given both the competitive nature of the tender, and the fact that the process is ongoing, we have utilised the exemption in s299A(3) and have not disclosed further details about the possible impact of the potential contract on the Company’s business strategy and future prospects. We are relying on the exemption on the basis that disclosure of the potential financial impact on the Company arising from the outcome of the tender process is premature, and would be likely to result in other tender competitors gaining a commercial advantage, which would jeopardise the Company’s prospects.
The material business risks faced by the Company that are likely to have an effect on the financial prospects of the Company, and how the Company manages these risks include:
1 Reduction in demand from overseas markets – given our reliance on the United Kingdom, USA and other overseas markets, this could have a significant impact on our financial results. Based on the views of prominent economic commentators, we do not anticipate any significant slowdown in these overseas economies for the next few years, but are currently investigating the option of expanding our sales into other emerging economies, such as China and India; and
2 Technological obsolescence – given the rapidly changing environment in which the Company operates, this could have a very significant impact on our financial results. We address this risk through investment in research and development and by constantly monitoring the market. With competitors constantly seeking to enter our market with improved designs, we see this risk increasing in the future.
Environmental issues The Company’s operations are not regulated by any significant environmental regulations under a law of the Commonwealth or of a state or territory of Australia.
CA 299(1)(e) CA 299(3)
CA 299(1)(f)
Example special purpose financial statements 3 For the year ended 30 June 2016
© 2016 Grant Thornton Australia Limited. All rights reserved.
Dividends paid or recommended Dividends paid or declared since the start of the financial year are as follows:
• a fully franked dividend of $4,000,000 was paid during the year as recommended in last year’s report
Options No options over issued shares or interests in the Company were granted during or since the end of the financial year and there were no options outstanding at the date of this report.
Indemnities given to, and insurance premiums paid for, auditors and officers Insurance of officers During the year, Grant Thornton CLEARR paid a premium to insure officers of the Company. The officers of the Company covered by the insurance policy include all Directors.
The liabilities insured are legal costs that may be incurred in defending civil or criminal proceedings that may be brought against the officers in their capacity as officers of the Company, and any other payments arising from liabilities incurred by the officers in connection with such proceedings, other than where such liabilities arise out of conduct involving a wilful breach of duty by the officers or the improper use by the officers of their position or of information to gain advantage for themselves or someone else to cause detriment to the Company.
Details of the amount of the premium paid in respect of insurance policies are not disclosed as such disclosure is prohibited under the terms of the contract.
The Company has not otherwise, during or since the end of the financial year, except to the extent permitted by law, indemnified or agreed to indemnify any current or former officer of the Company against a liability incurred as such by an officer.
Indemnity of auditors The Company has agreed to indemnify its auditors, Grant Thornton, to the extent permitted by law, against any claim by a third party arising from the Company’s breach of its agreement. The indemnity requires the Company to meet the full amount of any such liabilities including a reasonable amount of legal costs.
Proceedings on behalf of Company No person has applied for leave of Court to bring proceedings on behalf of the Company or intervene in any proceedings to which the Company is a party for the purpose of taking responsibility on behalf of the Company for all or any part of those proceedings.
The Company was not a party to any such proceedings during the year.
Auditor’s Independence Declaration A copy of the Auditor’s Independence Declaration as required under section 307C of the Corporations Act 2001 is set out on page 5 and forms part of this Directors’ Report.
CA 300(1)(a)
CA 300(1)(e)
CA 300(1)(g),(8)(b), (9)(a), (f)
CA 300(9)(c)
CA 300(1)(g),(8)(b), (9)(a), (f)
CA 300(14)
CA 298(1)(c)
Example special purpose financial statements 4 For the year ended 30 June 2016
© 2016 Grant Thornton Australia Limited. All rights reserved.
Rounding of amounts Grant Thornton CLEARR is a type of Company referred to in the Australian Securities and Investments Commission (ASIC) Corporations (Rounding in Financial/Directors’ Reports) Instrument 2016/191 and therefore the amounts contained in this report and in the financial report have been rounded to the nearest $1,000, or in certain cases, to the nearest dollar.
Signed in accordance with a resolution of the Board of Directors:
Blake Smith Director
30 September 2016
ASIC Corporations (Rounding in Financial/ Directors’ Reports
CA 298(2)(a)
CA 298(2)(c)
CA 298(2)(b)
Example special purpose financial statements 5 For the year ended 30 June 2016
© 2016 Grant Thornton Australia Limited. All rights reserved.
Auditor’s Independence Declaration
Auditor’s Independence Declaration To the Directors of Grant Thornton CLEARR Example Pty Ltd In accordance with the requirements of section 307C of the Corporations Act 2001, as lead auditor for the audit of Grant Thornton CLEARR Example Pty Ltd for the year ended 30 June 2016, I declare that, to the best of my knowledge and belief, there have been:
a No contraventions of the auditor independence requirements of the Corporations Act 2001 in relation to the audit; and
b No contraventions of any applicable code of professional conduct in relation to the audit.
GRANT THORNTON AUDIT PTY LTD Chartered Accountants
A B Partner Partner – Audit & Assurance
Sydney, 30 September 2016
Grant Thornton Audit Pty Ltd ACN 130 913 594 a subsidiary or related entity of Grant Thornton Australia Ltd ABN 41 127 556 389 ‘Grant Thornton’ refers to the brand under which the Grant Thornton member firms provide assurance, tax and advisory services to their clients and/or refers to one or more member firms, as the context requires. Grant Thornton Australia Ltd is a member firm of Grant Thornton International Ltd (GTIL). GTIL and the member firms are not a worldwide partnership. GTIL and each member firm is a separate legal entity. Services are delivered by the member firms. GTIL does not provide services to clients. GTIL and its member firms are not agents of, and do not obligate one another and are not liable for one another’s acts or omissions. In the Australian context only, the use of the term ‘Grant Thornton’ may refer to Grant Thornton Australia Limited ABN 41 127 556 389 and its Australian subsidiaries and related entities. GTIL is not an Australian related entity to Grant Thornton Australia Limited. Liability limited by a scheme approved under Professional Standards Legislation. Liability is limited in those States where a current scheme applies.
Level 17, 383 Kent Street Sydney NSW 2000 Correspondence to: Locked Bag Q800 QVB Post Office Sydney NSW 1230 T +61 2 8297 2400 F +61 2 9299 4445 E [email protected] W www.grantthornton.com.au
Example special purpose financial statements 6 For the year ended 30 June 2016
© 2016 Grant Thornton Australia Limited. All rights reserved.
Guidance Note: Statement of Profit or Loss and Other Comprehensive Income AASB 101 Presentation of Financial Statements permits the statement of profit or loss and other comprehensive income to be presented:
• in a single statement: a statement of profit or loss and other comprehensive income, or • in two statements: a statement of profit or loss and a statement of comprehensive income
The Example Financial Statements illustrate a statement of profit or loss and other comprehensive income (ie a single statement). A two statement presentation is shown in Appendix B of our Example Listed Public Financial Statements.
This statement of profit or loss and other comprehensive income format illustrates an example of the ‘nature of expense method’. See Appendix A of our Example Listed Public Financial Statements for a format illustrating the ‘function of expense’ or ‘cost of sales’ method.
AASB 101 requires the entity to disclose reclassification adjustments and related tax effects relating to components of other comprehensive income either on the face of the statement or in the notes.
In this example, the entity presents reclassification adjustments and current year gains and losses relating to other comprehensive income on the face of the statement of profit or loss and other comprehensive income (AASB 101.92). An entity may instead present reclassification adjustments in the notes, in which case the components of other comprehensive income are presented after any related reclassification adjustments (AASB 101.94).
According to AASB 101.90, an entity shall disclose the amount of income tax relating to each component of other comprehensive income either on the face of the statement of profit or loss and other comprehensive income or in the notes. In this example the entity presents components of other comprehensive income before tax with one amount shown for the aggregate amount of income tax relating to all components of other comprehensive income (AASB 101.91(b)). Alternatively, the entity may present each component of other comprehensive income net of related tax effects (AASB 101.91(a)). If the tax effects of each component of other comprehensive income are not presented on the face of the statement this information shall be presented in the notes (see Note 20).
Example special purpose financial statements 7 For the year ended 30 June 2016
© 2016 Grant Thornton Australia Limited. All rights reserved.
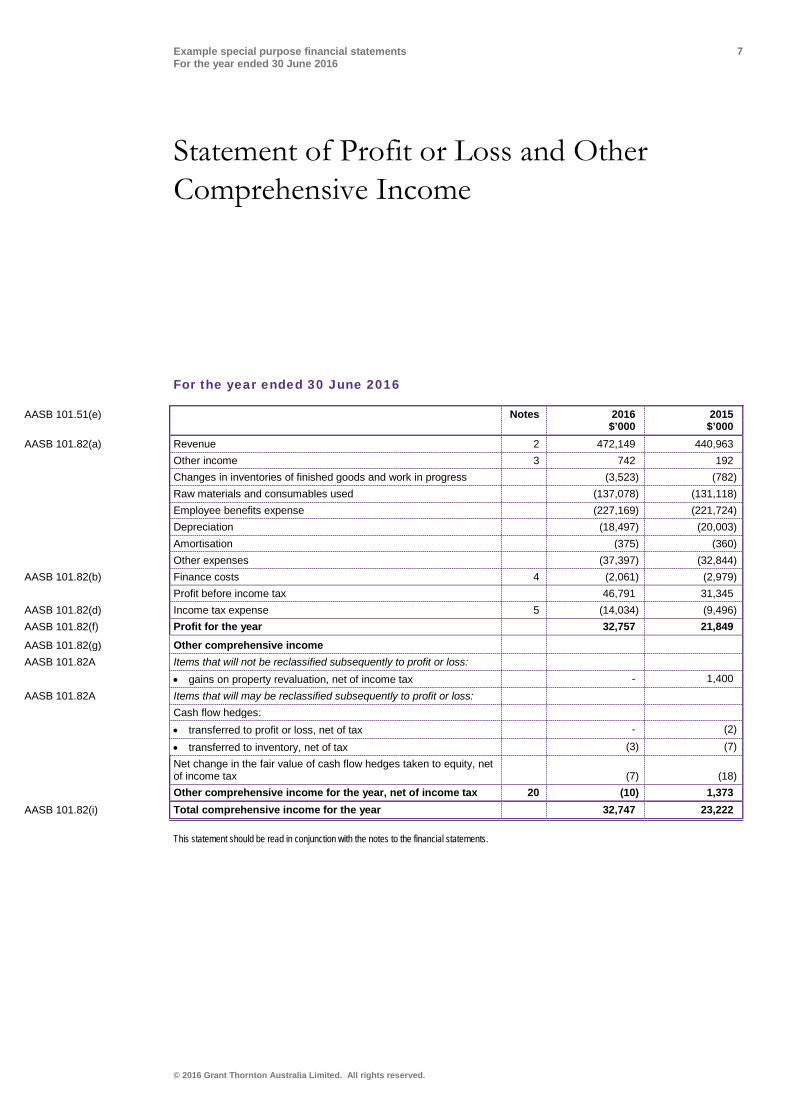
Statement of Profit or Loss and Other Comprehensive Income
For the year ended 30 June 2016
AASB 101.51(e) Notes 2016 2015 $’000 $’000 AASB 101.82(a) Revenue 2 472,149 440,963 Other income 3 742 192 Changes in inventories of finished goods and work in progress (3,523) (782) Raw materials and consumables used (137,078) (131,118) Employee benefits expense (227,169) (221,724) Depreciation (18,497) (20,003) Amortisation (375) (360) Other expenses (37,397) (32,844) AASB 101.82(b) Finance costs 4 (2,061) (2,979) Profit before income tax 46,791 31,345 AASB 101.82(d) Income tax expense 5 (14,034) (9,496) AASB 101.82(f) Profit for the year 32,757 21,849
AASB 101.82(g) Other comprehensive income AASB 101.82A Items that will not be reclassified subsequently to profit or loss: • gains on property revaluation, net of income tax - 1,400 AASB 101.82A Items that will may be reclassified subsequently to profit or loss: Cash flow hedges: • transferred to profit or loss, net of tax - (2) • transferred to inventory, net of tax (3) (7) Net change in the fair value of cash flow hedges taken to equity, net
of income tax (7) (18) Other comprehensive income for the year, net of income tax 20 (10) 1,373 AASB 101.82(i) Total comprehensive income for the year 32,747 23,222
This statement should be read in conjunction with the notes to the financial statements.
Example special purpose financial statements 8 For the year ended 30 June 2016
© 2016 Grant Thornton Australia Limited. All rights reserved.
Guidance Note: Statement of Financial Position The statement of financial position complies with AASB 101.
The statement of financial position includes a current/non-current distinction. When presentation based on liquidity is reliable and more relevant, the entity can choose to present the statement of financial position in order of liquidity (AASB 101.60). The entity will then not present a current / non-current distinction in the statement of financial position. However the disclosure requirements for amounts expected to be recovered or settled before or after twelve (12) months must still be applied (AASB 101.61).
These Example Financial Statements use the terminology in AASB 101; however an entity may use other titles (eg balance sheet) for the primary financial statements (AASB 101.10).
Example special purpose financial statements 9 For the year ended 30 June 2016
© 2016 Grant Thornton Australia Limited. All rights reserved.
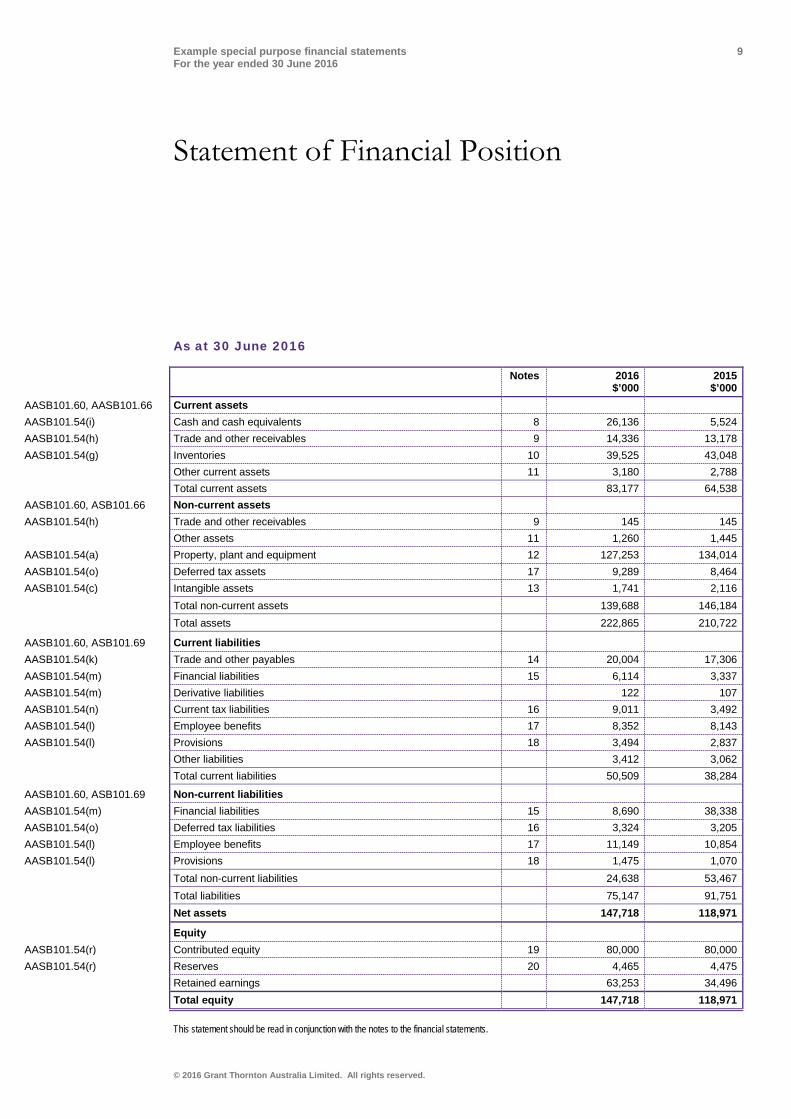
Statement of Financial Position
As at 30 June 2016
Notes 2016 2015 $’000 $’000 AASB101.60, AASB101.66 Current assets AASB101.54(i) Cash and cash equivalents 8 26,136 5,524 AASB101.54(h) Trade and other receivables 9 14,336 13,178 AASB101.54(g) Inventories 10 39,525 43,048 Other current assets 11 3,180 2,788 Total current assets 83,177 64,538 AASB101.60, ASB101.66 Non-current assets AASB101.54(h) Trade and other receivables 9 145 145 Other assets 11 1,260 1,445 AASB101.54(a) Property, plant and equipment 12 127,253 134,014 AASB101.54(o) Deferred tax assets 17 9,289 8,464 AASB101.54(c) Intangible assets 13 1,741 2,116 Total non-current assets 139,688 146,184 Total assets 222,865 210,722
AASB101.60, ASB101.69 Current liabilities AASB101.54(k) Trade and other payables 14 20,004 17,306 AASB101.54(m) Financial liabilities 15 6,114 3,337 AASB101.54(m) Derivative liabilities 122 107 AASB101.54(n) Current tax liabilities 16 9,011 3,492 AASB101.54(l) Employee benefits 17 8,352 8,143 AASB101.54(l) Provisions 18 3,494 2,837 Other liabilities 3,412 3,062 Total current liabilities 50,509 38,284
AASB101.60, ASB101.69 Non-current liabilities AASB101.54(m) Financial liabilities 15 8,690 38,338 AASB101.54(o) Deferred tax liabilities 16 3,324 3,205 AASB101.54(l) Employee benefits 17 11,149 10,854 AASB101.54(l) Provisions 18 1,475 1,070 Total non-current liabilities 24,638 53,467 Total liabilities 75,147 91,751 Net assets 147,718 118,971
Equity AASB101.54(r) Contributed equity 19 80,000 80,000 AASB101.54(r) Reserves 20 4,465 4,475 Retained earnings 63,253 34,496 Total equity 147,718 118,971
This statement should be read in conjunction with the notes to the financial statements.
Example special purpose financial statements 10 For the year ended 30 June 2016
© 2016 Grant Thornton Australia Limited. All rights reserved.
Guidance Note: Statement of Changes in Equity Entities may present the required reconciliations for each component of other comprehensive income either in the statement of changes in equity or in the notes to the financial statements (AASB 101.106(d)(ii) and AASB 101.106A).
These Example Financial Statements present the reconciliations for each component of other comprehensive income in the notes to the financial statements (see Note 20.2). This reduces duplicated disclosures and presents a clearer picture of the overall changes in equity.
Example special purpose financial statements 11 For the year ended 30 June 2016
© 2016 Grant Thornton Australia Limited. All rights reserved.
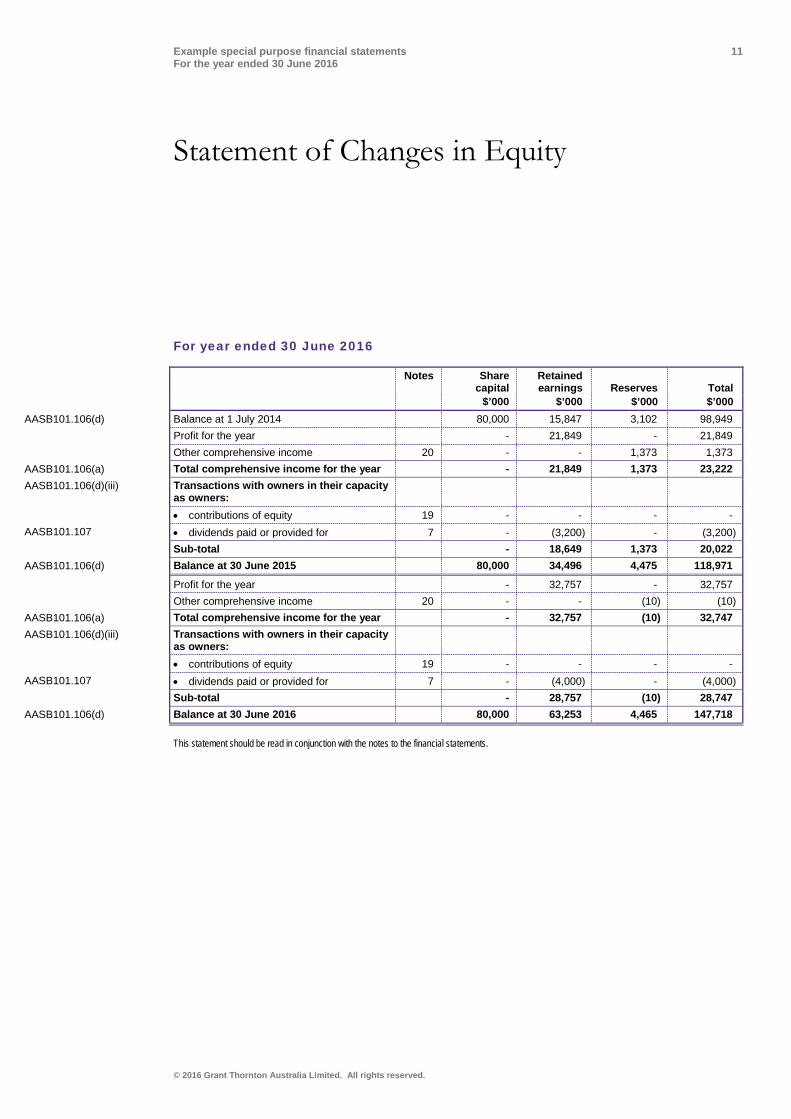
Statement of Changes in Equity
For year ended 30 June 2016
Notes
Share capital
Retained earnings Reserves Total
$’000 $’000 $’000 $’000 AASB101.106(d) Balance at 1 July 2014 80,000 15,847 3,102 98,949 Profit for the year - 21,849 - 21,849 Other comprehensive income 20 - - 1,373 1,373 AASB101.106(a) Total comprehensive income for the year - 21,849 1,373 23,222 AASB101.106(d)(iii) Transactions with owners in their capacity
as owners: • contributions of equity 19 - - - - AASB101.107 • dividends paid or provided for 7 - (3,200) - (3,200) Sub-total - 18,649 1,373 20,022 AASB101.106(d) Balance at 30 June 2015 80,000 34,496 4,475 118,971
Profit for the year - 32,757 - 32,757 Other comprehensive income 20 - - (10) (10) AASB101.106(a) Total comprehensive income for the year - 32,757 (10) 32,747 AASB101.106(d)(iii) Transactions with owners in their capacity
as owners: • contributions of equity 19 - - - - AASB101.107 • dividends paid or provided for 7 - (4,000) - (4,000) Sub-total - 28,757 (10) 28,747 AASB101.106(d) Balance at 30 June 2016 80,000 63,253 4,465 147,718
This statement should be read in conjunction with the notes to the financial statements.
Example special purpose financial statements 12 For the year ended 30 June 2016
© 2016 Grant Thornton Australia Limited. All rights reserved.
Guidance Note: Statement of Cash Flows This format illustrates the direct method of determining operating cash flows (AASB 107.18(a)).
An entity may also determine the operating cash flows using the indirect method (AASB 107.18(b)).

Example special purpose financial statements 13 For the year ended 30 June 2016
© 2016 Grant Thornton Australia Limited. All rights reserved.
Statement of Cash Flows
For year ended 30 June 2016
Notes 2016 2015 $’000 $’000 AASB107.10 Cash flows from operating activities AASB107.14(a) Receipts from customers 516,249 484,305 AASB107.14(c-d) Payments to suppliers and employees (444,440) (429,638) AASB107.31 Interest received 1,084 540 AASB107.14(b) Other revenue 391 48 AASB107.31 Finance costs (1,976) (2,917) AASB107.14(f) Income tax paid (9,216) (8,461) Net cash provided by operating activities 23a 62,092 43,877 AASB107.10 Cash flows from investing activities AASB107.16(b) Proceeds from sale of property, plant and equipment 1,511 250 AASB107.16(a) Purchase of property, plant and equipment (12,275) (3,048) Proceeds from release of security deposits 155 - Net cash (used in) investing activities (10,609) (2,798)
AASB107.10 Cash flows from financing activities AASB107.17(d) Repayment of borrowings (26,871) (37,089) AASB107.31 Dividends paid (4,000) (3,200) Net cash (used in) financing activities (30,871) (40,289) Net change in cash and cash equivalents held 20,612 790 Cash and cash equivalents at beginning of financial year 5,524 4,734 Cash and cash equivalents at end of financial year 8 26,136 5,524
This statement should be read in conjunction with the notes to the financial statements.
Example special purpose financial statements 14 For the year ended 30 June 2016
© 2016 Grant Thornton Australia Limited. All rights reserved.
Notes to the Financial Statements
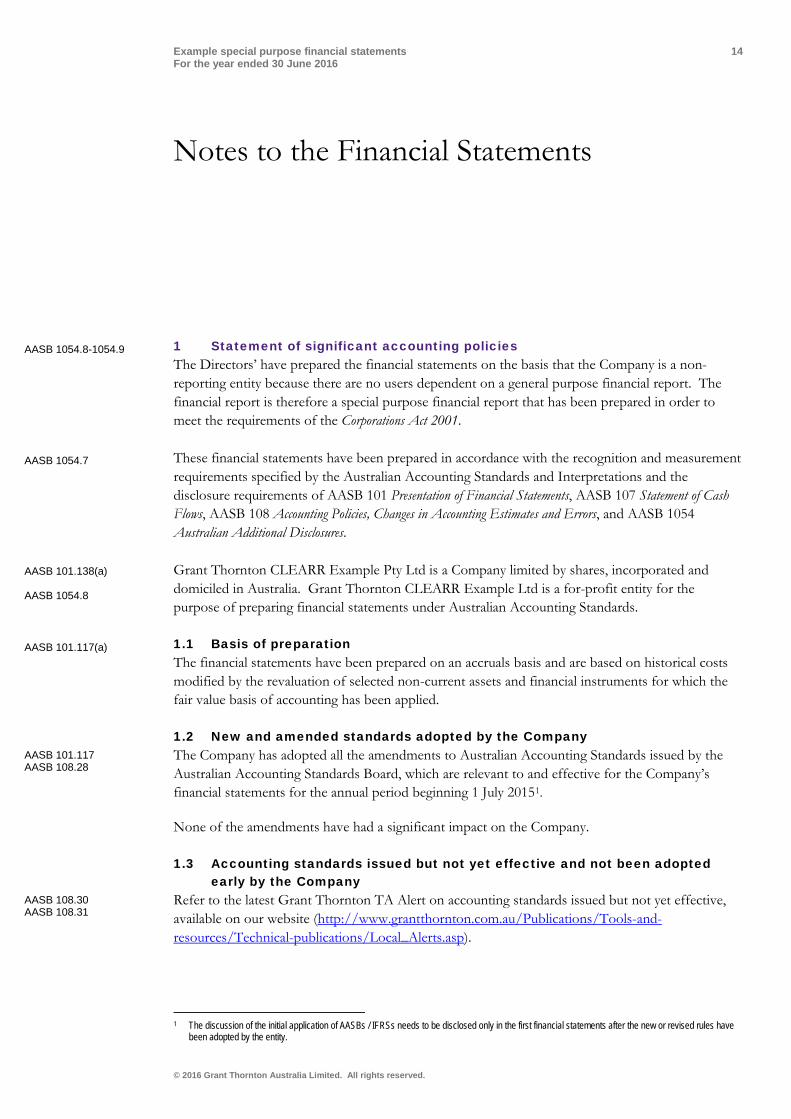
1 Statement of significant accounting policies The Directors’ have prepared the financial statements on the basis that the Company is a non-reporting entity because there are no users dependent on a general purpose financial report. The financial report is therefore a special purpose financial report that has been prepared in order to meet the requirements of the Corporations Act 2001.
These financial statements have been prepared in accordance with the recognition and measurement requirements specified by the Australian Accounting Standards and Interpretations and the disclosure requirements of AASB 101 Presentation of Financial Statements, AASB 107 Statement of Cash Flows, AASB 108 Accounting Policies, Changes in Accounting Estimates and Errors, and AASB 1054 Australian Additional Disclosures.
Grant Thornton CLEARR Example Pty Ltd is a Company limited by shares, incorporated and domiciled in Australia. Grant Thornton CLEARR Example Ltd is a for-profit entity for the purpose of preparing financial statements under Australian Accounting Standards.
1.1 Basis of preparation The financial statements have been prepared on an accruals basis and are based on historical costs modified by the revaluation of selected non-current assets and financial instruments for which the fair value basis of accounting has been applied.
1.2 New and amended standards adopted by the CompanyThe Company has adopted all the amendments to Australian Accounting Standards issued by the Australian Accounting Standards Board, which are relevant to and effective for the Company’s financial statements for the annual period beginning 1 July 20151.
None of the amendments have had a significant impact on the Company.
1.3 Accounting standards issued but not yet effective and not been adopted early by the Company
Refer to the latest Grant Thornton TA Alert on accounting standards issued but not yet effective, available on our website (http://www.grantthornton.com.au/Publications/Tools-and-resources/Technical-publications/Local_Alerts.asp).
1 The discussion of the initial application of AASBs / IFRSs needs to be disclosed only in the first financial statements after the new or revised rules have
been adopted by the entity.
AASB 1054.8-1054.9
AASB 1054.7
AASB 101.138(a) AASB 1054.8
AASB 101.117(a)
AASB 101.117 AASB 108.28
AASB 108.30 AASB 108.31
Example special purpose financial statements 15 For the year ended 30 June 2016
© 2016 Grant Thornton Australia Limited. All rights reserved.
The following is a summary of the material accounting policies adopted by the Company in the preparation of the financial statements. The accounting policies have been consistently applied, unless otherwise stated.
1.4 Significant accounting policies Income tax The income tax expense / (revenue) for the year comprises current income tax expense / (income) and deferred tax expense / (income). Current and deferred income tax expense / (income) is charged or credited directly to other comprehensive income instead of the profit or loss when the tax relates to items that are credited or charged directly to other comprehensive income.
Current tax Current income tax expense charged to the profit or loss is the tax payable on taxable income calculated using applicable income tax rates enacted, or substantially enacted, as at reporting date. Current tax liabilities / (assets) are therefore measured at the amounts expected to be paid to / (recovered from) the relevant taxation authority.
Current tax assets and liabilities are offset where a legally enforceable right of set-off exists and it is intended that net settlement or simultaneous realisation and settlement of the respective asset and liability will occur.
Deferred tax Deferred income tax expense reflects movements in deferred tax asset and deferred tax liability balances during the year as well unused tax losses.
Deferred tax assets and liabilities are ascertained based on temporary differences arising between the tax bases of assets and liabilities and their carrying amounts in the financial statements. Deferred tax assets also result where amounts have been fully expensed but future tax deductions are available. No deferred income tax will be recognised from the initial recognition of an asset or liability, excluding a business combination, where there is no effect on accounting or taxable profit or loss.
Deferred tax assets and liabilities are calculated at the tax rates that are expected to apply to the period when the asset is realised or the liability is settled, based on tax rates enacted or substantively enacted at reporting date. Their measurement also reflects the manner in which management expects to recover or settle the carrying amount of the related asset or liability.
Deferred tax assets relating to temporary differences and unused tax losses are recognised only to the extent that it is probable that future taxable profit will be available against which the benefits of the deferred tax asset can be utilised.
Deferred tax assets and liabilities are offset where a legally enforceable right of set-off exists, the deferred tax assets and liabilities relate to income taxes levied by the same taxation authority on either the same taxable entity or different taxable entities where it is intended that net settlement or simultaneous realisation and settlement of the respective asset and liability will occur in future periods in which significant amounts of deferred tax assets or liabilities are expected to be recovered or settled.
Example special purpose financial statements 16 For the year ended 30 June 2016
© 2016 Grant Thornton Australia Limited. All rights reserved.
Inventories Inventories are measured at the lower of cost and net realisable value. The cost of manufactured products includes direct materials, direct labour and an appropriate portion of variable and fixed overheads. Overheads are applied on the basis of normal operating capacity. Costs are assigned on the basis of weighted average costs.
Net realisable value represents the estimated selling price for inventories less all estimated costs of completion and costs necessary to make the sale.
Property, plant and equipment Each class of property, plant and equipment is carried at cost or fair value less, where applicable, any accumulated depreciation and impairment losses.
Property Freehold land and buildings are shown at their fair value (being the amount for which an asset could be exchanged between knowledgeable willing parties in an arm’s length transaction). Valuations are performed whenever the Directors believe there has been a material movement in the value of the assets.
Increases in the carrying amount arising on revaluation of land and buildings are credited to a revaluation reserve in equity. Decreases that offset previous increases of the same asset are charged against the related revaluation reserve directly in equity; all other decreases are charged to the statement of profit or loss and other comprehensive income.
Any accumulated depreciation at the date of revaluation is eliminated against the gross carrying amount of the asset and the net amount is restated to the revalued amount of the asset.
Plant and equipment Plant and equipment are measured at cost less depreciation and impairment losses.
The cost of fixed assets constructed within the Company includes the cost of materials, direct labour, borrowing costs and an appropriate proportion of fixed and variable overheads.
Subsequent costs are included in the asset’s carrying amount or recognised as a separate asset, as appropriate, only when it is probable that future economic benefits associated with the item will flow to the Company and the cost of the item can be measured reliably. All other repairs and maintenance are charged to the statement of profit or loss and other comprehensive income during the financial period in which they are incurred.
Depreciation The depreciable amount of all fixed assets including building and capitalised leased assets, but excluding freehold land, is depreciated on a straight line basis over their useful lives to the Company commencing from the time the asset is held ready for use. Leased assets and leasehold improvements are depreciated over the shorter of either the unexpired period of the lease or the estimated useful lives of the assets.
AASB 102.36(a)
AASB 116.73(a)-(c)
Example special purpose financial statements 17 For the year ended 30 June 2016
© 2016 Grant Thornton Australia Limited. All rights reserved.
The depreciation rates used for each class of depreciable assets are:
Class of fixed asset Depreciation rate Buildings: 2% Leasehold improvements: 10-33% Plant and equipment: 5-15% Leased plant and equipment: 10%
The assets’ residual values and useful lives are reviewed, and adjusted if appropriate, at each reporting period date.
An asset’s carrying amount is written down immediately to its recoverable amount if the asset’s carrying amount is greater than its estimated recoverable amount.
Gains and losses on disposals are determined by comparing proceeds with the carrying amount. These gains or losses are included in the statement of profit or loss and other comprehensive income.
When revalued assets are sold, amounts included in the revaluation reserve relating to that asset are transferred to retained earnings.
Leases Leases of fixed assets where substantially all the risks and benefits incidental to the ownership of the asset, but not the legal ownership, are transferred to entities in the Company are classified as finance leases.
Finance leases are capitalised by recording an asset and a liability at the lower of the amounts equal to the fair value of the leased property or the present value of the minimum lease payments, including any guaranteed residual values. Lease payments are allocated between the reduction of the lease liability and the lease interest expense for the period.
Leased assets are depreciated on a straight-line basis over the shorter of their estimated useful lives or the lease term.
Lease payments for operating leases, where substantially all the risks and benefits remain with the lessor, are charged as expenses in the periods in which they are incurred.
Lease incentives under operating leases are recognised as a liability and amortised on a straight-line basis over the life of the lease term.
Financial Instruments Initial recognition and measurement Financial instruments, incorporating financial assets and financial liabilities, are recognised when the entity becomes a party to the contractual provisions of the instrument. Trade date accounting is adopted for financial assets that are delivered within timeframes established by marketplace convention.
Example special purpose financial statements 18 For the year ended 30 June 2016
© 2016 Grant Thornton Australia Limited. All rights reserved.
Financial instruments are initially measured at fair value plus transactions costs where the instrument is not classified as at fair value through profit or loss. Transaction costs related to instrument classified as at fair value through profit or loss are expensed to profit or loss immediately. Financial instruments are classified and measured as set out below.
Effective interest rate method The effective interest method is a method of calculating the amortised cost of a financial asset and of allocating interest income over the relevant period. The effective interest rate is the rate that exactly discounts estimated future cash receipts through the expected life of the financial assets or, where appropriate, a shorter period.
Income is recognised on an effective interest rate basis for debt instruments other than those financial assets ‘at fair value through profit or loss’.
Classification and subsequent measurement Financial assets at fair value through profit or loss Financial assets are classified at fair value through profit or loss when they are held for trading for the purpose of short term profit taking, where they are derivatives not held for hedging purposes, or designated as such to avoid an accounting mismatch or to enable performance evaluation where a group of financial assets is managed by key management personnel on a fair value basis in accordance with a documented risk management or investment strategy. Realised and unrealised gains and losses arising from changes in fair value are included in profit or loss in the period in which they arise.
Loans and receivables Loans and receivables are non-derivative financial assets with fixed or determinable payments that are not quoted in an active market and are stated at amortised cost using the effective interest rate method.
Held-to-maturity investments These investments have fixed maturities, and it is the Company’s intention to hold these investments to maturity. Held-to-maturity investments held by the Company are stated at amortised cost using the effective interest rate method.
Available-for-sale financial assets Available-for-sale financial assets are non-derivative financial assets that are either designated as such or that are not classified in any of the other categories. They comprise investments in the equity of other entities where there is neither a fixed maturity nor fixed or determinable payments. They are held at fair value with changes in fair value taken through the financial assets reserve directly to other comprehensive income.
Financial liabilities Non-derivative financial liabilities (excluding financial guarantees) are subsequently measured at amortised cost using the effective interest rate method.
Fair value Fair value is determined based on current bid prices for all quoted investments. Valuation techniques are applied to determine the fair value for all unlisted securities, including recent arm’s length transactions, reference to similar instruments and option pricing models.
Example special purpose financial statements 19 For the year ended 30 June 2016
© 2016 Grant Thornton Australia Limited. All rights reserved.
Impairment of financial assets At each reporting date, the Company assesses whether there is objective evidence that a financial instrument has been impaired. In the case of available-for-sale financial instruments, a significant or prolonged decline in the value of the instrument is considered to determine whether impairment has arisen. Impairment losses are recognised in the statement of profit or loss and other comprehensive income.
The carrying amount of financial assets including uncollectible trade receivables is reduced by the impairment loss through the use of an allowance account. Subsequent recoveries of amounts previously written off are credited against the allowance account. Changes in the carrying amount of the allowance account are recognised in profit or loss.
With the exception of available-for-sale equity instruments, if, in a subsequent period, the amount of the impairment loss decreases and the decrease can be related objectively to an event occurring after the impairment was recognised, the previously recognised impairment loss is reversed through profit or loss to the extent the carrying amount of the investment at the date the impairment is reversed does not exceed what the amortised cost would have been had the impairment not been recognised.
In respect of available-for-sale equity instruments, any subsequent increase in fair value after an impairment loss is recognised directly in the financial assets reserve in other comprehensive income.
Derivative financial instruments Derivatives are initially recognised at fair value on the date of a derivative contract is entered into and are subsequently remeasured to their fair value at each reporting date. The accounting for subsequent changes in fair value depends on whether the derivative is designated as a hedging instrument, and if so, the nature of the item being hedged.
Derivatives are classified as current or non-current depending on the expected period of realisation.
Cash flow hedges Cash flow hedges are used to cover the Company’s exposure to variability in cash flows that is attributable to particular risk associated with a recognised asset or liability or a firm commitment which could affect income or expenses. The effective portion of the gain or loss on the hedging instrument is recognised directly in equity, whilst the ineffective portion is recognised in profit or loss. Amounts taken to equity are transferred out of equity and included in the measurement of the hedged transaction when the forecast transaction occurs.
Cash flow hedges are tested for effectiveness on a regular basis both retrospectively and prospectively to ensure that each hedge is highly effective and continues to be designated as a cash flow hedge. If the forecast transaction is no longer expected to occur, amounts recognised in equity are transferred to profit or loss.
If the hedging instrument is sold, terminated, expires, exercised without replacement or rollover, or if hedge becomes ineffective and is no longer a designated hedge, amounts previously recognised in equity remain in equity until the forecast transaction occurs.
Example special purpose financial statements 20 For the year ended 30 June 2016
© 2016 Grant Thornton Australia Limited. All rights reserved.
Derecognition Financial assets are derecognised where the contractual rights to receipt of cash flows expire or the asset is transferred to another party whereby the entity no longer has any significant continuing involvement in the risks and benefits associated with the asset. Financial liabilities are derecognised where the related obligations are either discharged, cancelled or expire. The difference between the carrying value of the financial liability extinguished or transferred to another party and the fair value of consideration paid, including the transfer of non-cash assets or liabilities assumed is recognised in profit or loss.
Impairment of non-financial assets At each reporting date, the Company reviews the carrying values of its tangible and intangible assets to determine whether there is any indication that those assets have been impaired. If such an indication exists, the recoverable amount of the asset, being the higher of the asset’s fair value less costs to sell and value in use, is compared to the asset’s carrying value. In assessing value in use, the estimated future cash flows are discounted to their present value using a pre-tax discount rate that reflects current market assessments of the time value of money and the risks specific to the asset for which the estimates of future cash flows have not been adjusted.
Any excess of the asset’s carrying value over its recoverable amount is expensed to the statement of profit or loss and other comprehensive income.
Impairment testing is performed annually for intangible assets with indefinite lives and intangible assets not yet available for use. Where it is not possible to estimate the recoverable amount of an individual asset, the Company estimates the recoverable amount of the cash-generating unit to which the asset belongs.
Intangible assets Intangible assets acquired as part of a business combination, other than goodwill, are initially measured at their fair value at the date of acquisition. Intangible assets acquired separately are initially recognised at cost. Intangible assets are subsequently measured at cost less amortisation and any impairment. The gains or losses recognised in profit or loss arising from derecognition of an intangible asset is measured as the difference between net disposal proceeds and the carrying amount of the intangible asset. The method and useful lives of finite life intangibles are reviewed annually. Changes in expected pattern of consumption or useful life are accounted for prospectively by changing the amortisation method or period.
Research and development Research costs are expensed in the period in which they are incurred. Development costs are capitalised when it is probable that the project will be a success considering its commercial and technical feasibility; the Company is able to use or sell the asset; the Company has sufficient resources; and intent to complete the development and its costs can be measured reliably. Capitalised development costs are amortised on a straight-line basis over the period of their expected benefit, being their finite life of ten (10) years.
Patents and trademarks Significant costs associated with patents and trademarks are deferred and amortised on a straight-line basis over the period of their expected benefit, being their finite life of ten (10) years.
AASB 138.118(a)-(b)
Example special purpose financial statements 21 For the year ended 30 June 2016
© 2016 Grant Thornton Australia Limited. All rights reserved.
Software Significant costs associated with software are deferred and amortised on a straight-line basis over the period of their expected benefit, being their finite life of five (5) years.
Employee benefits Short-term employee benefits Short-term employee benefits are benefits, other than termination benefits, that are expected to be settled wholly within twelve (12) months after the end of the period in which the employees render the related service. Examples of such benefits include wages and salaries, non-monetary benefits and accumulating sick leave. Short-term employee benefits are measured at the undiscounted amounts expected to be paid when the liabilities are settled.
Other long-term employee benefits The Company’s liabilities for annual leave and long service leave are included in other long-term benefits as they are not expected to be settled wholly within twelve (12) months after the end of the period in which the employees render the related service. They are measured at the present value of the expected future payments to be made to employees. The expected future payments incorporate anticipated future wage and salary levels, experience of employee departures and periods of service, and are discounted at rates determined by reference to market yields at the end of the reporting period on high quality corporate bonds2 that have maturity dates that approximate the timing of the estimated future cash outflows.
Any re-measurements arising from experience adjustments and changes in assumptions are recognised in profit or loss in the periods in which the changes occur.
The Company presents employee benefit obligations as current liabilities in the statement of financial position if the Company does not have an unconditional right to defer settlement for at least twelve (12) months after the reporting period, irrespective of when the actual settlement is expected to take place.
Post-employment benefits plans The Company provides post-employment benefits through defined contribution plans.
Defined contribution plans The Company pays fixed contributions into independent entities in relation to several state plans and insurance for individual employees. The Company has no legal or constructive obligations to pay contributions in addition to its fixed contributions, which are recognised as an expense in the period that relevant employee services are received.
Provisions Provisions are recognised when the Company has a legal or constructive obligation, as a result of past events, for which it is probable that an outflow of economic benefits will result and that outflow can be reliably measured.
2 There is a sufficiently observable, deep and liquid market in high quality Australian corporate bonds to satisfy the requirements in AASB 119 Employee
Benefits according to a study undertaken by Milliman Australia which was commissioned to undertake this work by the Group of 100 (G100). All major accounting firms in Australia, including Grant Thornton, provided input to this research throughout the research and methodology development process. Accordingly, all entities, other than not-for-profit public sector entities, are now required to use corporate bond rates (rather than government bond rates) when measuring other long-term employee benefits and defined benefit obligations to ensure compliance with AASB 119.83. Entities in the not-for-profit public sector will continue to use government bond rates as specifically required in paragraph Aus83.1 of AASB 119. For further information, refer to our TA Alert 2015-05 Change in discount rates used for measuring employee benefits.
Example special purpose financial statements 22 For the year ended 30 June 2016
© 2016 Grant Thornton Australia Limited. All rights reserved.
Provisions are measured using the best estimate of amounts required to settle the obligation at the end of the reporting period.
Cash and cash equivalents Cash comprises cash on hand and demand deposits. Cash equivalents are short-term, highly liquid investments that are readily convertible to known amounts of cash and which are subject to an insignificant risk of changes in value.
Bank overdrafts are shown within short-term borrowings in current liabilities on the statement of financial position.
Revenue Revenue is measured at the fair value of the consideration received or receivable after taking into account any trade discounts and volume rebates allowed. Any consideration deferred is treated as the provision of finance and is discounted at a rate of interest that is generally accepted in the market for similar arrangements. The difference between the amount initially recognised and the amount ultimately received is interest revenue.
Revenue from the sale of goods is recognised at the point of delivery as this corresponds to the transfer of significant risks and rewards of ownership of the goods and the cessation of all involvement in those goods.
Revenue relating to the provision of services is determined with reference to the stage of completion of the transaction at reporting date and where the outcome of the contract can be estimated reliably. Stage of completion is determined with reference to the services performed to date as a percentage of total anticipated services to be performed. Where the outcome cannot be estimated reliably, revenue is recognised only to the extent that related expenditure is recoverable.
Interest revenue is accrued on a time basis, by reference to the principal outstanding and at the effective interest rate applicable, which is the rate that exactly discounts estimated future cash receipts through the expected life of the financial asset to that asset’s net carrying amount.
All revenue is stated net of the amount of Goods and Services Tax (GST).
Borrowing costs Borrowing costs directly attributable to the acquisition, construction or production of assets that necessarily take a substantial period of time to prepare for their intended use or sale, are added to the cost of those assets, until such time as the assets are substantially ready for their intended use of sale.
All other borrowing costs are recognised in the statement of profit or loss and other comprehensive income in the period in which they are incurred.
Goods and Services Tax (GST) Revenues, expenses and assets are recognised net of the amount of GST, except where the amount of GST incurred is not recoverable from the Australian Taxation Office. In these circumstances, the GST is recognised as part of the cost of acquisition of the asset or as part of an item of the expense. Receivables and payables in the statement of financial position are shown inclusive of GST.
AASB 107.46
AASB 118.35(a)
Example special purpose financial statements 23 For the year ended 30 June 2016
© 2016 Grant Thornton Australia Limited. All rights reserved.
Cash flows are presented in the statement of cash flows on a gross basis, except for the GST component of investing and financing activities, which are disclosed as operating cash flows.
Rounding of amounts The Company has applied the relief available to it under ASIC Corporations (Rounding in Financial/Directors’ Reports) Instrument 2016/191 and accordingly, amounts in the financial statements and Directors’ Report have been rounded off to the nearest $1,000, or in certain cases, the nearest dollar.
Significant management judgement in applying accounting policies The following are significant management judgements in applying the accounting policies of the Company that have the most significant effect on the financial statements. Critical estimation uncertainties are described in Note 1.4.
Revenue The Company commits to extensive after-sales support in its service segment. The amount of the selling price associated with the subsequent servicing agreement is deferred and recognised as revenue over the period during which the service is performed. The nature of services provided depends on the customer’s use of the products. Therefore management needs to exercise significant judgement in determining when to recognise income from after-sales services. In particular, this considers historical experience and requires knowledge of the customers and the markets in which the Company operates.
Internally generated software and research costs Management monitors progress of internal research and development projects by using a project management system. Significant judgement is required in distinguishing research from the development phase. Development costs are recognised as an asset when all the criteria are met, whereas research costs are expensed as incurred.
To distinguish any research-type project phase from the development phase, it is the Company’s accounting policy to also require a detailed forecast of sales or cost savings expected to be generated by the intangible asset. The forecast is incorporated into the Company’s overall budget forecast as the capitalisation of development costs commences. This ensures that managerial accounting, impairment testing procedures and accounting for internally-generated intangible assets are based on the same data.
Management also monitors whether the recognition requirements for development costs continue to be met. This is necessary as the economic success of any product development is uncertain and may be subject to future technical problems after the time of recognition.
Leases In applying the classification of leases in AASB 117, management considers its leases of IT equipment as finance lease arrangements. In some cases, the lease transaction is not always conclusive, and management uses judgement in determining whether the lease is a finance lease arrangement that transfers substantially all the risks and rewards incidental to ownership.
ASIC Corporations (Rounding in Financial/ Directors’ Reports) Instrument 2016/191 AASB 101.51(e)
AASB 101.122
Example special purpose financial statements 24 For the year ended 30 June 2016
© 2016 Grant Thornton Australia Limited. All rights reserved.
Deferred tax assets The assessment of the probability of future taxable income in which deferred tax assets can be utilised is based on the Company’s latest approved budget forecast, which is adjusted for significant non-taxable income and expenses and specific limits to the use of any unused tax loss or credit. The tax rules in the numerous jurisdictions in which the Company operates are also carefully taken into consideration. If a positive forecast of taxable income indicates the probable use of a deferred tax asset, especially when it can be utilised without a time limit, that deferred tax asset is usually recognised in full. The recognition of deferred tax assets that are subject to certain legal or economic limits or uncertainties is assessed individually by management based on the specific facts and circumstances.
Held-to-maturity investments Management has confirmed its intention and ability to hold the bonds that are classified as held-to-maturity investments until they mature. This is based on the Company’s current liquidity and capital maintenance requirements and plans.
Estimation uncertainty When preparing the financial statements management undertakes a number of judgements, estimates and assumptions about recognition and measurement of assets, liabilities, income and expenses.
The actual results may differ from the judgements, estimates and assumptions made by management, and will seldom equal the estimated results.
Information about significant judgements, estimates and assumptions that have the most significant effect on recognition and measurement of assets, liabilities, income and expenses is provided below.
Impairment An impairment loss is recognised for the amount by which the assets’ or cash-generating unit’s carrying amount exceeds its recoverable amount. To determine the recoverable amount, management estimates expected future cash flows from each cash-generating unit and determines a suitable interest rate in order to calculate the present value of those cash flows. In the process of measuring expected future cash flows management makes assumptions about future operating results. These assumptions relate to future events and circumstances. The actual results may vary, and may cause significant adjustments to the Company’s assets within the next financial year.
In most cases, determining the applicable discount rate involves estimating the appropriate adjustment to market risk and the appropriate adjustment to asset-specific risk factors.
Useful lives of depreciable assets Management reviews the useful lives of depreciable assets at each reporting date, based on the expected utility of the assets to the Company. Actual results, however, may vary due to technical obsolescence, particularly relating to software and IT equipment.
Inventories Inventories are measured at the lower of cost and net realisable value. In estimating net realisable values, management takes into account the most reliable evidence available at the times the estimates are made. The Company’s core business is subject to technology changes which may cause selling prices to change rapidly.
AASB 101.125
Example special purpose financial statements 25 For the year ended 30 June 2016
© 2016 Grant Thornton Australia Limited. All rights reserved.
Fair value of financial instruments Management uses valuation techniques to determine the fair value of financial instruments (where active market quotes are not available) and non-financial assets. This involves developing estimates and assumptions consistent with how market participants would price the instrument. Management bases its assumptions on observable data as far as possible but this is not always available. In that case management uses the best information available. Estimated fair values may vary from the actual prices that would be achieved in an arm’s length transaction at the reporting date.
Provisions – Warranties The amount recognised for warranties for which customers are covered for the cost of repairs is estimated based on management’s past experience and the future expectations of defects.
Provisions – Long service leave As discussed in Note 1.4, the liability for long service leave is recognised and measured at the present value of the estimated future cash flows to be made in respect of all employees at the reporting date. In determining the present value of the liability, attrition rates and pay increases through promotion and inflation have been taken into account.
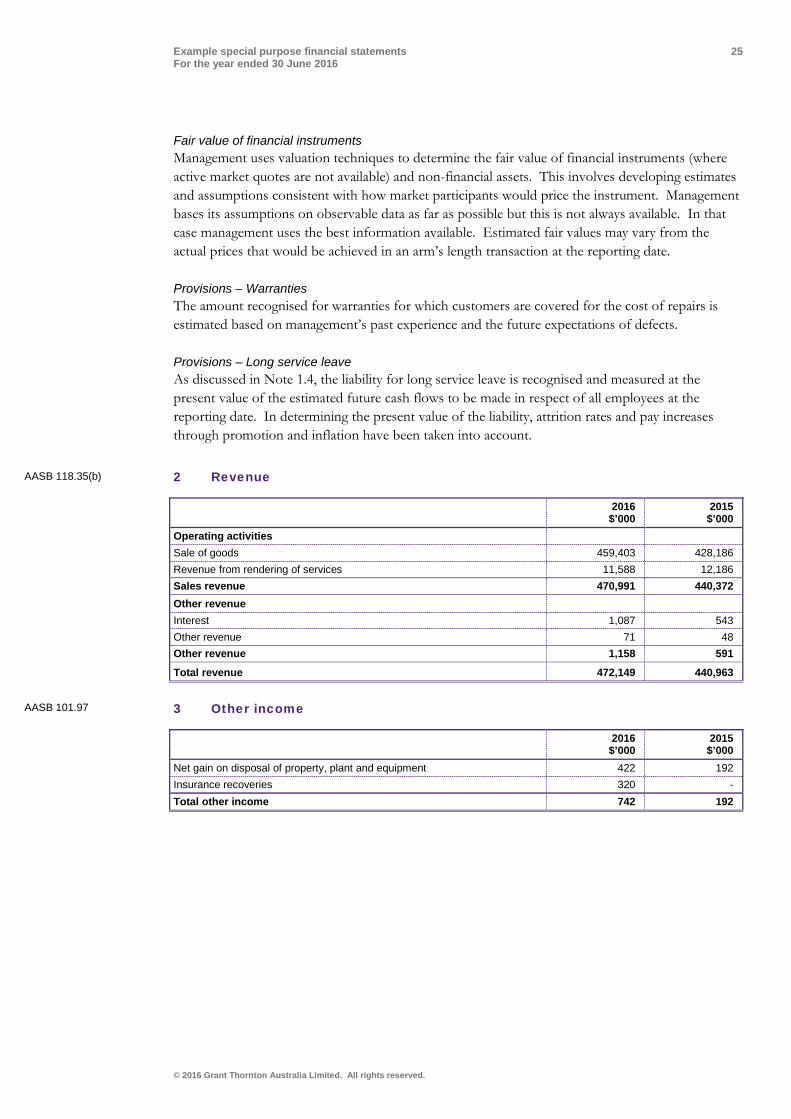
2 Revenue 2016 2015 $’000 $’000 Operating activities Sale of goods 459,403 428,186 Revenue from rendering of services 11,588 12,186 Sales revenue 470,991 440,372 Other revenue Interest 1,087 543 Other revenue 71 48 Other revenue 1,158 591
Total revenue 472,149 440,963
3 Other income 2016 2015 $’000 $’000 Net gain on disposal of property, plant and equipment 422 192 Insurance recoveries 320 - Total other income 742 192
AASB 118.35(b)
AASB 101.97
Example special purpose financial statements 26 For the year ended 30 June 2016
© 2016 Grant Thornton Australia Limited. All rights reserved.
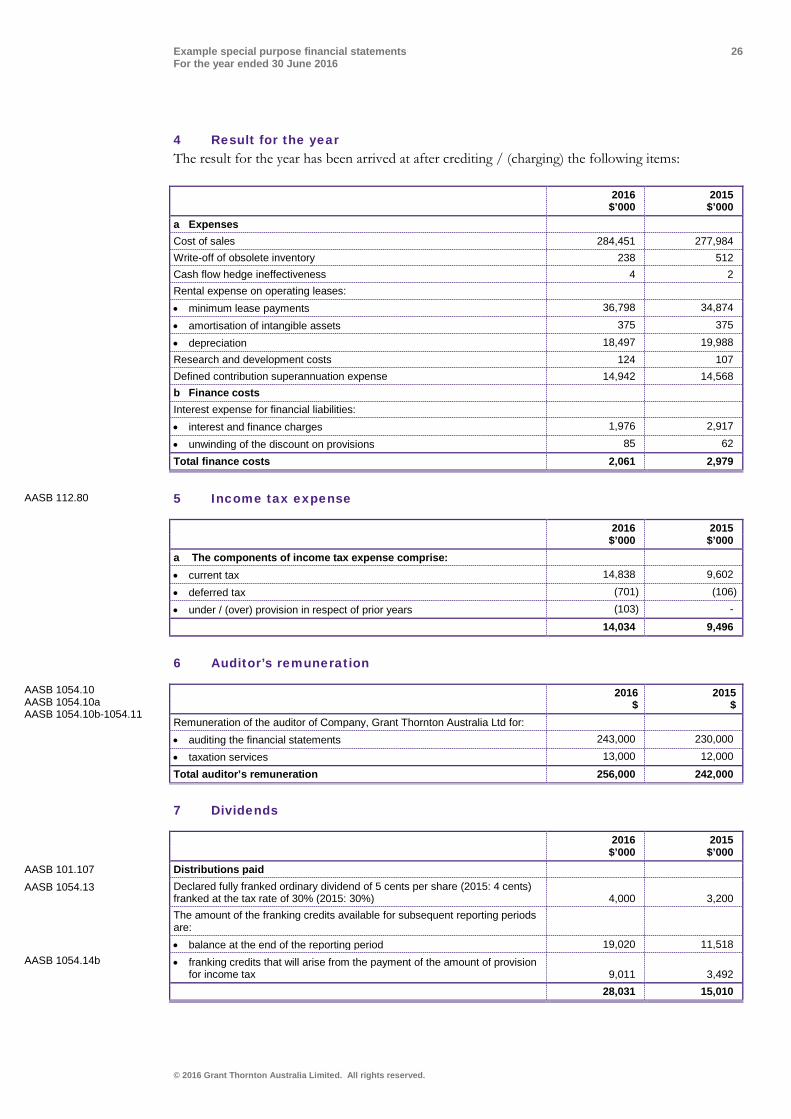
4 Result for the year The result for the year has been arrived at after crediting / (charging) the following items:
2016 2015 $’000 $’000 a Expenses Cost of sales 284,451 277,984 Write-off of obsolete inventory 238 512 Cash flow hedge ineffectiveness 4 2 Rental expense on operating leases: • minimum lease payments 36,798 34,874
• amortisation of intangible assets 375 375
• depreciation 18,497 19,988 Research and development costs 124 107 Defined contribution superannuation expense 14,942 14,568 b Finance costs Interest expense for financial liabilities: • interest and finance charges 1,976 2,917
• unwinding of the discount on provisions 85 62
Total finance costs 2,061 2,979
5 Income tax expense 2016 2015 $’000 $’000 a The components of income tax expense comprise: • current tax 14,838 9,602
• deferred tax (701) (106)
• under / (over) provision in respect of prior years (103) -
14,034 9,496
6 Auditor’s remuneration 2016 2015 $ $ Remuneration of the auditor of Company, Grant Thornton Australia Ltd for: • auditing the financial statements 243,000 230,000
• taxation services 13,000 12,000
Total auditor’s remuneration 256,000 242,000
7 Dividends 2016 2015 $’000 $’000 Distributions paid Declared fully franked ordinary dividend of 5 cents per share (2015: 4 cents) franked at the tax rate of 30% (2015: 30%) 4,000 3,200 The amount of the franking credits available for subsequent reporting periods are: • balance at the end of the reporting period 19,020 11,518
• franking credits that will arise from the payment of the amount of provision for income tax 9,011 3,492
28,031 15,010
AASB 112.80
AASB 1054.10 AASB 1054.10a AASB 1054.10b-1054.11
AASB 101.107 AASB 1054.13 AASB 1054.14b
Example special purpose financial statements 27 For the year ended 30 June 2016
© 2016 Grant Thornton Australia Limited. All rights reserved.
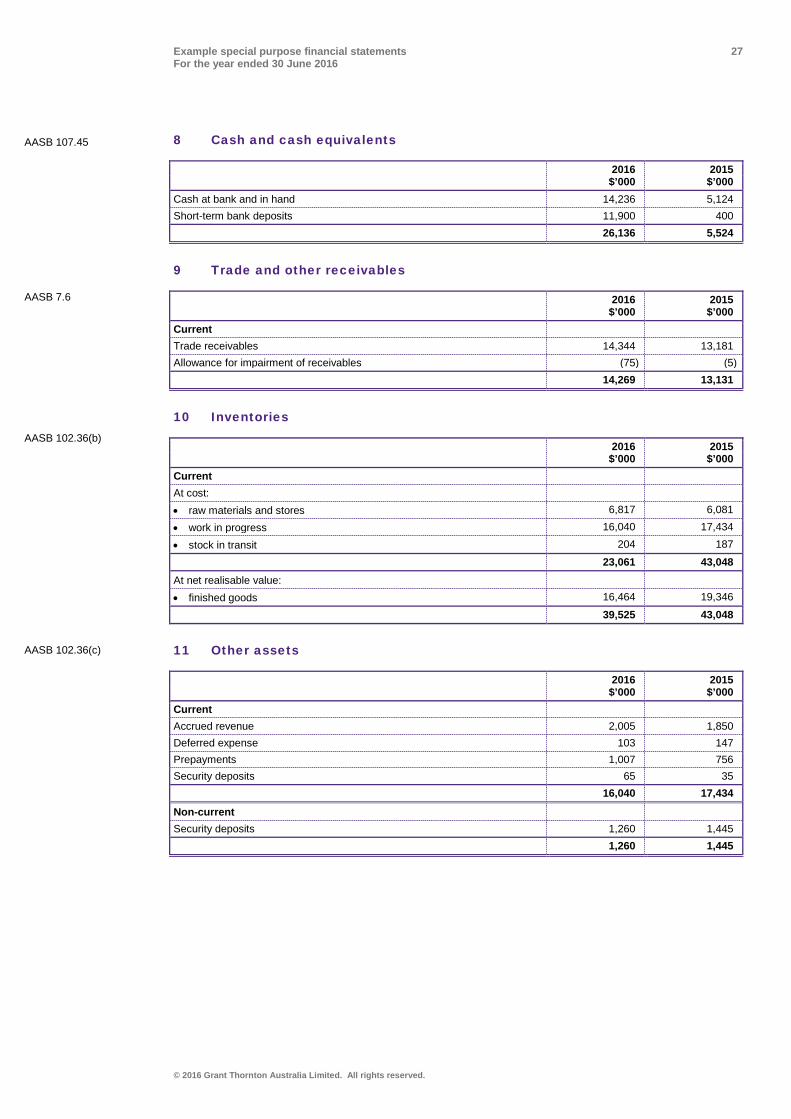
8 Cash and cash equivalents 2016 2015 $’000 $’000 Cash at bank and in hand 14,236 5,124 Short-term bank deposits 11,900 400 26,136 5,524
9 Trade and other receivables 2016 2015 $’000 $’000 Current Trade receivables 14,344 13,181 Allowance for impairment of receivables (75) (5) 14,269 13,131
10 Inventories 2016 2015 $’000 $’000 Current At cost: • raw materials and stores 6,817 6,081
• work in progress 16,040 17,434
• stock in transit 204 187
23,061 43,048 At net realisable value: • finished goods 16,464 19,346 39,525 43,048 11 Other assets 2016 2015 $’000 $’000 Current Accrued revenue 2,005 1,850 Deferred expense 103 147 Prepayments 1,007 756 Security deposits 65 35 16,040 17,434
Non-current Security deposits 1,260 1,445 1,260 1,445
AASB 107.45
AASB 7.6
AASB 102.36(b)
AASB 102.36(c)
Example special purpose financial statements 28 For the year ended 30 June 2016
© 2016 Grant Thornton Australia Limited. All rights reserved.
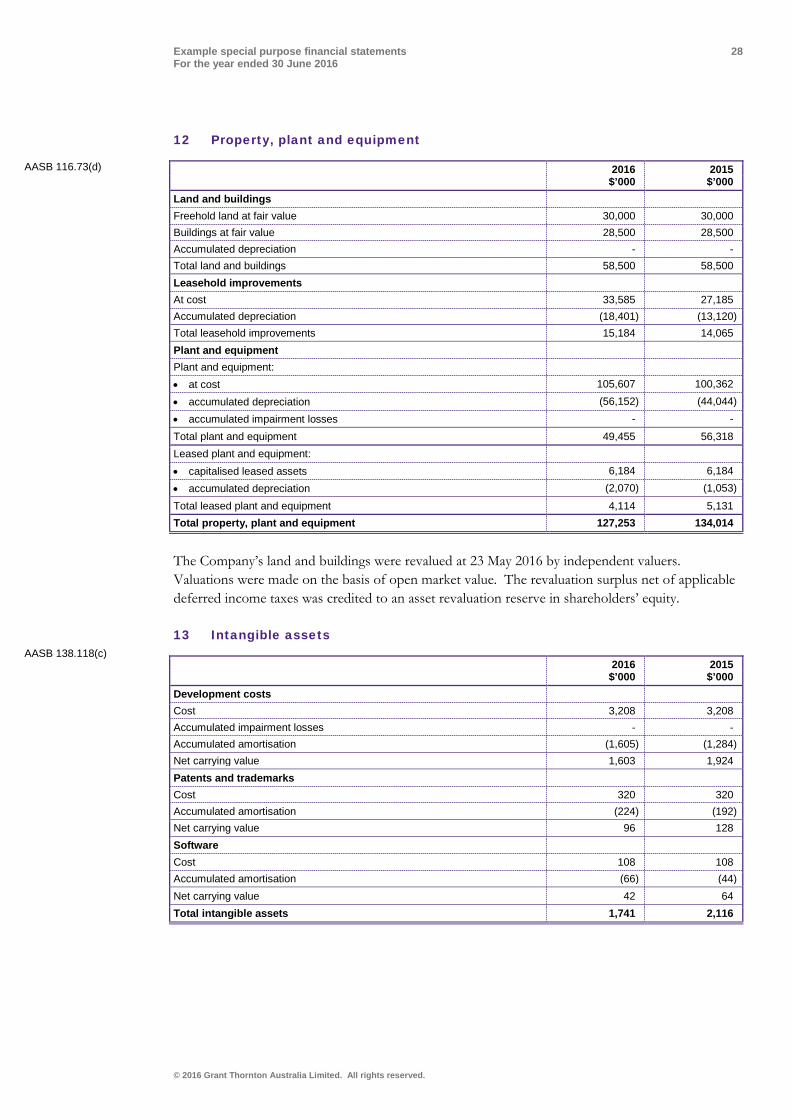
12 Property, plant and equipment 2016 2015 $’000 $’000 Land and buildings Freehold land at fair value 30,000 30,000 Buildings at fair value 28,500 28,500 Accumulated depreciation - - Total land and buildings 58,500 58,500 Leasehold improvements At cost 33,585 27,185 Accumulated depreciation (18,401) (13,120) Total leasehold improvements 15,184 14,065 Plant and equipment Plant and equipment: • at cost 105,607 100,362
• accumulated depreciation (56,152) (44,044) • accumulated impairment losses - - Total plant and equipment 49,455 56,318 Leased plant and equipment: • capitalised leased assets 6,184 6,184 • accumulated depreciation (2,070) (1,053)
Total leased plant and equipment 4,114 5,131 Total property, plant and equipment 127,253 134,014
The Company’s land and buildings were revalued at 23 May 2016 by independent valuers. Valuations were made on the basis of open market value. The revaluation surplus net of applicable deferred income taxes was credited to an asset revaluation reserve in shareholders’ equity.
13 Intangible assets 2016 2015 $’000 $’000 Development costs Cost 3,208 3,208 Accumulated impairment losses - - Accumulated amortisation (1,605) (1,284) Net carrying value 1,603 1,924 Patents and trademarks Cost 320 320 Accumulated amortisation (224) (192) Net carrying value 96 128 Software Cost 108 108 Accumulated amortisation (66) (44) Net carrying value 42 64 Total intangible assets 1,741 2,116
AASB 116.73(d)
AASB 138.118(c)
Example special purpose financial statements 29 For the year ended 30 June 2016
© 2016 Grant Thornton Australia Limited. All rights reserved.
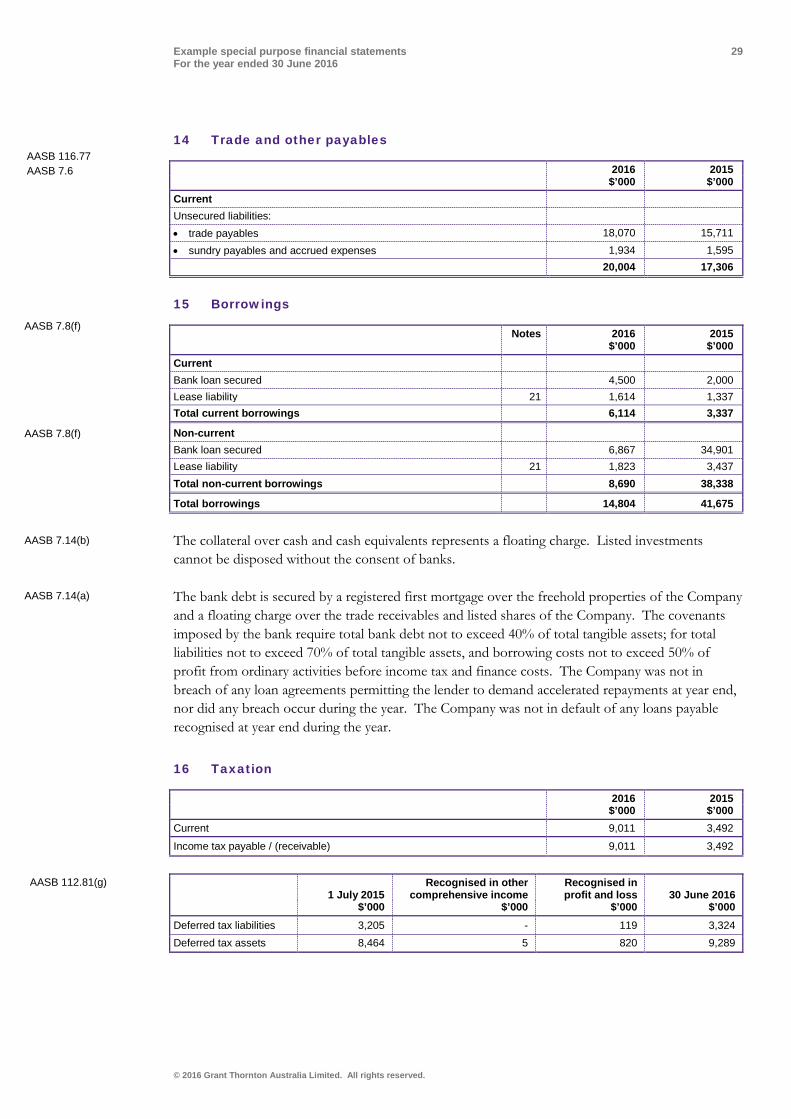
14 Trade and other payables 2016 2015 $’000 $’000 Current Unsecured liabilities: • trade payables 18,070 15,711 • sundry payables and accrued expenses 1,934 1,595 20,004 17,306
15 Borrowings Notes 2016 2015 $’000 $’000 Current Bank loan secured 4,500 2,000 Lease liability 21 1,614 1,337 Total current borrowings 6,114 3,337
Non-current Bank loan secured 6,867 34,901 Lease liability 21 1,823 3,437 Total non-current borrowings 8,690 38,338
Total borrowings 14,804 41,675
The collateral over cash and cash equivalents represents a floating charge. Listed investments cannot be disposed without the consent of banks.
The bank debt is secured by a registered first mortgage over the freehold properties of the Company and a floating charge over the trade receivables and listed shares of the Company. The covenants imposed by the bank require total bank debt not to exceed 40% of total tangible assets; for total liabilities not to exceed 70% of total tangible assets, and borrowing costs not to exceed 50% of profit from ordinary activities before income tax and finance costs. The Company was not in breach of any loan agreements permitting the lender to demand accelerated repayments at year end, nor did any breach occur during the year. The Company was not in default of any loans payable recognised at year end during the year.
16 Taxation 2016 2015 $’000 $’000 Current 9,011 3,492
Income tax payable / (receivable) 9,011 3,492
1 July 2015 Recognised in other
comprehensive income Recognised in profit and loss 30 June 2016
$’000 $’000 $’000 $’000 Deferred tax liabilities 3,205 - 119 3,324 Deferred tax assets 8,464 5 820 9,289
AASB 116.77 AASB 7.6
AASB 7.8(f)
AASB 7.8(f)
AASB 7.14(b)
AASB 7.14(a)
AASB 112.81(g)
Example special purpose financial statements 30 For the year ended 30 June 2016
© 2016 Grant Thornton Australia Limited. All rights reserved.
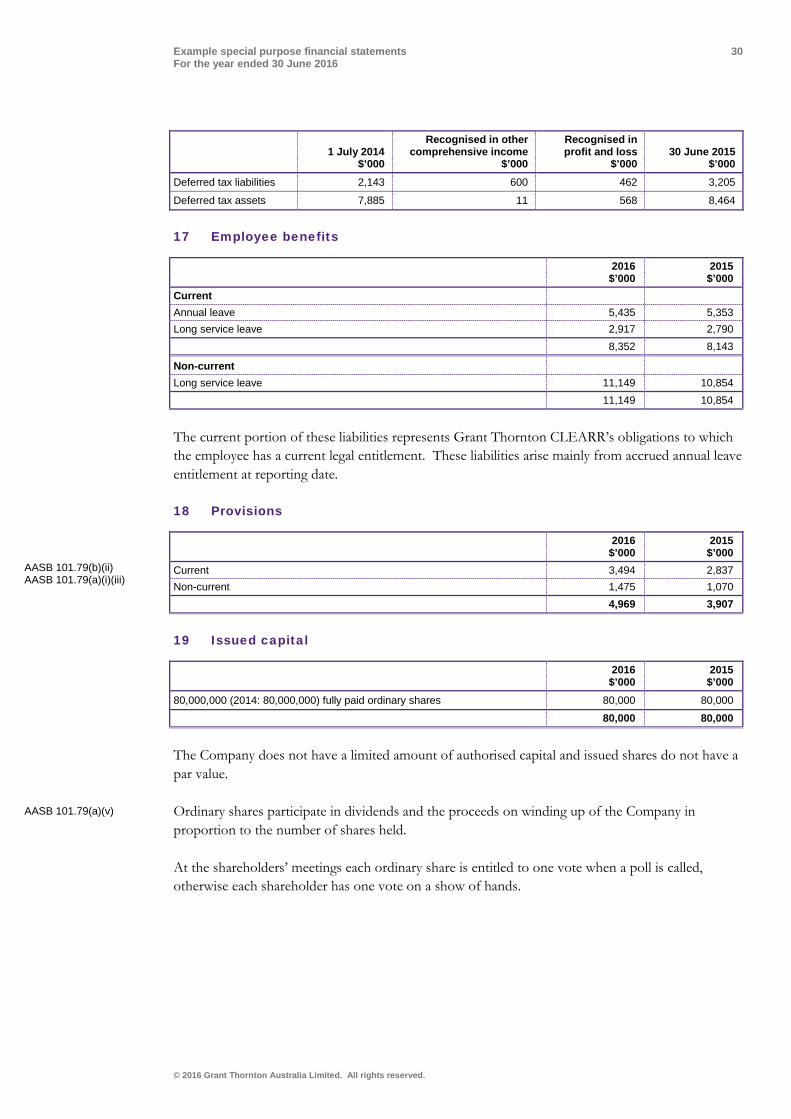
1 July 2014
Recognised in other comprehensive income
Recognised in profit and loss 30 June 2015
$’000 $’000 $’000 $’000 Deferred tax liabilities 2,143 600 462 3,205
Deferred tax assets 7,885 11 568 8,464
17 Employee benefits 2016 2015 $’000 $’000 Current Annual leave 5,435 5,353 Long service leave 2,917 2,790 8,352 8,143
Non-current Long service leave 11,149 10,854 11,149 10,854
The current portion of these liabilities represents Grant Thornton CLEARR’s obligations to which the employee has a current legal entitlement. These liabilities arise mainly from accrued annual leave entitlement at reporting date.
18 Provisions 2016 2015 $’000 $’000 Current 3,494 2,837 Non-current 1,475 1,070 4,969 3,907
19 Issued capital 2016 2015 $’000 $’000 80,000,000 (2014: 80,000,000) fully paid ordinary shares 80,000 80,000
80,000 80,000
The Company does not have a limited amount of authorised capital and issued shares do not have a par value.
Ordinary shares participate in dividends and the proceeds on winding up of the Company in proportion to the number of shares held.
At the shareholders’ meetings each ordinary share is entitled to one vote when a poll is called, otherwise each shareholder has one vote on a show of hands.
AASB 101.79(b)(ii) AASB 101.79(a)(i)(iii)
AASB 101.79(a)(v)
Example special purpose financial statements 31 For the year ended 30 June 2016
© 2016 Grant Thornton Australia Limited. All rights reserved.
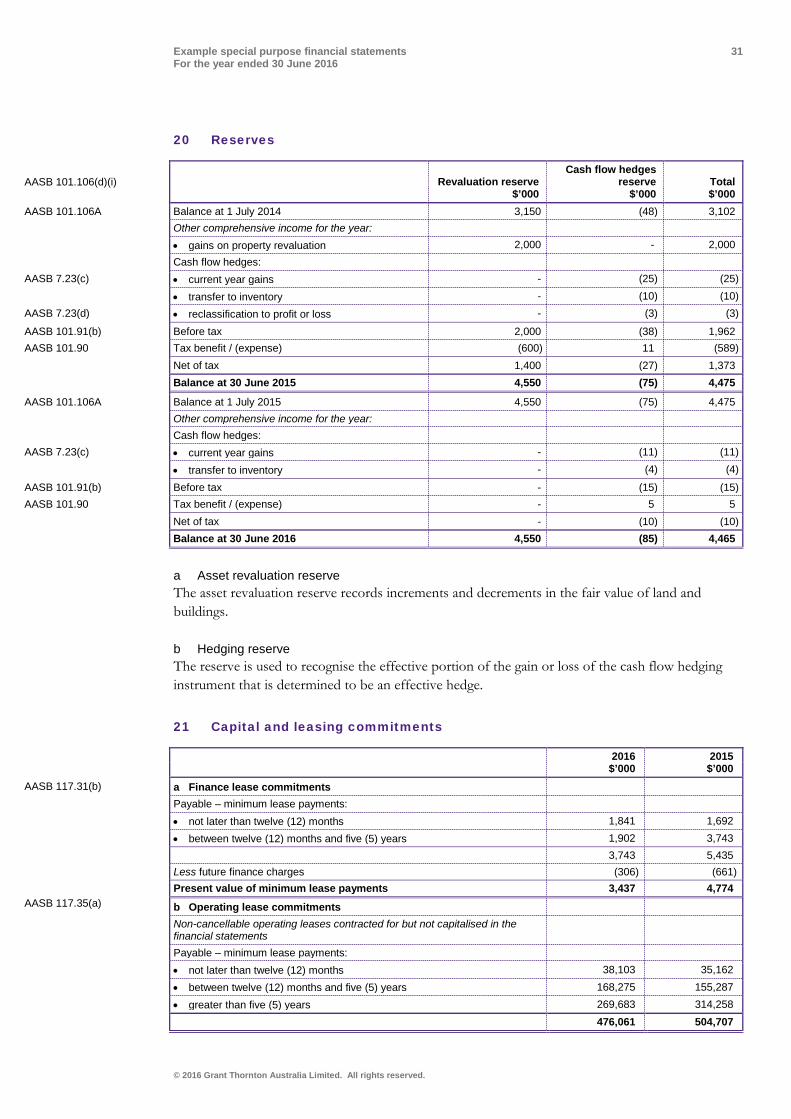
20 Reserves
AASB 101.106(d)(i) Revaluation reserve Cash flow hedges
reserve Total $’000 $’000 $’000 AASB 101.106A Balance at 1 July 2014 3,150 (48) 3,102 Other comprehensive income for the year: • gains on property revaluation 2,000 - 2,000 Cash flow hedges: AASB 7.23(c) • current year gains - (25) (25) • transfer to inventory - (10) (10) AASB 7.23(d) • reclassification to profit or loss - (3) (3)
AASB 101.91(b) Before tax 2,000 (38) 1,962 AASB 101.90 Tax benefit / (expense) (600) 11 (589) Net of tax 1,400 (27) 1,373 Balance at 30 June 2015 4,550 (75) 4,475
AASB 101.106A Balance at 1 July 2015 4,550 (75) 4,475 Other comprehensive income for the year: Cash flow hedges: AASB 7.23(c) • current year gains - (11) (11) • transfer to inventory - (4) (4)
AASB 101.91(b) Before tax - (15) (15) AASB 101.90 Tax benefit / (expense) - 5 5 Net of tax - (10) (10) Balance at 30 June 2016 4,550 (85) 4,465
a Asset revaluation reserve The asset revaluation reserve records increments and decrements in the fair value of land and buildings.
b Hedging reserve The reserve is used to recognise the effective portion of the gain or loss of the cash flow hedging instrument that is determined to be an effective hedge.
21 Capital and leasing commitments 2016 2015 $’000 $’000 a Finance lease commitments Payable – minimum lease payments: • not later than twelve (12) months 1,841 1,692 • between twelve (12) months and five (5) years 1,902 3,743 3,743 5,435 Less future finance charges (306) (661) Present value of minimum lease payments 3,437 4,774
b Operating lease commitments Non-cancellable operating leases contracted for but not capitalised in the financial statements
Payable – minimum lease payments: • not later than twelve (12) months 38,103 35,162 • between twelve (12) months and five (5) years 168,275 155,287 • greater than five (5) years 269,683 314,258 476,061 504,707
AASB 117.31(b)
AASB 117.35(a)
Example special purpose financial statements 32 For the year ended 30 June 2016
© 2016 Grant Thornton Australia Limited. All rights reserved.
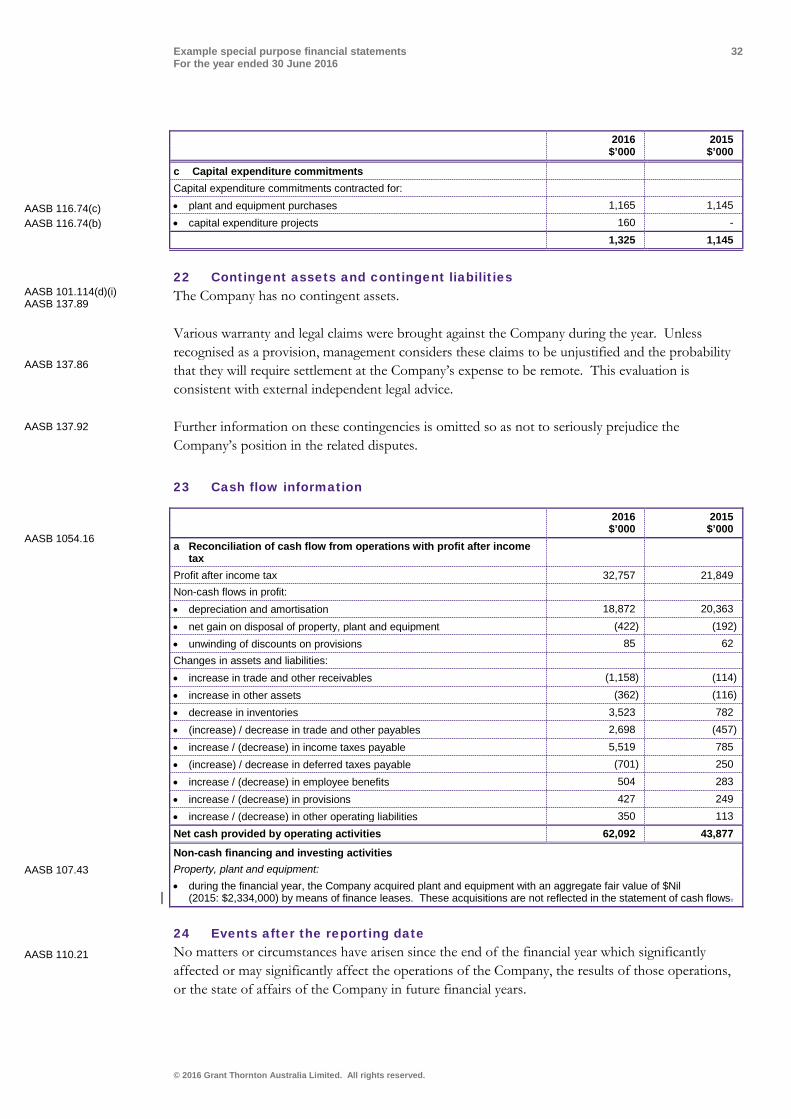
2016 2015 $’000 $’000
c Capital expenditure commitments Capital expenditure commitments contracted for: • plant and equipment purchases 1,165 1,145 • capital expenditure projects 160 - 1,325 1,145
22 Contingent assets and contingent liabilities The Company has no contingent assets.
Various warranty and legal claims were brought against the Company during the year. Unless recognised as a provision, management considers these claims to be unjustified and the probability that they will require settlement at the Company’s expense to be remote. This evaluation is consistent with external independent legal advice.
Further information on these contingencies is omitted so as not to seriously prejudice the Company’s position in the related disputes.
23 Cash flow information 2016 2015 $’000 $’000 a Reconciliation of cash flow from operations with profit after income
tax Profit after income tax 32,757 21,849 Non-cash flows in profit: • depreciation and amortisation 18,872 20,363
• net gain on disposal of property, plant and equipment (422) (192) • unwinding of discounts on provisions 85 62 Changes in assets and liabilities: • increase in trade and other receivables (1,158) (114)
• increase in other assets (362) (116) • decrease in inventories 3,523 782 • (increase) / decrease in trade and other payables 2,698 (457)
• increase / (decrease) in income taxes payable 5,519 785 • (increase) / decrease in deferred taxes payable (701) 250
• increase / (decrease) in employee benefits 504 283
• increase / (decrease) in provisions 427 249 • increase / (decrease) in other operating liabilities 350 113 Net cash provided by operating activities 62,092 43,877
Non-cash financing and investing activities Property, plant and equipment: • during the financial year, the Company acquired plant and equipment with an aggregate fair value of $Nil
(2015: $2,334,000) by means of finance leases. These acquisitions are not reflected in the statement of cash flows.
24 Events after the reporting date No matters or circumstances have arisen since the end of the financial year which significantly affected or may significantly affect the operations of the Company, the results of those operations, or the state of affairs of the Company in future financial years.
AASB 116.74(c) AASB 116.74(b)
AASB 101.114(d)(i) AASB 137.89
AASB 137.86
AASB 137.92
AASB 1054.16
AASB 107.43
AASB 110.21
Example special purpose financial statements 33 For the year ended 30 June 2016
© 2016 Grant Thornton Australia Limited. All rights reserved.
25 Company details The registered office of the Company is:
Grant Thornton CLEARR Example Pty Ltd 980 Collins Street Melbourne VIC 3000
The principal place of business is:
Grant Thornton CLEARR Example Pty Ltd 62 Endeavour Road Braeside VIC 3195
AASB 101.138(a)
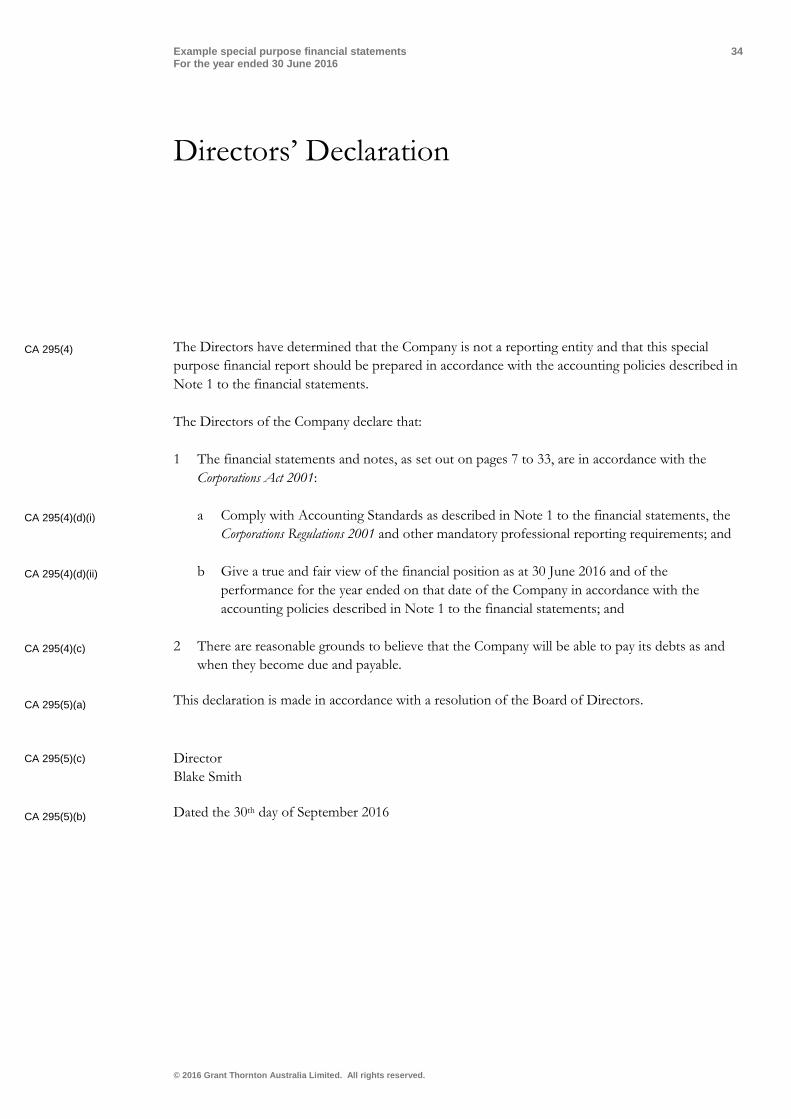
Example special purpose financial statements 34 For the year ended 30 June 2016
© 2016 Grant Thornton Australia Limited. All rights reserved.
Directors’ Declaration
The Directors have determined that the Company is not a reporting entity and that this special purpose financial report should be prepared in accordance with the accounting policies described in Note 1 to the financial statements.
The Directors of the Company declare that:
1 The financial statements and notes, as set out on pages 7 to 33, are in accordance with the Corporations Act 2001:
a Comply with Accounting Standards as described in Note 1 to the financial statements, the Corporations Regulations 2001 and other mandatory professional reporting requirements; and
b Give a true and fair view of the financial position as at 30 June 2016 and of the performance for the year ended on that date of the Company in accordance with the accounting policies described in Note 1 to the financial statements; and
2 There are reasonable grounds to believe that the Company will be able to pay its debts as and when they become due and payable.
This declaration is made in accordance with a resolution of the Board of Directors.
Director Blake Smith
Dated the 30th day of September 2016
CA 295(4)
CA 295(4)(d)(i)
CA 295(4)(d)(ii)
CA 295(4)(c)
CA 295(5)(a)
CA 295(5)(c)
CA 295(5)(b)
Example special purpose financial statements 35 For the year ended 30 June 2016
© 2016 Grant Thornton Australia Limited. All rights reserved.
Independent Auditor’s Report
An independent auditor’s report will be prepared by the entity’s auditor in accordance with Australian Auditing Standards. This publication does not include an illustrative report as the wording of the report may differ between entities.

www.grantthornton.com.au The information contained herein is of a general nature and is not intended to address the circumstances of any particular individual or entity. Although we endeavour to provide accurate and timely information, there can be no guarantee that such information is accurate as of the date it is received or that it will continue to be accurate in the future. No one is entitled to rely on this information and no one should act on such information without appropriate professional advice obtained after a thorough examination of the particular situation. ‘Grant Thornton’ refers to the brand under which the Grant Thornton member firms provide assurance, tax and advisory services to their clients and/or refers to one or more member firms, as the context requires. Grant Thornton Australia Ltd is a member firm of Grant Thornton International Ltd (GTIL). GTIL and the member firms are not a worldwide partnership. GTIL and each member firm is a separate legal entity. Services are delivered by the member firms. GTIL does not provide services to clients. GTIL and its member firms are not agents of, and do not obligate one another and are not liable for one another’s acts or omissions. In the Australian context only, the use of the term ‘Grant Thornton’ may refer to Grant Thornton Australia Limited ABN 41 127 556 389 and its Australian subsidiaries and related entities. GTIL is not an Australian related entity to Grant Thornton Australia Limited. Liability limited by a scheme approved under Professional Standards Legislation. Liability is limited in those States where a current scheme applies.