Special Eurobarometer 382 - European...
97
Special Eurobarometer 382 PUBLIC ATTITUDES TOWARDS ROBOTS REPORT Fieldwork: February - March 2012 Publication: September 2012 This survey has been requested by Directorate-General for Information Society and Media (INSFO) and co-ordinated by Directorate-General for Communication (DG COMM “Research and Speechwriting” Unit). http://ec.europa.eu/public_opinion/index_en.htm This document does not represent the point of view of the European Commission. The interpretations and opinions contained in it are solely those of the authors. Special Eurobarometer 382 / Wave EB77.1 – TNS Opinion & Social
Transcript of Special Eurobarometer 382 - European...

Special Eurobarometer 382
PUBLIC ATTITUDES TOWARDS ROBOTS
REPORT
Fieldwork: February - March 2012
Publication: September 2012
This survey has been requested by Directorate-General for Information Society and Media (INSFO)
and co-ordinated by Directorate-General for Communication (DG COMM “Research and
Speechwriting” Unit).
http://ec.europa.eu/public_opinion/index_en.htm
This document does not represent the point of view of the European Commission. The interpretations and opinions contained in it are solely those of the authors.
Special Eurobarometer 382 / Wave EB77.1 – TNS Opinion & Social

Special Eurobarometer 382
Public Attitudes towards Robots
Conducted by TNS Opinion & Social at the request of Directorate-General for Information Society and Media (INSFO)
Survey co-ordinated by Directorate-General Communication

SPECIAL EUROBAROMETER 382 “Public Attitudes towards Robots”
1
TABLE OF CONTENTS
INTRODUCTION ................................................................................................. 2
EXECUTIVE SUMMARY ....................................................................................... 4
1. ATTITUDES TOWARDS ROBOTS ................................................................... 6
INTRODUCTION/CONTEXT: Interest in scientific discoveries and technological developments ........................................................................ 6
1.1. Familiarity with representations of robots ........................................ 10
1.2. Personal experience of robots .......................................................... 14
1.3. Views on robots ............................................................................... 17
1.3.1. Overall view .............................................................................. 17
1.3.2. Specific attitudes........................................................................ 21
2. AREAS OF APPLICATION FOR ROBOTS...................................................................... 32
2.1. Areas where EU citizens believe robots should be used as a priority . 32
2.2. Areas where EU citizens believe robots should not be used .............. 35
3. ROBOTS IN THE EU: FUTURE PERSPECTIVES .......................................................... 38
3.1. Acceptance of tasks done by a robot ................................................ 38
3.2. When will it become commonplace for robots to do housework? ...... 49
CONCLUSIONS ................................................................................................. 53
ANNEXES
Technical specifications Questionnaire Tables

SPECIAL EUROBAROMETER 382 “Public Attitudes towards Robots”
2
INTRODUCTION
This report presents the results of a Special Eurobarometer survey into public attitudes
towards robots. The aim of the survey is to gauge public opinion towards robots by
measuring public perceptions, acceptance levels, worries and reservations among EU
citizens aged 15 and over in the 27 Member States.
Robotics is a key technology for Europe’s future competitiveness. Robots enable
efficiency in all manufacturing and production sectors and contribute to employment in
the European Union. Public perceptions of robots, are however, often influenced by
misconceptions and fears. In order to improve the image of robots and to increase public
acceptance, it is necessary to better understand public opinion about this technology.
The results of the survey are analysed in terms of the European average for the 27
Member States (EU27), then on a country-by-country basis, then at a socio-demographic
level by comparing the results on the basis of gender, age, education, occupation and
people’s position on the social ladder. Where relevant other socio-demographic
characteristics are also analysed. Finally, the results are examined on the basis of
people’s interest in science and technology and their general view of robots.
The first part begins with a short introduction in which EU citizens’ interest in scientific
discoveries and technological developments are discussed, as this is an important
analysis variable. The chapter then looks at familiarity and personal experiences with
robots and general and more specific attitudes towards robots.
The second part examines the application areas for robots and presents the areas where
EU citizens believe robots should be used as a priority and where EU citizens believe
robots should be banned.
In the last part, the focus is on the future of robots. The chapter examines the
acceptance of tasks done by robots and considers when EU citizens believe it will become
commonplace for robots to do household tasks.
This survey was carried out by TNS Opinion & Social network in the 27 Member States of
the European Union between 25 February and 11 March 2012. 26 751 respondents from
different social and demographic groups were interviewed face-to-face at home in their
mother tongue on behalf of the Directorate-General for Information Society and Media
(INSFO). The methodology used is that of Eurobarometer surveys as carried out by the
Directorate-General for Communication (“Research and Speechwriting” Unit)1.. A
technical note on the manner in which interviews were conducted by the Institutes within
the TNS Opinion & Social network is appended as an annex to this report. Also included
are the interview methods and confidence intervals2.
1 http://ec.europa.eu/public_opinion/index_en.htm 2 The results tables are included in the annex. It should be noted that the total of the percentages in the tables of this report may exceed 100% when the respondent has the possibility of giving several answers to the question.

SPECIAL EUROBAROMETER 382 “Public Attitudes towards Robots”
3
Note: In this report, countries are referred to by their official abbreviation. The abbreviations used in this report correspond to:
ABBREVIATIONS BE Belgium LV Latvia CZ Czech Republic LU Luxembourg BG Bulgaria HU Hungary DK Denmark MT Malta DE Germany NL The Netherlands EE Estonia AT Austria EL Greece PL Poland ES Spain PT Portugal FR France RO Romania IE Ireland SI Slovenia IT Italy SK Slovakia CY Republic of Cyprus* FI Finland LT Lithuania SE Sweden UK The United Kingdom EU27 European Union – 27 Member States EU15 BE, IT, FR, DE, LU, NL, DK, UK, IE, PT, ES, EL, AT, SE,
FI**
NMS12 BG, CZ, EE, CY, LT, LV, MT, HU, PL, RO, SL, SK***
EURO AREA
BE, FR, IT, LU, DE, AT, ES, PT, IE, NL, FI, EL, EE, SI, CY, MT, SK
* Cyprus as a whole is one of the 27 European Union Member States. However, the ‘acquis communautaire’ has been suspended in the part of the country which is not controlled by the government of the Republic of Cyprus. For practical reasons, only the interviews carried out in the part of the country controlled by the government of the Republic of Cyprus are included in the ‘CY’ category and in the EU27 average.
** EU15 refers to the 15 countries forming the European Union before the enlargements of 2004 and 2007
*** The NMS12 are the 12 ‘new Member States’ which joined the European Union during the 2004 and 2007 enlargements
* * * * *
The Eurobarometer web site can be consulted at the following address:
http://ec.europa.eu/public_opinion/index_en.htm
We wish to thank the people throughout European Union who have given their time
to take part in this survey. Without their active participation, this survey would not have been possible.

SPECIAL EUROBAROMETER 382 “Public Attitudes towards Robots”
4
EXECUTIVE SUMMARY
The key findings from this survey are:
A quarter of EU citizens are ‘very interested’ in scientific discoveries and
technological developments and half are ‘moderately’ interested, although the
proportion expressing strong interest ranges from 9% in the Czech Republic to
43% in Cyprus and depends on age, education and occupation. Interest in
scientific discoveries and technological developments is an important factor in
explaining and understanding people’s views about robots.
The image that EU citizens have of a robot is more likely to be that of an
instrument-like machine than that of a human-like machine but in Malta, Cyprus,
Spain and Bulgaria both correspond equally well to people’s idea of robots.
Few EU citizens have experience with using robots: in total, 12% of EU citizens
have used or are currently using a robot: six percent have experience with the
use of a robot at home and six percent have used or are currently using a robot at
work. Personal experience levels are highest in Slovakia, Poland, Italy and
Slovenia and lowest in Greece, Bulgaria, Cyprus and Malta.
The majority of EU citizens has a positive view of robots. While there are
variations between countries, the majority of EU citizens in all Member States
holds a positive opinion, with percentages ranging from 54% in Greece and Malta
to 88% in Denmark and Sweden.
EU citizens have well-defined specific attitudes about robots: on the one hand
they express the utilitarian view that robots are useful and good because they do
jobs that are either too hard or too dangerous for, or helpful to, people; on the
other hand, they express a degree of caution, in that robots steal people’s jobs
and require careful management. However, there are considerable variations
between Member States and between different social groups.
EU citizens also have well-defined views about the application areas for robots
and the areas in which the use of robots should be banned: they should be used
as a priority in areas that are too difficult or too dangerous for humans, like space
exploration (52% priority), manufacturing (50%), military and security (41%) and
search and rescue tasks (41%); there is widespread agreement that robots
should be banned in the care of children, the elderly or the disabled (60%) with
large minorities also wanting a ban when it comes to other ‘human’ areas such as
education (34%), healthcare (27%) and leisure (20%).

SPECIAL EUROBAROMETER 382 “Public Attitudes towards Robots”
5
A computation of the difference between the percentage of EU citizens viewing
each of the possible application areas as a priority and the percentage considering
that each of the areas should be banned reveals that support for the use of robots
is most widespread when it comes to space exploration (a +51-point difference)
and manufacturing (+46) while opposition to the use of robots is most widespread
when it comes to the care of people and (-56) and education (-31).
In line with these results, EU citizens are relatively comfortable about the idea of
a robot assisting them at work (48% of respondents give a score from 7 to 10 on
a scale from 1 to 10) but totally uncomfortable about the idea of having their
children or elderly parents cared for by a robot (66% chose point 1 on the scale).
Neither are EU citizens particularly keen to have a medical operation performed
on them by a robot or to have their dog walked by a robot. For both tasks, the
most frequent answer given by respondents in all Member States is point 1 on the
10-point scale.
It will not become commonplace to have robots doing housework in the near
future, according to the majority of EU citizens: overall, only 12% believe it is
already commonplace (4%) or that it will be commonplace in 5 years’ time (8%).

SPECIAL EUROBAROMETER 382 “Public Attitudes towards Robots”
6
1. ATTITUDES TOWARDS ROBOTS
INTRODUCTION/CONTEXT: Interest in scientific discoveries and technological
developments
– Interest in scientific discoveries and technological developments has decreased since 2010 –
A 2010 Special Eurobarometer on general attitudes towards science and technology
revealed that three EU citizens in ten were ‘very interested’ in new scientific discoveries
and technological developments (30%), while a fifth were ‘not at all interested’ (20%).
The rest of EU citizens were in between, saying they were ‘moderately interested’ (49%).
This current survey measures views and attitudes of EU citizens about a very specific
scientific subject: robots. However, before presenting the results, it is interesting and
helpful to examine the current level of public interest in scientific discoveries and
technological developments3.
These results reveal that interest has decreased since January-February 2010: a quarter
of EU citizens now claim to be ‘very interested’ in scientific discoveries and technological
developments (25%), a 5-point decrease since the previous survey. Just over half are ‘moderately’ interested (52%; +3) and 22% are ‘not at all interested’ (+2).
3 QA1 Please tell me whether you are very interested, moderately interested or not at all interested in scientific discoveries and technological developments

SPECIAL EUROBAROMETER 382 “Public Attitudes towards Robots”
7
The national results reveal large differences between Member States regarding the level of interest in scientific discoveries and technological developments.
There are substantial differences in the proportions who are ‘very interested’ in scientific
discoveries and technological developments. The graph below shows that more than a
third of respondents are ‘very interested’ in Cyprus (43%), Sweden (41%), the
Netherlands (36%), France (34%), and Luxembourg (34%).
While on average just over one in five EU citizens (22%) is ‘not at all interested’ in
scientific discoveries and technological developments, around a third of respondents take
this position in Portugal (37%), Malta (34%), Ireland (33%) and the Czech Republic (32%).
In comparison to 2010, increases of at least five points in the proportion of respondents
that are ‘very interested’ have been recorded in Bulgaria (+8), Romania (+7), Austria
(+6) and Italy (+5). At the same time, 16 Member States record noteworthy decreases
in the proportion of respondents that are ‘very interested’ since 2010, with the largest falls recorded in Hungary (-19) and the UK (-18).

SPECIAL EUROBAROMETER 382 “Public Attitudes towards Robots”
8
In the UK, Hungary, Greece, Spain, Malta and Ireland, the proportion of the population
that is ‘not at all interested’ in scientific discoveries and technological developments has
increased considerably since 2010. Again, the UK and Hungary stand out, as the greatest increases are recorded in these two countries (+15 and +13, respectively).
At the socio-demographic level, the data show that some social groups are more
interested in scientific discoveries and technological developments than others. On the
whole, men are much more often ‘very interested’ in scientific discoveries and
technological developments than women (33% of men, for 18% of women). Education is
also an important factor: interest levels increase with the number of years people stayed
in full-time education: 37% of respondents whose education ended at the age of 20 or
older are ‘very interested’ in new scientific discoveries and technological developments
for 23% of those who left school between 16 and 19, and just 13% of those whose
studies ended before 16. Managers are also most likely to express a great interest (41%, for 23% of manual workers, and 15% of house-persons).

SPECIAL EUROBAROMETER 382 “Public Attitudes towards Robots”
9
The analyses also point to a close relationship between interest in scientific discoveries
and technological developments and use of modern technologies: 34% of EU citizens who
use the Internet daily say that they are ‘very interested’ in scientific discoveries and technological developments.
The subsequent analysis of views and attitudes to robots will include a comparison
between EU citizens who are very interested in scientific discoveries and technological
developments, those who are ‘moderately’ interested and those who are ‘not at all
interested’.
SPECIAL EUROBAROMETER 382 “Public Attitudes towards Robots”
10
1.1. Familiarity with representations of robots
– The image of a robot is more likely to be that of an autonomous
machine used in the workplace than a human-like machine that helps in
the home –
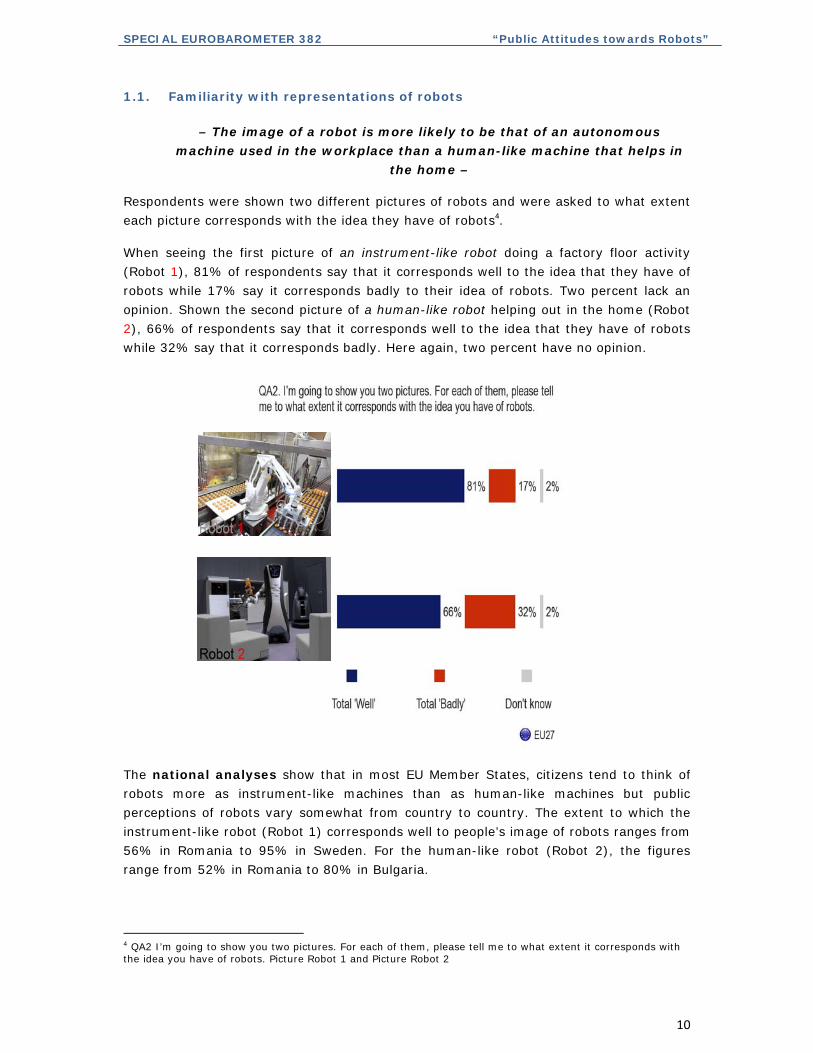
Respondents were shown two different pictures of robots and were asked to what extent
each picture corresponds with the idea they have of robots4.
When seeing the first picture of an instrument-like robot doing a factory floor activity
(Robot 1), 81% of respondents say that it corresponds well to the idea that they have of
robots while 17% say it corresponds badly to their idea of robots. Two percent lack an
opinion. Shown the second picture of a human-like robot helping out in the home (Robot
2), 66% of respondents say that it corresponds well to the idea that they have of robots while 32% say that it corresponds badly. Here again, two percent have no opinion.
The national analyses show that in most EU Member States, citizens tend to think of
robots more as instrument-like machines than as human-like machines but public
perceptions of robots vary somewhat from country to country. The extent to which the
instrument-like robot (Robot 1) corresponds well to people’s image of robots ranges from
56% in Romania to 95% in Sweden. For the human-like robot (Robot 2), the figures
range from 52% in Romania to 80% in Bulgaria.
4 QA2 I’m going to show you two pictures. For each of them, please tell me to what extent it corresponds with the idea you have of robots. Picture Robot 1 and Picture Robot 2

SPECIAL EUROBAROMETER 382 “Public Attitudes towards Robots”
11
In Malta, respondents made no distinction at all between the two pictures: both the
instrument-like machine and the human-like machine correspond well to the idea that
65% of respondents have of robots. Nor do the two images produce meaningfully
different replies in Cyprus (75% for picture 1 and 74% for picture 2), Spain (75% and
73%) and Bulgaria (83% and 80%). In Romania, Italy and Ireland, the degree to which
the two pictures produce different responses also is small (five points in Ireland and four points in Romania and Italy).
At the other extreme, the survey shows that the tendency to think of robots more as
instrument-like machines than as human-like machines is greatest in Sweden (95% vs.
63%), Germany (87% vs. 56%), Finland (93% vs. 65%), Denmark (94% vs. 66%),
Belgium (86% vs. 59%), France (86% vs. 62%) and Luxembourg (79% vs. 58%). The
difference between the two images of robots is above 20 points in these seven Western
and Northern European countries.
Overall, it should be noted that in every country, for more than half of respondents, both images correspond well with the idea people have of robots.

SPECIAL EUROBAROMETER 382 “Public Attitudes towards Robots”
12
Total 'Well' Total 'Well'
EU27 81% EU27 66%
SE 95% BG 80%
DK 94% CZ 78%
FI 93% SK 76%
NL 91% IE 75%
SI 88% CY 74%
SK 88% ES 73%
CZ 87% IT 73%
DE 87% LV 73%
BE 86% PL 73%
FR 86% NL 72%
LV 85% SI 72%
HU 84% AT 67%
BG 83% DK 66%
PL 83% EE 66%
UK 82% HU 66%
EE 80% LT 65%
IE 80% MT 65%
LU 79% FI 65%
LT 78% UK 64%
IT 77% SE 63%
ES 75% FR 62%
CY 75% EL 61%
AT 74% BE 59%
EL 69% LU 58%
MT 65% DE 56%
PT 64% PT 55%
RO 56% RO 52%
QA2. I’m going to show you two pictures. For each of them, please tell me to what extent it corresponds with the idea you
have of robots.
Total 'Well'

SPECIAL EUROBAROMETER 382 “Public Attitudes towards Robots”
13
The image of robots also differs meaningfully at the socio-demographic level, even if
here again people in all social groups are more likely to think of robots as machines doing factory floor activities than as human-like machines.
Men are somewhat more likely than women to say that each image corresponds well to
their idea of robots: in the case of the instrument-like robot the level of identification is
85% for men and 78% for women and in the case of the human-like robot the
corresponding figures are 68% for men and 64% for women.
The age analyses show that the likelihood of thinking of robots more as instrument-like
machines than as human-like machines increases with age. The difference between the
two pictures is just six points among EU citizens aged 15 to 24 (81% and 75%) and increases to 20 points among EU citizens aged 55 and over (77% and 57%).
The extent to which EU citizens identify with both images of robots increases with the
number of years they stayed in full-time education. However, among all educational
groups the tendency is to identify more with the instrument-like robot than with the human-like robot.
There are also differences depending on people’s position on the social scale: the higher
their position, the more likely they are to identify with both images of robots. All three
groups in this category are more likely to identify with the instrument-like robot than with the human-like robot.
The survey also points to large differences at the attitudinal level. 91% of respondents
who are ‘very interested’ in science say that the picture of the instrument-like machine
corresponds well to their image of robots, compared to 63% of respondents who are ‘not
at all interested’. For the image of the human-like robot, the corresponding figures are
75% and 51%, respectively. When it comes to people’s general views of robots, the
survey shows that 89% of respondents with a positive view say that the instrument-like
machine corresponds well to their image of robots, compared with 61% of those with a
negative view of robots. For the human-like robot, the figures are 73% and 46%,
respectively. Finally, in terms of Internet use, the survey shows that identification levels
are 87% and 71% respectively among daily Internet users, compared to 72% and 55%
respectively among non-users.

SPECIAL EUROBAROMETER 382 “Public Attitudes towards Robots”
14
1.2. Personal experience of robots
– Few EU citizens have experience with using robots –
To measure the use of robots at home or at work among the EU population, respondents were first provided with the following definition of robots:
“A robot is defined here as an autonomous machine which can assist humans in
everyday tasks e.g. as a kind of co-worker helping on the factory floor or as a
robot cleaner, or in activities which may be dangerous for humans, like search
and rescue in disasters. Robots can come in many shapes or sizes, including
human-like. Traditional kitchen appliances, such as a blender or a coffee maker, are not robots.”
Personal experience of robots is quite limited among EU citizens: based on the
definition above, six percent of respondents have experience of the use of a robot at
home and six percent have used or are currently using robots at work. A small proportion
of EU citizens say spontaneously that they have already used robots in another context
(1% answer ‘yes, elsewhere’), making an overall proportion of 12% who have some
personal experience of robots. Conversely, 87% of EU citizens have never used a robot in their life5.
5 QA3 Have you ever used, or are you currently using such robots at home or at work (e.g. a robotic vacuum cleaner at home or an industrial robot at work)? (MULTIPLE ANSWERS POSSIBLE)

SPECIAL EUROBAROMETER 382 “Public Attitudes towards Robots”
15
The largest differences in the extent to which EU citizens have personal experience with
robots are found at the national level. The analyses show that experience with robots
(at home, at work or somewhere else) is most widespread in Slovakia (20%), followed
by Poland (19%), Slovenia, Italy (both 18%), Denmark and Finland (both 17%). For the
use of robots in the home, Italy tops the list (14%), while Finland tops the list
when it comes to personal experience of using robots at work (12%). The
countries where personal experience of robots is least widespread are Greece, Bulgaria (both 2%), Cyprus (4%) and Malta (5%).
The socio-demographic analyses show that men use or have used robots somewhat
more often than women at work (10% vs. 3%). There are no differences in the extent to
which men and women use or have used robots at home. The age analyses show that
there are only marginal differences between the various age groups, with respondents in
the ‘working age groups’ slightly more likely to use robots at work than EU citizens who have not yet reached or have already passed the ‘working age’.

SPECIAL EUROBAROMETER 382 “Public Attitudes towards Robots”
16
In terms of education, the only notable difference also relates to the experience of using
robots at work, which is slightly more widespread (9%) among EU citizens who left full-
time education aged 20 or older than it is among those who left school at an earlier age
(6% for those who left school aged 16-19 and 4% for those who left school aged 15 or
younger). In terms of occupation, both managers and manual workers are more likely to
have personal experience with robots at work (both 10%) than other occupational groups.
The attitudinal analyses reveal slightly larger differences: 18% of EU citizens who are
‘very interested’ in science and technology have used robots (7% at home and 11% at
work), compared to just 7% of those who are ‘not at all interested’; 16% of respondents
who have a positive view of robots have personal experience of using them (7% at home and 8% at work), compared to just 5% of those who have a negative view of robots.

SPECIAL EUROBAROMETER 382 “Public Attitudes towards Robots”
17
1.3. Views on robots
1.3.1. Overall view
– A majority of EU citizens has a positive view of robots –
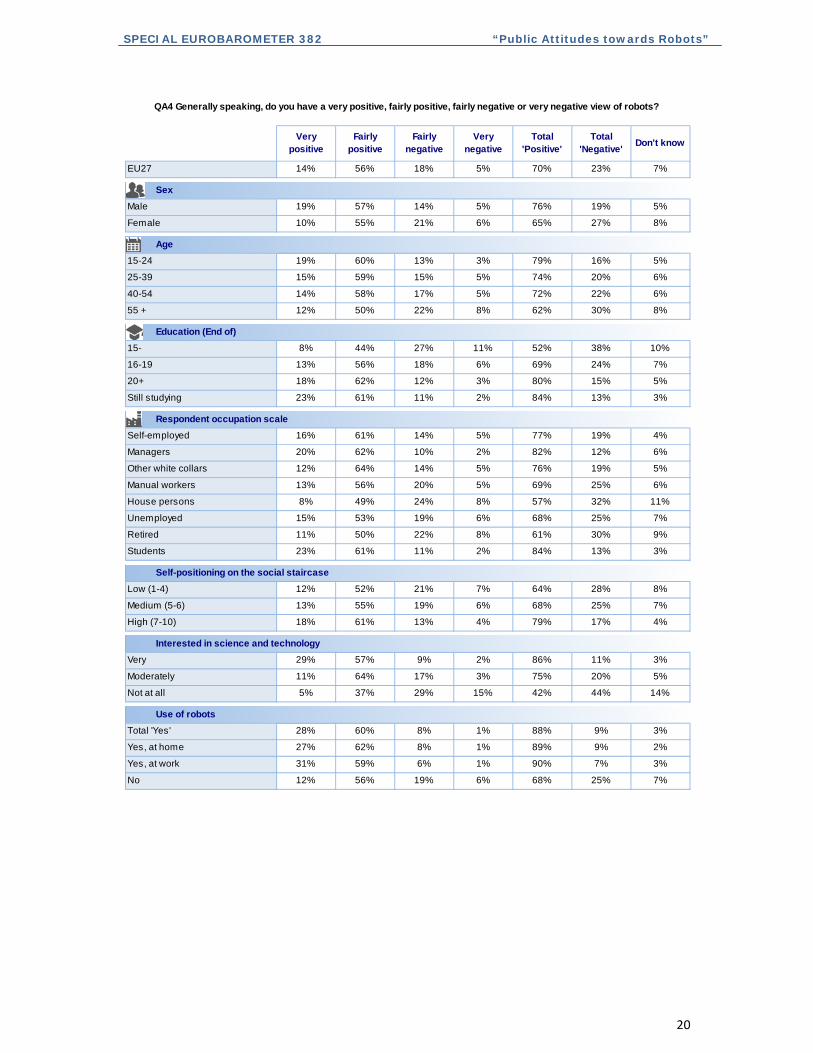
Overall, at 70%, the proportion of EU citizens with a positive view of robots is
high: the majority has a ‘fairly positive’ view (56%) with a further 14% saying that they have a ‘very positive’ view of robots6. Close to one EU citizen in five has a ‘fairly negative’
view (18%) while one EU citizen in twenty has a ‘very negative’ view (5%): overall,
slightly less than a quarter of Europeans have a negative view of robots (23%). Seven percent lack an opinion.
The national analyses show that an absolute majority of EU citizens in all Member
States has a positive view of robots, but there are nonetheless large differences between
countries. The proportion of EU citizens holding positive views about robots ranges from
54% in Greece and Malta to 88% in Denmark and Sweden. Negative views range from just 9% in Denmark to 44% in Greece.
With a difference of just ten points between those with a positive view and those with a negative view, public opinion on robots is most evenly divided in Greece.
6 QA4 Generally speaking, do you have a very positive, fairly positive, fairly negative or very negative view of robots?

SPECIAL EUROBAROMETER 382 “Public Attitudes towards Robots”
18
There is no other country where the difference between those with a positive view and
those with a negative view is this small, the next smallest difference being 20 points in
Portugal (55% positive view vs. 35% negative view) and 21 points in Cyprus (57% vs.
36%) and Malta (54% vs. 33%). After these countries, the difference jumps to 36 points
in Austria and Hungary (in both countries, 65% have a positive view of robots against
29% with a negative view). The difference between those with a positive view of robots
and those with a negative view is highest in Denmark (79 points), followed by Sweden (78 points) and the Netherlands (76 points).
This analysis points to the strong presence of a North-South divide when it comes to
attitudes to robots, with EU citizens in the northern countries holding far more positive
views than in the southern countries. Meanwhile, an analysis between the EU15 and
NMS12 countries reveals that EU citizens in the latter group tend to hold a more positive
view of robots than those in the EU15 countries (75% vs. 68%).

SPECIAL EUROBAROMETER 382 “Public Attitudes towards Robots”
19
At the socio-demographic level, the survey reveals that an absolute majority in all
social groups in the EU has an overall positive view of robots, but again there are
differences between groups in the strength of the results. In terms of gender, the
analyses show that men more often have a positive view of robots than women (76% vs. 65%) and in particular that men more often have a ‘very positive’ view (19% vs. 10%).
The proportion of respondents with a positive view decreases with age: 79% of EU
citizens aged 15 to 24 have a positive view of robots compared to 62% of those aged 55 and over.
The reverse relationship is found for education: the proportion with a positive view
increases with the length of time people spent in full-time education, and is highest
among students (84%). The same relationship is found depending on where people place
themselves on the social scale: 64% of respondents who place themselves in the lowest
positions have positive views and this increases to 79% of respondents who place themselves at the top of the scale.
There are also large differences between occupational groups: 82% of managers have positive views compared to 57% of people who are looking after the home.
The attitudinal analyses point to a strong relationship between overall views of robots
and interest in science and technology: 86% of EU citizens who are ‘very interested’ hold
positive views about robots, compared to just 42% of those who are ‘not at all
interested’ in science and technology. Among this last group, a relative majority has a
negative view of robots (44%). The few EU citizens with personal experience of using
robots are also more likely to have a positive view of robots (88%) than the wide majority who lack this experience (68%).
SPECIAL EUROBAROMETER 382 “Public Attitudes towards Robots”
20
Very positive
Fairly positive
Fairly negative
Very negative
Total 'Positive'
Total 'Negative'
Don't know
EU27 14% 56% 18% 5% 70% 23% 7%
Male 19% 57% 14% 5% 76% 19% 5%
Female 10% 55% 21% 6% 65% 27% 8%
15-24 19% 60% 13% 3% 79% 16% 5%
25-39 15% 59% 15% 5% 74% 20% 6%
40-54 14% 58% 17% 5% 72% 22% 6%
55 + 12% 50% 22% 8% 62% 30% 8%
15- 8% 44% 27% 11% 52% 38% 10%
16-19 13% 56% 18% 6% 69% 24% 7%
20+ 18% 62% 12% 3% 80% 15% 5%
Still studying 23% 61% 11% 2% 84% 13% 3%
Self-employed 16% 61% 14% 5% 77% 19% 4%
Managers 20% 62% 10% 2% 82% 12% 6%
Other white collars 12% 64% 14% 5% 76% 19% 5%
Manual workers 13% 56% 20% 5% 69% 25% 6%
House persons 8% 49% 24% 8% 57% 32% 11%
Unemployed 15% 53% 19% 6% 68% 25% 7%
Retired 11% 50% 22% 8% 61% 30% 9%
Students 23% 61% 11% 2% 84% 13% 3%
Low (1-4) 12% 52% 21% 7% 64% 28% 8%
Medium (5-6) 13% 55% 19% 6% 68% 25% 7%
High (7-10) 18% 61% 13% 4% 79% 17% 4%
Very 29% 57% 9% 2% 86% 11% 3%
Moderately 11% 64% 17% 3% 75% 20% 5%
Not at all 5% 37% 29% 15% 42% 44% 14%
Total 'Yes' 28% 60% 8% 1% 88% 9% 3%
Yes, at home 27% 62% 8% 1% 89% 9% 2%
Yes, at work 31% 59% 6% 1% 90% 7% 3%
No 12% 56% 19% 6% 68% 25% 7%
QA4 Generally speaking, do you have a very positive, fairly positive, fairly negative or very negative view of robots?
Self-positioning on the social staircase
Interested in science and technology
Use of robots
Respondent occupation scale
Sex
Age
Education (End of)

SPECIAL EUROBAROMETER 382 “Public Attitudes towards Robots”
21
1.3.2. Specific attitudes
– ‘Robots are necessary and good but also pose a threat and thus require
careful management’ –
Next, respondents were read a set of statements about robots to get an understanding of
more specific attitudes7. The analysis of the answers to these five statements reveals
that public opinion about robots is well-defined and robust, with EU citizens clearly
expressing their views and concerns: ‘don’t know’ rates never exceed 10% on this
question. On the one hand, EU citizens express a utilitarian view in that the majority
agree that “robots are necessary as they can do jobs that are too hard or too dangerous
for people” (88%) and that “robots are a good thing for society because they help
people” (76%). On the other hand, the broad consensus with the statement that “robots
are a form of technology that requires careful management” suggests that robots are
seen to pose a potential threat: 52% of respondents ‘strongly agree’ and 39% ‘tend to
agree’ with this statement, while only 6% disagree and 3% ‘don’t know’. The finding that
70% of respondents agree with the statement that “robots could steal people’s jobs” is a
further expression of scepticism. There is less consensus about the view that “widespread
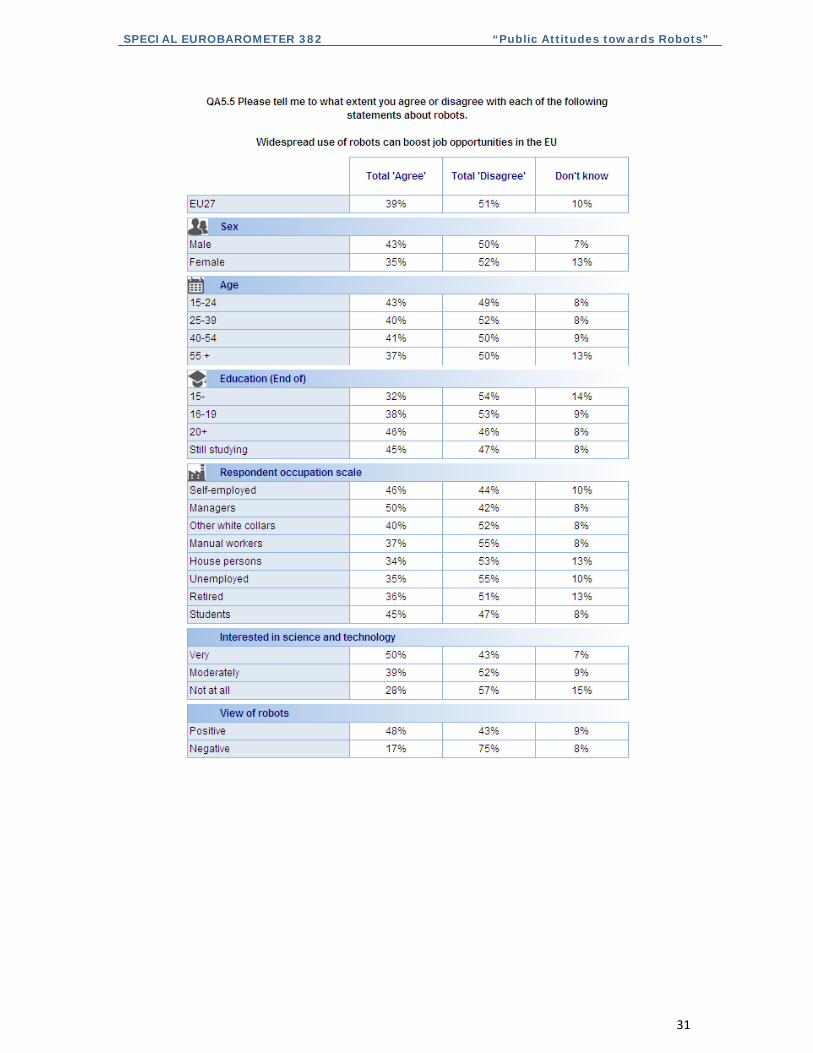
use of robots can boost job opportunities in the EU”: 39% of respondents agree with this statement while 51% disagree (and 10% have no opinion).
7 QA5 Please tell me to what extent you agree or disagree with each of the following statements about robots

SPECIAL EUROBAROMETER 382 “Public Attitudes towards Robots”
22
Statement 1: Robots are a good thing for society, because they help people
The national analyses show that an absolute majority of EU citizens in all Member
States agree that robots are a good thing for society, because they help people.
Agreement levels range from 58% in Greece to over 90% in the Czech Republic (91%),
Sweden (93%) and Slovakia (95%). In 18 other Member States, at least three-quarters
of respondents agree that robots are a good thing for society, because they help people.
Disagreement is most widespread in Greece (40%), followed by Austria (30%). The
proportion of respondents answering ‘don’t know’ is below ten percent in all Member
States.

SPECIAL EUROBAROMETER 382 “Public Attitudes towards Robots”
23
The socio-demographic analyses show that an absolute majority in all social groups in
the EU agrees with the statement. Agreement is slightly higher among men than among
women (79% vs. 74%). It increases the longer people stayed in full-time education and
the higher respondents place themselves on the social scale, but decreases with age.
Those who stayed in full-time education the longest have the highest level of agreement
(84%) while respondents who left full-time education aged 15 or younger (63%) are least likely to agree with the statement.
The attitudinal analyses reveal larger differences; 87% of EU citizens who are ‘very
interested’ in science and technology agree, compared to 59% of those who are ‘not at
all interested’. The most influential factor is people’s overall view of robots: 90% of EU
citizens with a positive view agree that robots are a good thing for society, because they help people, compared to 39% of EU citizens with a negative overall view of robots.

SPECIAL EUROBAROMETER 382 “Public Attitudes towards Robots”
24
Statement 2: Robots steal people’s jobs
The national analyses show that an absolute majority of EU citizens in all Member
States also agrees that robots steal people’s jobs, but the ranking of countries is very
different. There is some evidence of a North-South divide: agreement is lowest in the
Netherlands (51%) and Finland (55%) and highest in Portugal (89%), followed by Spain
(84%), Greece, Cyprus (both 83%) and Malta (82%). The proportion of respondents
answering ‘don’t know’ is below ten percent in all Member States.
The socio-demographic analyses show that all social groups in the EU agree with this
statement. Women more often than men consider that robots steal people’s jobs (74%
vs. 68%) and respondents who left full-time education aged 15 or younger are more
likely to agree than people who stayed in school until the age of 20 or older (78% vs.
61%). The latter category represents the social group with the lowest level of
agreement, whereas EU citizens who left full-time education aged 15 or younger and
unemployed respondents (both 78%) are the most likely to agree with the statement.

SPECIAL EUROBAROMETER 382 “Public Attitudes towards Robots”
25
Generally speaking, the view that robots steal jobs is more widespread among the most
precarious categories of the EU population. This is also evident when occupational groups
are compared: while 57% of managers believe that robots steal people’s jobs, this increases to 75% among manual workers.
Manual workers who have already used robots at work are slightly less likely to consider
that robots steal peoples’ jobs compared with those who do not use robots at work
(71%8 vs 75%9).
The attitudinal analyses show that 62% of EU citizens who are ‘very interested’ in
science and technology agree, compared to 77% of those who are ‘not at all interested’.
EU citizens with a negative overall view of robots most often agree that robots steal
people’s jobs (85%). Among EU citizens with a positive view of robots, this figure is considerably lower (66%), though it remains the majority view.
8 71% from 555 manual workers who use robots at work agree with the statement. 9 75% from 4944 manual workers who do not use robots at work agree with the statement.

SPECIAL EUROBAROMETER 382 “Public Attitudes towards Robots”
26
Statement 3: Robots are necessary as they can do jobs that are too hard or too dangerous for people
The national analyses show widespread agreement throughout the EU with the
statement that robots are necessary as they can do jobs that are too hard or too
dangerous for people. Agreement ranges from 75% in Greece to 97% in Sweden. In 13
of the 27 EU Member States at least nine out of ten citizens agree with the statement.
Apart from Greece, Portugal (78%) is the only Member State where less than eight out of ten citizens agree.

SPECIAL EUROBAROMETER 382 “Public Attitudes towards Robots”
27
The socio-demographic analyses show that agreement is widespread among all social
groups with few variations reflecting gender, age, education, occupation or social position.
There are larger differences depending on people’s overall attitude towards science and
technology and towards robots in general: 95% of EU citizens who are ‘very interested’
in science and technology agree, compared to 74% of those who are ‘not at all
interested’; 95% of EU citizens with a positive view agree that robots are a good thing
for society because they help people, compared to 68% of EU citizens with a negative overall view of robots.

SPECIAL EUROBAROMETER 382 “Public Attitudes towards Robots”
28
Statement 4: Robots are a form of technology that requires careful management
The national analyses show even more widespread agreement throughout the EU with
statement that robots are a form of technology that requires careful management.
Agreement ranges from 82% in Hungary to 98% in Cyprus (for a European average of
91%). In 19 Member States at least nine out of ten citizens agree with the statement, An
absolute majority of respondents ‘totally agree’ with this statement (56%).
The socio-demographic analyses show that there is widespread consensus among all
social groups in the EU that robots are a form of technology that requires careful
management.
The attitudinal analyses reveal some divergence in the strength of agreement
depending on people’s interest in science and technology and overall view of robots. The
analyses show that 94% of EU citizens who are ‘very interested’ in science and
technology agree, compared to 82% of those who are ‘not at all interested’; 94% of EU
citizens with a positive overall view of robots agree, compared to 84% of those with a negative view.
SPECIAL EUROBAROMETER 382 “Public Attitudes towards Robots”
29
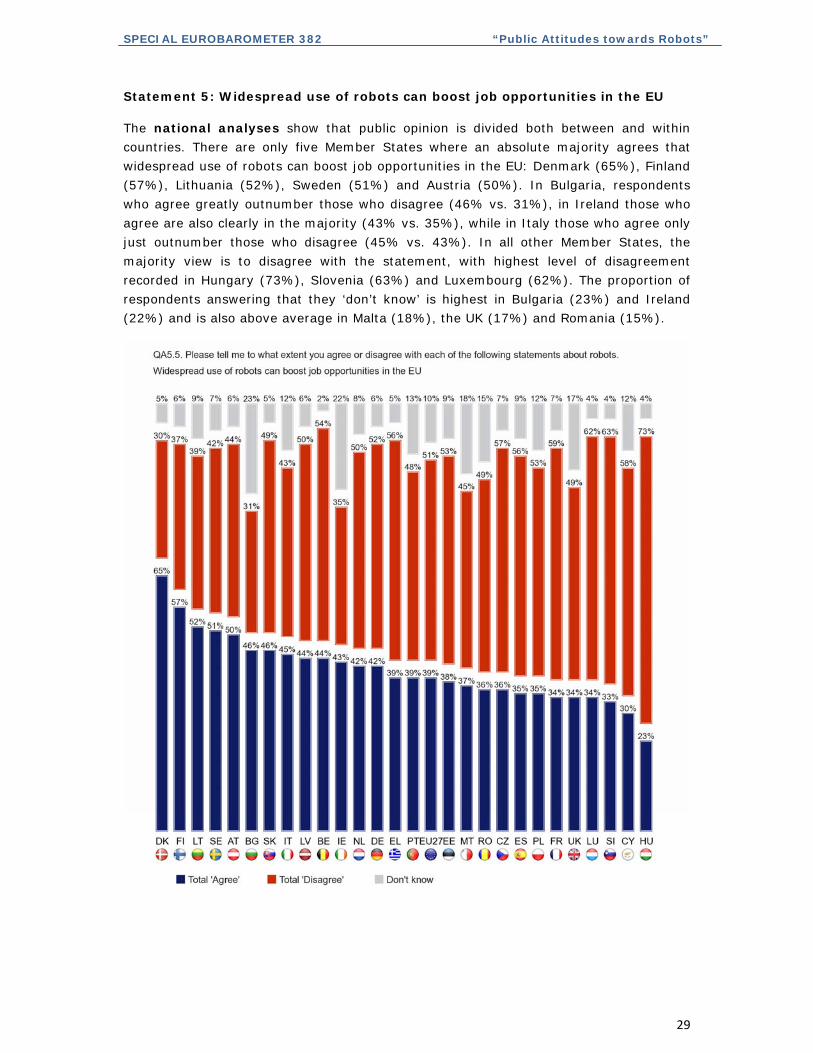
Statement 5: Widespread use of robots can boost job opportunities in the EU
The national analyses show that public opinion is divided both between and within
countries. There are only five Member States where an absolute majority agrees that
widespread use of robots can boost job opportunities in the EU: Denmark (65%), Finland
(57%), Lithuania (52%), Sweden (51%) and Austria (50%). In Bulgaria, respondents
who agree greatly outnumber those who disagree (46% vs. 31%), in Ireland those who
agree are also clearly in the majority (43% vs. 35%), while in Italy those who agree only
just outnumber those who disagree (45% vs. 43%). In all other Member States, the
majority view is to disagree with the statement, with highest level of disagreement
recorded in Hungary (73%), Slovenia (63%) and Luxembourg (62%). The proportion of
respondents answering that they ‘don’t know’ is highest in Bulgaria (23%) and Ireland (22%) and is also above average in Malta (18%), the UK (17%) and Romania (15%).

SPECIAL EUROBAROMETER 382 “Public Attitudes towards Robots”
30
The socio-demographic analyses show that while agreement levels differ considerably
between the different EU social groups there is less variation in the extent to which the
groups disagree. This is because the level of ‘don’t know’ responses fluctuates
considerably and particularly affects the distribution of responses on the basis of age and
gender. In terms of education, differences in opinion are more pronounced: the earlier
EU citizens left full-time education, the more likely they are to disagree with the
statement. There are also noteworthy differences between managers on the one hand
and manual workers, unemployed respondents and those who look after the home on the
other; 50% of managers agree compared to 34% of respondents who look after the
home, 35% of unemployed respondents and 36% of the retired. A similar division in
opinion accompanies people’s positions on the social scale.
The attitudinal analyses reveal stronger divergences. 50% of EU citizens who are ‘very
interested’ in science and technology agree, compared to 28% of those who are ‘not at all interested’.
Among the latter group, the majority disagrees with the statement (57%). There are also
clear differences depending on whether people have personal experience of robots: those
who do are far more likely to agree with the statement than those who do not (51% vs.
37%). Finally, the analyses show that 48% of respondents with a positive view agree
that widespread use of robots can boost job opportunities in the EU while 75% of those
with a negative overall view of robots disagree with this statement.
SPECIAL EUROBAROMETER 382 “Public Attitudes towards Robots”
31
SPECIAL EUROBAROMETER 382 “Public Attitudes towards Robots”
32
2. AREAS OF APPLICATION FOR ROBOTS
2.1. Areas where EU citizens believe robots should be used as a priority
- Robots should be used as a priority for tasks that are too difficult or too dangerous for humans -
Since EU citizens have a clear set of views about, and attitudes towards, robots, it is not
surprising to find that they also have a clear set of preferences regarding the areas
where they believe robots should be used as a priority10.
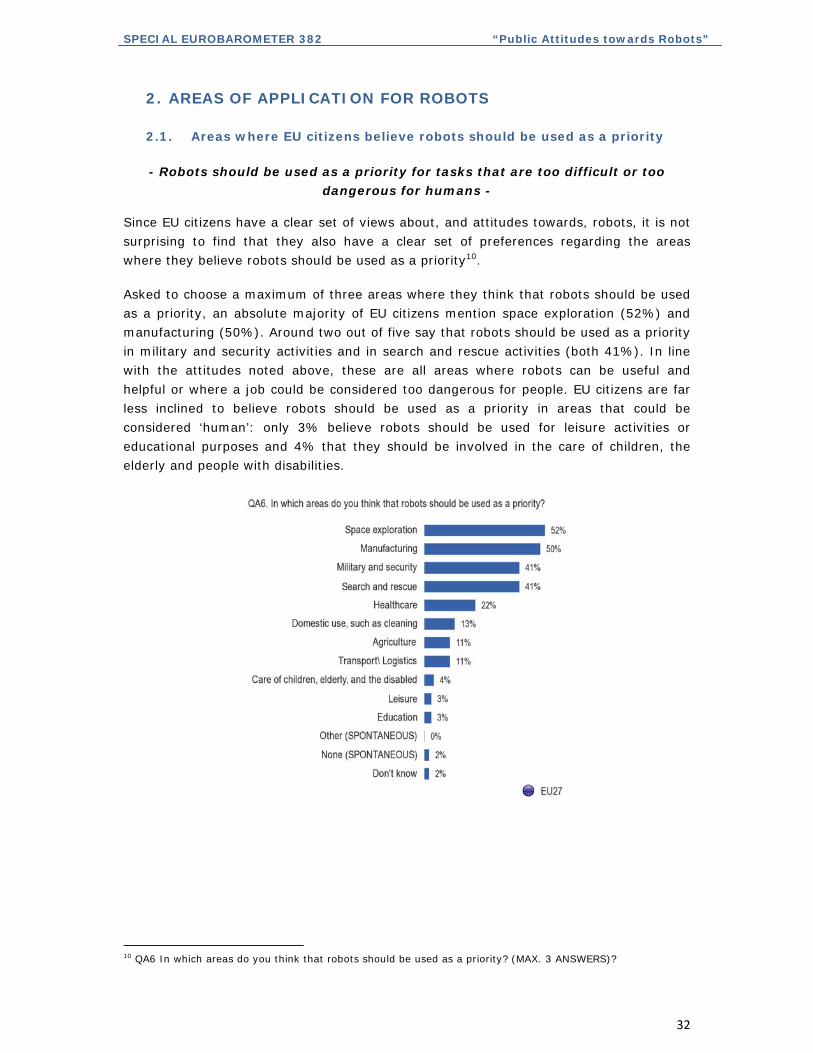
Asked to choose a maximum of three areas where they think that robots should be used
as a priority, an absolute majority of EU citizens mention space exploration (52%) and
manufacturing (50%). Around two out of five say that robots should be used as a priority
in military and security activities and in search and rescue activities (both 41%). In line
with the attitudes noted above, these are all areas where robots can be useful and
helpful or where a job could be considered too dangerous for people. EU citizens are far
less inclined to believe robots should be used as a priority in areas that could be
considered ‘human’: only 3% believe robots should be used for leisure activities or
educational purposes and 4% that they should be involved in the care of children, the
elderly and people with disabilities.
10 QA6 In which areas do you think that robots should be used as a priority? (MAX. 3 ANSWERS)?

SPECIAL EUROBAROMETER 382 “Public Attitudes towards Robots”
33
The national analyses indicate that the preferred areas in which robots should be used as a priority vary between the Member States.
Space exploration is the most mentioned priority for the use of robots in the following
11 Member States: Bulgaria, the Czech Republic, Germany, Greece, Spain, France, Italy,
Cyprus, Lithuania, Luxembourg and Hungary. The proportion of respondents selecting
space exploration as a priority area for robot use ranges from 26% in Portugal to 70% in
Cyprus.
In 13 Member States manufacturing is the most mentioned priority for the use of
robots: Belgium, Denmark, Estonia, Ireland, Latvia, the Netherlands, Austria, Poland,
Romania, Slovenia, Slovakia, Finland and Sweden. The proportion of respondents
selecting manufacturing as a priority area for robot use ranges from 23% in Cyprus to
80% in Denmark.

SPECIAL EUROBAROMETER 382 “Public Attitudes towards Robots”
34
The United Kingdom is the only country where military and security is the most
frequently mentioned priority. 64% of UK respondents selected it as a priority area for
the use of robots. In Germany (49%) and Cyprus (48%), close to half of respondents
also select this domain. The preference for using robots in this area is least in Greece
(19%).
In Malta (46%) and Portugal (45%) search and rescue is the most mentioned priority.
However, the proportion of respondents selecting this as a priority area for robot use is
highest in Estonia (59%). Respondents in Romania mentioned search and rescue as a
priority area least frequently (21%).
In none of the Member States are any of the other areas considered a top priority for the
use of robots. The proportion of respondents selecting healthcare as a priority area
ranges from eight percent in Latvia to 38% in Belgium. The proportion of respondents
selecting domestic use ranges from six percent in Sweden to 24% in Romania.
Agriculture is seen as a priority area for the application of robots by just six percent of
respondents in Greece. The highest proportion is noted in Romania (23%). Responses for
transport/logistics range from just three percent in Malta to 25% in the Netherlands.
Responses are below ten percent in all Member States when it comes to the application
of robots in the areas of care, leisure and education.
At the socio-demographic level there are some notable differences: 61% of managers
view manufacturing as a top priority for robot use, compared with 39% of house-
persons. Respondents aged 55 and over are far less receptive to the use of robots in
space exploration (46%) than younger EU citizens (55%). Overall, the analyses show
that education is an important factor when it comes to the use of robots in
manufacturing and space exploration: respondents who left full-time education aged 15
or younger are less likely to regard these two areas as priorities than those who
remained in full-time education longer.
When it comes to personal experience of the use of robots, it is interesting to note that
29% of EU citizens who have used robots at home consider domestic use a priority area
for robots (compared to an EU average of 13%).
Finally, the analyses show large differences between EU citizens with a positive view of
robots and those with a negative view, especially with regard to the use of robots in
manufacturing: 56% of EU citizens with a positive view of robots consider this a priority
area, compared to 32% of those with a negative view.
SPECIAL EUROBAROMETER 382 “Public Attitudes towards Robots”
35
2.2. Areas where EU citizens believe robots should not be used
- Robots should not be used to care for people –
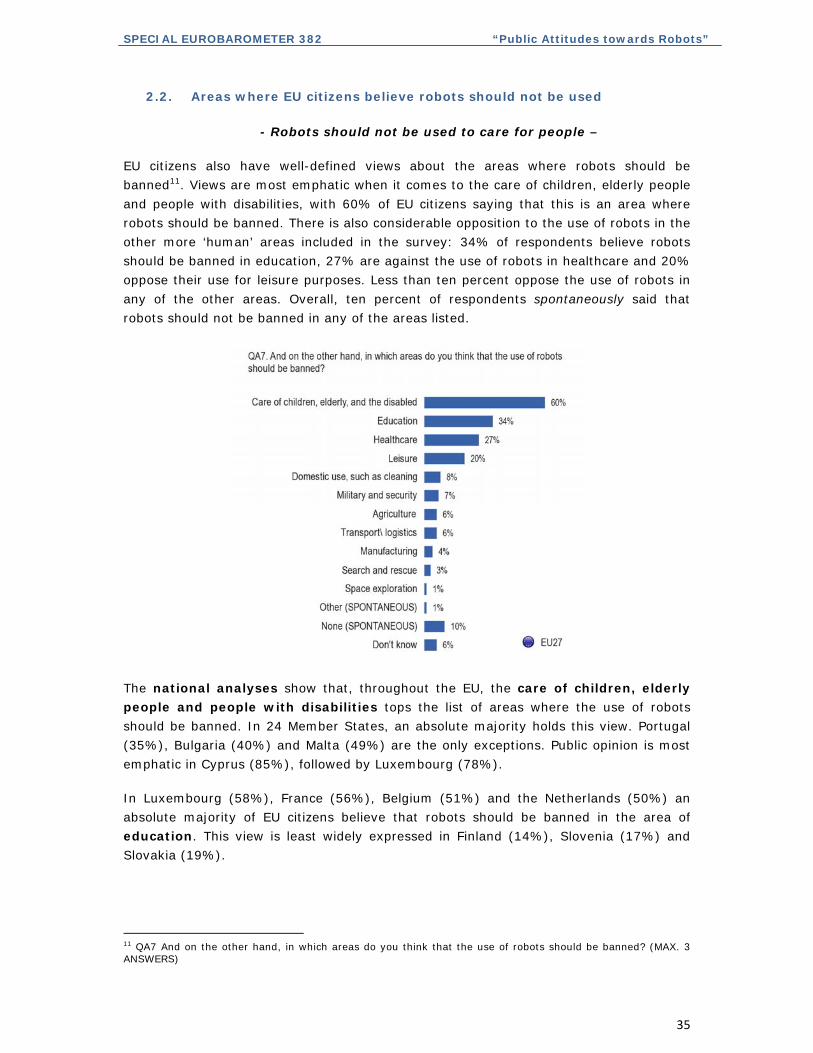
EU citizens also have well-defined views about the areas where robots should be
banned11. Views are most emphatic when it comes to the care of children, elderly people
and people with disabilities, with 60% of EU citizens saying that this is an area where
robots should be banned. There is also considerable opposition to the use of robots in the
other more ‘human’ areas included in the survey: 34% of respondents believe robots
should be banned in education, 27% are against the use of robots in healthcare and 20%
oppose their use for leisure purposes. Less than ten percent oppose the use of robots in
any of the other areas. Overall, ten percent of respondents spontaneously said that
robots should not be banned in any of the areas listed.
The national analyses show that, throughout the EU, the care of children, elderly
people and people with disabilities tops the list of areas where the use of robots
should be banned. In 24 Member States, an absolute majority holds this view. Portugal
(35%), Bulgaria (40%) and Malta (49%) are the only exceptions. Public opinion is most
emphatic in Cyprus (85%), followed by Luxembourg (78%).
In Luxembourg (58%), France (56%), Belgium (51%) and the Netherlands (50%) an
absolute majority of EU citizens believe that robots should be banned in the area of
education. This view is least widely expressed in Finland (14%), Slovenia (17%) and
Slovakia (19%).
11 QA7 And on the other hand, in which areas do you think that the use of robots should be banned? (MAX. 3 ANSWERS)

SPECIAL EUROBAROMETER 382 “Public Attitudes towards Robots”
36
An absolute majority of respondents in Lithuania (53%) is of the view that robots should
be banned in healthcare and more than two out of five respondents in Latvia (48%),
Malta (44%) and Estonia (42%) share this view. The Czech Republic (14%) is the only
country where less than one respondent out of five is says that robots should be banned
from healthcare.
The use of robots in leisure should be banned according to more than three out of ten
respondents in Belgium (37%), France and Slovenia (both 31%). In the Czech Republic
(26%) more than a quarter of respondents share this view. It is least widely mentioned
in Portugal (4%).
The view that robots should be banned for domestic use is far more widespread in
Cyprus (25%) than in other Member States. It is also above the average in Greece
(17%) and Belgium (16%). The view that robots should be banned in the military and
security sphere is most often mentioned in Greece (19%), followed by Cyprus (16%).
In all Member States there is very little opposition to the use of robots in the other areas.
The national analyses also show that a considerable minority of respondents in Finland
(27%) and Denmark (23%) spontaneously indicated that robots should not be banned in
any of the 11 areas included in the survey.
Care of children,
elderly, and the disabled
Education Healthcare LeisureDomestic
use, such as cleaning
Military and security
AgricultureTransport\ logistics
ManufacturingSearch and
rescueSpace
explorationNone (SPONT.) Don't know
EU27 60% 34% 27% 20% 8% 7% 6% 6% 4% 3% 1% 10% 6%
BE 59% 51% 23% 37% 16% 6% 6% 6% 5% 3% 3% 3% 1%
BG 40% 30% 35% 10% 5% 13% 8% 12% 2% 2% 2% 8% 16%
CZ 53% 22% 14% 26% 6% 13% 6% 9% 1% 2% 1% 15% 6%
DK 59% 31% 25% 19% 10% 5% 2% 4% 1% 4% 0% 23% 1%
DE 74% 30% 28% 21% 7% 7% 4% 6% 3% 5% 2% 9% 2%
EE 54% 40% 42% 24% 10% 10% 4% 6% 1% 2% 1% 7% 4%
IE 62% 23% 33% 15% 10% 4% 7% 6% 4% 3% 1% 9% 11%
EL 61% 36% 24% 18% 17% 19% 5% 6% 7% 1% 0% 9% 5%
ES 52% 38% 29% 15% 6% 6% 8% 6% 6% 2% 1% 10% 6%
FR 64% 56% 26% 31% 8% 8% 9% 8% 6% 2% 1% 6% 3%
IT 50% 28% 24% 21% 9% 6% 7% 5% 6% 6% 1% 13% 9%
CY 85% 38% 36% 21% 25% 16% 7% 1% 3% 3% 1% 1% 1%
LV 60% 33% 48% 25% 5% 10% 3% 6% 2% 3% 2% 5% 5%
LT 61% 35% 53% 16% 3% 8% 2% 5% 1% 2% 0% 9% 4%
LU 78% 58% 38% 21% 5% 11% 6% 8% 3% 4% 1% 3% 1%
HU 57% 35% 32% 24% 10% 6% 8% 3% 6% 2% 2% 11% 6%
MT 49% 34% 44% 12% 5% 7% 4% 8% 12% 2% 2% 4% 9%
NL 57% 50% 28% 24% 9% 7% 2% 2% 2% 2% 1% 13% 3%
AT 73% 41% 39% 17% 7% 12% 7% 8% 3% 7% 2% 7% 3%
PL 61% 22% 21% 16% 4% 6% 4% 5% 3% 2% 1% 9% 8%
PT 35% 22% 30% 4% 4% 6% 5% 3% 5% 2% 1% 15% 24%
RO 51% 33% 27% 19% 7% 12% 6% 6% 2% 4% 1% 7% 13%
SI 76% 17% 27% 31% 7% 9% 6% 11% 1% 2% 0% 6% 2%
SK 55% 19% 26% 21% 5% 11% 4% 9% 1% 4% 2% 12% 6%
FI 53% 14% 21% 13% 7% 8% 1% 4% 1% 6% 1% 27% 1%
SE 68% 28% 38% 21% 9% 9% 3% 3% 0% 2% 1% 18% 1%
UK 61% 30% 30% 12% 11% 4% 4% 6% 4% 3% 1% 14% 6%
QA7 And on the other hand, in which areas do you think that the use of robots should be banned?
Highest percentage per countryHighest percentage per item
Lowest percentage per countryLowest percentage per item

SPECIAL EUROBAROMETER 382 “Public Attitudes towards Robots”
37
The socio-demographic analyses reveal few notable differences, although educational
levels are a good guide to how respondents think about banning robots from education:
28% of EU citizens who left full-time education aged 15 or younger believe robots should
be banned in education, compared to 38% of those who left school aged 20 or older and 39% of those who are still studying.
Finally, a good overall measure of public opinion on the areas of application for robots is
obtained from a simple comparison of the results of the two questions. This comparison
shows that support for the use of robots is most widespread in the case of space
exploration (+51 point difference between the proportion of respondents who believe
robots should be used as a priority and the proportion who believe robots should not be
used). The comparison also shows that EU citizens who view domestic use as a priority
area for robots (13%) outnumber those who believe robots should not be used in this
domain (8%). The areas where opposition to the application of robots is more
widespread than support are in order of magnitude: care (-56), education (-31), leisure (-17) and healthcare (-5).

SPECIAL EUROBAROMETER 382 “Public Attitudes towards Robots”
38
3. ROBOTS IN THE EU: FUTURE PERSPECTIVES
3.1. Acceptance of tasks done by a robot
– EU citizens are willing to accept help from a robot at work
but are totally against having their children or elderly parents
minded by a robot -
In order to understand public acceptance of various tasks done by robots, respondents
were asked on a scale from 1 to 10 how comfortable they would personally feel about
four different things that could be done by robots12.
The results confirm the earlier findings from this survey: EU citizens are fairly
receptive to the use of robots in manufacturing but far less willing to use them
for human tasks. There is outright opposition to the use of robots to look after one’s
children or elderly parents.
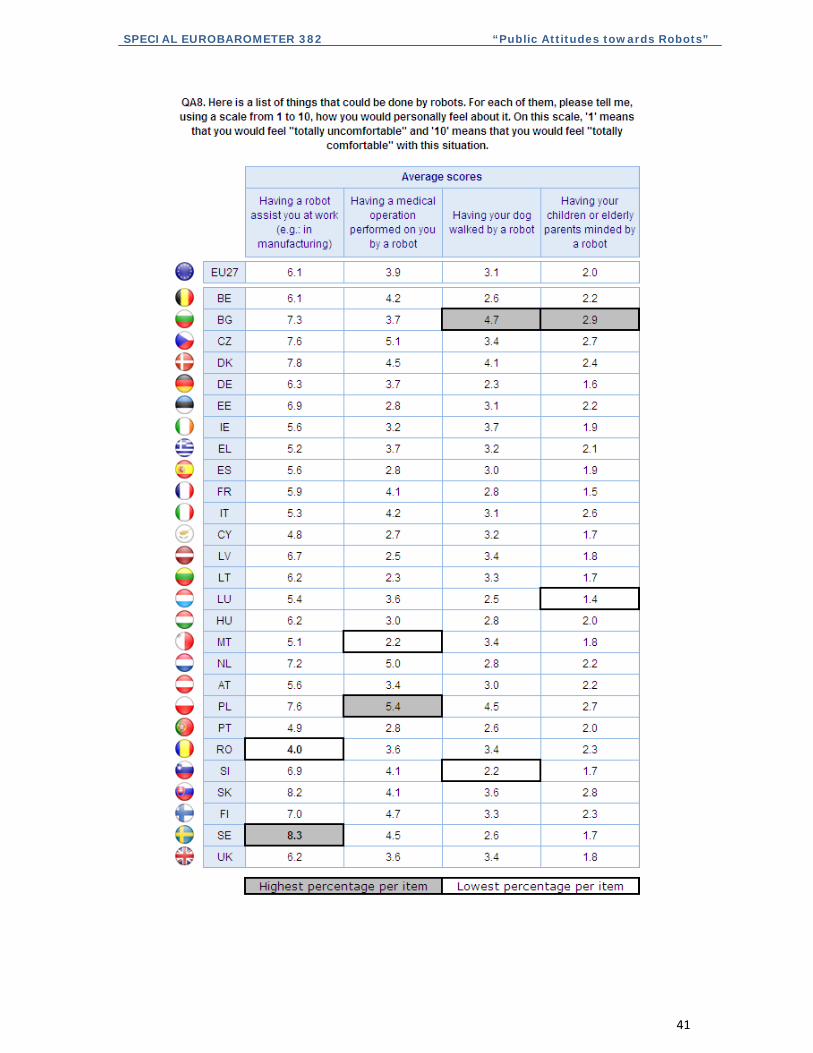
Close to half of EU citizens (48%) would feel ‘comfortable’ (points 7 to 10 on the scale)
accepting assistance from a robot at work (e.g. in manufacturing), one in five (21%)
would feel ‘fairly comfortable’ in this situation (points 5-6 on the scale) and over a
quarter (27%) would feel ‘uncomfortable’ (points 1 to 4 on the scale). For the other three
situations presented to respondents, the majority would feel ‘uncomfortable’: on
average, 86% would feel ‘uncomfortable’ about having their children or elderly
parents minded by a robot (in fact, 66% chose point 1 ‘totally uncomfortable’ on the
scale), 69% would feel ‘uncomfortable’ about having their dog walked by a robot
(47% ‘totally uncomfortable’) and 57% would feel ‘uncomfortable’ about having a
medical operation performed on them by a robot (37% ‘totally uncomfortable’).
12 QA8 Here is a list of things that could be done by robots. For each of them, please tell me, using a scale from 1 to 10, how you would personally feel about it. On this scale, '1' means that you would feel "totally uncomfortable" and '10' means that you would feel "totally comfortable" with this situation.

SPECIAL EUROBAROMETER 382 “Public Attitudes towards Robots”
39
Before analysing the national results for each item separately, it should be noted that
there are considerable difference between EU15 countries and NMS12 countries in the
level of acceptance of jobs done by robots. For all tasks, EU citizens living in the NMS12 countries would be more comfortable accepting the use of robots.
Task 1: Having a medical operation performed on you by a robot
The national analyses show that in all Member States respondents most often chose
point 1 – ‘totally uncomfortable’ - on the 10-point scale when asked how they would
personally feel about having a medical operation performed on them by a robot. But
views on this matter vary considerably between countries: the proportion of respondents
who said they would feel ‘totally uncomfortable’ ranges from 20% in the Netherlands to
70% in Lithuania.
Average scores on the 10-point scale range from 2.2 in Malta to 5.4 in Poland (for an EU
average of 3.9). The average score for the EU15 countries is 3.8 compared with 4.3 in
the NMS12 countries.
There are only four Member States where more than a third of citizens would feel
comfortable (points 7 to 10 on the scale) if a robot performed a medical operation on
them: Poland (39%), the Netherlands (37%), and Finland and the Czech Republic (both 35%). In a further six Member States, this applies to at least a quarter of respondents.

SPECIAL EUROBAROMETER 382 “Public Attitudes towards Robots”
40
At the other extreme, the survey shows that around eight in ten citizens in Malta (81%),
Lithuania (80%) and Latvia (79%) would feel uncomfortable (points 1 to 4 on the scale)
in this situation. In Cyprus, Spain (both 75%) and Portugal (74%), this applies to around three quarters of respondents.
SPECIAL EUROBAROMETER 382 “Public Attitudes towards Robots”
41

SPECIAL EUROBAROMETER 382 “Public Attitudes towards Robots”
42
The socio-demographic analyses also show that respondents in all social groups most
often chose point 1 – ‘totally uncomfortable’ - on the 10-point scale. But views on this
matter also vary between social groups. Men are more likely than women to feel
comfortable in this situation (27% and 19% respectively choose points 7 to 10 on the
scale), and the same applies to respondents who stayed in education the longest
compared with those who left school aged 15 or younger (30% vs. 14%) and managers compared with house-persons (32% vs. 15%).
The attitudinal analyses display a similar pattern. ‘Totally uncomfortable’ is the most
frequently selected response, irrespective of respondents’ views on science in general,
their overall attitude towards robots or their personal experience of robots. However,
views do also differ at the attitudinal level: 33% of the EU citizens who are ‘very
interested’ in science and technology would feel comfortable, compared to 13% of those
who are ‘not at all interested’; 31% of the respondents with personal experience of
robots would feel comfortable vs. 22% of those without this experience; and 28% of EU
citizens with a positive view of robots would feel comfortable, compared to just nine percent of those with a negative view.

SPECIAL EUROBAROMETER 382 “Public Attitudes towards Robots”
43
Task 2: Having your dog walked by a robot
For this task again, the national analyses show that ‘totally uncomfortable’ is the most
frequently selected response in all Member States, with the proportion of respondents
selecting point 1 on the 10-point scale ranging from 24% in Bulgaria to 62% in Germany
and Luxembourg. Nonetheless, views do vary considerably between countries, with
average scores ranging from 2.2 in Slovenia to 4.7 in Bulgaria (compared with 3.1 in the
EU generally). The average score for the EU15 countries is 2.9 compared with 3.8 for the
NMS12 countries.
In just three Member States would more than a quarter of citizens feel comfortable
(points 7 to 10 on the scale) if a robot walked their dog: Poland (28%), Bulgaria (27%),
and Denmark (25%). In Ireland, this applies to 24% of respondents.

SPECIAL EUROBAROMETER 382 “Public Attitudes towards Robots”
44
Conversely, the survey shows that around eight in ten citizens in Slovenia (82%),
Luxembourg (81%), Sweden (80%) and Germany (79%) would feel uncomfortable
(points 1 to 4 on the scale) in this situation. In Belgium (76%), France and the Netherlands (both 75%), this applies to around three-quarters of those surveyed.
‘Totally uncomfortable’ is also the most frequently selected reply in all social groups. The
socio-demographic analyses show that the proportion of respondents choosing point 1
on the 10-point scale ranges from 28% of students to 56% of retired EU citizens and
those who left full-time education aged 15 or younger. Education produces the largest
variations, with just eight percent of respondents who left full-time education aged 15 or
younger saying that they would feel comfortable (points 7 to 10 on the scale), compared to 25% of students.
Age also matters in this regard: 23% of EU citizens aged 15 to 24 would feel
comfortable, compared to just nine percent of those aged 55 and over. Finally, the
analyses shows that men are somewhat more likely than women to feel comfortable in this situation (17% and 12%, respectively, choose points 7 to 10 on the scale).
‘Totally uncomfortable’ is also the most frequently selected reply irrespective of people’s
views of science in general, their overall attitude towards robots or their personal
experience of robots. The attitudinal analyses show that 18% of the EU citizens who
are ‘very interested’ in science and technology would feel comfortable (points 7 to 10 on
the scale), compared to 10% of those who are ‘not at all interested’; and 17% of EU
citizens with a positive outlook on robots would feel comfortable, compared to just seven percent of EU citizens with a negative view.
Task 3: Having a robot assist you at work (e.g.: in manufacturing)
The national analyses show that in all Member States this is the task performed by
robots with which EU citizens are most likely to feel comfortable. Nonetheless, comfort
levels vary considerably between countries: the proportion of respondents saying that
they would feel ‘totally comfortable’ (point 10 on the scale) ranges from seven percent in
Italy and Portugal to 49% in Sweden; average scores on the 10-point scale range from
4.0 in Romania to 8.3 in Sweden (compared with an EU average of 6.1). The average score for the EU15 countries is 6.0 compared with 6.6 for the NMS12 countries.
In 12 Member States more than half of respondents say that they would feel comfortable
(points 7 to 10 on the scale) if a robot assisted them at work, ranging from 52% in
Belgium to 81% in Sweden. Close to half share this opinion in Lithuania (49%), Germany
and the UK (both 48%).
At the opposite end of the scale, the survey shows that 54% of respondents in Romania
would feel uncomfortable (points 1 to 4 on the scale) in this situation. This applies to
nearly half the respondents in Cyprus (48%) and to just above two-fifths in Portugal and Malta (both 42%) and Greece (41%).

SPECIAL EUROBAROMETER 382 “Public Attitudes towards Robots”
45
The socio-demographic analyses show that the proportion of respondents choosing
point 10 (‘totally comfortable’) on the 10-point scale ranges from just nine percent of
house-persons to 26% of managers. Education again produces large variations; 32% of
respondents who left full-time education aged 15 or younger say that they would feel
comfortable (points 7 to 10), compared to 60% of students and those who left full-time
education aged 20 or older. The largest difference, however, is found between managers
(63% feel comfortable) and people who look after the home (34% of house-persons feel
comfortable). There are also considerable differences on the basis of gender and age:
men are more comfortable than women, and the older EU citizens are the less likely they would be comfortable about having a robot assist them at work.

SPECIAL EUROBAROMETER 382 “Public Attitudes towards Robots”
46
Views on this matter are strongly dependent on how people think about science in
general and their overall attitude towards robots. The attitudinal analyses show that
point 10 on the scale (‘totally comfortable’) is the answer most frequently selected by
respondents who are ‘very interested’ in science and technology (27%) while point 1 on
the scale (‘totally uncomfortable’) is the most frequent response of those who are ‘not at
all interested’ (23%). Similarly, point 10 on the scale is the most frequent response of
those with a positive view of robots (23%) while point 1 on the scale is the answer most frequently selected by those with a negative view (27%).

SPECIAL EUROBAROMETER 382 “Public Attitudes towards Robots”
47
Task 4: Having your children or elderly parents minded by a robot
Finally, the national analyses show that large majorities in all Member States would
feel ‘very uncomfortable’ if their children or elderly parents were minded by a robot. The
proportion feeling ‘totally uncomfortable‘ (point 1 on the 10-point scale) ranges from
44% in Bulgaria to 86% in Luxembourg and average scores on the scale range from 1.4
in Luxembourg to 2.9 in Bulgaria (compared with 2.0 in the EU as a whole). The average
score for the EU15 countries is 1.9 compared with 2.5 in the NMS12 countries.
Bulgaria (where 68% choose points 1 to 4 on the scale) and Poland (73%) are the only
Member States where less than three-quarters would feel uncomfortable if a robot
minded their children or elderly parents. This applies to more than nine out of ten of
respondents in Luxembourg (96%), France (95%), Germany and Sweden (both 93%), and Cyprus and Slovenia (both 92%).

SPECIAL EUROBAROMETER 382 “Public Attitudes towards Robots”
48
‘Totally uncomfortable’ is by far the most widespread reply among all social groups. The
socio-demographic analyses show that the proportion of respondents choosing point 1
on the 10-point scale ranges from 57% of those aged 15-24 to 73% of divorced or separated EU citizens.
‘Totally uncomfortable’ is also the most frequently selected reply irrespective of people’s
views of science in general, their overall attitude towards robots or their personal
experience of robots. The attitudinal analyses show that 62% of EU citizens who are
‘very interested’ in science and technology would feel ‘totally uncomfortable’, compared
to 70% of those who are ‘not at all interested’; 61% with personal experience of robots
would feel ‘totally uncomfortable’ vs. 67% of those without this experience; and 61% of
EU citizens with a positive view of robots would feel ‘totally uncomfortable’, compared to 79% of those with a negative view..
Summary of overall acceptance levels
The national analyses show that, overall, the greatest acceptance of tasks done by
robots is found in Poland, where the average score for the four items is 5.1. The Czech
Republic, Denmark, Slovakia and Bulgaria follow, each with an average score of 4.7.
After this cluster, there is a further cluster with acceptance levels above point 4 (average
score for all four items), consisting of Finland, the Netherlands and Sweden (all 4.3).
Acceptance is lowest in three Southern European countries: Portugal, Cyprus and Malta
(all 3.1). This highlights both the North-South divide noted earlier and the differences
between public opinion in the EU15 and NMS12 countries.
From a socio-demographic perspective, the analyses indicate that, overall,
acceptance levels are higher among men than women (average scores for the four items
are 4.1 and 3.5 respectively). Education accounts for wide differences in acceptance
levels, with average scores on the scale ranging from 3.1 among respondents who left
full-time education aged 15 and younger to 4.2 for those who stayed in full-time
education until the age of 20 or older. Respondents who left full-time education aged 15
and younger have the lowest acceptance levels of all social groups. The highest
acceptance levels are noted among students (average score for the four items is 4.4.) and managers (4.3).
Finally, the attitudinal analyses show that the average scale scores for the four items
are 2.7 among EU citizens with a negative view of robots compared with 4.2 among
those with a positive view and 3.1 for respondents who are ‘not at all interested’ in
science compared with 4.3 among those who are ‘very interested’. Respondents with
personal experience of robots also have a higher level of acceptance (average score for the four items is 4.3) than those without this experience (3.7).

SPECIAL EUROBAROMETER 382 “Public Attitudes towards Robots”
49
3.2. When will it become commonplace for robots to do housework?
– Robots doing the housework will not be commonplace in the near
future –
Finally, respondents were asked when they think it will become commonplace in Europe
for robots to do housework13. The results show that most EU citizens do not see this
happening in the near future: only eight percent believe that in 5 years’ time it will
become commonplace for robots to do housework and four percent spontaneously say
that it is already commonplace. At the other extreme, seven percent spontaneously say
that it will never become commonplace. The majority view is that robots will do the
housework in more than 20 years’ time (30%), while around two in five EU citizens
believe it will be at least 20 years (21%) or at least 10 more years (22%) before robots
doing housework will become commonplace.
The national analyses demonstrate that opinions vary considerably between the
Member States. The most widely held view is that it will be more than 20 years before it
is commonplace for robots to do the housework. This is the most widespread
perception in 17 of the 27 Member States. In the 10 remaining Member States the
most common view is that it will be 10 years before it becomes commonplace for robots
to do housework.
13 QA9 In your opinion, in Europe, when it will become commonplace for robots to do house work?

SPECIAL EUROBAROMETER 382 “Public Attitudes towards Robots”
50
In (less than) 5 years’ time
The perception that robots doing the housework will be commonplace in five years’ time
or that it is already commonplace is generally low throughout the EU. There are some
exceptions: in Denmark 27% of respondents believe that it will take 5 years. There is no
other country where more than 20% hold this view and in 20 Member States ten percent
or less express this belief. In Austria and Portugal eight percent of respondents say that
it is already commonplace and in Slovakia, seven percent believe this to be the case.
In 10 years’ time
This is the most widespread view in 10 Member States: Belgium, Denmark, Italy, Malta,
the Netherlands, Austria, Slovenia, Slovakia, Finland and Sweden. Respondents in
Hungary are least likely to believe that it will be 10 years before robots doing housework
is a commonplace activity (12%) while respondents in Denmark are most likely to think
it will take 10 years (37%).
In 20 years’ time
The proportion of respondents who say that it will be 20 years before it is commonplace
for robots to do housework ranges from 14% in Malta and Portugal to 28% in the Czech
Republic.
In more than 20 years’ time
This is the likeliest opinion in 17 Member States: Bulgaria, the Czech Republic, Germany,
Estonia, Ireland, Greece, Spain, France, Cyprus, Latvia, Lithuania, Luxembourg,
Hungary, Poland, Portugal, Romania and the United Kingdom. Respondents in Denmark
are least likely to believe that it will be more than 20 years before robots doing
housework becomes a commonplace activity (13%) while respondents in Lithuania are
most likely to think it will be more than 20 years (47%).
Never
In five Member States, ten percent or more believe that it will never become
commonplace for robots to do the housework: Germany (15%), Hungary (12%), and
Lithuania, Austria and Romania (all 10%).
‘Don’t know’
Lastly, the national analyses show that in three Member States a high proportion of
respondents have no opinion: 24% in Portugal and 19% in Bulgaria and Malta.

SPECIAL EUROBAROMETER 382 “Public Attitudes towards Robots”
51
In 5 years’ time
In 10 years’ time
In 20 years’ time
In more than 20 years’
time
It is already commonplace
(SPONTANEOUS)
Never (SPONTANEOUS)
Don't know
EU27 8% 22% 21% 30% 4% 7% 8%
BE 14% 31% 21% 26% 3% 4% 1%
BG 7% 20% 20% 27% 3% 4% 19%
CZ 8% 21% 28% 29% 4% 5% 5%
DK 27% 37% 16% 13% 5% 1% 1%
DE 4% 18% 21% 31% 4% 15% 7%
EE 7% 22% 25% 35% 2% 4% 5%
IE 9% 19% 21% 28% 3% 8% 12%
EL 5% 20% 19% 40% 2% 7% 7%
ES 10% 19% 15% 36% 6% 5% 9%
FR 12% 27% 22% 29% 1% 5% 4%
IT 9% 24% 21% 20% 7% 8% 11%
CY 6% 19% 20% 39% 0% 6% 10%
LV 8% 25% 23% 30% 3% 7% 4%
LT 2% 14% 20% 47% 1% 10% 6%
LU 10% 28% 21% 30% 4% 3% 4%
HU 3% 12% 22% 44% 2% 12% 5%
MT 16% 27% 14% 19% 3% 2% 19%
NL 9% 30% 27% 27% 1% 4% 2%
AT 10% 25% 18% 23% 8% 10% 6%
PL 5% 18% 23% 39% 2% 3% 10%
PT 9% 18% 14% 21% 8% 6% 24%
RO 9% 17% 15% 27% 5% 10% 17%
SI 12% 27% 26% 21% 4% 6% 4%
SK 13% 26% 25% 22% 7% 4% 3%
FI 15% 34% 26% 19% 1% 3% 2%
SE 10% 31% 23% 30% 2% 3% 1%
UK 8% 25% 24% 31% 1% 5% 6%
QA9 In your opinion, in Europe, when it will become commonplace for robots to do house work?
Highest percentage per Highest percentage per item
Lowest percentage per Lowest percentage per
SPECIAL EUROBAROMETER 382 “Public Attitudes towards Robots”
52
The socio-demographic analyses indicate that the majority view among all social
groups except students and the respondents who place themselves highest on the social
scale is that it will be more than 20 years before robots commonly do housework.
Students are more likely to think it will be 10 years (30%) than more than 20 years
(25%). Among EU citizens who place themselves at the top of the social scale, equal
proportions believe it will be 10 years and at least 20 more years (both 27%).
The attitudinal analyses show that EU citizens who are ‘very interested’ in science and
technology are divided as to whether it will be 10 years (28%) or at least 20 years
(27%). Respondents who already use robots are more likely to believe it will be 10 years
than more than 20 years (27% vs. 23%) whereas the most widespread view among the
majority of EU citizens who do not use robots is that it will be more than 20 years (31%).
The most common view among respondents with both a positive and a negative view of
robots is that it will take more than 20 years. However, this tendency is stronger among
those with a negative view: 35% of ‘negative’ respondents believe it will be more than
20 years, compared with 28% of the ‘positive’ group. Nearly as many ‘positive’
respondents believe it will be 10 more years before it becomes commonplace for robots
to do the housework (25%).

SPECIAL EUROBAROMETER 382 “Public Attitudes towards Robots”
53
CONCLUSIONS
The survey shows that a quarter of EU citizens are ‘very interested’ in new scientific
discoveries and technological developments. However, this proportion is now somewhat
lower than it was in 2010. The survey results demonstrate that this variable is an
important determinant of views and attitudes towards robots.
The majority of Europeans indicate that both the image of an instrument-like machine
used in the workplace and the image of a human-like machine helping in the home
corresponded well to their idea of robots. However, they are more likely think of robots
as instrument-like machines than as human-like machines.
While EU citizens have ideas about what robots look like, not many have direct personal
experience of robots; the survey shows that six percent of respondents have used or are
currently using robots in their home and an equal proportion have used or are currently
using a robot in their home.
Overall EU citizens have a positive view of robots: more than two-thirds of
Europeans are of this opinion. However, further analyses show that the public are clear
that while robots serve a utilitarian purpose and are useful for tasks that are
too dangerous or difficult for humans, their use nevertheless requires careful
management. EU citizens express widespread concern that robots could steal people’s
jobs; however, a sizeable minority consider that robots could boost job opportunities in
the EU.
In this context, it is unsurprising to find that EU citizens have a clear set of preferences
when it comes to the areas of application for robots. While there is strong support for the
use of robots in space exploration and manufacturing, there is outright opposition to their
use to take care of people. The survey shows that support for the use of robots is
greatest in areas where the tasks are too difficult or too dangerous for humans, but that
robots should not be used to carry out ‘human’ tasks.
This also means that EU citizens would feel very uncomfortable if a robot were used to
look after their children or elderly parents or even to walk their dog, although they can
tolerate the idea of a robot assisting them at work.
However, all of this is future talk to most Europeans, as very few imagine that it will soon
become commonplace for robots to do homework.
The analyses point to a North-South divide in views of robots, with EU citizens
in the North generally more receptive to and accepting of robots than those in
southern Europe. There are also differences between citizens in EU15 countries and
citizens in NMS12 countries; the latter are more positive and tolerant than EU15 citizens.

SPECIAL EUROBAROMETER 382 “Public Attitudes towards Robots”
54
The national analyses show that in countries where personal exposure to robots is higher
– personal experiences range from just two percent in Bulgaria and Greece to around
20% in Slovakia, Poland, Slovenia and Italy – EU citizens are more likely to have a
positive view of robots, but this relationship does not hold everywhere. The extent to
which EU citizens hold positive views ranges from 54% in Malta and Greece to 88% in
Denmark and Sweden. Attitudes towards robots tend to be among the most negative in
Greece, whereas citizens in Bulgaria are more likely than average to have no opinion.
The perception that robots steal people’s jobs is greater in countries badly affected by
the economic crisis than in some of the more resilient Western-European economies.
The survey shows that public opinion is united across the Member States when it comes
to the areas of application for robots: manufacturing is the priority area in 13 Member
States, while space exploration is the priority area in 11. The UK is the only country
where military and security is the most frequently selected area; Malta and Portugal are
the two countries where search and rescue are the top priority. Across the EU, citizens
agree that the care of children, the elderly and people with disabilities is the first area
from which robots should be banned, even if the strength of this view varies from
country to country.
EU citizens in all Member States would feel uncomfortable if a robot were to
look after their children or their elderly parents; in all countries the majority also
dislike the idea of a robot walking their dog or having a medical operation performed on
them by a robot. National differences are more striking in the case of having a robot
assist people at work: the proportion that would feel comfortable in this situation ranges
from 22% in Bulgaria to 81% in Sweden.
When asked about the prospects for robots performing tasks in the home, respondents in
17 Member States believe that this lies more than 20 years in the future; in 10 Member
States the most frequent answer is that this will happen 10 years from now. Respondents
in countries with generally more positive attitudes towards robots tend to think that it
will be 10 more years whereas in countries with a more sceptical stance towards robots
the tendency is to think that it will take more than 20 years.
The survey shows that in socio-demographic terms education and gender are important
determinants of views about robots. Men are generally more receptive and positive than
women, and education generally appears to have a positive influence on people’s views.
Furthermore, the analyses show that interest in science and technology and overall
attitudes towards robots are very important measures of people’s specific views and
concerns. EU citizens who are ‘very interested’ in science and technology and
who have an overall positive view of robots are much more open to and
accepting of robots than those with no interest in science and technology or
with a negative overall view of robots. However, even among ‘very interested’ and
positive respondents, there is little acceptance of robots operating in ‘human’ areas,
particularly in the case of taking care of vulnerable people.

ANNEXES

TECHNICAL SPECIFICATIONS

SPECIAL EUROBAROMETER 382 “Public Attitudes towards Robots”
SPECIAL EUROBAROMETER 382
Public Attitudes towards Robots TECHNICAL SPECIFICATIONS
Between the 25th of February and the 11th of March 2012, TNS Opinion & Social, a consortium created between TNS plc and TNS opinion, carried out the wave 77.1 of the EUROBAROMETER, on request of the EUROPEAN COMMISSION, Directorate-General for Communication, “Research and Speechwriting”. The SPECIAL EUROBAROMETER 382 is part of wave 77.1 and covers the population of the respective nationalities of the European Union Member States, resident in each of the Member States and aged 15 years and over. The basic sample design applied in all states is a multi-stage, random (probability) one. In each country, a number of sampling points was drawn with probability proportional to population size (for a total coverage of the country) and to population density.
In order to do so, the sampling points were drawn systematically from each of the "administrative regional units", after stratification by individual unit and type of area. They thus represent the whole territory of the countries surveyed according to the EUROSTAT NUTS II (or equivalent) and according to the distribution of the resident population of the respective nationalities in terms of metropolitan, urban and rural areas. In each of the selected sampling points, a starting address was drawn, at random. Further addresses (every Nth address) were selected by standard "random route" procedures, from the initial address. In each household, the respondent was drawn, at random (following the "closest birthday rule"). All interviews were conducted face-to-face in people's homes and in the appropriate national language. As far as the data capture is concerned, CAPI (Computer Assisted Personal Interview) was used in those countries where this technique was available.
TS1

SPECIAL EUROBAROMETER 382 “Public Attitudes towards Robots”
For each country a comparison between the sample and the universe was carried out. The Universe description was derived from Eurostat population data or from national statistics offices. For all countries surveyed, a national weighting procedure, using marginal and intercellular weighting, was carried out based on this Universe description. In all countries, gender, age, region and size of locality were introduced in the iteration procedure. For international weighting (i.e. EU averages), TNS Opinion & Social applies the official population figures as provided by EUROSTAT or national statistic offices. The total population figures for input in this post-weighting procedure are listed above. Readers are reminded that survey results are estimations, the accuracy of which, everything being equal, rests upon the sample size and upon the observed percentage. With samples of about 1,000 interviews, the real percentages vary within the following confidence limits:
Observed percentages 10% or 90% 20% or 80% 30% or 70% 40% or 60% 50%
Confidence limits ± 1.9 points ± 2.5 points ± 2.7 points ± 3.0 points ± 3.1 points
ABBR. COUNTRIES INSTITUTES N° INTERVIEWS
FIELDWORK DATES
POPULATION 15+
BE Belgium TNS Dimarso 1.051 25/02/2012 11/03/2012 8.939.546 BG Bulgaria TNS BBSS 1.006 25/02/2012 05/03/2012 6.537.510 CZ Czech Rep. TNS Aisa 1.003 25/02/2012 07/03/2012 9.012.443 DK Denmark TNS Gallup DK 1.019 25/02/2012 11/03/2012 4.561.264 DE Germany TNS Infratest 1.552 25/02/2012 11/03/2012 64.409.146 EE Estonia Emor 1.000 25/02/2012 11/03/2012 945.733 IE Ireland Ipsos MRBI 1.008 25/02/2012 09/03/2012 3.522.000 EL Greece TNS ICAP 999 25/02/2012 10/03/2012 8.693.566 ES Spain TNS Demoscopia 1.004 25/02/2012 11/03/2012 39.127.930 FR France TNS Sofres 1.059 25/02/2012 07/03/2012 47.756.439 IT Italy TNS Infratest 1.036 25/02/2012 11/03/2012 51.862.391 CY Rep. of Cyprus Synovate 506 25/02/2012 11/03/2012 660.400 LV Latvia TNS Latvia 1.024 25/02/2012 11/03/2012 1.447.866 LT Lithuania TNS Gallup Lithuania 1.021 25/02/2012 11/03/2012 2.829.740 LU Luxembourg TNS ILReS 501 25/02/2012 10/03/2012 404.907 HU Hungary TNS Hoffmann Kft 1.021 25/02/2012 11/03/2012 8.320.614 MT Malta MISCO 500 25/02/2012 09/03/2012 335.476 NL Netherlands TNS NIPO 1.014 25/02/2012 08/03/2012 13.371.980
AT Austria Österreichisches Gallup-Institut 1.031
25/02/2012 11/03/2012 7.009.827
PL Poland TNS OBOP 1.000 25/02/2012 11/03/2012 32.413.735 PT Portugal TNS EUROTESTE 1.009 25/02/2012 11/03/2012 8.080.915 RO Romania TNS CSOP 1.020 25/02/2012 07/03/2012 18.246.731 SI Slovenia RM PLUS 1.017 25/02/2012 09/03/2012 1.759.701 SK Slovakia TNS Slovakia 1.000 25/02/2012 11/03/2012 4.549.955 FI Finland TNS Gallup Oy 1.003 25/02/2012 11/03/2012 4.440.004 SE Sweden TNS GALLUP 1.016 25/02/2012 11/03/2012 7.791.240 UK United Kingdom TNS UK 1.331 25/02/2012 11/03/2012 51.848.010
TOTAL EU27
26.751 25/02/2012 11/03/2012 408.879.069
TS2

QUESTIONNAIRE

SPECIAL EUROBAROMETER 382 “Public Attitudes towards Robots”
QA1
1234
QA2
12
Moderately interestedNot at all interestedDK
EB73.1 QC1.5 TREND MODIFIED
QA. PUBLIC ATTITUDES TOWARDS ROBOTS
Please tell me whether you are very interested, moderately interested or not at all interested in scientific discoveries and technological developments. (M)
Very badly DK
(ONE ANSWER ONLY)
Very interested
1 2 3
I’m going to show you two pictures. For each of them, please tell me to what extent it corresponds with the idea you have of robots.
(SHOW CARD WITH SCALE – SHOW PICTURES – ONE ANSWER PER LINE)
(READ OUT) Very well Fairly well Fairly badly
4 5Picture robot 1 1 2 3Picture robot 2
4 5
NEW
Q1

SPECIAL EUROBAROMETER 382 “Public Attitudes towards Robots”
QA3
1,2,3,4,5,
QA4
12345
Have you ever used, or are you currently using such robots at home or at work (e.g. a robotic vacuum cleaner at home or an industrial robot at work)?
(READ OUT – MULTIPLE ANSWERS POSSIBLE)
Yes, at home
A robot is defined here as an autonomous machine which can assist humans in everyday tasks e.g. as a kind of co-worker helping on the factory floor or as a robot cleaner, or in activities which may be dangerous for humans, like search and rescue in disasters. Robots can come in many shapes or sizes, including human-like. Traditional kitchen appliances, such as a blender or a coffee maker, are not robots.
Yes, at workYes, elsewhere (SPONTANEOUS)NoDK
NEW
Generally speaking, do you have a very positive, fairly positive, fairly negative or very negative view of robots?
(ONE ANSWER ONLY)
Very positive Fairly positive Fairly negative Very negative DK
NEW
Q2

SPECIAL EUROBAROMETER 382 “Public Attitudes towards Robots”
QA5
1
2
3
4
5
Please tell me to what extent you agree or disagree with each of the following statements about robots.
(SHOW CARD WITH SCALE – ONE ANSWER PER LINE)
(READ OUT – ROTATE) Totally agree
Tend to agree
Tend to disagree
Totally disagree
DK
Robots are a good thing for society, because they help people
1 2 3
4 5
Robots steal peoples’ jobs 1 2 3
4 5
4 5
4 5
Robots are necessary as they can do jobs that are too hard or too dangerous for people
1
Robots are a form of technology that requires careful management
1 2 3
2 3
Widespread use of robots can boost job opportunities in the EU
1 2 3 4 5
NEW
Q3

SPECIAL EUROBAROMETER 382 “Public Attitudes towards Robots”
QA6
1,2,3,4,5,6,7,
8,9,
10,11,12,13,14,
QA7
1,2,3,4,5,6,7,
8,9,
10,11,12,13,14,
In which areas do you think that robots should be used as a priority?
(SHOW CARD – READ OUT – MAX. 3 ANSWERS)
ManufacturingHealthcareLeisureDomestic use, such as cleaning
Transport\ LogisticsOther (SPONTANEOUS)
Military and securitySearch and rescueEducationCare of children, elderly, and the disabled
Space explorationAgriculture
None (SPONTANEOUS)DK
NEW
And on the other hand, in which areas do you think that the use of robots should be banned?
(SHOW CARD – READ OUT – MAX. 3 ANSWERS)
ManufacturingHealthcareLeisureDomestic use, such as cleaningMilitary and securitySearch and rescueEducation Care of children, elderly, and the disabled
Space explorationAgricultureTransport\ logisticsOther (SPONTANEOUS)None (SPONTANEOUS)DK
NEW
Q4

SPECIAL EUROBAROMETER 382 “Public Attitudes towards Robots”
QA8
1 Total
ly uncomfortable
2 3 4 5 6 7 8 9 10 Total
ly comfortable
Not applicabl
e (SPONTANEOUS
)
DK
1 1 2 3 4 5 6 7 8 9 10 11 12
2 1 2 3 4 5 6 7 8 9 10 11 12
3 1 2 3 4 5 6 7 8 9 10 11 12
4 1 2 3 4 5 6 7 8 9 10 11 12
(READ OUT – ROTATE)
Having a medical operation performed on you by a robotHaving your dog walked by a robotHaving a robot assist you at work (e.g.: in manufacturing)
Here is a list of things that could be done by robots. For each of them, please tell me, using a scale from 1 to 10, how you would personally feel about it. On this scale, '1' means that you would feel "totally uncomfortable" and '10' means that you would feel "totally comfortable" with this situation.
Having your children or elderly parents minded by a robot
NEW
(SHOW CARD WITH SCALE – ONE ANSWER PER LINE)
Q5

SPECIAL EUROBAROMETER 382 “Public Attitudes towards Robots”
QA9
1234567
In your opinion, in Europe, when it will become commonplace for robots to do house work?
(READ OUT – ONE ANSWER ONLY)
In 5 years’ timeIn 10 years’ timeIn 20 years’ timeIn more than 20 years’ timeIt is already commonplace (SPONTANEOUS)Never (SPONTANEOUS)DK
NEW
Q6

TABLES

SPECIAL EUROBAROMETER 382 “Public Attitudes towards Robots”
%EB
77.1
Diff.EB
73.1
EB77.1
Diff.EB
73.1
EB77.1
Diff.EB
73.1
EB77.1
Diff.EB
73.1EU 27 25 -5 52 3 22 2 1 0
BE 25 -7 54 6 21 1 0 0
BG 19 8 49 2 28 -8 4 -2
CZ 9 -13 59 3 32 10 0 0
DK 30 -2 61 17 9 -14 0 -1
DE 30 -2 52 1 18 1 0 0
EE 18 -12 64 14 18 -1 0 -1
IE 18 -9 47 3 33 7 2 -1
EL 30 -7 44 -5 26 12 0 0
ES 24 -5 45 -7 30 12 1 0
FR 34 -7 54 8 12 -1 0 0
IT 21 5 55 2 22 -6 2 -1
CY 43 -12 40 3 17 9 0 0
LV 22 -8 61 10 17 -2 0 0
LT 11 -1 58 8 31 -6 0 -1
LU 34 -8 54 5 12 3 0 0
HU 22 -19 57 7 21 13 0 -1
MT 24 -12 40 2 34 11 2 -1
NL 36 -12 58 17 6 -5 0 0
AT 27 6 51 -2 22 -3 0 -1
PL 16 -1 58 10 25 -9 1 0
PT 13 -1 49 0 37 2 1 -1
RO 22 7 49 6 27 -10 2 -3
SI 20 -8 59 5 21 3 0 0
SK 25 3 50 -5 25 2 0 0
FI 23 -11 64 13 13 -2 0 0
SE 41 -2 54 7 5 -5 0 0
UK 25 -18 47 3 28 15 0 0
QA1 Veuillez me dire si vous êtes très intéressé(e), moyennement intéressé(e) ou pas du tout intéressé(e) par les découvertes scientifiques et les évolutions technologiques ?
QA1 Please tell me whether you are very interested, moderately interested or not at all interested in scientific discoveries and technological developments.
QA1 Bitte sagen Sie mir, ob Sie an wissenschaftlichen Entdeckungen und technologischen Entwicklungen sehr interessiert, etwas interessiert oder gar nicht interessiert sind.
Très intéressé(e)
Very interested
Sehr interessiert
Moyennement
Moderately interested
Etwas interessiert
Pas du tout intéressé(e)
Not at all interested
Gar nicht interessiert
NSP
DK
WN
T1

SPECIAL EUROBAROMETER 382 “Public Attitudes towards Robots”
%
EU 27
BE
BG
CZ
DK
DE
EE
IE
EL
ES
FR
IT
CY
LV
LT
LU
HU
MT
NL
AT
PL
PT
RO
SI
SK
FI
SE
UK
QA2.1 Je vais vous montrer deux images. Pour chacune d’entre elles, veuillez me dire dans quelle mesure elle correspond à l’idée que vous vous faites des robots. Image robot 1
QA2.1 I’m going to show you two pictures. For each of them, please tell me to what extent it corresponds with the idea you have of robots. Picture robot 1
QA2.1 Ich zeige Ihnen nun zwei Bilder. Bitte sagen Sie mir zu jedem Bild, inwieweit dieses Ihrer Vorstellung von Robotern entspricht. Bild Roboter 1
Très bien Plutôt mal NSP Total 'Mal'
Very well
Sehr gut
EB77.1
Plutôt bien
Rather well
Eher gut
EB77.1
Rather badly
Eher schlecht
EB77.1
Très mal
Very badly
Sehr schlecht
EB77.1
DK
WN
EB77.1
Total 'Bien'
Total 'Well'
Gesamt'Gut'
EB77.1
Total 'Badly'
Gesamt'Gut'
EB77.1
34 47 12 5 2 81 17
14
41 42 10 2 5 83 12
40 46
45 42 10 3
0 8611 3
0 87 13
74 20 4 1 1 94 5
44 43 9 3 1 87 12
28 52 13 4 3 80 17
15
23 46 22 9 0 69 31
34 46
26 49 16 7
5 808 7
2 75 23
36 50 10 3 1 86 13
21
34 41 14 10 1 75 24
23 54
33 52 10 3
2 7714 7
2 85 13
25 53 14 5 3 78 19
20
35 49 12 3 1 84 15
36 43
35 30 16 15
1 7915 5
4 65 31
49 42 7 2 0 91 9
25
26 57 10 3 4 83 13
26 48
19 45 26 7
1 7421 4
3 64 33
21 35 23 15 6 56 38
11
42 46 9 2 1 88 11
39 49
50 43 5 1
1 889 2
1 93 6
63 32 4 1 0 95 5
3 82 1538 44 11 4
T2

SPECIAL EUROBAROMETER 382 “Public Attitudes towards Robots”
%
EU 27
BE
BG
CZ
DK
DE
EE
IE
EL
ES
FR
IT
CY
LV
LT
LU
HU
MT
NL
AT
PL
PT
RO
SI
SK
FI
SE
UK
QA2.2 Je vais vous montrer deux images. Pour chacune d’entre elles, veuillez me dire dans quelle mesure elle correspond à l’idée que vous vous faites des robots. Image robot 2
QA2.2 I’m going to show you two pictures. For each of them, please tell me to what extent it corresponds with the idea you have of robots. Picture robot 2
QA2.2 Ich zeige Ihnen nun zwei Bilder. Bitte sagen Sie mir zu jedem Bild, inwieweit dieses Ihrer Vorstellung von Robotern entspricht. Bild Roboter 2
Très bien Plutôt mal NSP Total 'Mal'
Very well
Sehr gut
EB77.1
Plutôt bien
Rather well
Eher gut
EB77.1
Rather badly
Eher schlecht
EB77.1
Très mal
Very badly
Sehr schlecht
EB77.1
DK
WN
EB77.1
Total 'Bien'
Total 'Well'
Gesamt'Gut'
EB77.1
Total 'Badly'
Gesamt'Gut'
EB77.1
27 39 23 9 2 66 32
41
37 43 11 2 7 80 13
26 33
44 34 18 4
0 5931 10
0 78 22
37 29 26 7 1 66 33
21 35 30 12 2 56 42
26 40 22 8 4 66 30
20
24 37 24 15 0 61 39
29 46
32 41 17 8
5 7512 8
2 73 25
28 34 26 11 1 62 37
25
39 35 11 14 1 74 25
26 47
34 39 19 5
2 7317 8
3 73 24
20 45 23 8 4 65 31
40
24 42 24 8 2 66 32
25 33
38 27 17 13
2 5828 12
5 65 30
37 35 21 7 0 72 28
31
27 46 17 4 6 73 21
26 41
14 41 30 12
2 6724 7
3 55 42
17 35 25 17 6 52 42
27
34 42 18 4 2 76 22
31 41
29 36 26 8
1 7219 8
1 65 34
30 33 28 8 1 63 36
3 64 3329 35 25 8
T3

SPECIAL EUROBAROMETER 382 “Public Attitudes towards Robots”
%
EU 27
BE
BG
CZ
DK
DE
EE
IE
EL
ES
FR
IT
CY
LV
LT
LU
HU
MT
NL
AT
PL
PT
RO
SI
SK
FI
SE
UK
QA3 Avez-vous déjà utilisé, ou utilisez-vous actuellement, un robot de ce type à la maison ou sur votre lieu de travail (par ex. un robot aspirateur chez vous, ou un robot industriel au travail) ? (PLUSIEURS REPONSES POSSIBLES)
QA3 Have you ever used, or are you currently using such robots at home or at work (e.g. a robotic vacuum cleaner at home or an industrial robot at work)? (MULTIPLE ANSWERS POSSIBLE)
QA3 Nutzen Sie derzeit oder haben Sie jemals solche Roboter zu Hause oder am Arbeitsplatz genutzt (z.B. einen Staubsauger-Roboter im Haushalt oder einen Industrieroboter auf der Arbeit)? (MEHRFACHNENNUNGEN MÖGLICH)
Oui, au travail
Yes, at work
Ja, am Arbeitsplatz
EB77.1
Oui, à la maison
Yes, at home
Ja, zu Hause
EB77.1
Non
No
Nein
EB77.1
Oui, ailleurs (SPONTANE)
Yes others (SPONTANEOUS)
Ja, an einem anderen Ort (SPONTAN)
EB77.1
Total 'Oui'
Total 'Yes'
Gesamt 'Ja'
EB77.1
NSP
DK
WN
EB77.1
0 11
6 6 1 87
2 1 0 97
0 12
4 7 1 89
1 83
1 2
8 7 0 86 0 14
0 177 10
3 6 0 91
2 5 0 93
0 9
0 98
0 7
1 5 2 91 1 9
0 2
7 8 1 86 0 14
0 1
0 18
7 8 1 86
2 2 1 96
0 14
14 3 1 82
1 93
0 4
5 5 0 90 0 10
0 7
6 4 0 90 0 10
3 3
0 5
5 4 1 91
2 7 0 91
0 9
1 3 1 95
7 81
0 9
4 8 3 86 0 14
1 19
4 4 2 91 0 9
7 5
0 18
6 4 2 87
11 11 1 80
2 11
9 8 5 82
1 88
0 20
3 12 3 82 0 17
0 12
3 7 1 90 0 10
2 9
T4

SPECIAL EUROBAROMETER 382 “Public Attitudes towards Robots”
%
EU 27
BE
BG
CZ
DK
DE
EE
IE
EL
ES
FR
IT
CY
LV
LT
LU
HU
MT
NL
AT
PL
PT
RO
SI
SK
FI
SE
UK
QA4 De façon générale, avez-vous une image très positive, plutôt positive, plutôt négative ou très négative des robots ?
QA4 Generally speaking, do you have a very positive, fairly positive, fairly negative or very negative view of robots?
QA4 Ist das Bild, das Sie von Robotern haben, alles in allem sehr positiv, ziemlich positiv, ziemlich negativ oder sehr negativ?
Plutôt positif
Fairly positive
Ziemlich positiv
EB77.1
Très positive
Very positive
Sehr positiv
EB77.1
Très négative
Very negative
Sehr negativ
EB77.1
Plutôt négatif
Fairly negative
Ziemlich negativ
EB77.1
Gesamt 'Positiv'
EB77.1
NSP
DK
WN
EB77.1
14 56 18 5
Total 'Négatif'
Total 'Negative'
Gesamt 'Negativ'
EB77.1
Total 'Positif'
Total 'Positive'
7 70 23
12 60 22 5 1 72 27
12
19 57 19 3 2 76 22
25 53
33 55 8 1
10 7810 2
3 88 9
2214 55
13 65 15 3
9 6917 5
4 78 18
17 49 16 7 11 66 23
44
13 51 20 7 9 64 27
10 44
7 60 23 6
2 5428 16
4 67 29
12 57 18 9 4 69 27
36
12 59 17 3 9 71 20
16 41
15 63 12 4
7 5728 8
6 78 16
10 57 23 7 3 67 30
29
13 41 20 13 13 54 33
9 56
20 67 9 2
6 6523 6
2 87 11
13 52 23 6 6 65 29
12
5 50 30 5 10 55 35
17 63
17 53 12 6
8 8010 2
12 70 18
17 59 18 4 2 76 22
14
18 67 11 1 3 85 12
28 56
27 61 9 1
2 8413 1
2 88 10
16 51 17 5 11 67 22
T5

SPECIAL EUROBAROMETER 382 “Public Attitudes towards Robots”
%
EU 27
BE
BG
CZ
DK
DE
EE
IE
EL
ES
FR
IT
CY
LV
LT
LU
HU
MT
NL
AT
PL
PT
RO
SI
SK
FI
SE
UK
QA5.1 Veuillez me dire dans quelle mesure vous êtes d’accord ou pas d’accord avec les propositions suivantes concernant les robots. Les robots sont une bonne chose pour la société, parce qu’ils aident les gens
QA5.1 Please tell me to what extent you agree or disagree with each of the following statements about robots. Robots are a good thing for society, because they help people
QA5.1 Bitte sagen Sie mir, inwieweit Sie jeder der folgenden Aussagen über Roboter zustimmen oder nicht zustimmen.
Roboter sind gut für die Gesellschaft, weil sie Menschen helfen
Tout à fait d’accord
Plutôt pas d’accord
NSPTotal 'Pas d'accord'
Totally agree
Stimme voll und ganz zu
EB77.1
Plutôt d’accord
Tend to agree
Stimme eher zu
EB77.1
Tend to disagree
Lehne eher ab
EB77.1
Pas du tout d’accord
Totally disagree
Stimme überhaupt nicht zu
EB77.1
DK
WN
EB77.1
Total 'D'accord'
Total 'Agree'
Gesamt 'Stimme zu'
EB77.1
Total 'Disagree'
Gesamt 'Stimme nicht
zu'EB
77.1
26 50 15 5 4 76 20
22
45 41 7 2 5 86 9
23 54
43 48 7 1
1 7718 4
1 91 8
44 45 8 2 1 89 10
27 48 17 5 3 75 22
34 52 9 2 3 86 11
16
16 42 27 13 2 58 40
26 49
25 47 17 5
9 7511 5
6 72 22
14 56 21 7 2 70 28
25
24 45 18 10 3 69 28
20 52
38 48 9 3
3 7218 7
2 86 12
36 50 9 2 3 86 11
25
23 54 16 4 3 77 20
20 54
22 46 17 9
1 7421 4
6 68 26
32 53 12 2 1 85 14
30
29 58 9 0 4 87 9
20 47
16 50 22 5
3 6724 6
7 66 27
40 41 9 5 5 81 14
20
50 45 4 0 1 95 4
33 45
28 62 8 0
2 7815 5
2 90 8
46 47 5 2 0 93 7
6 76 1823 53 13 5
T6

SPECIAL EUROBAROMETER 382 “Public Attitudes towards Robots”
%
EU 27
BE
BG
CZ
DK
DE
EE
IE
EL
ES
FR
IT
CY
LV
LT
LU
HU
MT
NL
AT
PL
PT
RO
SI
SK
FI
SE
UK
QA5.2 Veuillez me dire dans quelle mesure vous êtes d’accord ou pas d’accord avec les propositions suivantes concernant les robots. Les robots volent les emplois des gens
QA5.2 Please tell me to what extent you agree or disagree with each of the following statements about robots. Robots steal peoples’ jobs
QA5.2 Bitte sagen Sie mir, inwieweit Sie jeder der folgenden Aussagen über Roboter zustimmen oder nicht zustimmen.
Roboter vernichten Arbeitsplätze
Tout à fait d’accord
Plutôt pas d’accord
NSPTotal 'Pas d'accord'
Totally agree
Stimme voll und ganz zu
EB77.1
Plutôt d’accord
Tend to agree
Stimme eher zu
EB77.1
Tend to disagree
Lehne eher ab
EB77.1
Pas du tout d’accord
Totally disagree
Stimme überhaupt nicht zu
EB77.1
DK
WN
EB77.1
Total 'D'accord'
Total 'Agree'
Gesamt 'Stimme zu'
EB77.1
Total 'Disagree'
Gesamt 'Stimme nicht
zu'EB
77.1
34 36 20 7 3 70 27
27
26 35 24 9 6 61 33
33 39
20 40 29 10
1 7222 5
1 60 39
22 37 27 13 1 59 40
42 34 17 5 2 76 22
40 37 15 6 2 77 21
30
53 30 13 3 1 83 16
33 30
54 30 10 5
7 6321 9
1 84 15
35 39 19 5 2 74 24
33
63 20 11 4 2 83 15
25 39
45 33 15 5
3 6424 9
2 78 20
39 39 16 3 3 78 19
20
37 41 17 4 1 78 21
45 34
53 29 10 5
1 7915 5
3 82 15
16 35 34 13 2 51 47
39
27 43 20 5 5 70 25
24 34
57 32 8 2
3 5830 9
1 89 10
35 28 19 11 7 63 30
23
23 37 27 11 2 60 38
44 32
15 40 39 5
1 7616 7
1 55 44
21 46 20 12 1 67 32
3 67 3028 39 22 8
T7

SPECIAL EUROBAROMETER 382 “Public Attitudes towards Robots”
%
EU 27
BE
BG
CZ
DK
DE
EE
IE
EL
ES
FR
IT
CY
LV
LT
LU
HU
MT
NL
AT
PL
PT
RO
SI
SK
FI
SE
UK
QA5.3 Veuillez me dire dans quelle mesure vous êtes d’accord ou pas d’accord avec les propositions suivantes concernant les robots.
Les robots sont nécessaires parce qu’ils peuvent effectuer des tâches qui sont trop difficiles ou dangereuses pour les gens
QA5.3 Please tell me to what extent you agree or disagree with each of the following statements about robots. Robots are necessary as they can do jobs that are too hard or too dangerous for people
QA5.3 Bitte sagen Sie mir, inwieweit Sie jeder der folgenden Aussagen über Roboter zustimmen oder nicht zustimmen.
Roboter sind notwendig, da sie Arbeiten erledigen können, die für Menschen zu schwer oder zu gefährlich sind
Tout à fait d’accord
Plutôt pas d’accord
NSPTotal 'Pas d'accord'
Totally agree
Stimme voll und ganz zu
EB77.1
Plutôt d’accord
Tend to agree
Stimme eher zu
EB77.1
Tend to disagree
Lehne eher ab
EB77.1
Pas du tout d’accord
Totally disagreeStimme
überhaupt nicht zu
EB77.1
DK
WN
EB77.1
Total 'D'accord'
Total 'Agree'
Gesamt 'Stimme zu'
EB77.1
Total 'Disagree'Gesamt
'Stimme nicht zu'EB
77.1
48 40 7 3 2 88 10
10
57 31 5 2 5 88 7
46 43
49 43 6 1
1 898 2
1 92 7
73 22 3 1 1 95 4
65 27 5 2 1 92 7
63 31 4 1 1 94 5
10
33 42 16 9 0 75 25
41 43
45 42 8 3
6 847 3
2 87 11
46 44 7 2 1 90 9
18
56 32 6 4 2 88 10
30 50
69 26 3 1
2 8011 7
1 95 4
57 35 5 1 2 92 6
8
42 45 9 2 2 87 11
51 40
37 44 9 4
1 915 3
6 81 13
63 31 5 1 0 94 6
15
45 43 8 1 3 88 9
40 43
31 47 14 2
2 8313 2
6 78 16
45 37 8 4 6 82 12
4
61 35 2 1 1 96 3
68 28
44 48 6 1
0 963 1
1 92 7
76 21 2 1 0 97 3
3 87 1046 41 7 3
T8

SPECIAL EUROBAROMETER 382 “Public Attitudes towards Robots”
%
EU 27
BE
BG
CZ
DK
DE
EE
IE
EL
ES
FR
IT
CY
LV
LT
LU
HU
MT
NL
AT
PL
PT
RO
SI
SK
FI
SE
UK
QA5.4 Veuillez me dire dans quelle mesure vous êtes d’accord ou pas d’accord avec les propositions suivantes concernant les robots. Les robots sont un type de technologie qui nécessite d’être géré avec prudence
QA5.4 Please tell me to what extent you agree or disagree with each of the following statements about robots. Robots are a form of technology that requires careful management
QA5.4 Bitte sagen Sie mir, inwieweit Sie jeder der folgenden Aussagen über Roboter zustimmen oder nicht zustimmen.
Bei Robotern handelt es sich um eine Form der Technologie, die eine sorgsame Handhabung erfordert
Tout à fait d’accord
Plutôt pas d’accord
NSPTotal 'Pas d'accord'
Totally agree
Stimme voll und ganz zu
EB77.1
Plutôt d’accord
Tend to agree
Stimme eher zu
EB77.1
Tend to disagree
Lehne eher ab
EB77.1
Pas du tout d’accord
Totally disagree
Stimme überhaupt nicht zu
EB77.1
DK
WN
EB77.1
Total 'D'accord'
Total 'Agree'
Gesamt 'Stimme zu'
EB77.1
Total 'Disagree'
Gesamt 'Stimme nicht
zu'EB
77.1
52 39 5 1 3 91 6
6
66 26 2 1 5 92 3
55 39
42 42 13 2
0 945 1
1 84 15
75 18 5 1 1 93 6
67 28 3 1 1 95 4
52 38 6 1 3 90 7
4
67 30 1 1 1 97 2
53 36
48 43 3 1
7 893 1
5 91 4
54 40 4 1 1 94 5
13
86 12 1 0 1 98 1
43 43
68 26 3 1
1 868 5
2 94 4
50 41 5 1 3 91 6
5
36 46 13 3 2 82 16
55 38
47 39 4 3
2 934 1
7 86 7
70 26 3 0 1 96 3
9
35 55 5 0 5 90 5
44 46
32 51 7 1
1 908 1
9 83 8
46 36 8 3 7 82 11
4
49 45 3 0 3 94 3
66 29
55 42 2 0
1 953 1
1 97 2
55 32 10 2 1 87 12
4 91 553 38 3 2
T9

SPECIAL EUROBAROMETER 382 “Public Attitudes towards Robots”
%
EU 27
BE
BG
CZ
DK
DE
EE
IE
EL
ES
FR
IT
CY
LV
LT
LU
HU
MT
NL
AT
PL
PT
RO
SI
SK
FI
SE
UK
QA5.5 Veuillez me dire dans quelle mesure vous êtes d’accord ou pas d’accord avec les propositions suivantes concernant les robots. L’utilisation étendue des robots peut stimuler la création d’emplois dans l’UE
QA5.5 Please tell me to what extent you agree or disagree with each of the following statements about robots. Widespread use of robots can boost job opportunities in the EU
QA5.5 Bitte sagen Sie mir, inwieweit Sie jeder der folgenden Aussagen über Roboter zustimmen oder nicht zustimmen.
Der weitverbreitete Einsatz von Robotern kann zur Förderung von Beschäftigungsmöglichkeiten in der EU führen
Tout à fait d’accord
Plutôt pas d’accord
NSPTotal 'Pas d'accord'
Totally agree
Stimme voll und ganz zu
EB77.1
Plutôt d’accord
Tend to agree
Stimme eher zu
EB77.1
Tend to disagree
Lehne eher ab
EB77.1
Pas du tout d’accord
Totally disagree
Stimme überhaupt nicht zu
EB77.1
DK
WN
EB77.1
Total 'D'accord'
Total 'Agree'
Gesamt 'Stimme zu'
EB77.1
Total 'Disagree'
Gesamt 'Stimme nicht
zu'EB
77.1
10 29 34 17 10 39 51
54
20 26 19 12 23 46 31
9 35
9 27 41 16
2 4440 14
7 36 57
27 38 23 7 5 65 30
11 31 38 14 6 42 52
11 27 35 18 9 38 53
35
10 29 32 24 5 39 56
13 30
11 24 30 26
22 4319 16
9 35 56
8 26 39 20 7 34 59
43
10 20 26 32 12 30 58
10 35
14 30 31 19
12 4528 15
6 44 50
13 39 28 11 9 52 39
62
5 18 36 37 4 23 73
7 27
12 25 27 18
4 3440 22
18 37 45
11 31 40 10 8 42 50
44
8 27 40 13 12 35 53
13 37
8 31 31 17
6 5032 12
13 39 48
14 22 25 24 15 36 49
63
15 31 36 13 5 46 49
10 23
9 48 32 5
4 3337 26
6 57 37
11 40 31 11 7 51 42
17 34 498 26 33 16
T10

SPECIAL EUROBAROMETER 382 “Public Attitudes towards Robots”
%
EU 27
BE
BG
CZ
DK
DE
EE
IE
EL
ES
FR
IT
CY
LV
LT
LU
HU
MT
NL
AT
PL
PT
RO
SI
SK
FI
SE
UK
QA6 Dans quels domaines pensez-vous que les robots devraient être utilisés en priorité ? (MAX. 3 REPONSES)
QA6 In which areas do you think that robots should be used as a priority? (MAX. 3 ANSWERS)
QA6 In welchen Bereichen sollten Roboter Ihrer Meinung nach vorrangig eingesetzt werden? (MAX. 3 ANTWORTEN)
La fabrication
Manufacturing
Verarbeitendes Gewerbe
EB77.1
Aux loisirs
Leisure
Freizeit
EB77.1
Les soins de santé
Healthcare
Gesundheitswesen
EB77.1
Un usage domestique, comme le nettoyage
Domestic use, such as cleaning
Haushalt z.B. für Reinigungsarbeiten
EB77.1
50 22 3 13
65 38 2 12
56 16 4 22
55 35 1 15
80 16 1 13
50 20 1 9
60 10 2 11
57 18 4 11
44 25 1 8
37 23 3 12
49 32 1 15
30 22 6 20
23 21 5 15
64 8 1 19
37 10 2 22
45 22 2 16
36 14 3 14
43 18 2 19
64 31 1 9
62 9 6 20
59 20 2 12
42 12 5 13
54 27 4 24
69 18 1 13
75 23 2 21
77 18 2 10
72 17 0 6
57 18 2 8
T11

SPECIAL EUROBAROMETER 382 “Public Attitudes towards Robots”
%
EU 27
BE
BG
CZ
DK
DE
EE
IE
EL
ES
FR
IT
CY
LV
LT
LU
HU
MT
NL
AT
PL
PT
RO
SI
SK
FI
SE
UK 5 564 36
41 55 2 4
1 529 35
34 32 3 2
3 233 32
24 21 4 3
2 426 45
28 47 3 1
3 237 38
38 50 1 7
4 731 46
44 54 2 2
2 340 52
32 49 1 3
2 235 44
48 52 7 5
2 440 36
39 49 2 4
2 438 39
19 39 1 2
4 342 35
42 59 1 5
2 249 44
45 36 2 8
2 233 48
33 34 2 3
2 733 40
41 41 3 4
EB77.1
EB77.1
EB77.1
EB77.1
Militär und SicherheitSuch- und
RettungsdiensteBildung
Betreuung von Kindern, Senioren und Behinderten
EducationCare of children, elderly,
and the disabledMilitary and security Search and rescue
Les domaines militaire et de la
sécurité
Les opérations de recherche et sauvetage
L’éducation
La garde d’enfants, des personnes âgées et des
personnes en situation de handicap
QA6 Dans quels domaines pensez-vous que les robots devraient être utilisés en priorité ? (MAX. 3 REPONSES)
QA6 In which areas do you think that robots should be used as a priority? (MAX. 3 ANSWERS)
QA6 In welchen Bereichen sollten Roboter Ihrer Meinung nach vorrangig eingesetzt werden? (MAX. 3 ANTWORTEN)
T12

SPECIAL EUROBAROMETER 382 “Public Attitudes towards Robots”
%
EU 27
BE
BG
CZ
DK
DE
EE
IE
EL
ES
FR
IT
CY
LV
LT
LU
HU
MT
NL
AT
PL
PT
RO
SI
SK
FI
SE
UK 3 245 7 9 0
52 13 24 1 0 1
0 059 18 22 0
51 15 8 0 0 1
1 157 11 6 1
46 23 5 1 2 5
6 826 12 7 1
53 9 6 0 1 2
2 157 14 13 1
41 16 25 0 0 0
4 541 7 3 0
64 10 13 1 1 1
2 054 11 15 0
68 13 8 1 1 2
1 258 10 8 0
70 14 4 0 2 1
5 251 10 13 0
56 10 11 0 1 1
2 142 8 9 0
60 6 7 3 9 0
3 545 12 9 1
55 10 8 0 1 1
1 162 11 14 0
51 18 20 0 0 0
1 061 9 4 0
59 14 5 0 2 4
1 043 10 12 0
52 11 11 0 2 2
EB77.1
EB77.1
EB77.1
EB77.1
EB77.1
EB77.1
Weltraumforschung LandwirtschaftVerkehr / Logistik
Sonstiges (SPONTAN)
Nichts davon (SPONTAN)
WN
None (SPONTANEOUS)
DKSpace exploration AgricultureTransport\ Logistics
Other (SPONTANEOUS)
L’exploration spatiale L’agricultureLe transport\ la
logistiqueAutre (SPONTANE)
Aucun (SPONTANE)
NSP
QA6 Dans quels domaines pensez-vous que les robots devraient être utilisés en priorité ? (MAX. 3 REPONSES)
QA6 In which areas do you think that robots should be used as a priority? (MAX. 3 ANSWERS)
QA6 In welchen Bereichen sollten Roboter Ihrer Meinung nach vorrangig eingesetzt werden? (MAX. 3 ANTWORTEN)
T13

SPECIAL EUROBAROMETER 382 “Public Attitudes towards Robots”
%
EU 27
BE
BG
CZ
DK
DE
EE
IE
EL
ES
FR
IT
CY
LV
LT
LU
HU
MT
NL
AT
PL
PT
RO
SI
SK
FI
SE
UK
QA7 Et, au contraire, dans quels domaines pensez-vous que l’utilisation des robots devrait être rendue illégale ? (MAX. 3 REPONSES)
QA7 And on the other hand, in which areas do you think that the use of robots should be banned? (MAX. 3 ANSWERS)
QA7 Und in welchen Bereichen sollte der Einsatz von Robotern Ihrer Meinung nach gesetzlich verboten sein? (MAX. 3 ANTWORTEN)
La fabrication
Manufacturing
Verarbeitendes Gewerbe
EB77.1
Aux loisirs
Leisure
Freizeit
EB77.1
Les soins de santé
Healthcare
Gesundheitswesen
EB77.1
Un usage domestique, comme le nettoyage
Domestic use, such as cleaning
Haushalt z.B. für Reinigungsarbeiten
EB77.1
4 27 20 8
5 23 37 16
2 35 10 5
1 14 26 6
1 25 19 10
3 28 21 7
1 42 24 10
4 33 15 10
7 24 18 17
6 29 15 6
6 26 31 8
6 24 21 9
3 36 21 25
2 48 25 5
1 53 16 3
3 38 21 5
6 32 24 10
12 44 12 5
2 28 24 9
3 39 17 7
3 21 16 4
5 30 4 4
2 27 19 7
1 27 31 7
1 26 21 5
1 21 13 7
0 38 21 9
4 30 12 11
T14

SPECIAL EUROBAROMETER 382 “Public Attitudes towards Robots”
%
EU 27
BE
BG
CZ
DK
DE
EE
IE
EL
ES
FR
IT
CY
LV
LT
LU
HU
MT
NL
AT
PL
PT
RO
SI
SK
FI
SE
UK 30 614 3
9 2 28 68
14 538 6
11 4 19 55
17 769 2
12 4 33 51
22 356 2
6 2 22 61
41 7312 7
7 2 50 57
34 497 2
6 2 35 57
58 7811 4
8 2 35 61
33 6010 3
16 3 38 85
28 506 6
8 2 56 64
38 526 2
19 1 36 61
23 624 3
10 2 40 54
30 747 5
5 4 31 59
22 5313 2
13 2 30 40
51 596 3
7 3 34 60
EB77.1
EB77.1
EB77.1
EB77.1
Militär und Sicherheit
Such- und Rettungsdienste
BildungswesenBetreuung von Kindern,
Senioren und Behinderten
Education Care of children, elderly,
and the disabledMilitary and
securitySearch and rescue
Les domaines militaire et de la
sécurité
Les opérations de recherche et sauvetage
L’éducation
La garde d’enfants, des personnes âgées et des personnes en situation
de handicap
QA7 Et, au contraire, dans quels domaines pensez-vous que l’utilisation des robots devrait être rendue illégale ? (MAX. 3 REPONSES)
QA7 And on the other hand, in which areas do you think that the use of robots should be banned? (MAX. 3 ANSWERS)
QA7 Und in welchen Bereichen sollte der Einsatz von Robotern Ihrer Meinung nach gesetzlich verboten sein? (MAX. 3 ANTWORTEN)
T15

SPECIAL EUROBAROMETER 382 “Public Attitudes towards Robots”
%
EU 27
BE
BG
CZ
DK
DE
EE
IE
EL
ES
FR
IT
CY
LV
LT
LU
HU
MT
NL
AT
PL
PT
RO
SI
SK
FI
SE
UK 14 61 4 6 1
1 3 3 0 18 1
27 11 1 4 0
2 4 9 1 12 6
6 20 6 11 2
1 6 6 2 7 13
15 241 5 3 1
1 4 5 0 9 8
7 32 7 8 2
1 2 2 1 13 3
4 92 4 8 1
2 8 3 0 11 6
3 11 6 8 1
0 2 5 2 9 4
5 52 3 6 1
1 7 1 0 1 1
13 91 7 5 1
1 9 8 1 6 3
10 61 8 6 0
0 5 6 2 9 5
9 111 7 6 1
1 4 6 0 7 4
9 22 4 6 0
0 2 4 0 23 1
15 61 6 9 0
2 8 12 0 8 16
3 13 6 6 1
1 6 6 1 10 6
EB77.1
EB77.1
EB77.1
EB77.1
EB77.1
EB77.1
Weltraumforschung LandwirtschaftVerkehr / Logistik
Sonstiges (SPONTAN)
Nichts davon (SPONTAN)
WN
None (SPONTANEOUS)
DKSpace exploration AgricultureTransport\ logistics
Other (SPONTANEOUS)
L’exploration spatiale L’agricultureLe transport\ la
logistiqueAutre
(SPONTANE)Aucun
(SPONTANE)NSP
QA7 Et, au contraire, dans quels domaines pensez-vous que l’utilisation des robots devrait être rendue illégale ? (MAX. 3 REPONSES)
QA7 And on the other hand, in which areas do you think that the use of robots should be banned? (MAX. 3 ANSWERS)
QA7 Und in welchen Bereichen sollte der Einsatz von Robotern Ihrer Meinung nach gesetzlich verboten sein? (MAX. 3 ANTWORTEN)
T16

SPECIAL EUROBAROMETER 382 “Public Attitudes towards Robots”
%
EU 27
BE
BG
CZ
DK
DE
EE
IE
EL
ES
FR
IT
CY
LV
LT
LU
HU
MT
NL
AT
PL
PT
RO
SI
SK
FI
SE
UK
QA8.1 Hier ist eine Liste mit Tätigkeiten, die von Robotern ausgeführt werden könnten. Bitte sagen Sie mir zu jeder Tätigkeit, wie Sie sich persönlich dabei fühlen würden, wenn diese von einem Roboter ausgeführt würde. Nutzen Sie hierzu eine Skala von 1 bis 10, auf der '1' bedeutet, dass Sie sich in dieser Situation "vollkommen unwohl fühlen würden" und eine '10', dass Sie sich dabei "vollkommen wohl fühlen würden". Ein medizinischer Eingriff wird an Ihnen von einem Roboter vorgenommen
QA8.1 Voici une liste de choses qui pourraient être faites par des robots. Pour chacune d’entre elles, pouvez-vous me dire ce que vous en pensez personnellement en utilisant une échelle de 1 à 10, où '1' signifie que vous vous sentez "tout à fait mal à l’aise" et '10' "tout à fait à l’aise" avec la situation proposée. Se faire opérer par un robot
QA8.1 Here is a list of things that could be done by robots. For each of them, please tell me, using a scale from 1 to 10, how you would personally feel about it. On this scale, '1' means that you would feel "totally uncomfortable" and '10' means that you would feel "totally comfortable" with this situation.
Having a medical operation performed on you by a robot
1 Tout à fait mal à l’aise 3 5
1 Totally uncomfortable
1 Würde mich vollkommen unwohl
fühlen
EB77.1
2
2
2
EB77.1
3
3
EB77.1
4
4
4
EB77.1
5
5
EB77.1
6
6
6
EB77.1
12 6
34 6 9 5
37 7 7 6
12 5
7 6
23 5 5 6
40 9 5 4
16 8
10 432 6 9 5
14 539 6 9 6
11 4
55 8 4 2
52 8 7 4
7 3
8 7
53 10 7 5
41 8 6 5
9 3
15 5
28 8 7 8
34 7 8 5
12 13
7 2
65 6 5 3
63 5 4 3
7 2
5 3
48 5 6 5
70 5 3 3
12 3
12 5
67 6 4 4
48 8 8 6
6 1
13 8
40 8 9 8
20 6 9 7
11 7
12 5
47 13 7 6
22 5 6 5
7 5
8 5
34 7 8 5
41 8 6 4
14 5
11 7
25 9 9 7
34 7 7 7
8 7
9 8
43 7 7 5
32 5 8 6
12 5
T17

SPECIAL EUROBAROMETER 382 “Public Attitudes towards Robots”
%
EU 27
BE
BG
CZ
DK
DE
EE
IE
EL
ES
FR
IT
CY
LV
LT
LU
HU
MT
NL
AT
PL
PT
RO
SI
SK
FI
SE
UK 6 0 0
1
8 5 2
8 11 3 9 0
14 6 6 0 1
8 0 2
8
2
7 7 3
6 8 4 7 0
5 4 6 1 7
2 1 3
5
3
4 4 1
7 9 5 18 3
6 1 3 1 1
6 0 0
5
2
14 12 5
3 3 1 3 0
3 1 3 1 1
7 0 0
4
2
5 7 2
2 3 1 3 0
2 2 4 1 1
5 0 2
2
2
2 4 3
10 6 3 3 0
9 2 7 0 1
4 0 1
7
1
4 3 1
7 7 4 5 1
6 2 8 0 1
3 3 1
4
1
4 2 1
7 6 3 4 0
10 2 11 0 1
11 0 1
10
6
9 10 6
5 4 3 9 2
10 4 6 0 0
6 0 2
9
EB77.1
7 7 3
EB77.1
EB77.1
EB77.1
EB77.1
EB77.1
8 910 Würde mich
vollkommen wohl fühlenTrifft nicht zu (SPONTAN)
WN
10 Totally comfortableNot applicable
(SPONTANEOUS)DK
7
NSP
7 8 9
7 8 9 10 Tout à fait à l’aisePas applicable (SPONTANE)
QA8.1 Hier ist eine Liste mit Tätigkeiten, die von Robotern ausgeführt werden könnten. Bitte sagen Sie mir zu jeder Tätigkeit, wie Sie sich persönlich dabei fühlen würden, wenn diese von einem Roboter ausgeführt würde. Nutzen Sie hierzu eine Skala von 1 bis 10, auf der '1' bedeutet, dass Sie sich in dieser Situation "vollkommen unwohl fühlen würden" und eine '10', dass Sie sich dabei "vollkommen wohl fühlen würden". Ein medizinischer Eingriff wird an Ihnen von einem Roboter vorgenommen
QA8.1 Voici une liste de choses qui pourraient être faites par des robots. Pour chacune d’entre elles, pouvez-vous me dire ce que vous en pensez personnellement en utilisant une échelle de 1 à 10, où '1' signifie que vous vous sentez "tout à fait mal à l’aise" et '10' "tout à fait à l’aise" avec la situation proposée.
Se faire opérer par un robot
QA8.1 Here is a list of things that could be done by robots. For each of them, please tell me, using a scale from 1 to 10, how you would personally feel about it. On this scale, '1' means that you would feel "totally uncomfortable" and '10' means that you would feel "totally comfortable" with this situation. Having a medical operation performed on you by a robot
T18

SPECIAL EUROBAROMETER 382 “Public Attitudes towards Robots”
%
EU 27
BE
BG
CZ
DK
DE
EE
IE
EL
ES
FR
IT
CY
LV
LT
LU
HU
MT
NL
AT
PL
PT
RO
SI
SK
FI
SE
UK
QA8.1 Hier ist eine Liste mit Tätigkeiten, die von Robotern ausgeführt werden könnten. Bitte sagen Sie mir zu jeder Tätigkeit, wie Sie sich persönlich dabei fühlen würden, wenn diese von einem Roboter ausgeführt würde. Nutzen Sie hierzu eine Skala von 1 bis 10, auf der '1' bedeutet, dass Sie sich in dieser Situation "vollkommen unwohl fühlen würden" und eine '10', dass Sie sich dabei "vollkommen wohl fühlen würden". Ein medizinischer Eingriff wird an Ihnen von einem Roboter vorgenommen
QA8.1 Voici une liste de choses qui pourraient être faites par des robots. Pour chacune d’entre elles, pouvez-vous me dire ce que vous en pensez personnellement en utilisant une échelle de 1 à 10, où '1' signifie que vous vous sentez "tout à fait mal à l’aise" et '10' "tout à fait à l’aise" avec la situation proposée. Se faire opérer par un robot
QA8.1 Here is a list of things that could be done by robots. For each of them, please tell me, using a scale from 1 to 10, how you would personally feel about it. On this scale, '1' means that you would feel "totally uncomfortable" and '10' means that you would feel "totally comfortable" with this situation. Having a medical operation performed on you by a robot
Total 'Moyennement à l'aise (5-6)'
Total 'Fairly comfortable (5-6)'
Gesamt 'Ziemlich wohl fühlen (5-6)'
EB77.1
Total 'Mal à l'aise (1-4)' Total 'A l'aise (7-10)'
Total 'Comfortable (7-10)'
Gesamt 'Wohl fühlen(7-10)'
EB77.1
57 18 23
Total 'Uncomfortable (1-4)'
Gesamt ' Unwohl fühlen(1-4)'
EB77.1
54 17 29
58 13 21
39 24 35
52 14 32
60 19 20
72 15 10
70 10 19
60 14 23
75 12 13
54 20 25
51 25 22
75 9 13
79 9 10
80 8 10
63 15 21
70 17 11
81 7 9
41 21 37
65 18 15
38 18 39
74 12 11
60 13 20
54 19 25
55 18 25
62 17 21
50 15 35
51 17 31
T19
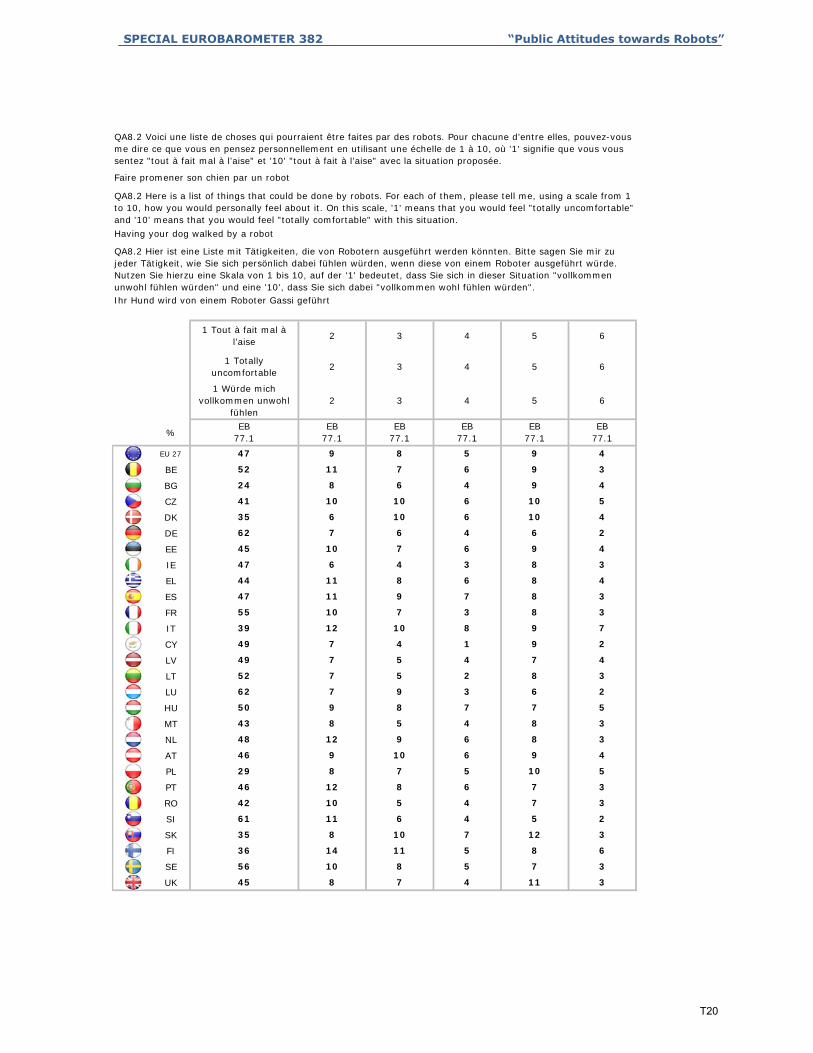
SPECIAL EUROBAROMETER 382 “Public Attitudes towards Robots”
%
EU 27
BE
BG
CZ
DK
DE
EE
IE
EL
ES
FR
IT
CY
LV
LT
LU
HU
MT
NL
AT
PL
PT
RO
SI
SK
FI
SE
UK
QA8.2 Hier ist eine Liste mit Tätigkeiten, die von Robotern ausgeführt werden könnten. Bitte sagen Sie mir zu jeder Tätigkeit, wie Sie sich persönlich dabei fühlen würden, wenn diese von einem Roboter ausgeführt würde. Nutzen Sie hierzu eine Skala von 1 bis 10, auf der '1' bedeutet, dass Sie sich in dieser Situation "vollkommen unwohl fühlen würden" und eine '10', dass Sie sich dabei "vollkommen wohl fühlen würden". Ihr Hund wird von einem Roboter Gassi geführt
QA8.2 Voici une liste de choses qui pourraient être faites par des robots. Pour chacune d’entre elles, pouvez-vous me dire ce que vous en pensez personnellement en utilisant une échelle de 1 à 10, où '1' signifie que vous vous sentez "tout à fait mal à l’aise" et '10' "tout à fait à l’aise" avec la situation proposée.
Faire promener son chien par un robot
QA8.2 Here is a list of things that could be done by robots. For each of them, please tell me, using a scale from 1 to 10, how you would personally feel about it. On this scale, '1' means that you would feel "totally uncomfortable" and '10' means that you would feel "totally comfortable" with this situation.
Having your dog walked by a robot
1 Tout à fait mal à l’aise
3 5
1 Totally uncomfortable
1 Würde mich vollkommen unwohl
fühlen
EB77.1
2
2
2
EB77.1
3
3
EB77.1
4
4
4
EB77.1
5
5
EB77.1
6
6
6
EB77.1
9 4
52 11 7 6
47 9 8 5
9 3
9 4
41 10 10 6
24 8 6 4
10 5
10 435 6 10 6
6 262 7 6 4
9 4
47 6 4 3
45 10 7 6
8 3
8 4
47 11 9 7
44 11 8 6
8 3
8 3
39 12 10 8
55 10 7 3
9 7
9 2
49 7 5 4
49 7 4 1
7 4
8 3
62 7 9 3
52 7 5 2
6 2
7 5
43 8 5 4
50 9 8 7
8 3
8 3
46 9 10 6
48 12 9 6
9 4
10 5
46 12 8 6
29 8 7 5
7 3
7 3
61 11 6 4
42 10 5 4
5 2
12 3
36 14 11 5
35 8 10 7
8 6
7 3
45 8 7 4
56 10 8 5
11 3
T20

SPECIAL EUROBAROMETER 382 “Public Attitudes towards Robots”
%
EU 27
BE
BG
CZ
DK
DE
EE
IE
EL
ES
FR
IT
CY
LV
LT
LU
HU
MT
NL
AT
PL
PT
RO
SI
SK
FI
SE
UK
Pas applicable (SPONTANE)
10 Tout à fait à l’aise987
1212465
EB77.1
EB77.1
EB77.1
EB77.1
EB77.1
34354
53122
29443
11147
614275
109232
33
22123
9 4 1
131 0
3 3 2
5 1 4 5 1
6 5 2
4
1
5 5 2
3 3 8 6 6
2 9 2
3
2
2 3 0
2 2 3 4 1
4 3 0
4
3
3 2 2
3 0 2 5 0
5 1 0
4
1
1 3 1
4 2 10 2 3
7 9 2
3
1
4 4 2
3 1 5 1 1
5 2 1
3
0
2 4 1
7 4 10 3 1
6 5 1
4
0
3 3 1
6 3 10 5 0
6 3 1
5
6
3 3 2
3 1 2 3 0
5 4 1
3
EB77.1
3 4 1
8 910 Würde mich
vollkommen wohl fühlenTrifft nicht zu (SPONTAN)
WN
10 Totally comfortableNot applicable
(SPONTANEOUS)DK
7
NSP
7 8 9
QA8.2 Hier ist eine Liste mit Tätigkeiten, die von Robotern ausgeführt werden könnten. Bitte sagen Sie mir zu jeder Tätigkeit, wie Sie sich persönlich dabei fühlen würden, wenn diese von einem Roboter ausgeführt würde. Nutzen Sie hierzu eine Skala von 1 bis 10, auf der '1' bedeutet, dass Sie sich in dieser Situation "vollkommen unwohl fühlen würden" und eine '10', dass Sie sich dabei "vollkommen wohl fühlen würden". Ihr Hund wird von einem Roboter Gassi geführt
QA8.2 Voici une liste de choses qui pourraient être faites par des robots. Pour chacune d’entre elles, pouvez-vous me dire ce que vous en pensez personnellement en utilisant une échelle de 1 à 10, où '1' signifie que vous vous sentez "tout à fait mal à l’aise" et '10' "tout à fait à l’aise" avec la situation proposée. Faire promener son chien par un robot
QA8.2 Here is a list of things that could be done by robots. For each of them, please tell me, using a scale from 1 to 10, how you would personally feel about it. On this scale, '1' means that you would feel "totally uncomfortable" and '10' means that you would feel "totally comfortable" with this situation. Having your dog walked by a robot
T21

SPECIAL EUROBAROMETER 382 “Public Attitudes towards Robots”
%
EU 27
BE
BG
CZ
DK
DE
EE
IE
EL
ES
FR
IT
CY
LV
LT
LU
HU
MT
NL
AT
PL
PT
RO
SI
SK
FI
SE
UK
QA8.2 Hier ist eine Liste mit Tätigkeiten, die von Robotern ausgeführt werden könnten. Bitte sagen Sie mir zu jeder Tätigkeit, wie Sie sich persönlich dabei fühlen würden, wenn diese von einem Roboter ausgeführt würde. Nutzen Sie hierzu eine Skala von 1 bis 10, auf der '1' bedeutet, dass Sie sich in dieser Situation "vollkommen unwohl fühlen würden" und eine '10', dass Sie sich dabei "vollkommen wohl fühlen würden".
Ihr Hund wird von einem Roboter Gassi geführt
QA8.2 Voici une liste de choses qui pourraient être faites par des robots. Pour chacune d’entre elles, pouvez-vous me dire ce que vous en pensez personnellement en utilisant une échelle de 1 à 10, où '1' signifie que vous vous sentez "tout à fait mal à l’aise" et '10' "tout à fait à l’aise" avec la situation proposée.
Faire promener son chien par un robot
QA8.2 Here is a list of things that could be done by robots. For each of them, please tell me, using a scale from 1 to 10, how you would personally feel about it. On this scale, '1' means that you would feel "totally uncomfortable" and '10' means that you would feel "totally comfortable" with this situation.
Having your dog walked by a robot
Total 'Moyennement à l'aise (5-6)'
Total 'Fairly comfortable (5-6)'
Gesamt 'Ziemlich wohl fühlen (5-6)'
EB77.1
Total 'Mal à l'aise (1-4)' Total 'A l'aise (7-10)'
Total 'Comfortable (7-10)'
Gesamt 'Wohl fühlen(7-10)'
EB77.1
69 12 14
Total 'Uncomfortable (1-4)'
Gesamt ' Unwohl fühlen(1-4)'
EB77.1
76 12 9
42 13 27
67 15 15
57 14 25
79 8 8
68 13 13
61 11 24
69 12 16
73 11 13
75 11 12
69 17 12
62 11 16
66 11 19
66 11 19
81 8 10
73 12 10
60 11 16
75 10 11
70 13 12
49 15 28
71 10 8
61 10 17
82 7 8
61 15 17
64 14 17
66 14 14
80 10 9
T22

SPECIAL EUROBAROMETER 382 “Public Attitudes towards Robots”
%
EU 27
BE
BG
CZ
DK
DE
EE
IE
EL
ES
FR
IT
CY
LV
LT
LU
HU
MT
NL
AT
PL
PT
RO
SI
SK
FI
SE
UK
QA8.3 Hier ist eine Liste mit Tätigkeiten, die von Robotern ausgeführt werden könnten. Bitte sagen Sie mir zu jeder Tätigkeit, wie Sie sich persönlich dabei fühlen würden, wenn diese von einem Roboter ausgeführt würde. Nutzen Sie hierzu eine Skala von 1 bis 10, auf der '1' bedeutet, dass Sie sich in dieser Situation "vollkommen unwohl fühlen würden" und eine '10', dass Sie sich dabei "vollkommen wohl fühlen würden". Sie werden auf der Arbeit von einem Roboter unterstützt (z.B. bei der Produktion)
QA8.3 Voici une liste de choses qui pourraient être faites par des robots. Pour chacune d’entre elles, pouvez-vous me dire ce que vous en pensez personnellement en utilisant une échelle de 1 à 10, où '1' signifie que vous vous sentez "tout à fait mal à l’aise" et '10' "tout à fait à l’aise" avec la situation proposée. Etre assisté(e) par un robot au travail (par ex. pour la production industrielle)
QA8.3 Here is a list of things that could be done by robots. For each of them, please tell me, using a scale from 1 to 10, how you would personally feel about it. On this scale, '1' means that you would feel "totally uncomfortable" and '10' means that you would feel "totally comfortable" with this situation.
Having a robot assist you at work (e.g.: in manufacturing)
1 Tout à fait mal à l’aise 3 5
1 Totally uncomfortable
1 Würde mich vollkommen unwohl
fühlenEB
77.1
2
2
2
EB77.1
3
3
EB77.1
4
4
4
EB77.1
5
5
EB77.1
6
6
6
EB77.1
13 8
10 4 6 5
13 4 5 5
15 7
8 6
4 1 3 3
7 2 3 2
9 6
7 45 2 3 2
16 810 2 6 4
16 8
25 3 4 3
5 2 4 5
8 7
10 7
18 5 6 6
23 5 6 8
14 7
17 6
13 6 8 8
13 3 6 6
12 14
11 5
11 3 4 3
34 4 6 4
14 6
14 7
19 4 6 5
14 3 5 4
20 8
15 9
27 7 4 4
10 3 6 5
12 5
8 9
15 4 8 6
4 2 2 2
13 10
10 5
18 7 10 7
5 2 3 3
13 9
7 5
7 2 5 4
34 9 6 5
13 6
7 4
7 4 3 3
3 0 2 2
8 9
7 4
12 2 5 6
3 1 1 2
17 8
T23

SPECIAL EUROBAROMETER 382 “Public Attitudes towards Robots”
%
EU 27
BE
BG
CZ
DK
DE
EE
IE
EL
ES
FR
IT
CY
LV
LT
LU
HU
MT
NL
AT
PL
PT
RO
SI
SK
FI
SE
UK 20 1 1
1
12 10 6
8 14 9 49 1
20 16 16 1 0
42 1 1
13
1
10 17 11
10 13 12 25 2
6 4 8 6 6
7 4 2
4
2
9 10 4
8 12 8 37 5
11 7 12 2 1
18 2 1
11
2
18 23 11
6 7 4 20 2
11 5 18 6 0
16 1 0
12
2
9 9 3
8 12 8 21 2
12 7 27 2 2
19 1 1
9
2
6 6 3
14 10 4 7 2
15 6 14 1 1
13 1 1
12
1
12 11 6
10 12 6 11 1
10 7 20 3 1
24 2 2
9
2
10 14 8
12 13 5 18 4
13 10 41 3 1
32 2 1
9
4
11 17 11
10 13 11 29 5
17 5 13 2 0
18 3 2
16
EB77.1
11 12 6
EB77.1
EB77.1
EB77.1
EB77.1
EB77.1
8 910 Würde mich
vollkommen wohl fühlen
Trifft nicht zu (SPONTAN)
WN
10 Totally comfortable
Not applicable (SPONTANEOUS)
DK
7
NSP
7 8 9
7 8 9 10 Tout à fait à l’aisePas applicable (SPONTANE)
QA8.3 Hier ist eine Liste mit Tätigkeiten, die von Robotern ausgeführt werden könnten. Bitte sagen Sie mir zu jeder Tätigkeit, wie Sie sich persönlich dabei fühlen würden, wenn diese von einem Roboter ausgeführt würde. Nutzen Sie hierzu eine Skala von 1 bis 10, auf der '1' bedeutet, dass Sie sich in dieser Situation "vollkommen unwohl fühlen würden" und eine '10', dass Sie sich dabei "vollkommen wohl fühlen würden". Sie werden auf der Arbeit von einem Roboter unterstützt (z.B. bei der Produktion)
QA8.3 Voici une liste de choses qui pourraient être faites par des robots. Pour chacune d’entre elles, pouvez-vous me dire ce que vous en pensez personnellement en utilisant une échelle de 1 à 10, où '1' signifie que vous vous sentez "tout à fait mal à l’aise" et '10' "tout à fait à l’aise" avec la situation proposée. Etre assisté(e) par un robot au travail (par ex. pour la production industrielle)
QA8.3 Here is a list of things that could be done by robots. For each of them, please tell me, using a scale from 1 to 10, how you would personally feel about it. On this scale, '1' means that you would feel "totally uncomfortable" and '10' means that you would feel "totally comfortable" with this situation. Having a robot assist you at work (e.g.: in manufacturing)
T24

SPECIAL EUROBAROMETER 382 “Public Attitudes towards Robots”
%
EU 27
BE
BG
CZ
DK
DE
EE
IE
EL
ES
FR
IT
CY
LV
LT
LU
HU
MT
NL
AT
PL
PT
RO
SI
SK
FI
SE
UK
QA8.3 Hier ist eine Liste mit Tätigkeiten, die von Robotern ausgeführt werden könnten. Bitte sagen Sie mir zu jeder Tätigkeit, wie Sie sich persönlich dabei fühlen würden, wenn diese von einem Roboter ausgeführt würde. Nutzen Sie hierzu eine Skala von 1 bis 10, auf der '1' bedeutet, dass Sie sich in dieser Situation "vollkommen unwohl fühlen würden" und eine '10', dass Sie sich dabei "vollkommen wohl fühlen würden". Sie werden auf der Arbeit von einem Roboter unterstützt (z.B. bei der Produktion)
QA8.3 Voici une liste de choses qui pourraient être faites par des robots. Pour chacune d’entre elles, pouvez-vous me dire ce que vous en pensez personnellement en utilisant une échelle de 1 à 10, où '1' signifie que vous vous sentez "tout à fait mal à l’aise" et '10' "tout à fait à l’aise" avec la situation proposée. Etre assisté(e) par un robot au travail (par ex. pour la production industrielle)
QA8.3 Here is a list of things that could be done by robots. For each of them, please tell me, using a scale from 1 to 10, how you would personally feel about it. On this scale, '1' means that you would feel "totally uncomfortable" and '10' means that you would feel "totally comfortable" with this situation. Having a robot assist you at work (e.g.: in manufacturing)
Total 'Moyennement à l'aise (5-6)'
Total 'Fairly comfortable (5-6)'
Gesamt 'Ziemlich wohl fühlen (5-6)'
EB77.1
Total 'Mal à l'aise (1-4)' Total 'A l'aise (7-10)'
Total 'Comfortable (7-10)'
Gesamt 'Wohl fühlen(7-10)'
EB77.1
27 21 48
Total 'Uncomfortable (1-4)'
Gesamt ' Unwohl fühlen(1-4)'
EB77.1
24 22 52
15 14 63
11 15 71
12 11 73
23 24 48
17 24 56
35 15 45
41 17 39
34 22 43
29 23 46
35 27 35
48 16 35
21 20 56
26 21 49
34 28 37
24 24 46
42 17 37
11 17 71
33 23 41
13 15 65
42 22 30
54 12 22
19 19 60
7 12 80
24 25 48
16 17 66
7 11 81
T25

SPECIAL EUROBAROMETER 382 “Public Attitudes towards Robots”
%
EU 27
BE
BG
CZ
DK
DE
EE
IE
EL
ES
FR
IT
CY
LV
LT
LU
HU
MT
NL
AT
PL
PT
RO
SI
SK
FI
SE
UK
QA8.4 Hier ist eine Liste mit Tätigkeiten, die von Robotern ausgeführt werden könnten. Bitte sagen Sie mir zu jeder Tätigkeit, wie Sie sich persönlich dabei fühlen würden, wenn diese von einem Roboter ausgeführt würde. Nutzen Sie hierzu eine Skala von 1 bis 10, auf der '1' bedeutet, dass Sie sich in dieser Situation "vollkommen unwohl fühlen würden" und eine '10', dass Sie sich dabei "vollkommen wohl fühlen würden". Ein Roboter passt auf Ihre Kinder oder betagten Eltern auf
QA8.4 Voici une liste de choses qui pourraient être faites par des robots. Pour chacune d’entre elles, pouvez-vous me dire ce que vous en pensez personnellement en utilisant une échelle de 1 à 10, où '1' signifie que vous vous sentez "tout à fait mal à l’aise" et '10' "tout à fait à l’aise" avec la situation proposée. Faire garder vos enfants ou vos parents âgés par un robot
QA8.4 Here is a list of things that could be done by robots. For each of them, please tell me, using a scale from 1 to 10, how you would personally feel about it. On this scale, '1' means that you would feel "totally uncomfortable" and '10' means that you would feel "totally comfortable" with this situation. Having your children or elderly parents minded by a robot
1 Tout à fait mal à l’aise
3 5
1 Totally uncomfortable
1 Würde mich vollkommen unwohl
fühlenEB
77.1
2
2
2
EB77.1
3
3
EB77.1
4
4
4
EB77.1
5
5
EB77.1
6
6
6
EB77.1
5 2
63 10 8 5
66 9 7 4
6 2
5 4
52 10 9 5
44 13 8 4
10 3
6 256 11 12 5
2 179 7 4 3
7 3
76 7 4 3
58 11 8 5
3 1
4 2
67 11 7 2
64 11 6 4
5 2
2 1
49 12 11 7
80 9 5 2
8 6
3 0
75 9 3 2
83 4 3 1
3 2
3 2
86 5 3 1
79 6 3 1
1 1
5 2
77 5 3 4
65 9 8 5
3 2
6 3
61 9 8 5
61 10 9 6
4 3
8 2
60 14 7 4
54 9 7 3
4 1
4 2
74 10 7 1
62 9 5 3
3 1
7 4
58 14 8 4
50 10 11 4
4 5
3 1
72 8 7 2
75 9 5 4
4 2
T26

SPECIAL EUROBAROMETER 382 “Public Attitudes towards Robots”
%
EU 27
BE
BG
CZ
DK
DE
EE
IE
EL
ES
FR
IT
CY
LV
LT
LU
HU
MT
NL
AT
PL
PT
RO
SI
SK
FI
SE
UK 1 0 1
0
1 1 1
2 1 0 0 0
2 1 0 0 0
4 2 1
4
1
3 3 1
1 1 1 0 0
2 2 2 3 4
1 4 1
2
3
1 2 1
3 3 1 4 3
2 1 1 2 1
1 0 0
3
2
2 2 0
0 0 0 3 1
1 0 1 3 0
1 0 0
1
1
1 1 0
1 1 1 1 1
1 0 2 1 1
2 0 1
1
1
1 1 1
3 2 0 0 1
0 0 1 0 0
1 0 1
0
0
2 1 1
3 1 1 2 2
1 0 3 1 0
2 2 1
1
0
2 1 0
1 1 0 1 1
2 0 2 0 0
3 0 1
4
6
4 2 1
2 3 2 4 5
2 0 1 1 0
1 1 1
2
EB77.1
2 1 1
EB77.1
EB77.1
EB77.1
EB77.1
EB77.1
8 910 Würde mich
vollkommen wohl fühlen
Trifft nicht zu (SPONTAN)
WN
10 Totally comfortable
Not applicable (SPONTANEOUS)
DK
7
NSP
7 8 9
7 8 910 Tout à fait à
l’aisePas applicable (SPONTANE)
QA8.4 Hier ist eine Liste mit Tätigkeiten, die von Robotern ausgeführt werden könnten. Bitte sagen Sie mir zu jeder Tätigkeit, wie Sie sich persönlich dabei fühlen würden, wenn diese von einem Roboter ausgeführt würde. Nutzen Sie hierzu eine Skala von 1 bis 10, auf der '1' bedeutet, dass Sie sich in dieser Situation "vollkommen unwohl fühlen würden" und eine '10', dass Sie sich dabei "vollkommen wohl fühlen würden". Ein Roboter passt auf Ihre Kinder oder betagten Eltern auf
QA8.4 Voici une liste de choses qui pourraient être faites par des robots. Pour chacune d’entre elles, pouvez-vous me dire ce que vous en pensez personnellement en utilisant une échelle de 1 à 10, où '1' signifie que vous vous sentez "tout à fait mal à l’aise" et '10' "tout à fait à l’aise" avec la situation proposée. Faire garder vos enfants ou vos parents âgés par un robot
QA8.4 Here is a list of things that could be done by robots. For each of them, please tell me, using a scale from 1 to 10, how you would personally feel about it. On this scale, '1' means that you would feel "totally uncomfortable" and '10' means that you would feel "totally comfortable" with this situation. Having your children or elderly parents minded by a robot
T27

SPECIAL EUROBAROMETER 382 “Public Attitudes towards Robots”
%
EU 27
BE
BG
CZ
DK
DE
EE
IE
EL
ES
FR
IT
CY
LV
LT
LU
HU
MT
NL
AT
PL
PT
RO
SI
SK
FI
SE
UK
QA8.4 Hier ist eine Liste mit Tätigkeiten, die von Robotern ausgeführt werden könnten. Bitte sagen Sie mir zu jeder Tätigkeit, wie Sie sich persönlich dabei fühlen würden, wenn diese von einem Roboter ausgeführt würde. Nutzen Sie hierzu eine Skala von 1 bis 10, auf der '1' bedeutet, dass Sie sich in dieser Situation "vollkommen unwohl fühlen würden" und eine '10', dass Sie sich dabei "vollkommen wohl fühlen würden". Ein Roboter passt auf Ihre Kinder oder betagten Eltern auf
QA8.4 Voici une liste de choses qui pourraient être faites par des robots. Pour chacune d’entre elles, pouvez-vous me dire ce que vous en pensez personnellement en utilisant une échelle de 1 à 10, où '1' signifie que vous vous sentez "tout à fait mal à l’aise" et '10' "tout à fait à l’aise" avec la situation proposée.
Faire garder vos enfants ou vos parents âgés par un robot
QA8.4 Here is a list of things that could be done by robots. For each of them, please tell me, using a scale from 1 to 10, how you would personally feel about it. On this scale, '1' means that you would feel "totally uncomfortable" and '10' means that you would feel "totally comfortable" with this situation. Having your children or elderly parents minded by a robot
Total 'Moyennement à l'aise (5-6)'
Total 'Fairly comfortable (5-6)'
Gesamt 'Ziemlich wohl fühlen (5-6)'
EB77.1
Total 'Mal à l'aise (1-4)' Total 'A l'aise (7-10)'
Total 'Comfortable (7-10)'
Gesamt 'Wohl fühlen(7-10)'
EB77.1
86 7 5
Total 'Uncomfortable (1-4)'
Gesamt ' Unwohl fühlen(1-4)'
EB77.1
86 8 5
68 10 11
76 12 10
84 8 8
93 3 3
82 10 5
89 4 5
86 5 7
88 7 5
95 3 2
79 14 6
92 3 5
89 5 5
89 4 5
96 2 2
87 8 3
88 6 4
87 8 4
83 7 7
73 10 12
85 5 4
78 7 8
92 5 3
76 11 10
90 6 3
84 9 7
93 3 3
T28

SPECIAL EUROBAROMETER 382 “Public Attitudes towards Robots”
%
EU 27
BE
BG
CZ
DK
DE
EE
IE
EL
ES
FR
IT
CY
LV
LT
LU
HU
MT
NL
AT
PL
PT
RO
SI
SK
FI
SE
UK
QA9 Selon vous, en Europe, quand les robots qui remplissent des tâches ménagères deviendront-ils une chose courante ?
QA9 In your opinion, in Europe, when it will become commonplace for robots to do house work?
QA9 Wann wird es in Europa Ihrer Meinung nach zum Alltag gehören, dass Roboter die Hausarbeit machen?
Dans 10 ans
In 10 years’ time
In 10 Jahren
EB77.1
Dans 5 ans
In 5 years’ time
In 5 Jahren
EB77.1
Dans plus de 20 ans
In more than 20 years’ time
In mehr als 20 Jahren
EB77.1
Dans 20 ans
In 20 years’ time
In 20 Jahren
EB77.1
Nie (SPONTAN)
EB77.1
Il s’agit déjà d’une chose courante (SPONTANE)It is already
commonplace (SPONTANEOUS)
Das ist bereits Alltag (SPONTAN)
EB77.1
8 22 21 30
NSP
DK
WN
EB77.1
Jamais (SPONTANE)
Never (SPONTANEO
US)
4 7 8
14 31 21 26 3 4 1
19
8 21 28 29 4 5 5
7 20
27 37 16 13
3 420 27
5 1 1
74 18
7 22 25 35
4 1521 31
2 4 5
9 19 21 28 3 8 12
7
10 19 15 36 6 5 9
5 20
12 27 22 29
2 719 40
1 5 4
9 24 21 20 7 8 11
10
8 25 23 30 3 7 4
6 19
2 14 20 47
0 620 39
1 10 6
10 28 21 30 4 3 4
5
16 27 14 19 3 2 19
3 12
9 30 27 27
2 1222 44
1 4 2
10 25 18 23 8 10 6
10
9 18 14 21 8 6 24
5 18
9 17 15 27
2 323 39
5 10 17
12 27 26 21 4 6 4
3
15 34 26 19 1 3 2
13 26
10 31 23 30
7 425 22
2 3 1
8 25 24 31 1 5 6
T29