Special Elite Engineers Webinar Sequence An...
60
Special Elite Engineers Webinar Sequence An Insider’s Perspective Special Elite Engineers Webinar Sequence Wednesday, June 17th, 2015 3:00 PM – 4:00 PM EST Our Elite Engineer of the Month: Vincent Nganga , PE An Insider’s Perspective
Transcript of Special Elite Engineers Webinar Sequence An...

Special Elite Engineers Webinar Sequence An Insider’s Perspective
Special Elite Engineers Webinar Sequence
Wednesday, June 17th, 2015
3:00 PM – 4:00 PM EST
Our Elite Engineer of the Month: Vincent Nganga, PE
An Insider’sPerspective

Special Elite Engineers Webinar Sequence An Insider’s Perspective
This presentation is protected by US and International Copyright laws.
Reproduction, distribution, display and use of the presentation without
written permission of the speaker is prohibited.
© MIDASoft Inc.,2013
Copyright Materials

Special Elite Engineers Webinar Sequence An Insider’s Perspective
Vincent NgangaSenior Bridge Engineer
• MS, Structural Engineering, Southern Illinois University,
Edwardsville
• BS, Civil Engineering, Washington University in St. Louis
• BS, Mathematics, Rockford College, Rockford, Illinois
E D U C AT I O N
• I-270/US 33 Interchange Northwest Freeway Reconstruction, Columbus OH
• Columbus Crossroads design-build project, Columbus OH
• I-5 Everett HOV Design-Build Project, Everett WA
PA S T P R O J E C T S
Speaker Information

3D FEM Modeling and Seismic Analysis for Evaluating Demand
and Capacity of Highway Bridges
MIDAS Special Elite Engineers Webinar - An Insider’s Perspective
Vincent Nganga, PESenior Bridge Engineer
June 17th, 2015
1. Introduction
Illustrate the procedure used to perform nonlinear static
“pushover” analysis in both the longitudinal and transverse
directions.
To perform the pushover analysis in the longitudinal
direction, the entire bridge is pushed in order to include
the frame action of the superstructure and adjacent bents.
To perform the pushover analysis in the transverse
direction, a bent may be isolated using the midas Civil
“staged construction” feature OR the entire bridge can be
pushed.

2. Model Setup
• Overview of Model
• Foundations Modeling
• Material Modeling
• Column modeling
• Gravity Loads
3. Displacement Demand Analysis
• Modal Analysis
• Response Spectrum Analysis
• Displacement Demand
4. Displacement Capacity Analysis
• Hinge Definitions and Assignments
• Pushover Analysis

5. AASHTO LRFD Code Requirements
• P-Δ Capacity Requirement Check
• Minimum Lateral Strength Check
• Structure Displacement Demand/Capacity Check
• Member Ductility Requirement Check
• Column Shear Demand/Capacity Check
• Balanced Stiffness and Frame Geometry Requirement Check

6. Model Overview
• Three spans 54’ , 77’ and 54’ in length
• Four Prestressed concrete girder lines with 8’-6” spacing
• 8” concrete deck with 34’ out-to-out width
• Beams continuous and fixed at the intermediate piers
• Two-5’ diameter columns at the intermediate bents on spread
footings
• Abutments free in the longitudinal direction and fixed transversely
6.1 Foundations Model - Soils
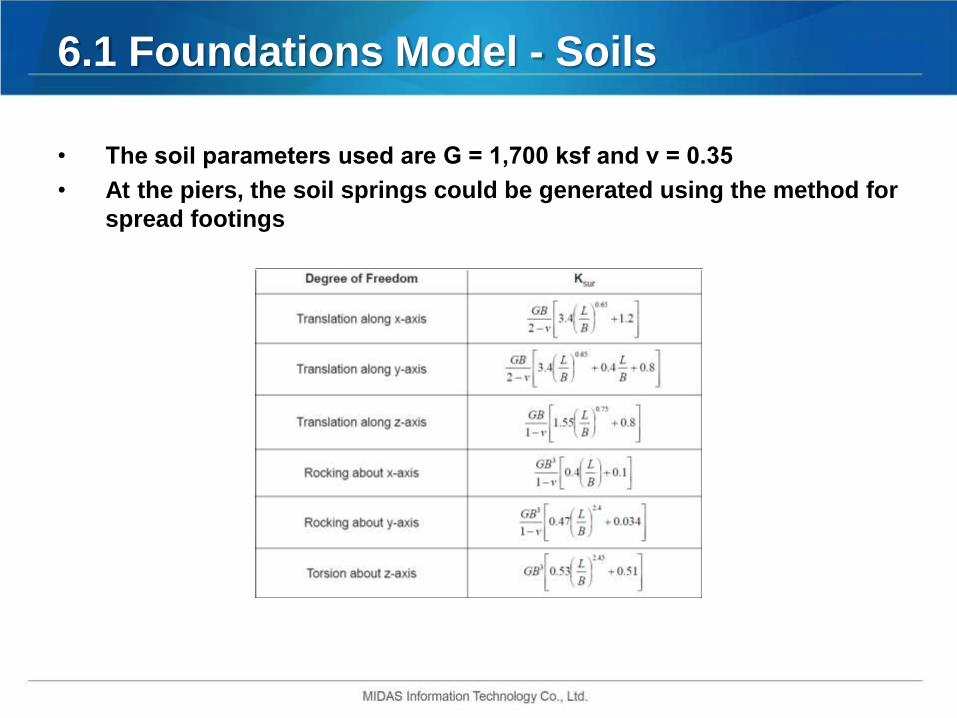
• The soil parameters used are G = 1,700 ksf and ν = 0.35
• At the piers, the soil springs could be generated using the method for
spread footings
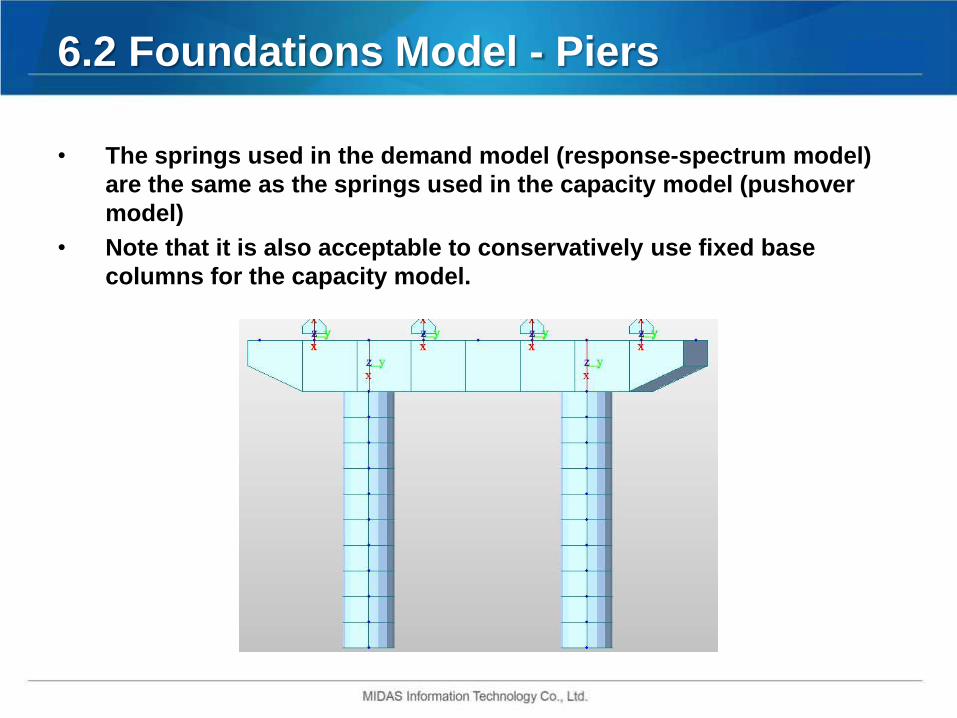
6.2 Foundations Model - Piers
• The springs used in the demand model (response-spectrum model)
are the same as the springs used in the capacity model (pushover
model)
• Note that it is also acceptable to conservatively use fixed base
columns for the capacity model.
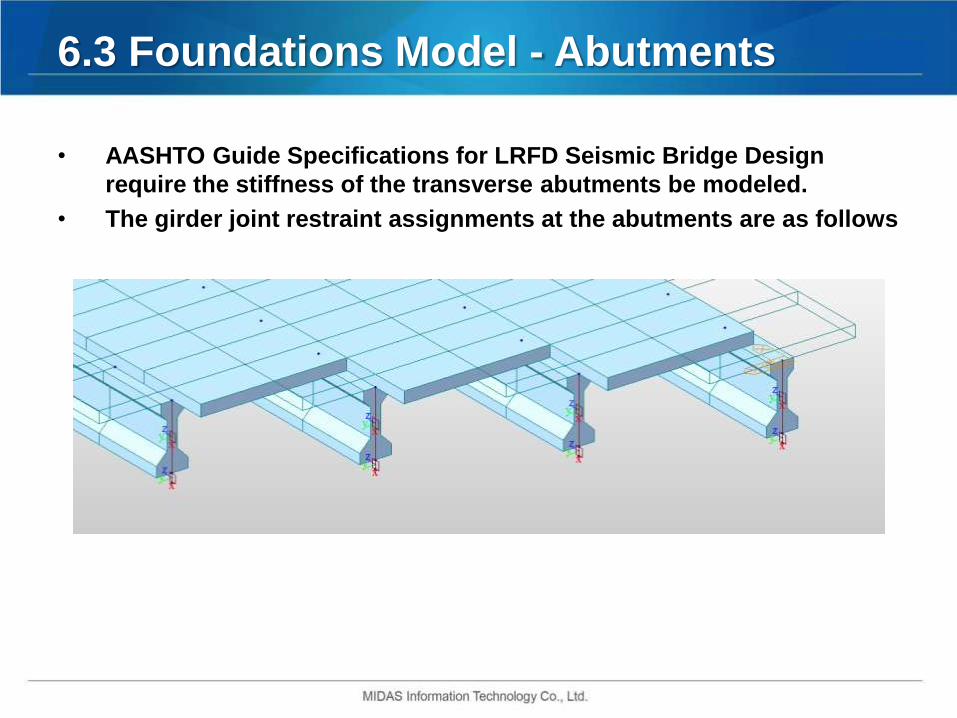
6.3 Foundations Model - Abutments
• AASHTO Guide Specifications for LRFD Seismic Bridge Design
require the stiffness of the transverse abutments be modeled.
• The girder joint restraint assignments at the abutments are as follows
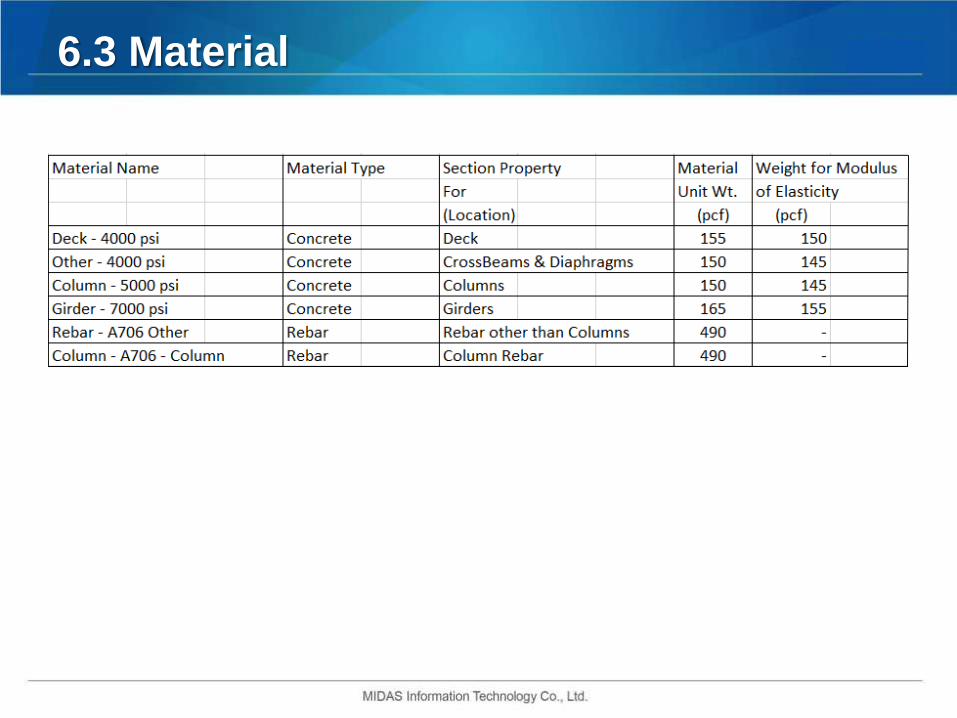
6.3 Material

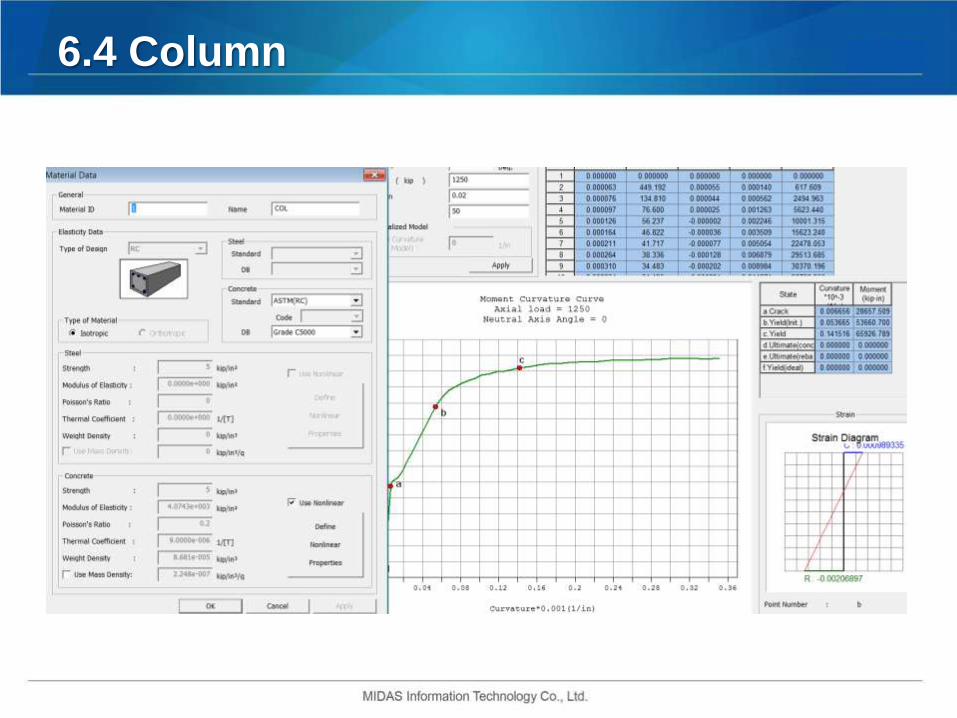
6.4 Column
• There are two columns at each bent.
• The columns are five feet in diameter and have (24) #10 bars for
longitudinal steel, which amounts to a steel-concrete area ratio of
about 1%.
• In the hinge zones, the columns have confinement steel consisting of
#6 spiral bars with a 3.5 inch pitch.
• The column elements have rigid end offsets assigned to them at the
footings and cap beams.
• Note that the columns are split into ten frame elements.
6.4 Column

midas Civil Section Designer
• The “COLUMN” frame section is defined using a round shape in
General Section Designer as shown
6.4 Column
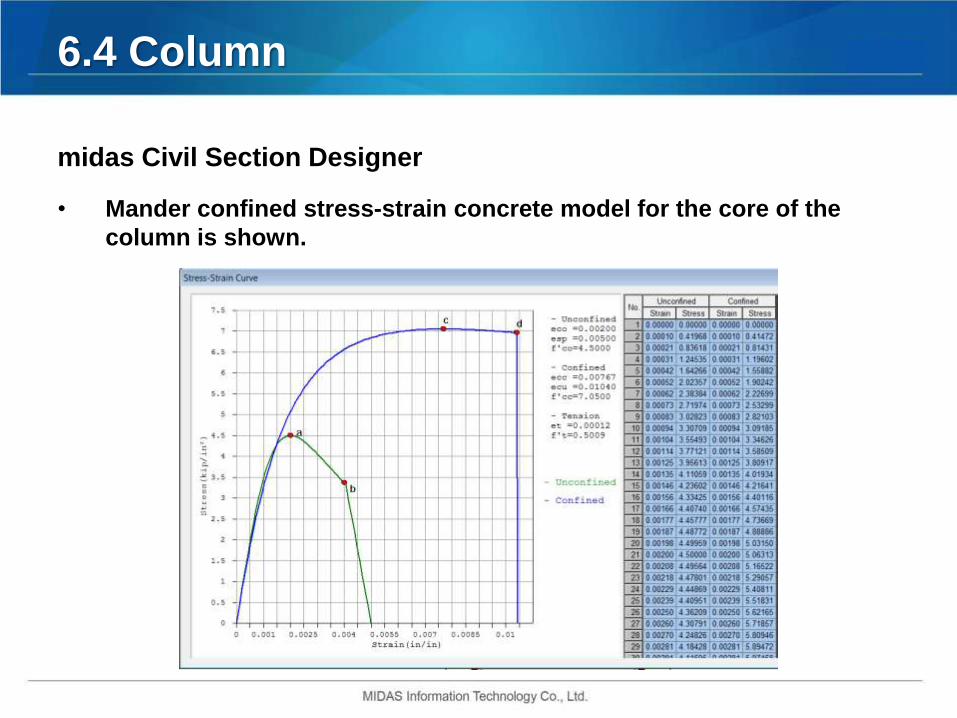
midas Civil Section Designer
• Mander confined stress-strain concrete model for the core of the
column is shown.
6.4 Column
6.5 Pier Cap Beam
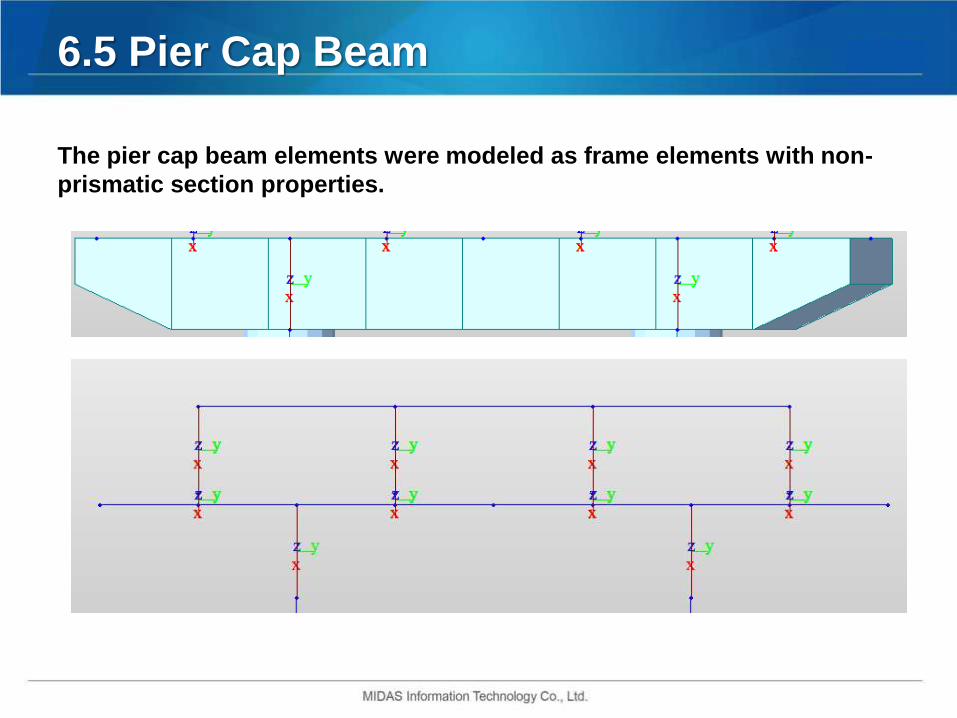
The pier cap beam elements were modeled as frame elements with non-
prismatic section properties.
6.6 Superstructure – Deck and Girders
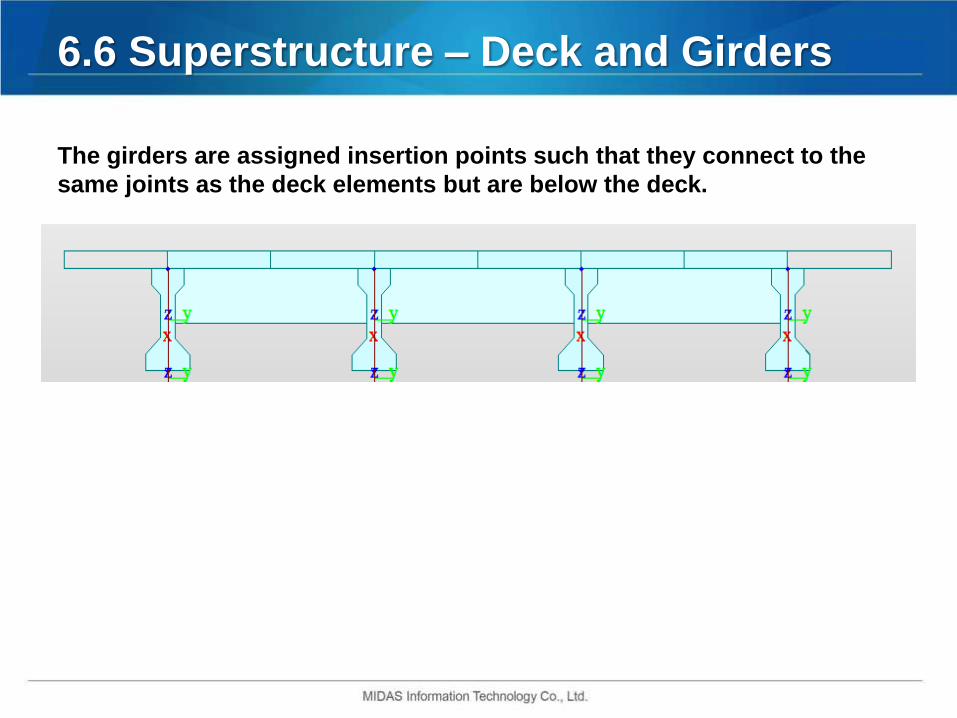
The girders are assigned insertion points such that they connect to the
same joints as the deck elements but are below the deck.
6.6 Superstructure – Deck and Girders
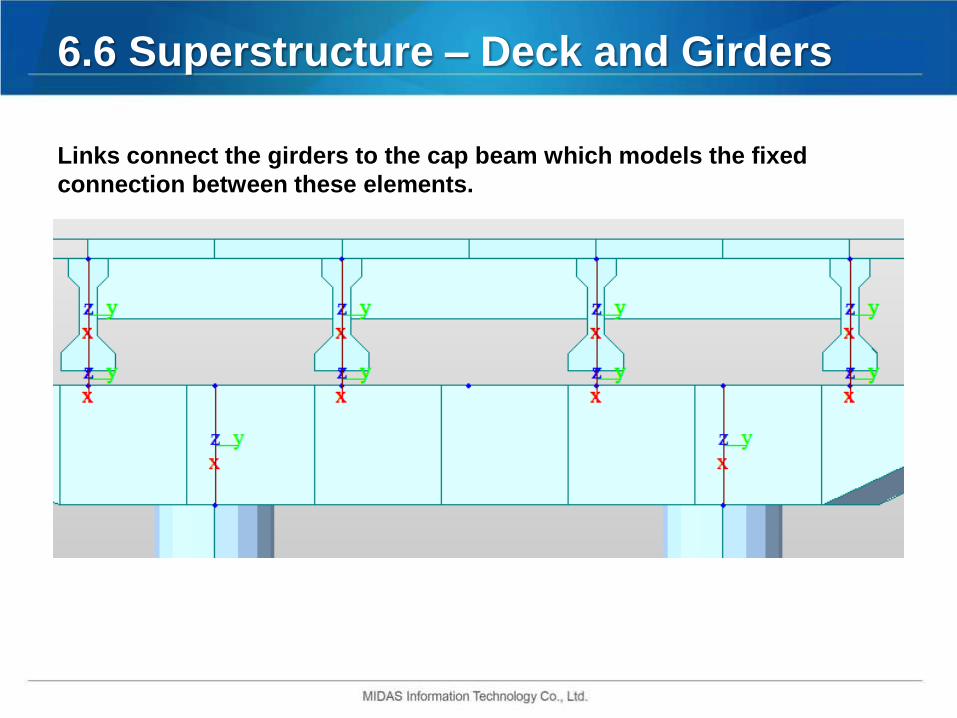
Links connect the girders to the cap beam which models the fixed
connection between these elements.

6.7 Gravity Load Patterns
There are three dead load patterns in the model:
“DC-Structure”, “DC-Barriers”, and “DW-Overlay”.
“DC-Structure” case includes the self weight of the structural
components.
“DC-Barriers” case includes the dead load of the barriers, which is
applied as line load to the outermost deck elements
“DW-Overlay” case includes the future overlay loads applied to the
deck elements

7. Displacement Demand Analysis
Modal Analysis
1. Mass Source
• All of the dead loads are considered as contributing mass for
the modal load case.
2. Cracking of Columns
• Section 5.6 of the AASHTO Guide Specifications for LRFD
Seismic Bridge Design provides Diagrams that can be used
to determine the cracked section properties of the columns
• The column axial dead load at mid-height was calculated in
the model to be approximately 1,200 kips without including
the effects of the construction staging.
For our bridge, the inclusion of staging effects would cause the
axial load in the columns to vary by less than ten percent. Such
a small change in axial load would not significantly alter the
results of this analysis.
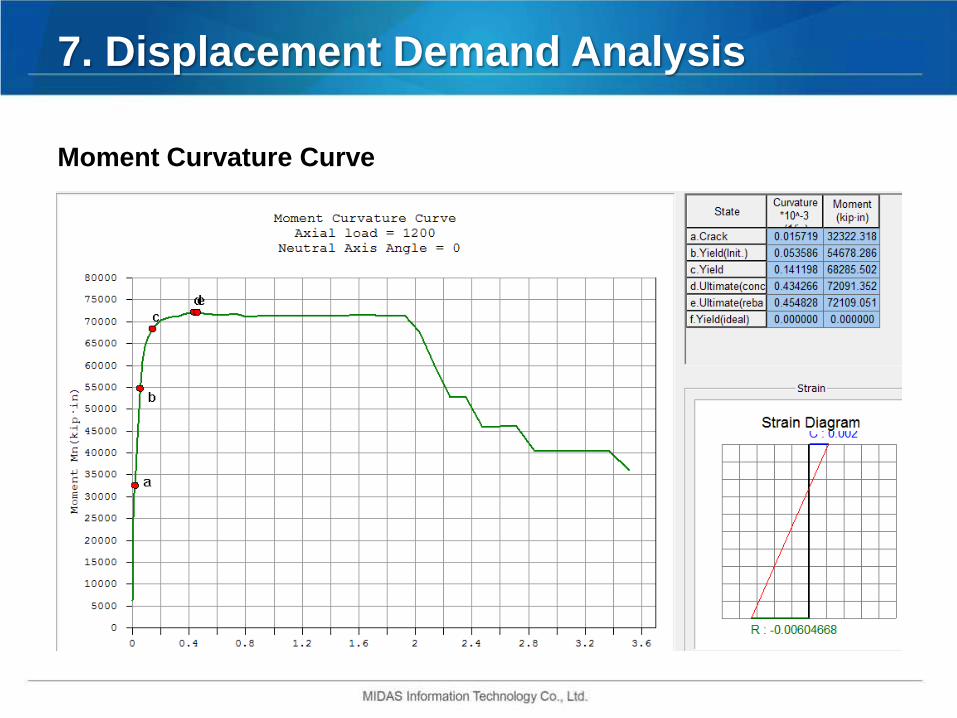
Moment Curvature Curve
7. Displacement Demand Analysis
7. Displacement Demand Analysis
Property Modifiers
• The previous moment curvature curve we see that concrete strain
capacity limits the available plastic curvature.
• The property modifiers are then applied to the column frame
elements.
• Note that the torsional constant modifier is 0.2 for columns as
required by Section 5.6.5 of the AASHTO Guide Specifications for
LRFD Seismic Bridge Design.
7. Displacement Demand Analysis
Verification of Mass Participation
• Section 5.4.3 of the AASHTO Guide Specifications for LRFD Seismic
Bridge Design requires a minimum of 90% mass participation in both
directions.
• For our bridge, the mass is considered to be the same in both
directions even though the end diaphragms are free in the
longitudinal direction and restrained in the transverse direction.
8. Response-Spectrum Analysis
Seismic Hazard
• The bridge is located in Ridgefield, WA. The mapped spectral acceleration
coefficients are: PGA = 0.256 g
Ss = 0.605 g
S1 = 0.217 g
• A site class of E is used and the site coefficients are: FPGA = 1.422
Fa = 1.489
Fv = 3.129
• Therefore, the response-spectrum was generated using the following
parameters: As = FPGA*PGA = 0.364 g
SDS = Fa*Ss = 0.901 g
SD1 = Fv*S1 = 0.679 g
• Since SD1 is greater than or equal to 0.50, per Table 3.5-1 of the AASHTO
Guide Specifications for LRFD Seismic Bridge Design the Seismic Design
Category is D.
8. Response-Spectrum Analysis
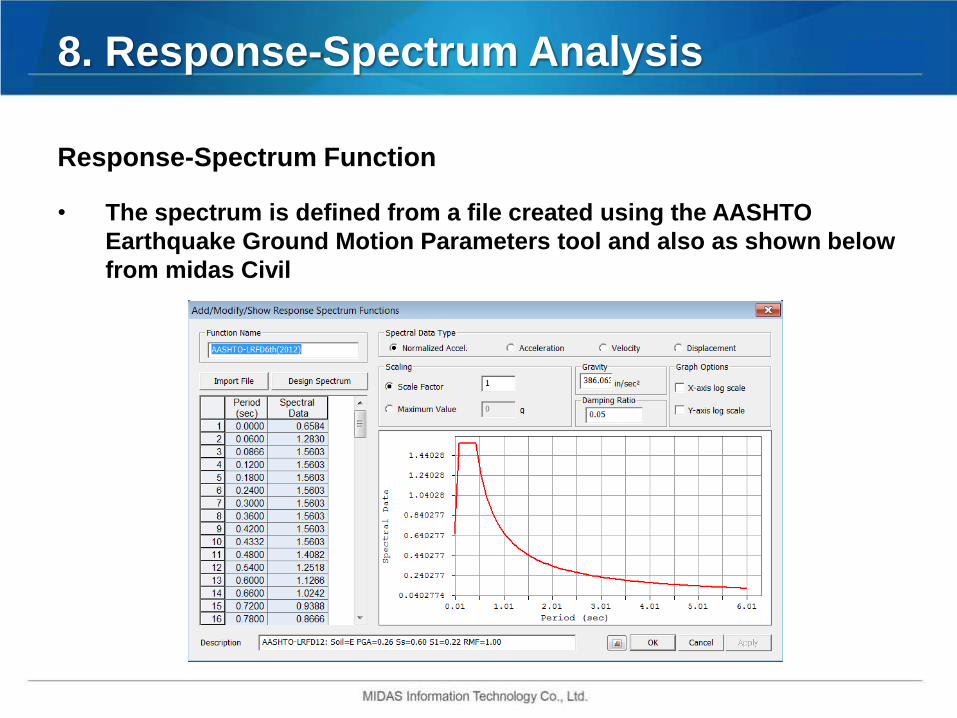
Response-Spectrum Function
• The spectrum is defined from a file created using the AASHTO
Earthquake Ground Motion Parameters tool and also as shown below
from midas Civil
8. Response-Spectrum Analysis
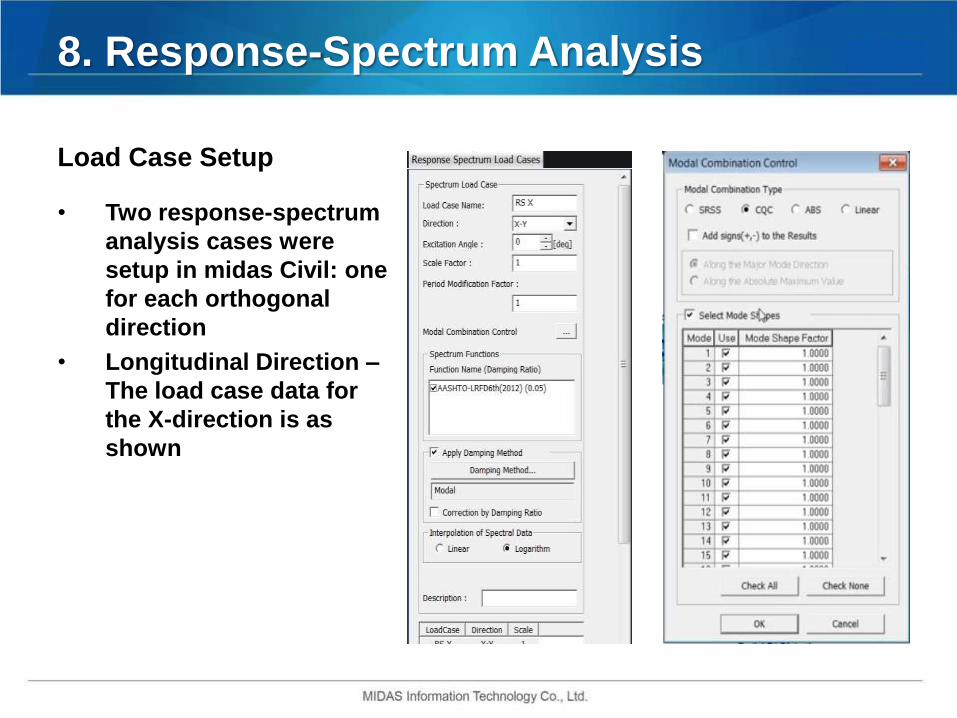
Load Case Setup
• Two response-spectrum
analysis cases were
setup in midas Civil: one
for each orthogonal
direction
• Longitudinal Direction –
The load case data for
the X-direction is as
shown
8. Response-Spectrum Analysis
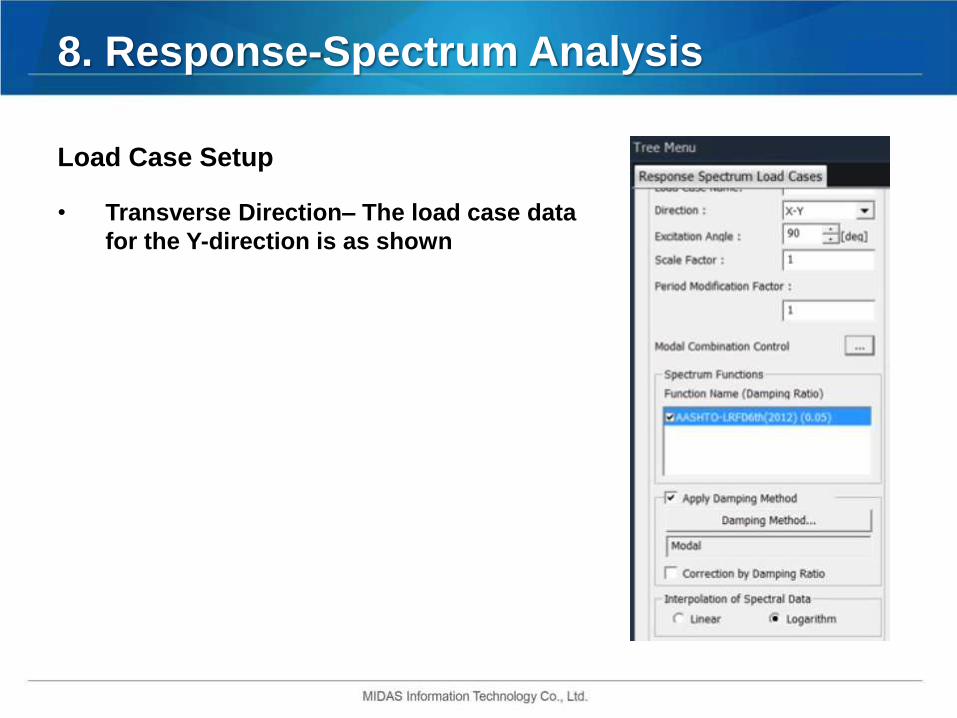
Load Case Setup
• Transverse Direction– The load case data
for the Y-direction is as shown
8. Response-Spectrum Analysis
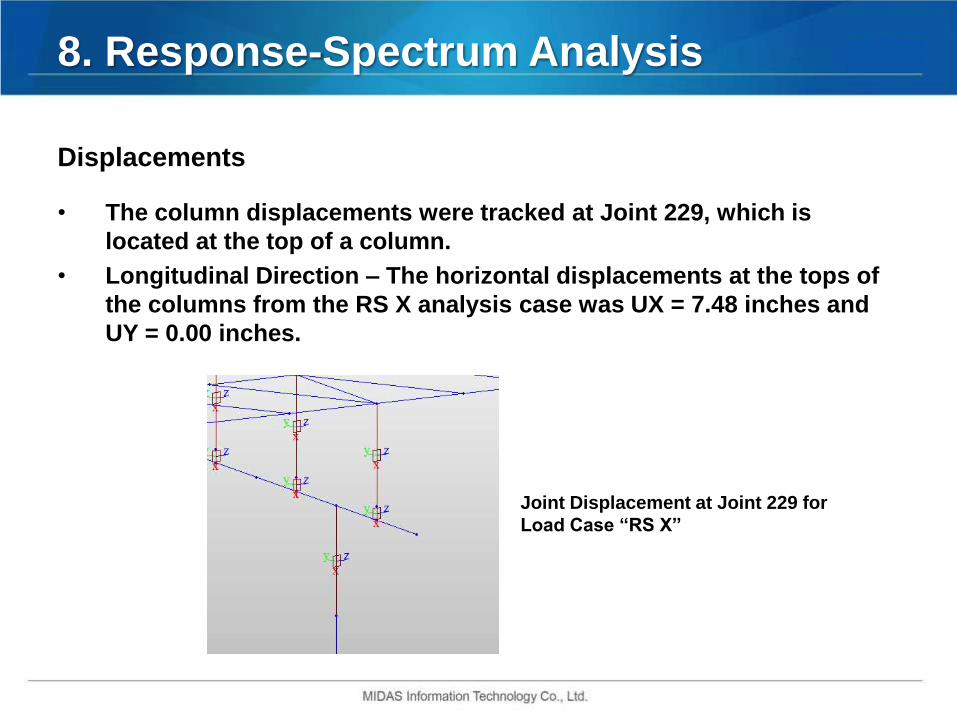
Displacements
• The column displacements were tracked at Joint 229, which is
located at the top of a column.
• Longitudinal Direction – The horizontal displacements at the tops of
the columns from the RS X analysis case was UX = 7.48 inches and
UY = 0.00 inches.
Joint Displacement at Joint 229 for
Load Case “RS X”
8. Response-Spectrum Analysis
Displacements
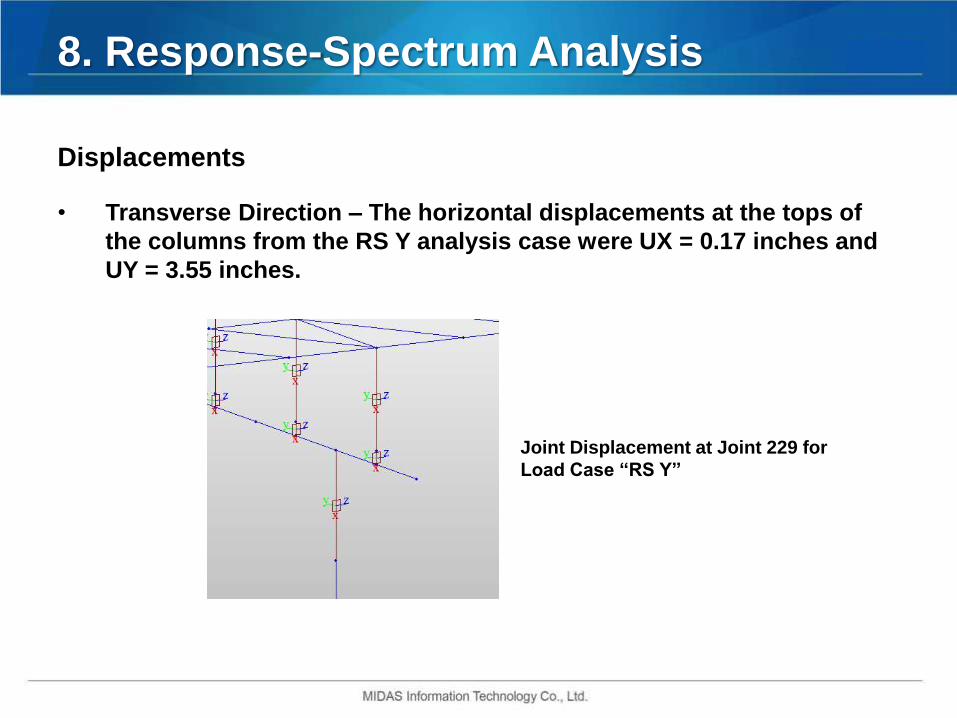
• Transverse Direction – The horizontal displacements at the tops of
the columns from the RS Y analysis case were UX = 0.17 inches and
UY = 3.55 inches.
Joint Displacement at Joint 229 for
Load Case “RS Y”

9. Displacement Demand
Displacement Magnification
• Displacement magnification must be performed in accordance with
Section 4.3.3 of the AASHTO Guide Specifications for LRFD Seismic
Bridge Design
• Compute Ts and T *: Ts = SD1 / SDS = 0.679 / 0.901 = 0.754 sec.
T * = 1.25 Ts = 1.25 * 0.754 = 0.942 sec.
• Longitudinal Direction – Computed magnification for the X-direction
(Long): TLong = 0.95 sec.
T* / TLong = 0.942 / 0.95 = 1.00 > 1.0 => Magnification is required
Rd_Long = (1 – 1 / μD)*(T* / T) + 1 / μD = (1 – 1/6)*(1.00)+1/6 = 1.0
(Assume μD =6)
9. Displacement Demand
Displacement Magnification
• Transverse Direction– Computed magnification for the Y-direction
(Trans): TTrans = 0.61 sec.
T* / TTrans = 0.942 / 0.61 = 1.54 > 1.0 => Magnification is required
Rd_Trans = (1 – 1 / μD)*(T* / T) + 1 / μD = (1 – 1/6)*(1.54)+1/6 = 1.45 (Assume μD
=6)
9. Displacement Demand
Column Displacement Demand
Section 4.4 of the AASHTO Guide Specifications for LRFD Seismic Bridge Design
requires that 100% plus 30% of the displacements from each orthogonal seismic
load case be combined to determine the displacement demands. The
displacements were tracked as Joint 229, which is located at the top of a column.
• Longitudinal Direction – For the X-direction (100RS X + 30RS Y): UX (due to RS X) = 7.48 in.
UX (due to RS Y) = 0.17 in.
Δ L D_Long = 1.0 * Rd_Long * 7.48 + 0.3 * Rd_Trans * 0.17
= 1.0 * 1.00* 7.48 + 0.3 * 1.45 * 0.17 = 7.55 in.
=> This is the displacement demand for the X-Dir
• Transverse Direction – For the Y-direction (100RS Y + 30RS X): UY (due to RS Y) = 3.55 in.
UY (due to RS X) = 0.00 in.
Δ L D_Trans = 1.0 * Rd_Trans * 3.55 + 0.3 * Rd_Long * 0.00
= 1.0 * 1.45 * 3.55 + 0.3 * 1.00 * 0.00 = 5.45 in.
=> This is the displacement demand for the Y-Dir
10. Displacement Capacity Analysis
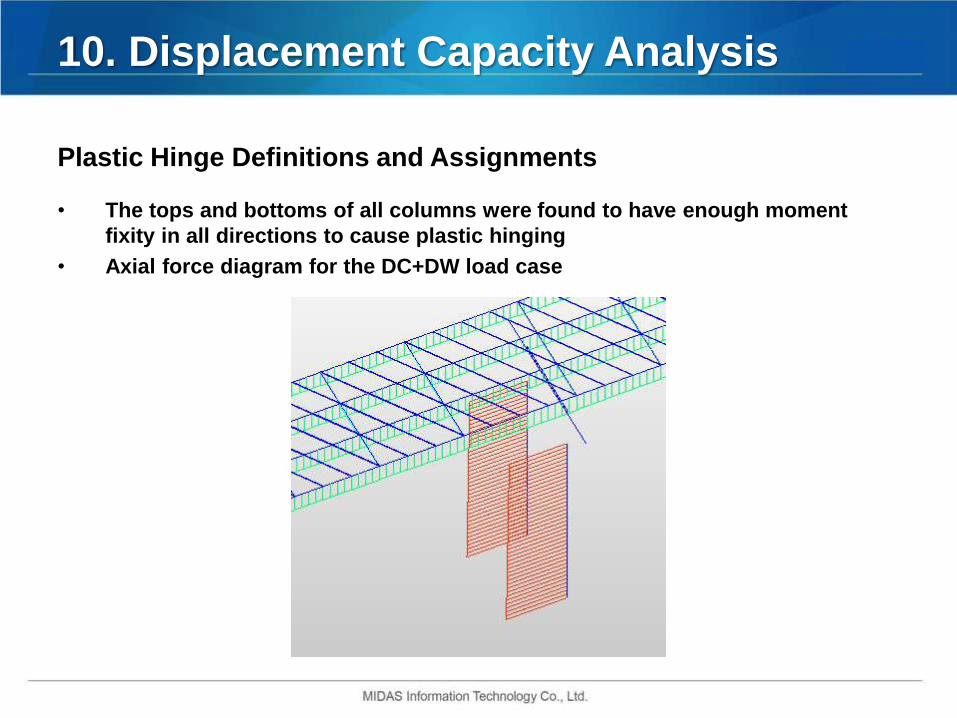
Plastic Hinge Definitions and Assignments
• The tops and bottoms of all columns were found to have enough moment
fixity in all directions to cause plastic hinging
• Axial force diagram for the DC+DW load case
10. Displacement Capacity Analysis
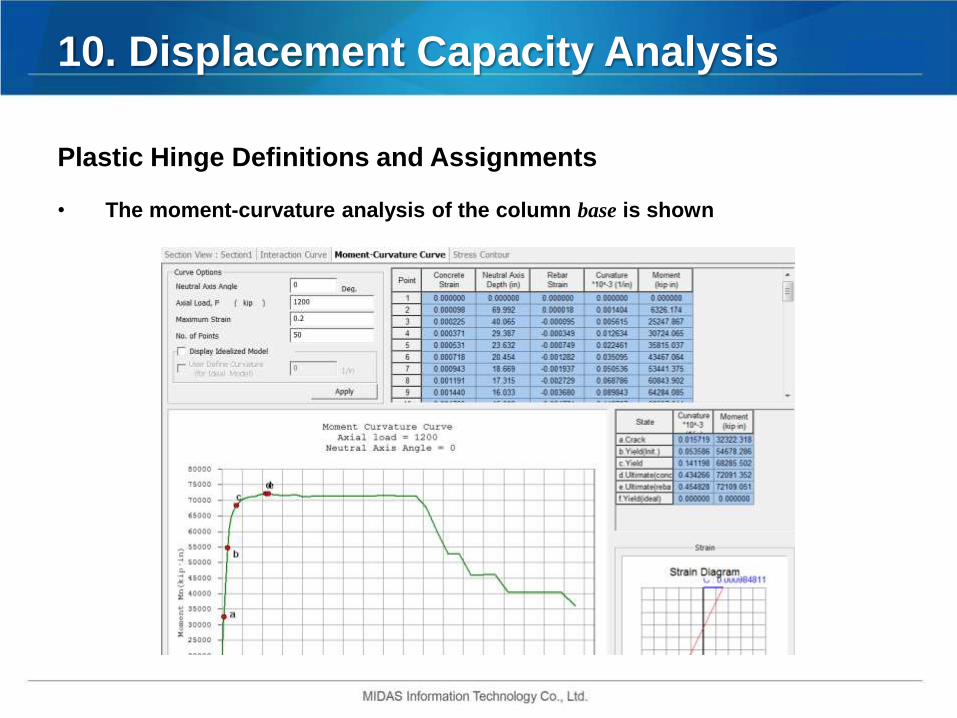
Plastic Hinge Definitions and Assignments
• The moment-curvature analysis of the column base is shown

10. Displacement Capacity Analysis
Plastic Hinge Definitions and Assignments
• The moment-curvature analysis of the column top is shown
10. Displacement Capacity Analysis
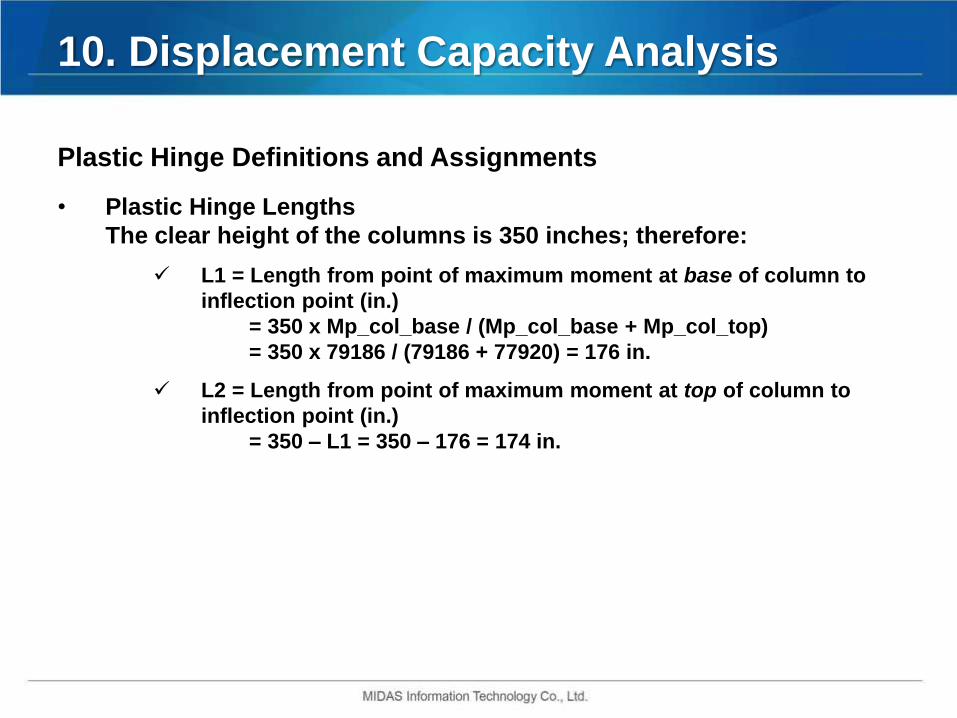
Plastic Hinge Definitions and Assignments
• Plastic Hinge Lengths
The clear height of the columns is 350 inches; therefore:
L1 = Length from point of maximum moment at base of column to
inflection point (in.)
= 350 x Mp_col_base / (Mp_col_base + Mp_col_top)
= 350 x 79186 / (79186 + 77920) = 176 in.
L2 = Length from point of maximum moment at top of column to
inflection point (in.)
= 350 – L1 = 350 – 176 = 174 in.

10. Displacement Capacity Analysis
Plastic Hinge Definitions and Assignments
In order to assign the plastic hinges to the column elements, the relative
locations of the plastic hinges along the column frame elements were
computed.
• For the bases of the columns: Relative Length = [Footing Offset + (Hinge Length / 2)] / Element Length
[30 + (27.0 / 2)] / 146 = 0.30
• For the tops of the columns: Relative Length = [Element Length – Capbeam Offset – (Hinge Length /
2)] / Element Length = [146 – 58 – (26.9 / 2)] / 146 = 0.51

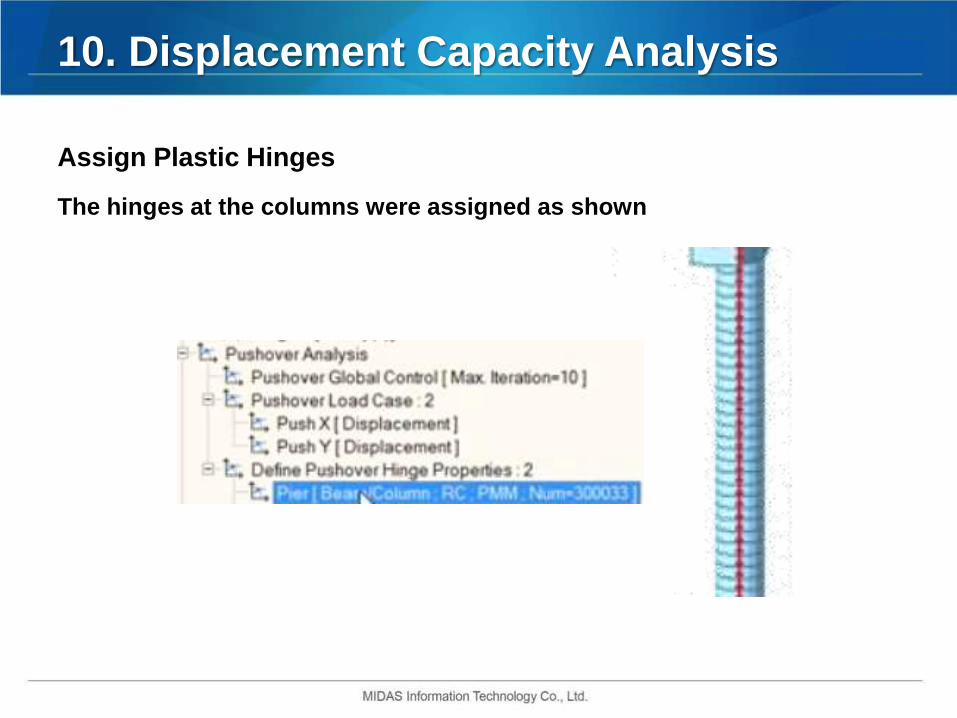
10. Displacement Capacity Analysis
Assign Plastic Hinges
The plastic hinge lengths must be computed at both the tops and
bottoms of the columns using the equations in Section 4.11.6 of the
AASHTO Guide Specifications for LRFD Seismic Bridge Design.
• The hinge length was computed as follows:Lp = 0.08L + 0.15fye*dbl ≥ 0.3fye*dbl
Where: L = length of column from point of maximum moment to the point of moment
contraflexure (in.) L1 at the base of the columns (L1Long = L1Trans = 176 in.)
L2 at the top of the columns (L2Long = L2Trans = 174 in.)
fye = expected yield strength of longitudinal column reinforcing steel bars
(ksi) = 68 ksi (ASTM A706 bars).
dbl = nominal diameter of longitudinal column reinforcing steel bars (in.) =
1.27 in. (#10 bars)
Lp1 = Plastic hinge length at base of column = 0.08*176 + 0.15*68*1.27 ≥
0.3*68*1.27 = 27.03 ≥ 25.91 = 27.0 in.
Lp2 = Plastic hinge length at top of column = 0.08*174 + 0.15*68*1.27 ≥
0.3*68*1.27 = 26.87 ≥ 25.91 = 26.9 in.
10. Displacement Capacity Analysis
Assign Plastic Hinges
The hinges at the columns were assigned as shown
11. Pushover Analysis
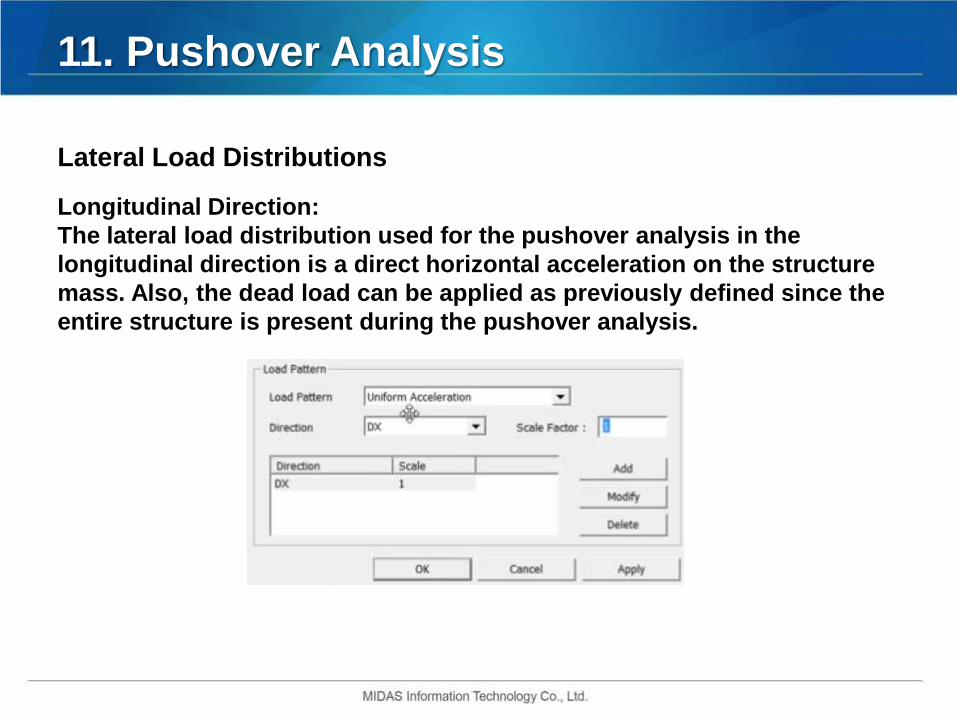
Lateral Load Distributions
Longitudinal Direction:
The lateral load distribution used for the pushover analysis in the
longitudinal direction is a direct horizontal acceleration on the structure
mass. Also, the dead load can be applied as previously defined since the
entire structure is present during the pushover analysis.
11. Pushover Analysis
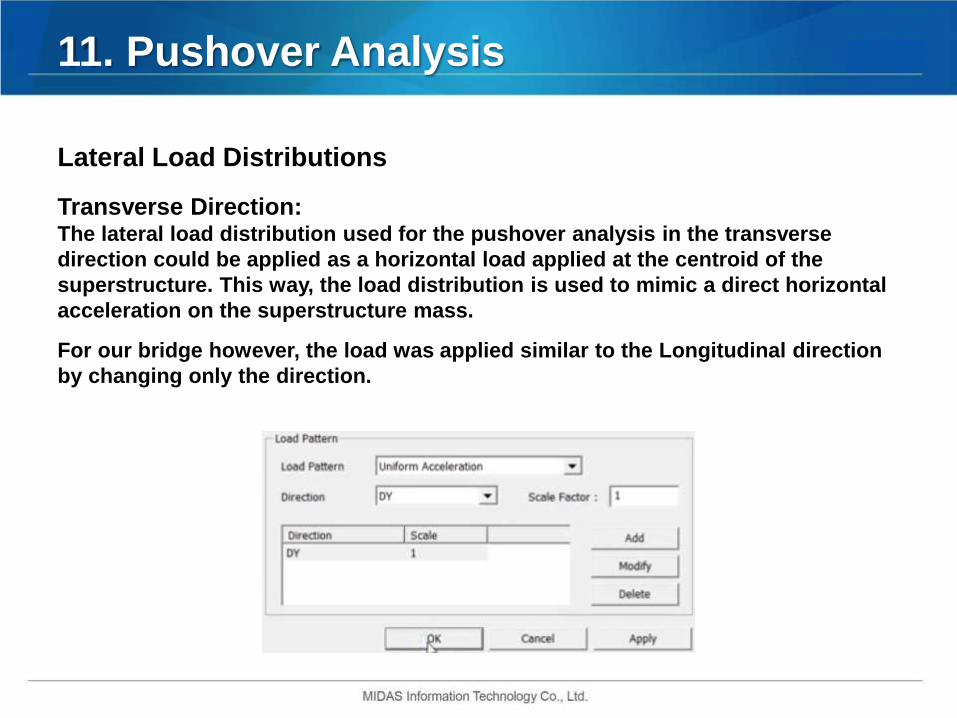
Lateral Load Distributions
Transverse Direction:The lateral load distribution used for the pushover analysis in the transverse
direction could be applied as a horizontal load applied at the centroid of the
superstructure. This way, the load distribution is used to mimic a direct horizontal
acceleration on the superstructure mass.
For our bridge however, the load was applied similar to the Longitudinal direction
by changing only the direction.
11. Pushover Analysis
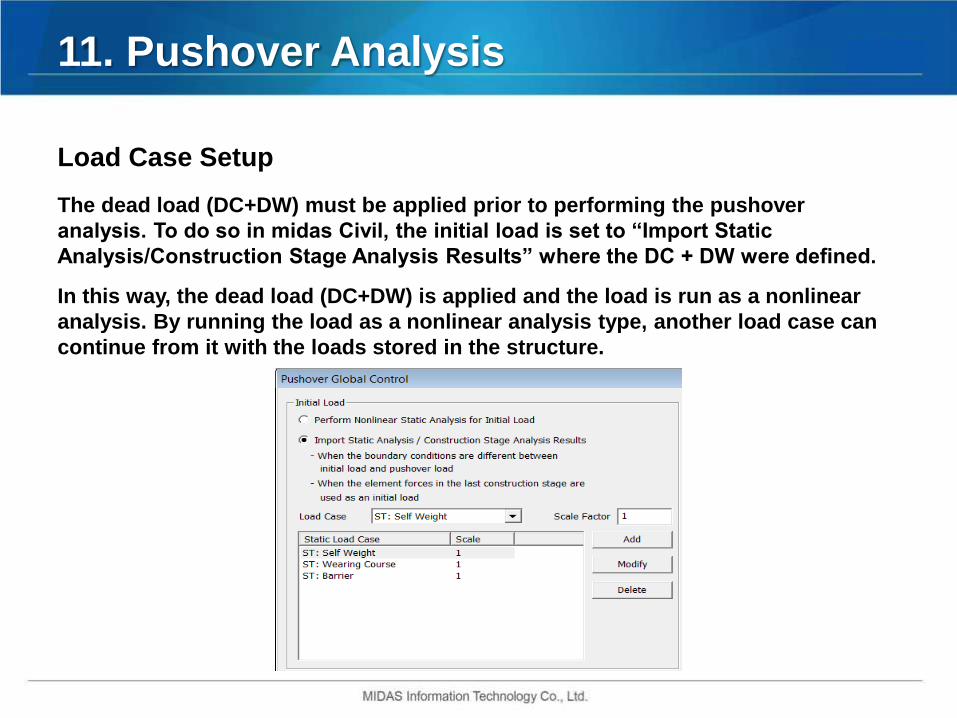
Load Case Setup
The dead load (DC+DW) must be applied prior to performing the pushover
analysis. To do so in midas Civil, the initial load is set to “Import Static
Analysis/Construction Stage Analysis Results” where the DC + DW were defined.
In this way, the dead load (DC+DW) is applied and the load is run as a nonlinear
analysis. By running the load as a nonlinear analysis type, another load case can
continue from it with the loads stored in the structure.
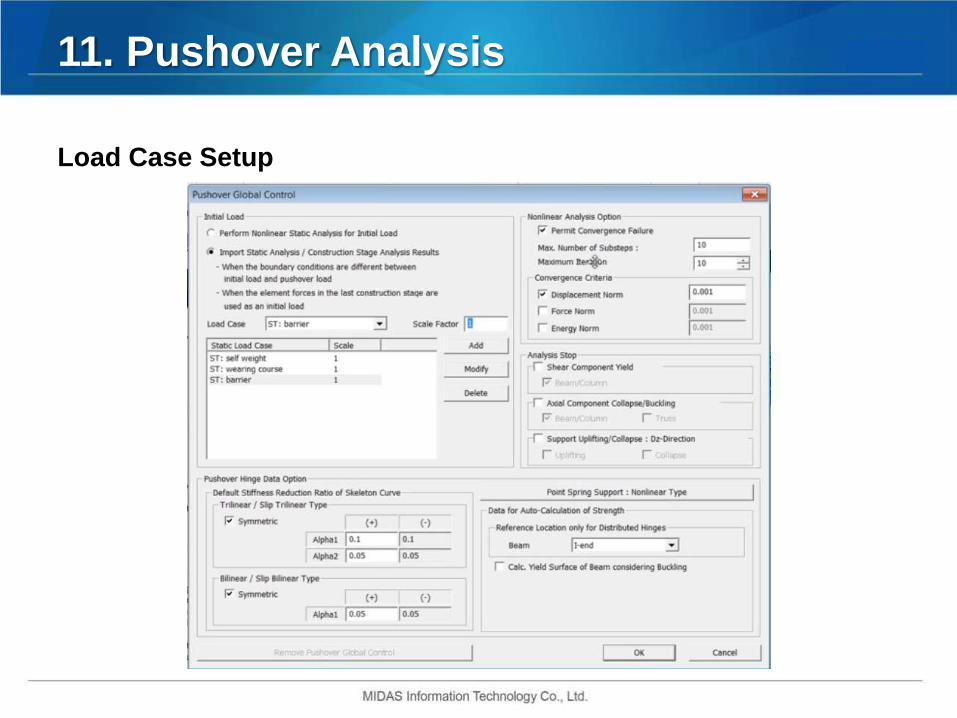
11. Pushover Analysis
Load Case Setup
11. Pushover Analysis
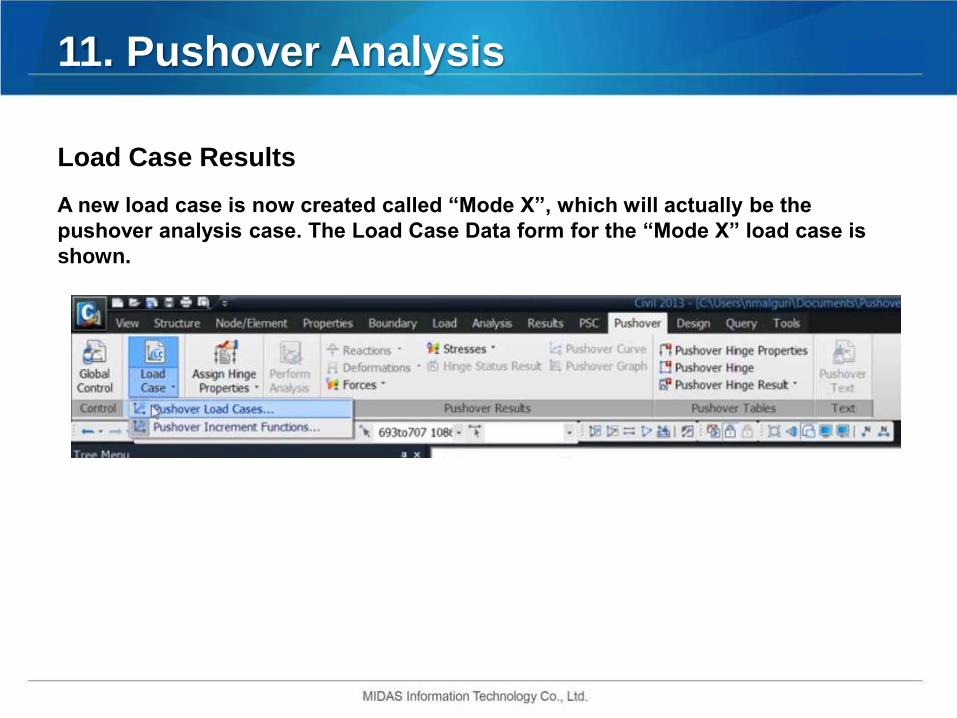
Load Case Results
A new load case is now created called “Mode X”, which will actually be the
pushover analysis case. The Load Case Data form for the “Mode X” load case is
shown.
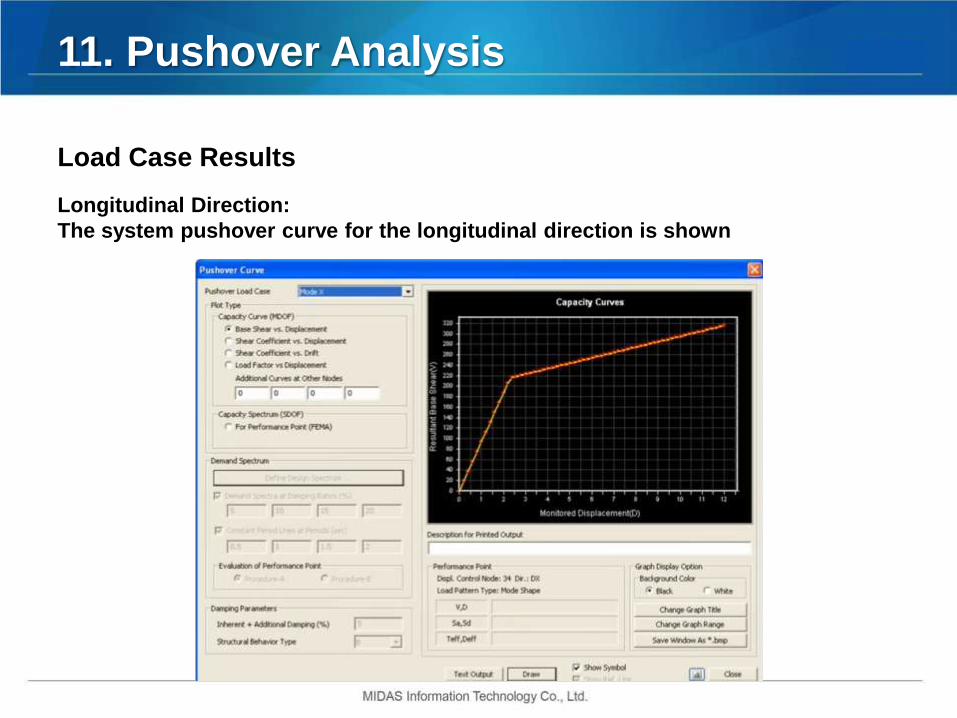
11. Pushover Analysis
Load Case Results
Longitudinal Direction:
The system pushover curve for the longitudinal direction is shown
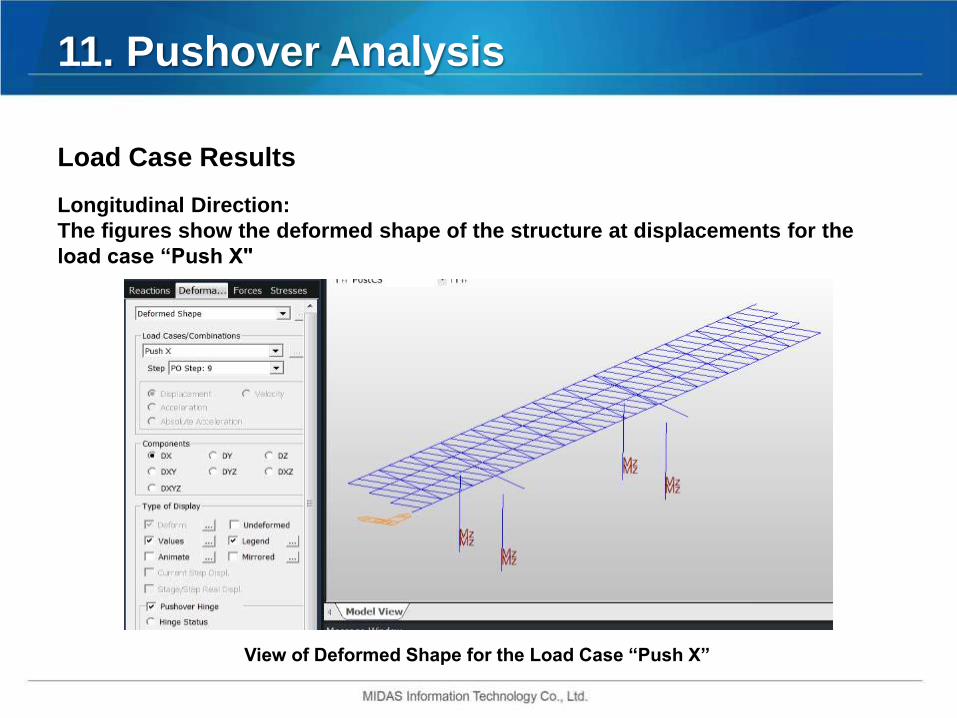
11. Pushover Analysis
Load Case Results
Longitudinal Direction:
The figures show the deformed shape of the structure at displacements for the
load case “Push X"
View of Deformed Shape for the Load Case “Push X”

11. Pushover Analysis
Load Case Results
Transverse Direction:
The system pushover curve for the transverse direction is shown

11. Pushover Analysis
Load Case Results
Transverse Direction:
The figures show the deformed shape of the structure at various displacements for
the load case “Push Y”
View of Deformed Shape for the Load Case “Push Y”
12. Code Requirements
P-Δ Capacity Requirement Check
The requirements of section 4.11.5 of the AASHTO Guide Specifications for LRFD
Seismic Bridge Design must be satisfied or a nonlinear time history analysis that
includes P-Δ effects must be performed.
The requirement is:
PdlΔr ≤ 0.25 Mp
Where:
• Pdl = unfactored dead load on the column (kip) = 1,200 kips
• Δr = relative lateral offset between the point of contraflexure and the
furthest end of the plastic hinge (in.) = Δ L D / 2 (Assumed since the
inflection point is located at approximately mid-height of the column. If
the requirements are not met, a more advanced calculation of Δr will be
performed)
• Mp = idealized plastic moment capacity of reinforced concrete column
based upon expected material properties (kip-in.) = 78,560 kip-in.
12. Code Requirements
P-Δ Capacity Requirement Check
Longitudinal Direction 0.25Mp= 0.25 * 78,560 = 19,640 kip-in.
Δr = Δ L D_Long / 2 = 8.76 / 2 = 4.38 in.
PdlΔr = 1,200 * 4.38 = 5,256 kip-in. < 0.25Mp = 19,640 kip-in. => Ok
Transverse Direction Δr = Δ L D_Trans / 2 = 6.07 / 2 = 3.04 in.
PdlΔr = 1,200 kips * 3.04 = 3,648 kip-in. < 0.25Mp = 19,640 kip-in. => Ok
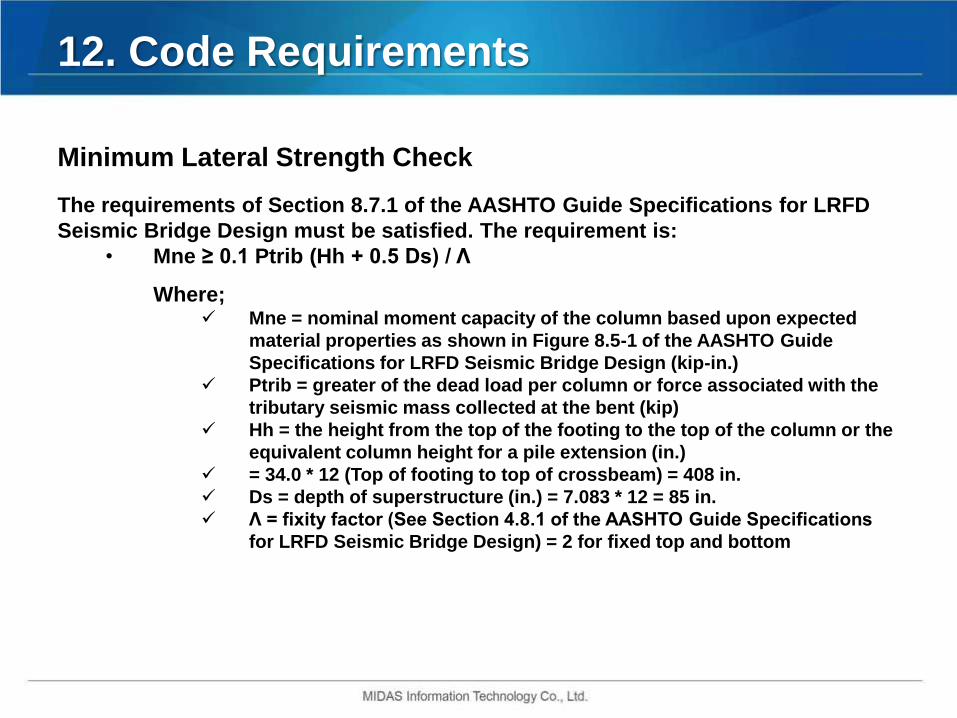
12. Code Requirements
Minimum Lateral Strength Check
The requirements of Section 8.7.1 of the AASHTO Guide Specifications for LRFD
Seismic Bridge Design must be satisfied. The requirement is:
• Mne ≥ 0.1 Ptrib (Hh + 0.5 Ds) / Λ
Where; Mne = nominal moment capacity of the column based upon expected
material properties as shown in Figure 8.5-1 of the AASHTO Guide
Specifications for LRFD Seismic Bridge Design (kip-in.)
Ptrib = greater of the dead load per column or force associated with the
tributary seismic mass collected at the bent (kip)
Hh = the height from the top of the footing to the top of the column or the
equivalent column height for a pile extension (in.)
= 34.0 * 12 (Top of footing to top of crossbeam) = 408 in.
Ds = depth of superstructure (in.) = 7.083 * 12 = 85 in.
Λ = fixity factor (See Section 4.8.1 of the AASHTO Guide Specifications
for LRFD Seismic Bridge Design) = 2 for fixed top and bottom
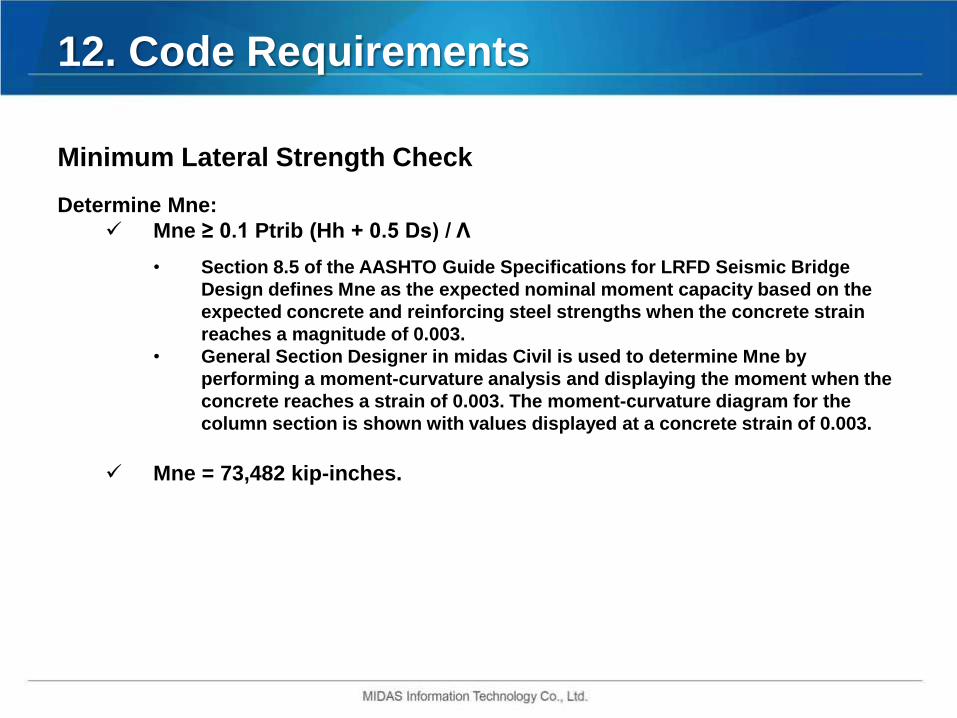
12. Code Requirements
Minimum Lateral Strength Check
Determine Mne:
Mne ≥ 0.1 Ptrib (Hh + 0.5 Ds) / Λ
• Section 8.5 of the AASHTO Guide Specifications for LRFD Seismic Bridge
Design defines Mne as the expected nominal moment capacity based on the
expected concrete and reinforcing steel strengths when the concrete strain
reaches a magnitude of 0.003.
• General Section Designer in midas Civil is used to determine Mne by
performing a moment-curvature analysis and displaying the moment when the
concrete reaches a strain of 0.003. The moment-curvature diagram for the
column section is shown with values displayed at a concrete strain of 0.003.
Mne = 73,482 kip-inches.
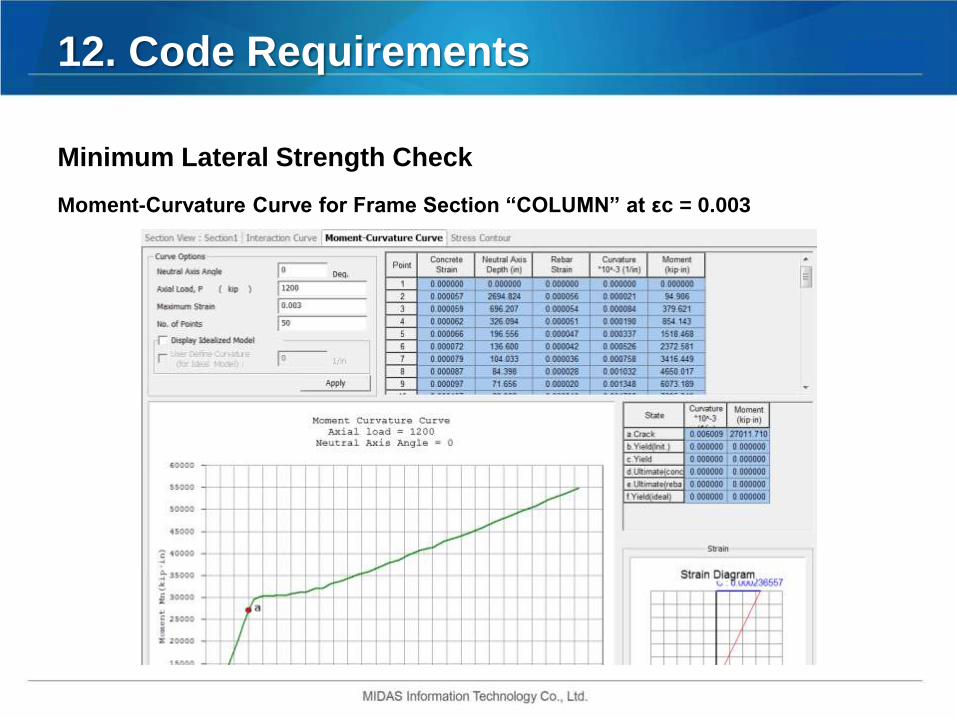
12. Code Requirements
Minimum Lateral Strength Check
Moment-Curvature Curve for Frame Section “COLUMN” at εc = 0.003
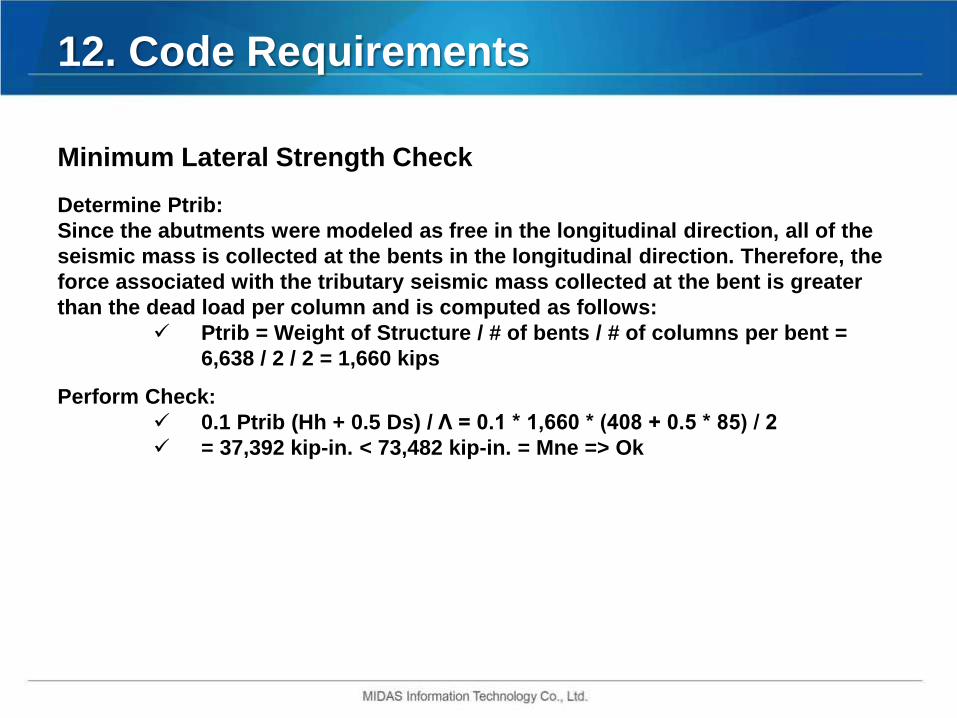
12. Code Requirements
Minimum Lateral Strength Check
Determine Ptrib:
Since the abutments were modeled as free in the longitudinal direction, all of the
seismic mass is collected at the bents in the longitudinal direction. Therefore, the
force associated with the tributary seismic mass collected at the bent is greater
than the dead load per column and is computed as follows:
Ptrib = Weight of Structure / # of bents / # of columns per bent =
6,638 / 2 / 2 = 1,660 kips
Perform Check:
0.1 Ptrib (Hh + 0.5 Ds) / Λ = 0.1 * 1,660 * (408 + 0.5 * 85) / 2
= 37,392 kip-in. < 73,482 kip-in. = Mne => Ok

12. Code Requirements
Balanced Stiffness and Frame Geometry Requirement Check
The balanced stiffness and balanced frame geometry requirements of Sections
4.1.2 and 4.1.3 of the AASHTO Guide Specifications for LRFD Seismic Bridge
Design must be met.
Other Required Checks
• Structure Displacement Demand/Capacity Check
• Member Ductility Requirement Check
• Column Shear Demand/Capacity Check

13. Acknowledgements
• MIDAS Software
• AASHTO

Special Elite Engineers Webinar Sequence An Insider’s Perspective
For any additional inquiries and interest in trying out midas Civil please contact us:
MIDASoft
Thank you!