Special edition paper - jreast.co.jp · Special edition paper 3.5.2 Escalator Frame Analysis Model...
6
21 JR EAST Technical Review-No.14 S pecial edition paper S pecial edition paper Aseismatic reinforcement projects are proceeding at many places in the JR East jurisdiction. Up to now, we have adopted the method by which we increase bearing force by adding braces, as shown in Fig. 1 (a). In this method, however, there are major restrictions because the work is done on buildings in use. Some works also involve compensation for business in commercial areas where construction takes place. Furthermore, placing wall-type aseismatic mechanisms is undesirable in terms of construction planning as that narrows usable space range. There is thus demand for a reinforcement method to solve those problems by effectively improving aseismatic performance while minimizing obstruction to existing buildings. Reinforcement work is often carried out in parallel with improvement work for barrier-free access involving installing escalators or elevators. As we usually do not regard escalators or elevators as construction members, we had not considered having them bear horizontal force. But, if we can regard those, escalators in particular, as components of aseismatic mechanisms, we can effectively improve aseismatic performance while keeping obstruction to existing buildings at a minimum. We thus have decided to undertake development of new aseismatic structure using escalators. In this article, we call escalators that resist horizontal force “aseismatic escalators”. We have designed the structure of such aseismatic escalators to be able to reduce the number of reinforcement members such as braces by making them bear part of horizontal force at earthquakes in the longitudinal direction, as shown in Fig. 1 (b). The premise is that steps, motors and other mechanical parts of such escalators are not damaged, even when bearing horizontal seismic load. 2.1 Specifications of Aseismatic Escalators Taking into account the premise that mechanical parts of aseismatic escalators such as steps and motors will not be damaged, we Development of New Aseismatic Structure Using Escalators Aseismatic reinforcement work is often carried out in parallel with improvement work for barrier-free access. Generally, braces have been installed in conventional aseismatic reinforcement. Based on the idea that substituting escalators installed in improvement work for addition of new braces can minimize obstruction to existing buildings, we have decided to undertake development of a new aseismatic mechanism using escalators. In this study, we confirmed behavior by analysis of escalator truss frames and behavior and performance of escalators using a full size aseismatic escalator. The confirmation results have proved that the developed aseismatic escalator has sufficient performance as an aseismatic member for structures such as over-track station buildings. Introduction 1 determined spec targets of the developed aseismatic escalators. Those are that the structure components of the escalator truss show stress within the elasticity range when the maximum horizontal force is applied to them. At the same time, we decided to drive piles under the escalator pit for horizontal resistance. And no damage is done to mechanical parts of the escalator even when bearing horizontal force at earthquakes. Based on understanding of performance of a standard escalator frame without reinforcement by three-dimensional FEM analysis, we developed a reinforcement method to make that frame a sufficient aseismatic member. 2.2 Reinforcement Method for Standard Escalator Frames We calculated the shear force that an aseismatic escalator bears from the total of horizontal resistance of piles and pit frame, and we assumed the maximum seismic horizontal force that affects the aseismatic escalator to be 682.5 kN. In the analysis by applying that load to a standard escalator frame, we gained the stress contour figure shown in Fig. 2. The figure shows that larger stress than yield stress ● Keywords: Over-track station building, Aseismatic escalator, Aseismatic reinforcement, Three-dimensional FEM analysis, Full size model experiment * Frontier Service Development Laboratory, Research and Development Center of JR East Group ** Tokyo Construction Office (Previously at Frontier Service Development Laboratory) Specifications of Aseismatic Escalators and Three-Dimensional FEM Analysis 2 Toru Masuda* Hajime Yoshida** Atsushi Hayashi* Kazunori Sasaki* (a) Conventional method (b) Developed Method General floors Bearing seismic force Bearing seismic force Reinforcement by braces Use of escalator truss as brace ESC ESC Pit Pile Pit Pile Track floor Fig. 1 Images of Conventional Method and Newly Developed Method
-
Upload
nguyenminh -
Category
Documents
-
view
215 -
download
0
Transcript of Special edition paper - jreast.co.jp · Special edition paper 3.5.2 Escalator Frame Analysis Model...
21JR EAST Technical Review-No.14
Special edition paperSpecial edition paper
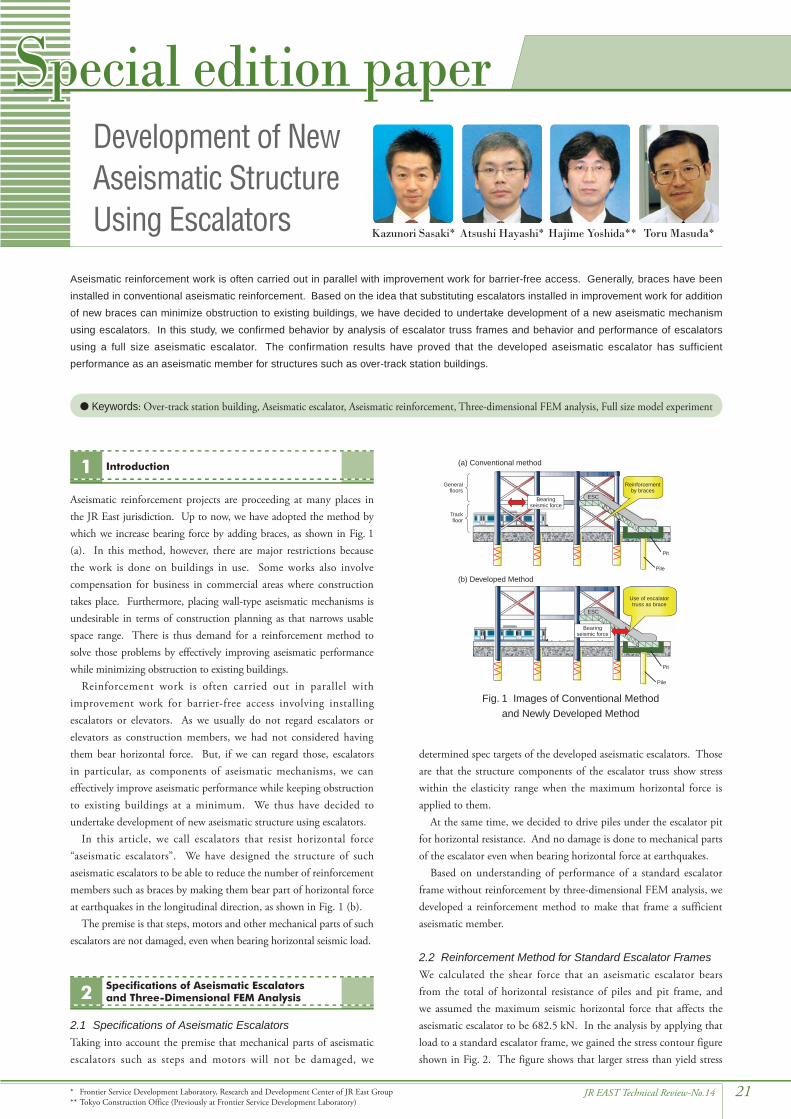
Aseismatic reinforcement projects are proceeding at many places in the JR East jurisdiction. Up to now, we have adopted the method by which we increase bearing force by adding braces, as shown in Fig. 1 (a). In this method, however, there are major restrictions because the work is done on buildings in use. Some works also involve compensation for business in commercial areas where construction takes place. Furthermore, placing wall-type aseismatic mechanisms is undesirable in terms of construction planning as that narrows usable space range. There is thus demand for a reinforcement method to solve those problems by effectively improving aseismatic performance while minimizing obstruction to existing buildings.
Reinforcement work is often carried out in parallel with improvement work for barrier-free access involving installing escalators or elevators. As we usually do not regard escalators or elevators as construction members, we had not considered having them bear horizontal force. But, if we can regard those, escalators in particular, as components of aseismatic mechanisms, we can effectively improve aseismatic performance while keeping obstruction to existing buildings at a minimum. We thus have decided to undertake development of new aseismatic structure using escalators.
In this article, we call escalators that resist horizontal force “aseismatic escalators”. We have designed the structure of such aseismatic escalators to be able to reduce the number of reinforcement members such as braces by making them bear part of horizontal force at earthquakes in the longitudinal direction, as shown in Fig. 1 (b).
The premise is that steps, motors and other mechanical parts of such escalators are not damaged, even when bearing horizontal seismic load.
2.1 Specifications of Aseismatic EscalatorsTaking into account the premise that mechanical parts of aseismatic escalators such as steps and motors will not be damaged, we
Development of New Aseismatic Structure Using Escalators
Aseismatic reinforcement work is often carried out in parallel with improvement work for barrier-free access. Generally, braces have been installed in conventional aseismatic reinforcement. Based on the idea that substituting escalators installed in improvement work for addition of new braces can minimize obstruction to existing buildings, we have decided to undertake development of a new aseismatic mechanism using escalators. In this study, we confirmed behavior by analysis of escalator truss frames and behavior and performance of escalators using a full size aseismatic escalator. The confirmation results have proved that the developed aseismatic escalator has sufficient performance as an aseismatic member for structures such as over-track station buildings.
Introduction1
determined spec targets of the developed aseismatic escalators. Those are that the structure components of the escalator truss show stress within the elasticity range when the maximum horizontal force is applied to them.
At the same time, we decided to drive piles under the escalator pit for horizontal resistance. And no damage is done to mechanical parts of the escalator even when bearing horizontal force at earthquakes.
Based on understanding of performance of a standard escalator frame without reinforcement by three-dimensional FEM analysis, we developed a reinforcement method to make that frame a sufficient aseismatic member.
2.2 Reinforcement Method for Standard Escalator FramesWe calculated the shear force that an aseismatic escalator bears from the total of horizontal resistance of piles and pit frame, and we assumed the maximum seismic horizontal force that affects the aseismatic escalator to be 682.5 kN. In the analysis by applying that load to a standard escalator frame, we gained the stress contour figure shown in Fig. 2. The figure shows that larger stress than yield stress
● Keywords: Over-track station building, Aseismatic escalator, Aseismatic reinforcement, Three-dimensional FEM analysis, Full size model experiment
* Frontier Service Development Laboratory, Research and Development Center of JR East Group** Tokyo Construction Office (Previously at Frontier Service Development Laboratory)
Specifications of Aseismatic Escalators and Three-Dimensional FEM Analysis2
Toru Masuda*Hajime Yoshida**Atsushi Hayashi*Kazunori Sasaki*
(a) Conventional method
(b) Developed Method
Generalfloors
Bearingseismic force
Bearingseismic force
Reinforcementby braces
Use of escalatortruss as brace
ESC
ESC
Pit
Pile
Pit
Pile
Trackfloor
Fig. 1 Images of Conventional Method and Newly Developed Method

22 JR EAST Technical Review-No.14
Special edition paper
3.1 PurposeIn the previous section, we proposed a detailed aseismatic escalator frame, and we demonstrated by methods such as three-dimensional FEM analysis that such an escalator frame could remain within the elasticity range at the assumed seismic force. However, aseismatic escalators should have basic performance as escalators, and further function as an aseismatic component. Thus, we produced a full-size aseismatic escalator, to perform final evaluation as an aseismatic escalator by analyzing loading test results.
was generated near the upper and lower bends where the escalator truss frame changes from horizontal to sloped direction, and that stress is beyond the elasticity range. That means that upper and lower bends are weak parts (circled with dashed line).
Accordingly, some countermeasures to meet target specs are necessary. We thought up two measures: (i) reinforcement of escalator frame components, and (ii) change of escalator frame support mechanism. Then, we studied details of aseismatic escalators with those measures combined.
In countermeasure (i), we reinforced weak parts ((1) to (7) in Fig. 3) to improve cross-sectional performance of each component. In countermeasure (ii), we examined the support method that involves no major change of upper and lower fit of the standard escalator pit ((9), (10) and (11) in Fig. 3).
In this development, we examined three-section escalators of story height 6 m, which are actually deployed in many stations, and added an intermediate support at 2.4 m story height.
2.3 Three-Dimensional FEM Analysis of Aseismatic Escalator Frames
In the model analyzed and given support structures as introduced in the previous section (Fig. 3), we applied 682.5 kN seismic horizontal force as equally distributed pressure at the escalator upper end support. We used it to check behavior such as stress and deformation at each point. Fig. 4 indicates the stress contour figure of that frame by three-dimensional FEM analysis.
In Fig. 4, we confirmed that the reinforcement shown in Fig. 3 successfully reduced stress of every component including upper and lower bends of a standard escalator frame (the weak parts) to less than the yield stress.
We further applied three-dimensional FEM analysis under the same analysis conditions in the case where the lower full-surface panel reinforcement shown in Fig. 3 (5) is divided into upper and lower panels. Stress and deformation figure by this analysis is shown in Fig. 5 and 6. Fig. 5 proved that stress of components is still less than the yield stress, even when the lower full-surface panel reinforcement is omitted.
Fig. 6 also shows that deflection of the aseismatic escalator δ is 3.8 mm for the maximum span of 7.2 m (interval between intermediate support and upper bend) and that the maximum displacement at the ESC upper end is 6.1 mm. Deformation is thus minimal for both.
Based on those analysis results, we have determined the escalator frame shown in Fig. 5 and 6 as the finalized design detail of the aseismatic escalator frame.
Loading Test and Simulation of Aseismatic Escalator3
Analysis conditionsHorizontal input: Equal distribution at upper support beam panel pointsSupport conditions: Bonded in X and Z directions (upper support beam) Bonded in X and Z directions (intermediate support) Fully bonded (lower support beam)
Total stress distribution
Distribution of larger stress than yield stress
Equally distributed load of 682.5 kN/65 (nodes)
Fig. 2 Stress Distribution Contour Figure of Standard Escalator Frame
(1) Upper bend reinforcement (1)
(1) Upper bend reinforcement (2)
(1) Upper bend reinforcement (4)
(2) Upper panel reinforcement
(3) Intermediate panel reinforcement
(3) Intermediate panel reinforcement
(4) Lower bend reinforcement (1)
(5) Lower panel reinforcement
* (1) - (7) New reinforcement structure
(9) (11) (12) New support structure
(8) (10) (13) Conventional structure
(12) Frame end support
(13) Lower support beam
(6) Intermediate horizontal truss
(11) Lower slope support reinforcement (1)
(11) Lower slope support reinforcement (2)
(7) Bottom horizontal truss
(7) Bottom horizontal truss(General parts) (Under upper bend)
Longitudinal/diagonal
(8) Upper support beam
(9) Frame end support
(10) Intermediate support
Supportpoint
Supportpoint
(4) Lower bend reinforcement (2)
(1) Upper bend reinforcement (3)
Fig. 3 Frame Reinforcement Structure Plan
Analysis conditionsHorizontal input: Even distribution at supports of upper frame endSupport condition: Bonded in X and Z directions (upper support beam, intermediate support, upper frame end) Fully bonded (lower slope, lower frame end, lower support beam)
No stress larger than yield stress is distributed.
682.5 kN/88.6 x 88.6 (area) x 4 (support points) surface pressure
Fig. 4 Stress Contour Figure of Aseismatic Escalator Frame by Three-Dimensional FEM Analysis
682.5 kN/88.6 x 88.6 (area) x 4 (support points) surface pressure
Fig. 5 Contour Figure of Finalized Aseismatic Escalator Frame by Three-Dimensional FEM Analysis
682.5 kN/88.6 x 88.6 (area) x 4 (support points) surface pressure
Upper bend
Intermediate support30 times deformation magnification
Fig. 6 Deformation Contour Figure of Finalized Aseismatic Escalator Frame by Three-Dimensional FEM Analysis

23JR EAST Technical Review-No.14
Special edition paper
3.5.2 Escalator Frame Analysis ModelTests clarified that displacement occurred at support beam fixing points and pit reinforcement. In order to evaluate that displacement, we created an analysis model with beam model for the base and reflected that in analysis. Fig. 10 shows that model.
3.6 Comparison of Experiment Values and Analysis ValuesFig. 11 shows comparison result of analysis results using the analysis model in the previous section and measured displacement. Fig. 11 shows values of the upper right chords (see numbers in Fig. 9) at 100 kN compression. That figure is an example of data in the Y direction, and it confirmed that measurement results and analysis results agree well. We gained similar results in Z direction too. Next, Fig. 12 shows the results of comparison between analysis results using that analysis model and measured stress. Fig. 12 shows values near the upper bend shown in Fig. 10. Fig. 12 indicates that measurement results agree well with analysis results for stress too. We show stress data near the upper bend as an example, and similar tendency is seen for the most part at other points too. Here we showed only displacement the compression side; however, similar tendency is seen on tension side too.
3.7 Dynamic Vibration Test Results and Validity Evaluation of Natural Values of the Escalator Frame
In dynamic vibration tests, we found natural frequency and damping ratio of the frame based on acceleration at different parts of escalators measured by acceleration sensors. Table 1 shows the measurement results, indicating that frequencies of the frame and that analysis results agree well with each other.
We also confirmed that no failure such as resonance and no
3.2 Experiment OverviewIn order to identify features of an aseismatic escalator alone when receiving horizontal force, we produced an aseismatic escalator of 2.65 m story height shown in Fig. 7, and then carried out static loading tests and dynamic vibration tests.
3.3 Static Loading TestIn static loading test, we fixed the lower part of the test model to the base (Fig. 7 and 8) fixed to the reaction wall and reaction floor. Then, we measured deformation and stress of the test model frame when ±100 kN load is applied in the longitudinal direction by a hydraulic vibration exciter. Displacement gauges were attached to 36 points and strain gauges to 180 points including reinforcement of upper and lower bends and upper and lower chords of the intermediate part.
3.4 Dynamic Vibration TestIn the dynamic vibration test, we shook the test model with escalator frame upper and lower supports free in longitudinal direction at around 0 to 20 Hz. Based on the acceleration generated at the escalator frame, we calculated the natural frequency etc. of the frame.
3.5 Test Result and Analysis Validity Evaluation 3.5.1 Frame Deformation at Static LoadingFig. 9 shows displacement of escalator frame nodes in Y and Z directions at 100 kN compression. As shown in the figure, the escalator frame displaces to the left overall when compression load is applied. The upper bends deform more upward and lower bends downward. In other words, the frame deforms in a manner where angles of bends become more acute.
Left rail: GlassRight rail: Stainless steel
ESC frame
Reaction wall
Pit reinforcement Base
Fig. 7 Aseismatic Escalator Test Model
ESC body
ESC frame100 kN vibration exciter
Base
Pit reinforcement
8540
2650
Reaction wall
Reaction wall
ESC body
Reactionwall Reaction floor
Reaction floor
Lower frame fixture
Fig. 8 Aseismic Escalator Loading Test Overview
100 kNcompression
(Displacement scale)1 mm
Fig. 9 Y and Z Direction Displacement Measurement Results at 100 kN Compression
Installation
Sill plateStrain gauge (stress indication in Fig. 12)
Equivalent rigid beam
Support beam and base beam welded to each other
Beam base model and pit reinforcement fastened at the center of bolts
Beam base model (H-shape steel cross section: 350 × 175 × 11)
Rigid
Rigid
Rigid
Rigid
Rigid
Rigid
ESCframe
Anchor bolt
Fig. 10 Escalator Frame Analysis Model

24 JR EAST Technical Review-No.14
Special edition paper
remarkable change of mounting dimensions of component devices occurred during operation of that aseismatic escalator.
When rigidly connecting an aseismatic escalator and a building, larger stress than estimated occurs at the highly rigid escalator truss. Thus, an aseismatic escalator must not be made to bear larger horizontal force than prescribed at the junction with a building. Furthermore, that junction should have structure that can follow relative displacement at earthquakes. In the light of those, we studied a structure for that junction and carried out elemental tests.
4.1 Required Performance of JunctionTable 2 shows the horizontal force and displacement that can be loaded on the aseismatic escalator. Acceptable displacement in the table is specified based on the analysis results of the support beam design frame.
We examined the junction structure on the building side so horizontal force and displacement at the aseismatic escalator remain within target values in earthquakes.
In escalator width direction, we chose the structure where horizontal force is not transferred and the aseismatic escalator goes back to the prescribed position after earthquake by applying sliding bearings. Since the sliding bearing part has four-degree V-shape slope structure, the escalator goes back to the home position with its own weight even after sliding and displacement in an earthquake.
In escalator longitudinal direction, deformation performance is required between the building and the aseismatic escalator. We therefore added a low yield stress steel junction panel. When larger load than predicted is applied, that junction panel plastically deforms; so, larger horizontal force than predicted is not transformed to the aseismatic escalator.
Based on that plan, we designed and produced actual junctions. Fig. 14 shows the specific plan of the junction for element tests. We produced mounting as a building and a test model for the aseismatic escalator truss to check function and performance of the bearing part by loading horizontal force in width direction on that model truss.
In longitudinal direction, we extracted the low yield stress steel junction panel for between an aseismatic escalator truss and a building. By applying vertical load, we checked whether that could prevent the aseismatic escalator from bearing larger horizontal force than expected and whether it could follow relative displacement at earthquakes.
4.2 Loading Test of Junction4.2.1 Width Direction Loading TestWe put load cells in holes of the mounting beside the test model, and loaded those on the aseismatic escalator frame to measure reaction force in the width direction of that frame. We also applied a 70 kN vertical load that is equal to the weight of the aseismatic escalator itself, assuming that it is for an over-track station building, then we also loaded 30 kN and 0 kN vertical axial force for comparison. Table 3 shows loading results.
Even when vertically applying a 70 kN load that is equal to the weight of the aseismatic escalator itself (excluding jig load), assuming it is an over-track station building, reaction force in width direction was only 12.70 kN. That means sufficient margin is present
Junction of Aseismatic Escalator and Building4
Dis
plac
emen
t (m
m)
Lower bend
Analyzed value
Measured value
Upper bendJoint
Fig. 11 Comparison of Displacement Measured and Analyzed Values at 100 kN Compression
Stre
ss (M
Pa)
Measured value (at compression)
Measured value (at tension)
Distance from upper chord upper surface (mm)
Analyzed value(at tension)
Analyzed value(at compression)
Fig. 12 Comparison of Stress Near Upper Bend
Degree
Mode chart
Measured
Analyzed
Naturalfrequency 6.5 Hz
0.058
5.8 Hz
8.5 Hz
0.053
7.3 Hz
14.8 Hz
0.105
13.7 HzNaturalfrequency
Dampingratio
Primary bendingin width direction
Secondary bendingin width direction
Primary bendingin deflection direction
Table 1 Frame Analysis Model Taking Analysis Elements into Account
Escalator width direction
Load direction
Escalator longitudinaldirection
Less than 36 kN
Acceptable horizontal force
Less than 682.5 kN
Within ± 20mm
Acceptable displacement
Within ± 10 mm
Table 2 Acceptable Horizontal Force and Displacement for Aseismatic Escalator
Axial force N(kN)
Slip load(kN)
First time
Second time
First time
Second time
First time
Second time
Average(kN)
Table 3 Width Direction Loading Results

25JR EAST Technical Review-No.14
Special edition paper
compared to the acceptable value of 36 kN in the escalator width direction shown in Table 2. We could also confirm that the escalator returned to the position before loading after removing that load in width direction thanks to four-degree V-shaped slope structure.
4.2.2 Junction Loading Test4.2.2.1 Material TestIn advance of the junction loading test, we carried out a material tensile test to check mechanical nature of the material used for that junction. Table 4 lists test results of low yield stress steel (LYP235), and Fig. 13 shows stress-strain curve of LYP235 that was calculated from that tensile test results.
For calculation of yield strain, the index of this test, we used the data of Test Sample 3 that has a high yield point instead of the average of three test samples. Furthermore, we took values of the upper yield point because lower yield point was not clear. Yield strain of Test Sample 3 was defined as 1.033 from Fig. 13.
4.2.2.2 Test Plan and Overview\We carried out a loading test by vertically placing a junction panel alone and applying load only on one side (compression side) in one direction using a vertical jack. Fig. 14 shows the actual junction plan for element test. We measured strain of the panel at the position shown in Fig. 14 (b).
4.2.2.3 Destruction (Loading)As for deformation and destruction of test samples, strain in Z direction (45 degree) at panel measurement point S13 reached yield strain. The load at that time was 222 kN, and the displacement was 3.23 mm (1δ). Then, when displacement exceeded around 25.81 mm (8δ), out-plane deformation occurred and shear deformation of the panel developed. When displacement reached 90.11 mm (28δ), cracking occurred at the welding of the lower
flange; so, we quit testing. Fig. 15 shows test loading. In this test, yield load was the load whereby one of the strain measurement points (three-axis strain gauge) on the panel surface reached 1.033μ (the load when yield was determined on the von Mises yield condition formula).
4.2.2.4 Load-Displacement RelationFig. 16 shows load-displacement relation at loading point. The yield point in Fig. 16 is defined in section 4.2.2.3. Fig. 17 shows shear strain at S1 - S13 and B1 measurement points.
Looking at displacement increase tendency in load-displacement relation at loading point in Fig. 16, we can find nonlinearity from approx. 450 kN load. At the same time, in increase tendency for load-shear strain relation in Fig. 17, shear strain becomes predominant at around 450 kN to 500 kN at each measurement point. Those mean that increase tendencies for displacement and strain correspond to each other well. We can therefore presume that destruction by shear yield development of junction panel is predominant in destruction of test samples.
Work No.:Purpose: : :Order No.:Received order No.: R87F7B022 :Test temperature: 22°C :Material: LYP235Spec No.:
Test item Mechanical natureTensile test
Wid
th×
Thic
knes
s(m
m)
Gau
gele
ngth
(mm
)
0.2%
bea
ring
forc
e (y
ield
poin
t)(N
/mm
2)
Tens
ilest
reng
th(N
/mm
2)
Stre
tch
(%)
Squ
eeze
(%)
Cut
-off
poin
tSpec
Test sampleNo.
Table 4 Tensile Test Results (LYP235)
Stre
ss (N
/mm
2 )
LYP235 Tensile Test, Stress-Strain
Strain (µ)
Fig. 13 Tensile Test, Stress-Strain (LYP235)
Vertical jack(equivalent to escalator’s own weight)
Load cell
Building beam
Escalator frame
Ultralow-carbonsteel
LYP235
Ultralow-carbonsteel
LYP235
Buildingbeam
Buildingbeam
Aseismatic escalator
Vertical jack
(a) Loading test in width direction
(b) Loading test in longitudinal direction
Sliding bearing(four-degree V-shaped slope)
Fig. 14 Junction Plan for Element Test
Fig. 15 Loading on Junction Panel

26 JR EAST Technical Review-No.14
Special edition paper
4.2.2.5 Main Strain Distribution of Junction Panel
Fig. 18 shows main strain distribution on the front of the junction panel. Fig. 18 (a) is the main strain distribution at the yield load defined in 4.2.2.3. Fig. 18 (b) is the status when the interval of the aseismatic escalator and the building beam reached 70 mm (equal to
displacement where story drift is 1/100 at 7 m story height), and Fig. 18 (c) the main strain distribution at the final deformation.
In Fig. 18 (a), we can see that panel shear stress is predominant, and in Fig. 18 (b) and (c), we find that such tendency becomes more remarkable as load increases. Furthermore, since Fig. 18 (b) and (c) show that main strain plasticity in shear direction develops, we can confirm that ultralow-carbon steel panel absorbs energy (horizontal force).
4.3 Summary of Junction Loading TestThe loading test in the width direction using model aseismatic escalator frame and simple loading test using test samples with low yield stress steel (LYP235) panel have given us the following information.(1) We confirmed that an aseismatic escalator can have sufficient
recovery performance by adding a sliding bearing part to the junction between the escalator and building and making the ESC have a four-degree V-shaped slope structure.
(2) We confirmed that using low yield stress steel panel attached to the junction between the aseismatic escalator and building could control load when larger horizontal force than that prescribed occurs.
(3) The load-displacement and load-strain relation suggests that fracture morphology by junction panel shear yield development is predominant in fracture morphology of test samples.
We have proposed a specification for aseismatic escalators that can withstand 682.5 kN maximum horizontal force. By using the escalator frame as an aseismatic member, we can omit braces and effectively improve aseismatic performance. That can also be applied to new structures.
In the future, we are going to obtain general structural appraisal to fully apply and follow up on the results of this research in seismic reinforcement and barrier-free accessibility projects.
* This study has been carried out as joint research and development with Hitachi, Ltd.
Conclusion5
Reference:1) “Act for Promotion of the Earthquake Proof Retrofit of Buildings”,
as revised on November 7, 2005, Law No. 120 of 20052) “Guidelines for Over-track Building Aseismatic Diagnosis and
Renovation”, Railway Technology Research Institute, May 19983) “Explanation of Escalator and Elevator Technical Standards
(2002)”, Building Guidance Division, Housing Bureau, Ministry of Land, Infrastructure, Transport and Tourism; Edited by Japan Building Equipment and Elevator Center Foundation and Japan Elevator Association
Load
(kN
)
Load-Displacement Relation Figure at Loading Point
Displacement at loading pointYield point
Displacement (mm)
Fig. 16 Load-Displacement Relation at Loading Point
Load
(kN
)Lo
ad (k
N)
Load-shear strain relation
Load-shear strain relation
Shear strain (µ)
Shear strain (µ)
Fig. 17 Load-Shear Strain Relation
(Front)
(a) At yield load
(c) At final deformation
(b) At 70 mmdisplacement
(Rear)
No plotting of main strain on the panel rear surface at (b) and (c) because gauges broke while loading.
Fig. 18 Main Strain Distribution of Junction Panel