Special Edition ISSN 1811-5438 THE LAHORE …s3.amazonaws.com/zanran_storage/ Edition ISSN 1811-5438...
235
Special Edition ISSN 1811-5438 THE LAHORE JOURNAL OF ECONOMICS Lahore School of Economics Papers presented at The Fourth Annual Conference on Management of the Pakistan Economy Ensuring Stable and Inclusive Growth 24 th to 25 th April, 2008 Lahore School of Economics, Lahore, Pakistan. Editors’ Introduction Shahid Amjad Chaudhry Ensuring Stable and Inclusive Growth in Pakistan Sakib Sherani Pakistan’s Macroeconomic Situation Shahid Javed Burki Industrial Policy: Domestic Challenges, Global Imperatives, and Pakistan’s Choices Hafeez Sheikh Unfinished Agenda of Reforms Naved Hamid Rethinking Pakistan’s Development Strategy Riaz Riazuddin An Exploratory Analysis of Inflation Episodes in Pakistan Ijaz Nabi Public Policy Fundamentals for Sustainable and Inclusive Growth Theresa Thompson Chaudhry and Azam Amjad Chaudhry The Effects of Rising Food and Fuel Costs on Poverty in Pakistan Rashid Amjad, G. M. Arif and Usman Mustafa Does the Labor Market Structure Explain Differences in Poverty in Rural Punjab? Ali Cheema, Lyyla Khalid and Manasa Patnam The Geography of Poverty: Evidence from the Punjab Sohail Jehangir Malik Rethinking Development Strategy – The Importance of the Rural Non Farm Economy in Growth and Poverty Reduction in Pakistan Sajjad Akhtar Trends in Regional Inequalities in Pakistan: Evidence Since 1998 September, 2008
Transcript of Special Edition ISSN 1811-5438 THE LAHORE …s3.amazonaws.com/zanran_storage/ Edition ISSN 1811-5438...
Special Edition ISSN 1811-5438
THE LAHORE JOURNAL OF
ECONOMICS Lahore School of Economics
Papers presented at The Fourth Annual Conference on
Management of the Pakistan Economy
Ensuring Stable and Inclusive Growth
24th to 25th April, 2008 Lahore School of Economics, Lahore, Pakistan.
Editors’ Introduction
Shahid Amjad Chaudhry Ensuring Stable and Inclusive Growth in Pakistan
Sakib Sherani Pakistan’s Macroeconomic Situation
Shahid Javed Burki Industrial Policy: Domestic Challenges, Global Imperatives, and Pakistan’s Choices
Hafeez Sheikh Unfinished Agenda of Reforms
Naved Hamid Rethinking Pakistan’s Development Strategy
Riaz Riazuddin An Exploratory Analysis of Inflation Episodes in Pakistan
Ijaz Nabi Public Policy Fundamentals for Sustainable and Inclusive Growth
Theresa Thompson Chaudhry and Azam Amjad Chaudhry The Effects of Rising Food and Fuel Costs on Poverty in Pakistan
Rashid Amjad, G. M. Arif and Usman Mustafa Does the Labor Market Structure Explain Differences in Poverty in Rural Punjab?
Ali Cheema, Lyyla Khalid and Manasa Patnam The Geography of Poverty: Evidence from the Punjab
Sohail Jehangir Malik Rethinking Development Strategy – The Importance of the Rural Non Farm Economy in Growth and Poverty Reduction in Pakistan
Sajjad Akhtar Trends in Regional Inequalities in Pakistan: Evidence Since 1998
September, 2008


THE LAHORE JOURNAL
OF ECONOMICS
Editors
Dr. Azam Chaudhry, Editor Dr. Theresa Thompson Chaudhry, Editor Ms. Nina Gera, Associate Editor Ms. Ayesha Khanum, Assistant Editor
Editorial Advisory Board
Dr. A. Mushfiq Mobarak Dr. Ahmed Kaleem Dr. Ahmed Kamaly Dr. Ahmed M. Khalid Dr. Ajaz Hussain Dr. Akmal Husain Dr. Anwar Shah Dr. Ashish Narain Dr. Aslam Chaudhry Dr. Baoyun Qiao Dr. Gwendolyn A. Tedeschi Dr. Inayat Ullah Mangla Dr. Irfan ul Haque Dr. Jamshed Y. Uppal Dr. Jan Warner
Dr. Javier Arze del Granado Dr. Kaiser Bengali Dr. Kamal Munir Dr. Khalid Aftab Dr. Khalid Nadvi Dr. Lennart Erickson Dr. Mathew Andrews Dr. Michal Jerzmanowski Dr. Moazam Mehmood Dr. Munir Ahmad Dr. Nasim Hasan Shah Dr. Naved Hamid Dr. Nuzhat Ahmad Dr. Pervez Tahir Dr. Phillip Garner
Dr. Rashid Amjad Dr. Saleem Khan Dr. Salman Ahmad Dr. Sarfraz Qureshi Dr. Sarwat Jahan Dr. Sean Corcoran Dr. Sebastian Eckardt Dr. Serkan Bahceci Dr. Shahid Amjad Chaudhry Dr. Shahrukh Rafi Khan Dr. Sohail Zafar Dr. Tariq Siddiqui Dr. Umar Serajuddin Prof. Robert Neild Prof. Viqar Ahmed
Editorial Staff: Tele. No: 0092 – 42 - 5874385
Telefax: 0092 - 42 - 5714936 E-mail: [email protected]
Publisher: Lahore School of Economics, Lahore, Pakistan. Correspondence relating to subscriptions and changes of address should be sent to The Lahore Journal of Economics, 105-C-2, Gulberg III, Lahore - 54660 - Pakistan
Instructions to authors can be found at the end of this issue. No responsibility for the views expressed by authors and reviewers in The Lahore Journal of Economics is assumed by the Editors, the Associate Editor and the Publisher.
Copyright by: Lahore School of Economics
Special Edition2008

THE LAHORE JOURNAL OF ECONOMICS
Contents Special Edition 2008 Editors’ Introduction i Ensuring Stable and Inclusive Growth in Pakistan Shahid Amjad Chaudhry 1
Pakistan’s Macroeconomic Situation Sakib Sherani 5
Industrial Policy: Domestic Challenges, Global Imperatives, and Pakistan’s Choices Shahid Javed Burki 23
Unfinished Agenda of Reforms Hafeez Sheikh 35
Rethinking Pakistan’s Development Strategy Naved Hamid 47
An Exploratory Analysis of Inflation Episodes in Pakistan Riaz Riazuddin 63
Public Policy Fundamentals for Sustainable and Inclusive Growth Ijaz Nabi 95
The Effects of Rising Food and Fuel Costs on Poverty in Pakistan Theresa Thompson Chaudhry and Azam Amjad Chaudhry 117
Does the Labor Market Structure Explain Differences in Poverty in Rural Punjab? Rashid Amjad, G.M Arif and Usman Mustafa 139 The Geography of Poverty: Evidence from the Punjab
Ali Cheema, Lyyla Khalid and Manasa Patnam 163
Rethinking Development Strategy –The Importance of the Rural Non Farm Economy in Growth and Poverty Reduction in Pakistan Sohail Jehangir Malik 189 Trends in Regional Inequalities in Pakistan: Evidence Since 1998 Sajjad Akhtar 205

i
Editors’ Introduction
In April 2008, the Centre for Research in Economics and Business (CREB) at the Lahore School of Economics hosted the Fourth Annual Conference on the Management of the Pakistan Economy on the theme, “Ensuring Stable and Inclusive Growth.” The Centre’s director, Naved Hamid, invited a number of prominent speakers including academics, economists, current and former government officials, and other experts to present a combination of research and policy papers, which can be broadly grouped under two major headings: i) Pakistan’s macroeconomy and ii) Poverty and inequality in Pakistan. These topics were selected because of their timeliness, given the increasing macroeconomic pressures facing the country, in particular those coming from the exchange rate and inflation, and the impacts on poverty that could result. The papers presented at the conference are summarized below:
i) Pakistan’s Macroeconomy
Shahid Amjad Chaudhry’s piece opens the Special Edition with a brief review of the macroeconomy over the last few years, and lays out the major sectoral issues that remain to be tackled, including education, healthcare, energy, poverty, and public investment.
Next, Sakib Sherani’s paper appeals to the new government to restore fiscal order, because without macroeconomic stability, the government will be limited in its ability to carry out appropriate monetary and fiscal policy. While Mr. Sherani cautions against the type of short term “relief” policies that can damage the macroeconomy further, he argues that macro stability and pro-poor policies can go hand-in-hand, via a broadening of the tax base and rationalization of public expenditures.
Shahid Javed Burki’s paper offers policy advice, with an emphasis on industrial competitiveness, basing his assessment of the history of industrial policy, and keeping in mind the challenges faced by the country due to the current macroeconomic situation and the globalized economy. He emphasizes the importance of decentralized industrial policy making for the future success of Pakistani industry.
Hafeez Sheikh’s paper critically examines economic policies of the last government, and their impacts on economic growth over the past decades. The analysis emphasizes the advantages of privatization and inefficiency caused by unchecked state dominance across all sectors in Pakistan. This paper gives proposals aimed at achieving economic prosperity and growth.
ii
Naved Hamid’s paper provides a brief outline of a development strategy for Pakistan that can achieve sustained growth. Based on the current economic conditions the paper analyzes the new drivers of growth and discusses how development strategy today must position itself to take advantage of the changes taking place globally.
Riaz Riazuddin’s paper uses a unique method to look at money supply, inflation, and growth. By calculating conditional probabilities, he finds that, first, inflation is a monetary phenomenon, and secondly, there is no trade-off between inflation and growth.
Finally, Ijaz Nabi’s paper emphasizes the role of the government budget in economic growth, and the particular mechanisms that should be implemented in order to make the budget more effective. These include monitoring and evaluation, public information, public-private partnerships, and a streamlined budget cycle.
ii) Poverty and Inequality in Pakistan
Theresa Thompson Chaudhry and Azam Amjad Chaudhry’s paper use the PSLM (Pakistan-wide) and MICS (Punjab provincial) data sets to simulate the impact of food and energy price shocks on real incomes, in order to asses the possible impact on poverty levels in Pakistan. They find that food prices have the greatest potential to increase poverty levels, given their importance in household budgets.
Rashid Amjad, G. M. Arif and Usman Mustafa’s paper closely examine poverty in rural Punjab, using a new data set. Their analysis divides the rural areas into various agro-climactic zones in order to determine the major factors driving poverty in each area. They find the critical factors in poverty inequality to be urbanization, overseas migration and the labor market structure.
Ali Cheema, Lyyla Khalid and Manasa Patnam’s paper use the MICS to study the geography of poverty at the district level in the Punjab. They find a wide variation in the incidence of poverty across the province, with high levels of poverty in the south, the west, and some central districts. The north has, on average, lower poverty; however the peri-urban areas of Lahore are characterized by both a high level and severity of poverty.
Sohail Jehangir Malik’s paper returns to the problem of rural poverty and looks at the oft-neglected non-farm sector. In fact, workers in non-agricultural sectors make up over half of the rural poor. Following a detailed description of rural enterprises, he suggests that better access to credit and institutional reform (particularly legal and judicial) could help to develop the rural non-farm economy.
iii
To conclude, Sajjad Akhtar’s paper reassesses regional inequality in Pakistan, and looks at trends in various measures of inequality, both across provinces and across time. He does this not only for consumption, but for a variety of important social indictors, including primary enrollment, literacy, immunization coverage, and sanitation, among others.
This Special Edition of the Lahore Journal of Economics has been compiled from the papers presented at the Fourth Annual Conference on Management of the Pakistan Economy. The Special Edition is meant to disseminate the findings of this conference more widely throughout Pakistan, and to the wider international audience.

The Lahore Journal of Economics Special Edition (September 2008): pp. 1-4
Ensuring Stable and Inclusive Growth in Pakistan
Shahid Amjad Chaudhry*
Abstract
The article provides an overview of the Pakistani economy and addresses various sectoral issues currently being faced by the economy. The first and the most critical problem highlighted concerns the protection of the poor. Other issues highlighted relate to education, healthcare, housing, taxation and energy. This paper discusses how the current account deficit needs to be tackled by higher tariffs, exchange rate adjustments, and possible export duties. The paper also discusses the need to reduce the cost of production for industry and upgrade governance through an emphasis on the local government system. Regarding public sector investments, the paper explains how the government needs to be transparent about the Public Sector Development Programme, and allow projects to be executed by the provinces.
JEL Classification: I32, D33
Keywords: Pakistan, Balance of Payments, Fiscal Deficit, Education, Health, Poverty, Public Investment.
Pakistan is a 150 billion dollar economy, a significant figure among developing countries. However, the boom the country has experienced over the last 6 to 7 years is mainly attributable to a historical accident, in particular a consumption boom occurred that was financed by cash inflows of about 6 to 8 billion dollars per year from various sources: approximately one billion dollars from American bilateral assistance, 2 to 3 billion dollars from multilateral institutions, and 2 to 3 billion dollars from privatization receipts. In addition to the direct cash inflows, a highly overvalued exchange rate contributed to over-consumption by making imports seem inexpensive. Now that these inflows are no longer coming, Pakistan does not have the same level of foreign exchange resources, and the spending boom has ended.
* Rector, Lahore School of Economics, and Former Deputy Chairman, Planning Commission, Government of Pakistan.
Shahid Amjad Chaudhry
2
The immediate consequences of first, the glut, and now scarcity of foreign exchange can be measured by the twin deficits, i.e. the fiscal deficit and the balance of payments or current account deficit. The fiscal deficit, previously at 4-5% of GDP (US$ 6-7 billion) is now running at 7-8% of GDP. On the balance of payments side, the trade deficit and the current account deficit, which normally runs at about 5-6% of GDP (US$5-6 billion), is now running at US$10 billion. The adverse consequences of the foreign exchange reversal has been exacerbated by two other significant events: First, a hike in international oil prices that has doubled Pakistan’s import bill on oil alone to about 12 billion a year, and second, the increase in international commodity prices, which while it should be a blessing in disguise can be harmful to the poor, especially the urban poor, due to the effect of rising food prices on the many households near the poverty line.
Looking at sectoral issues, the first and most pressing problem is protecting the poor, who comprise some 50-70% of the population, through income supplements. Suggestions have included: using the minimum wage, direct cash grants to the poor, grants of Rs. 600 to each child a month that attends classes, or to give old age pensions of Rs. 1000 per family. This last method, I believe is the most promising, since most families have elderly members and the elderly are among those most vulnerable to malnutrition. The second part of a plan to protect the poor is to effectively implement an employment generation scheme, as announced by the prime minister. According to some calculations, this will cost between Rs. 100-250 billion.
The second major issue is education. It has become clear that the private sector is providing a much better quality education at the primary level. The public education sector, therefore, needs a transferable voucher program. What is also needed is an aggressive school ‘feeding’ program which will again cost approximately Rs. 20-30 billion a year. I also support ending the dual system of education; this does not mean taking everybody down to a lower level, but rather bringing everyone to a higher level which can be achieved through a voucher scheme or doubling of resources to education.
The third issue is healthcare. It is a little known fact that one of the leading causes of families falling into poverty is health problems - even for wealthy families. One simple suggestion is to have compulsory coverage for hospitalization for all citizens. While I do not suggest that this policy be implemented overnight, over the next 5 to 20 years Pakistan can move towards hospitalization coverage to cover the most serious illnesses for the bulk of the people.
Ensuring Stable and Inclusive Growth in Pakistan
3
The fourth issue is housing. Presently, Pakistan does not have a housing policy for public servants or private individuals. The suggestion that I have is that instead of giving public servants a house rent allowance, the government should give them an allowance to finance housing loans. For the poorest public servants, the government should award non-alienable plots, so that the plots can be inherited but not sold.
The fifth issue is taxation. While tax increases are not popular among any group, the government might first consider taxing those who have benefited the most from the recent boom economy. Given that energy prices have doubled and huge windfall gains have accrued to the oil and gas companies, Rs. 25-50 billion in revenue could be generated by taxing them. In addition, the independent power producers (IPPs) were given a 30 year income tax exemption (at a cost of 3-4% of GDP), thus making a case for taxing them. Thirdly, a case can be made for taxing agriculture, as prices have risen so quickly. Other potential tax bases include real estate and the stock exchange (which had Rs. 600 billion worth of transactions last year).
The next issue is that of energy. Pakistan could potentially fulfill 5-10% of its energy needs through bio-fuels, but there is a strong lobby by the oil companies against implementing a bio-fuel policy. In tandem, Pakistan also needs to use renewable energy. Also, any discussion of energy policy in this country must also include the IPI pipeline. Though the promise of the pipeline is generating much discussion, Pakistan should not have to pay the prices presently being offered by Iran and Turkmenistan. And if there is an agreement on the IPI pipeline, a tax should be charged on the value of the gas transported (closer to international pipeline rates) and not at some minimal rate (which I fear) so that the country actually receives some revenue benefit from the pipeline.
The next question is how Pakistan can deal with its current account deficit. While most proposals have focused on exchange rate adjustments, I believe that adjustments to the tariff schedule are also merited. This is because Pakistan has not only opened up its capital account, but also has liberalized the trade regime significantly by reducing tariff rates considerably and signing free trade agreements (FTAs) with China and Malaysia. Though this may be the correct long run strategy, I believe the country needs to increase tariffs, in addition to exchange rate adjustments, and export duties (on for instance cement, cotton, etc.) may also be warranted.
We also need to reduce the cost of production for industry. The main contributors to higher costs are energy and high financial costs of borrowing for investment. While borrowers struggle with interest rates on
Shahid Amjad Chaudhry
4
loans, depositors often receive a negative real interest rate on savings, so that 99% of depositors are essentially receiving no return on their deposits. At the same time, the bankers are compensating themselves handsomely; the average salary of a banker went up by 50% with 4-5 crores as bonuses last year, and 7% of all advances from the banking system are to the banking employees themselves, at a 0-1% interest rate. In its attempts to create a viable commercial banking sector, the NSC, the only institution that gave a decent rate of return in the public sector, was sacrificed.
Also, Pakistan needs to upgrade governance. The government must pay its public servants market wages, modernize processes, and most importantly of all must begin to outsource. I am personally very supportive of the local government system, with the DCO under the local government. What is also needed is to take the police out from under the control of the nazims and put it firmly under the DC, and to have a district magistracy system.
Finally, it is crucial to discuss and pose questions regarding public sector investment. First, the government needs to be transparent about what is the PSDP. Where should the money go? First 50% of the PSDP (without the provincial shares) should go to the least developed provinces (FATA, Balochistan, the interior of Sindh and southern Punjab) and the government needs to allow the projects to be executed by the provinces. Third, given that electricity falls in the concurrent list of responsibilities, power generation may be passed to the provinces (especially the least developed ones) by giving them the local electricity companies. This way, scarcity in the energy sector, i.e. in power generation and energy exploration, can be handled by them (through private-public partnerships or other arrangements) with the help of federal grants.

The Lahore Journal of Economics Special Edition (September 2008): pp. 5-21
Pakistan’s Macroeconomic Situation
Sakib Sherani∗
Abstract
As a result of policy inaction in addressing structural issues over a protracted period and a wrong set of economic priorities followed over the past several years, Pakistan’s economy faces a grave set of challenges. Among the many issues, which range from high inflation to power deficits and water stress, the most immediate and pressing is the need to restore fiscal order. While pressure on the coalition government to reduce the economic hardship of the electorate is understandably intense, the policy response needs to balance the alleviation of palpable hardship in the short term, with the ability to provide sustained benefits over the longer term. Given the sharp constriction in available fiscal space, adopting a policy course in the short run that raises expectations of “relief” may not be wise, in either political or economic terms. In the longer term, however, it is a misconception to view the available choices in purely binary terms, i.e. that “macroeconomic stability” (a much-maligned term, loath to politicians not just in Pakistan) is mutually exclusive to “pro-poor” agendas. Raising revenues by broadening the tax base meaningfully, in conjunction with rationalizing bloated government/public sector expenditures can free fiscal resources, which can be diverted to targeted subsidy programs. Ignoring macroeconomic stability, on the other hand, will eventually also undermine the ability of the government to influence economic growth, as growing fiscal and monetary constraints limit its ability to run appropriate policies. As experienced in the 1990s, this will slowdown both investment as well as growth, hurting the poor.
JEL Classification: E52, E62
Keywords: Pakistan, Macroeconomic Stability, Fiscal Policy, Monetary Policy
∗ Chief Economist, Royal Bank of Scotland, Pakistan.
Sakib Sherani
6
Overview
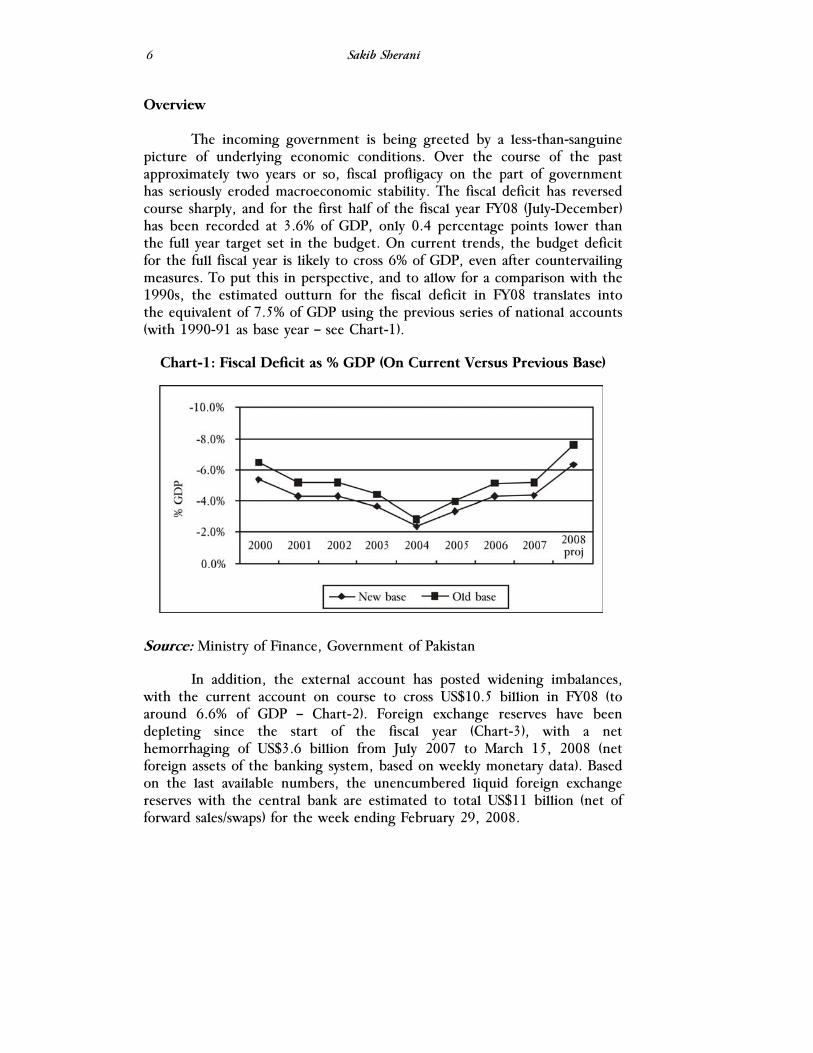
The incoming government is being greeted by a less-than-sanguine picture of underlying economic conditions. Over the course of the past approximately two years or so, fiscal profligacy on the part of government has seriously eroded macroeconomic stability. The fiscal deficit has reversed course sharply, and for the first half of the fiscal year FY08 (July-December) has been recorded at 3.6% of GDP, only 0.4 percentage points lower than the full year target set in the budget. On current trends, the budget deficit for the full fiscal year is likely to cross 6% of GDP, even after countervailing measures. To put this in perspective, and to allow for a comparison with the 1990s, the estimated outturn for the fiscal deficit in FY08 translates into the equivalent of 7.5% of GDP using the previous series of national accounts (with 1990-91 as base year – see Chart-1).
Chart-1: Fiscal Deficit as % GDP (On Current Versus Previous Base)
Source: Ministry of Finance, Government of Pakistan
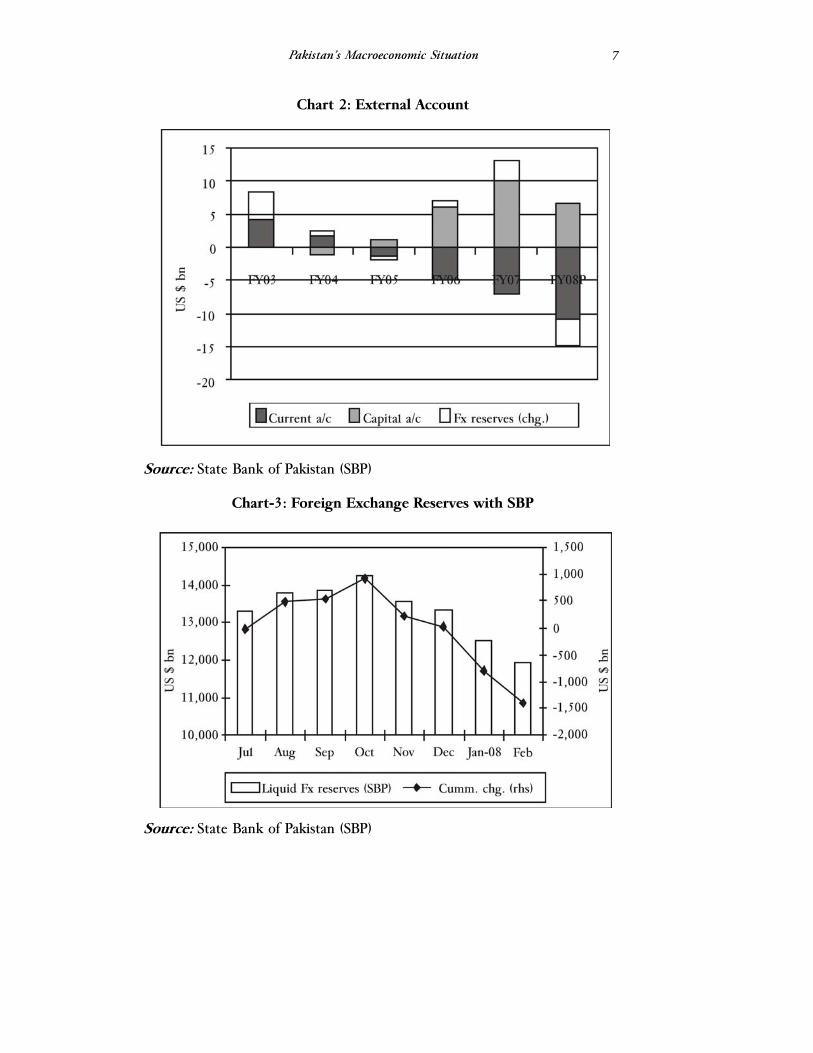
In addition, the external account has posted widening imbalances, with the current account on course to cross US$10.5 billion in FY08 (to around 6.6% of GDP – Chart-2). Foreign exchange reserves have been depleting since the start of the fiscal year (Chart-3), with a net hemorrhaging of US$3.6 billion from July 2007 to March 15, 2008 (net foreign assets of the banking system, based on weekly monetary data). Based on the last available numbers, the unencumbered liquid foreign exchange reserves with the central bank are estimated to total US$11 billion (net of forward sales/swaps) for the week ending February 29, 2008.
Pakistan’s Macroeconomic Situation
7
Chart 2: External Account
Source: State Bank of Pakistan (SBP)
Chart-3: Foreign Exchange Reserves with SBP
Source: State Bank of Pakistan (SBP)
Sakib Sherani
8
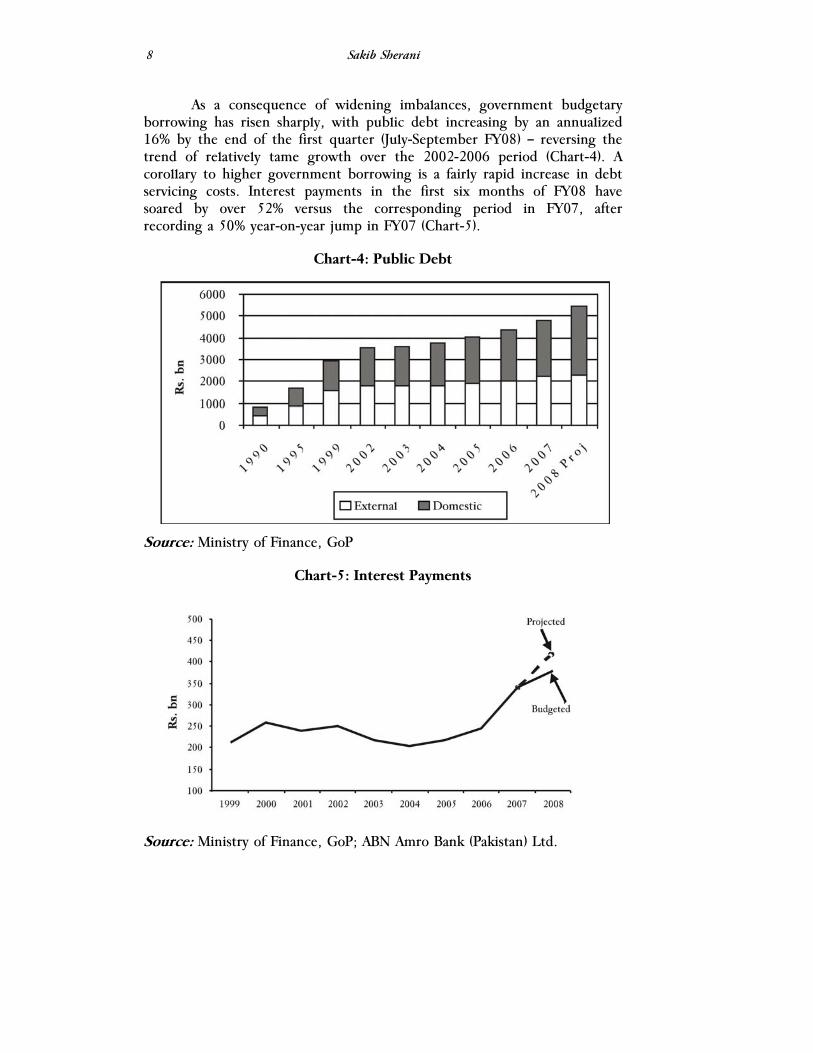
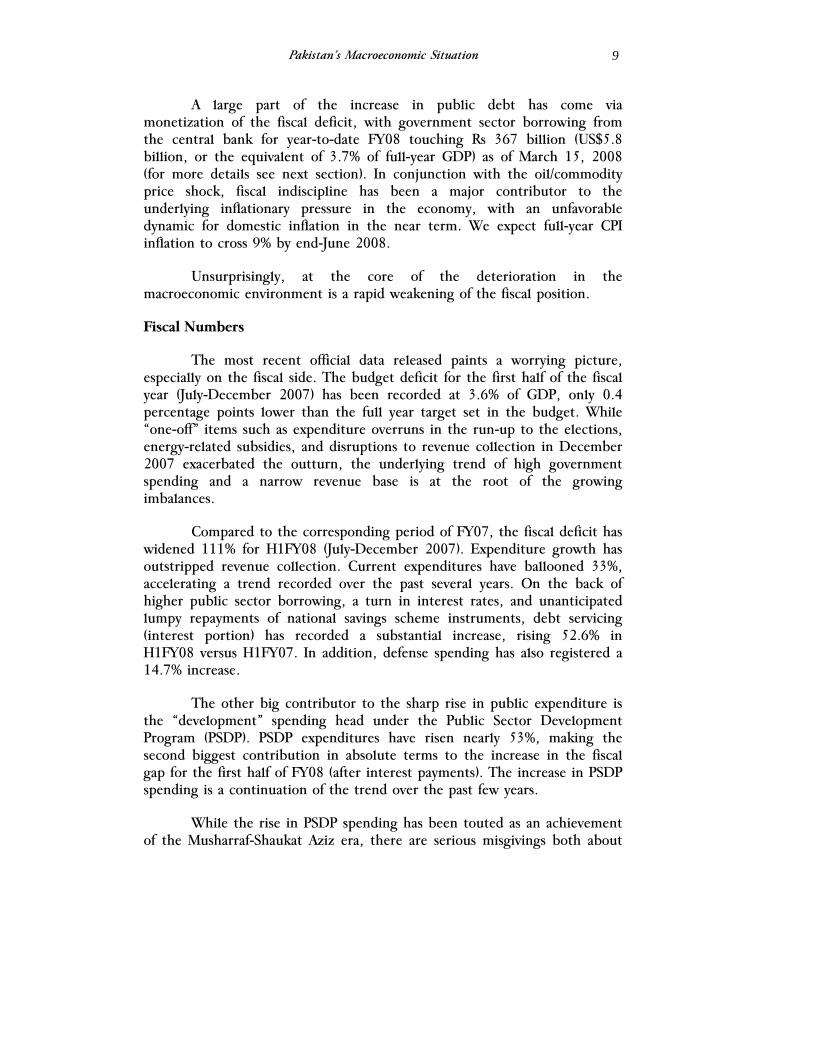
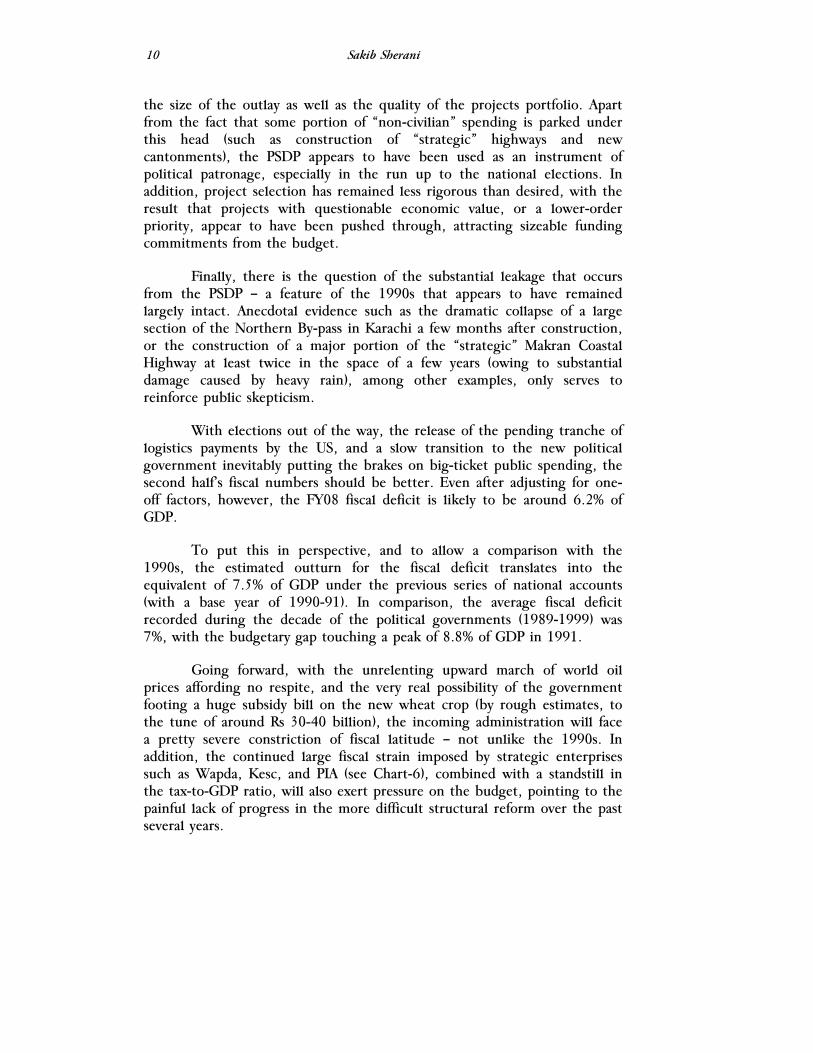
As a consequence of widening imbalances, government budgetary borrowing has risen sharply, with public debt increasing by an annualized 16% by the end of the first quarter (July-September FY08) – reversing the trend of relatively tame growth over the 2002-2006 period (Chart-4). A corollary to higher government borrowing is a fairly rapid increase in debt servicing costs. Interest payments in the first six months of FY08 have soared by over 52% versus the corresponding period in FY07, after recording a 50% year-on-year jump in FY07 (Chart-5).
Chart-4: Public Debt
Source: Ministry of Finance, GoP
Chart-5: Interest Payments
Source: Ministry of Finance, GoP; ABN Amro Bank (Pakistan) Ltd.
Pakistan’s Macroeconomic Situation
9
A large part of the increase in public debt has come via monetization of the fiscal deficit, with government sector borrowing from the central bank for year-to-date FY08 touching Rs 367 billion (US$5.8 billion, or the equivalent of 3.7% of full-year GDP) as of March 15, 2008 (for more details see next section). In conjunction with the oil/commodity price shock, fiscal indiscipline has been a major contributor to the underlying inflationary pressure in the economy, with an unfavorable dynamic for domestic inflation in the near term. We expect full-year CPI inflation to cross 9% by end-June 2008.
Unsurprisingly, at the core of the deterioration in the macroeconomic environment is a rapid weakening of the fiscal position.
Fiscal Numbers
The most recent official data released paints a worrying picture, especially on the fiscal side. The budget deficit for the first half of the fiscal year (July-December 2007) has been recorded at 3.6% of GDP, only 0.4 percentage points lower than the full year target set in the budget. While “one-off” items such as expenditure overruns in the run-up to the elections, energy-related subsidies, and disruptions to revenue collection in December 2007 exacerbated the outturn, the underlying trend of high government spending and a narrow revenue base is at the root of the growing imbalances.
Compared to the corresponding period of FY07, the fiscal deficit has widened 111% for H1FY08 (July-December 2007). Expenditure growth has outstripped revenue collection. Current expenditures have ballooned 33%, accelerating a trend recorded over the past several years. On the back of higher public sector borrowing, a turn in interest rates, and unanticipated lumpy repayments of national savings scheme instruments, debt servicing (interest portion) has recorded a substantial increase, rising 52.6% in H1FY08 versus H1FY07. In addition, defense spending has also registered a 14.7% increase.
The other big contributor to the sharp rise in public expenditure is the “development” spending head under the Public Sector Development Program (PSDP). PSDP expenditures have risen nearly 53%, making the second biggest contribution in absolute terms to the increase in the fiscal gap for the first half of FY08 (after interest payments). The increase in PSDP spending is a continuation of the trend over the past few years.
While the rise in PSDP spending has been touted as an achievement of the Musharraf-Shaukat Aziz era, there are serious misgivings both about
Sakib Sherani
10
the size of the outlay as well as the quality of the projects portfolio. Apart from the fact that some portion of “non-civilian” spending is parked under this head (such as construction of “strategic” highways and new cantonments), the PSDP appears to have been used as an instrument of political patronage, especially in the run up to the national elections. In addition, project selection has remained less rigorous than desired, with the result that projects with questionable economic value, or a lower-order priority, appear to have been pushed through, attracting sizeable funding commitments from the budget.
Finally, there is the question of the substantial leakage that occurs from the PSDP – a feature of the 1990s that appears to have remained largely intact. Anecdotal evidence such as the dramatic collapse of a large section of the Northern By-pass in Karachi a few months after construction, or the construction of a major portion of the “strategic” Makran Coastal Highway at least twice in the space of a few years (owing to substantial damage caused by heavy rain), among other examples, only serves to reinforce public skepticism.
With elections out of the way, the release of the pending tranche of logistics payments by the US, and a slow transition to the new political government inevitably putting the brakes on big-ticket public spending, the second half’s fiscal numbers should be better. Even after adjusting for one-off factors, however, the FY08 fiscal deficit is likely to be around 6.2% of GDP.
To put this in perspective, and to allow a comparison with the 1990s, the estimated outturn for the fiscal deficit translates into the equivalent of 7.5% of GDP under the previous series of national accounts (with a base year of 1990-91). In comparison, the average fiscal deficit recorded during the decade of the political governments (1989-1999) was 7%, with the budgetary gap touching a peak of 8.8% of GDP in 1991.
Going forward, with the unrelenting upward march of world oil prices affording no respite, and the very real possibility of the government footing a huge subsidy bill on the new wheat crop (by rough estimates, to the tune of around Rs 30-40 billion), the incoming administration will face a pretty severe constriction of fiscal latitude – not unlike the 1990s. In addition, the continued large fiscal strain imposed by strategic enterprises such as Wapda, Kesc, and PIA (see Chart-6), combined with a standstill in the tax-to-GDP ratio, will also exert pressure on the budget, pointing to the painful lack of progress in the more difficult structural reform over the past several years.

Pakistan’s Macroeconomic Situation
11
Chart-6: Fiscal Health of Strategic/Public Sector Enterprises (PSEs)
Source: Ministry of Finance.
The net result of expenditure overruns and declining momentum in revenue collection, in conjunction with the commodities price shock, is likely to be a breach of two key provisions of the Fiscal Responsibility and Debt Limitation Act in FY08.
1. The budget will record a revenue deficit for fiscal year FY08 ending June 30, 2008.
2. Public debt will not decline by a minimum of 2.5 percentage points of GDP for the second consecutive year.
If indeed this is the case, the change in the path of the public debt trajectory should be a cause of concern. Mainly on the back of healthy increases in nominal GDP, the public debt to GDP ratio declined each consecutive year, from 100% in 1999 to 55.2% in 2007. Hence, a reversal of course viz. the public debt path will represent the first increase in the ratio in nine years.
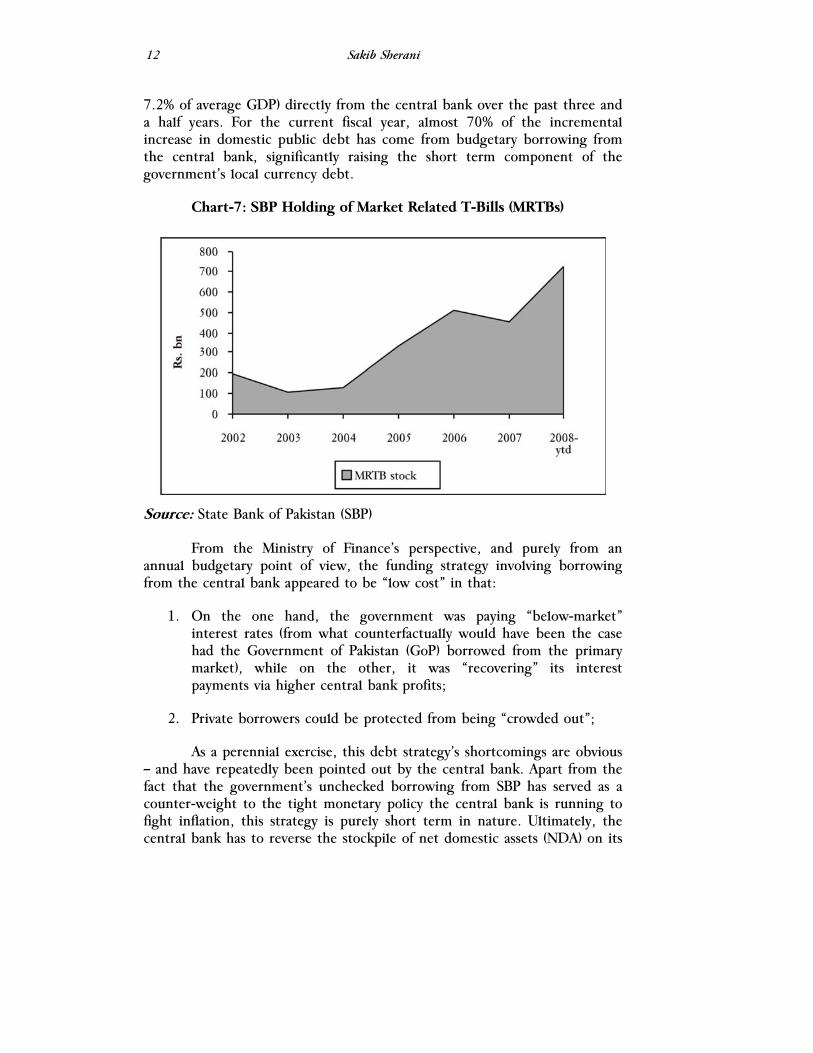
The previous government’s funding strategy is also likely to compound the woes of the next government. Since 2005, the Ministry of Finance has relied excessively on borrowing from the State Bank of Pakistan (SBP), i.e. monetizing the deficit, in an effort to limit the increase in interest payments. In doing so, it has cumulatively borrowed Rs 593 billion (equivalent to US$9.8 billion at the average exchange rate for the period, or
Sakib Sherani
12
7.2% of average GDP) directly from the central bank over the past three and a half years. For the current fiscal year, almost 70% of the incremental increase in domestic public debt has come from budgetary borrowing from the central bank, significantly raising the short term component of the government’s local currency debt.
Chart-7: SBP Holding of Market Related T-Bills (MRTBs)
Source: State Bank of Pakistan (SBP)
From the Ministry of Finance’s perspective, and purely from an annual budgetary point of view, the funding strategy involving borrowing from the central bank appeared to be “low cost” in that:
1. On the one hand, the government was paying “below-market” interest rates (from what counterfactually would have been the case had the Government of Pakistan (GoP) borrowed from the primary market), while on the other, it was “recovering” its interest payments via higher central bank profits;
2. Private borrowers could be protected from being “crowded out”;
As a perennial exercise, this debt strategy’s shortcomings are obvious – and have repeatedly been pointed out by the central bank. Apart from the fact that the government’s unchecked borrowing from SBP has served as a counter-weight to the tight monetary policy the central bank is running to fight inflation, this strategy is purely short term in nature. Ultimately, the central bank has to reverse the stockpile of net domestic assets (NDA) on its
Pakistan’s Macroeconomic Situation
13
balance sheet, by offloading the same to banks. At that stage, it could crowd out private borrowers as well as pressure interest rates upward. Given the excessive reliance on borrowing from SBP – an avenue which is now increasingly restricted – the new administration could face an up tick in interest payments on public debt as the floating debt is “re-priced” at market clearing rates.
All in all, the incoming government is more than likely to face a fairly substantial constriction in fiscal space, unless it is offset by significant expenditure containment – or, in the short run, by budgetary grants such as the one-off Saudi oil aid amounting to US$300million.
Policy Fixes
Despite the gravity of the challenges at hand, all is not lost. With prudence and determination, and a bit of luck, the situation is largely retrievable, in our view. Some suggestions follow.
In the short run, the new government should:
• Be prepared to sacrifice economic “growth” (in the near term). A growth-centric paradigm aiming to achieve impressive headline rates of GDP expansion via fiscal stimulus and a surge in domestic liquidity is at the root of Pakistan’s current imbalances.
• Instead, policymakers should focus on the “quality” of economic growth that they hope to attain – i.e. on its sustainability, equity, and, importantly, on the poverty-elasticity of growth.
• Reduce the subsidy burden on the budget by running more targeted programs.
• Run a small, but efficient, government. Reduce the size of the cabinet which was bloated under the Shaukat Aziz-run administration. Cut the number of federal ministries and divisions, by reducing overlap of functions.
• Re-prioritize all spending, especially within development spending. The portfolio of projects under the PSDP needs to be critically re-examined for “importance”, “criticality”, and “economic benefit”. Projects with questionable benefits need to be axed, while leakages due to delays in execution, faulty implementation, and/or corruption need to be minimized.
Sakib Sherani
14
• Discretionary current expenditure needs to be curbed. Some suggestions: a wage freeze for military personnel/civil servants can be affected, together with a halt to any further generous perks and privileges accorded to parliamentarians. No new vehicles and/or office furnishings for government servants should be allowed for the next three years.
• Redirect borrowing for budgetary support from the central bank to non-bank sources such as Pakistan Investment Bonds (PIB), with a re-profiling of the maturity structure of the debt into longer term tenures.
• Introduce a ceiling on annual government borrowing from the central bank by an amendment to the Fiscal Responsibility and Debt Limitation Act 2005.
• Enhance revenue generation by allowing the capital gains tax exemption on equities to lapse on June 30, 2008, and introduce a tax on real estate transactions. This will promote equity in taxation, as well as serve to deflate elevated real estate prices which are hindering new investment. It will also re-start mortgage financing and construction activity.
• Aim to achieve a neutral or a surplus revenue deficit situation by end-September 2008;
In the longer term:
• Initiate measures to increase the tax to GDP ratio by at least 1 percentage point a year through “structural” improvements – i.e. by widening the tax base. More than agriculture, the services sector appears to offer greatest prospects for further revenue enhancement. Recent growth has come mainly from the services sector, which now accounts for 53% of GDP but contributes only 26% to total tax revenue.
• Reduce the huge strain on fiscal resources imposed by the remaining state-owned enterprises, mainly PIA, Wapda and Kesc. This can only be achieved through a more effective restructuring effort on the part of government, which will require, first and foremost, that these enterprises are not viewed as “quick fixes” for creating new employment.
Pakistan’s Macroeconomic Situation
15
• Develop alternate energy sources, and expand conservation efforts. Make energy conservation targets more ambitious.
• To ensure better supply of food grains, and to reduce the import bill, maximum focus should be directed towards enhancing agricultural productivity. Pakistan has reached the frontier of its extensive farming strategy, and now needs to re-orient its agriculture sector towards higher value-added (and less water-intensive) crops. By galvanizing crop research and extension services, productivity levels can be raised substantially. In terms of administration, the agriculture sector is a provincial subject. However, a lack of ownership (and funding) of the sector is apparent, and needs to be reversed.
Rising to the Challenge?
Given the foregoing, the key question is whether the coalition government is up to the task. On this score, the new government may be handicapped on at least three fronts.
The first, and possibly foremost, handicap stems from the fact that the economic hardship on a large swathe of the populace is both palpable as well as real, increasing the pressure on the coalition parties to deliver some immediate steps towards alleviation. A period of viciously high inflation, especially food inflation, has burdened the average Pakistani over the past few years. To put this in perspective, using the Consumer Price Index (CPI) as the inflation gauge, the price level has risen over 27% cumulatively over the past three years. Food inflation has been a major contributor, rising 32.6% over the 2005-07 period.
A toxic combination of domestic crop shortages and the sharp run up in global commodity prices, was compounded by bad governance, with reports of extensive hoarding and smuggling of sugar and wheat in particular. (In 2006, the President shelved a National Accountability Bureau inquiry into the sugar crisis, reportedly citing a threat to the “stability” of the government).
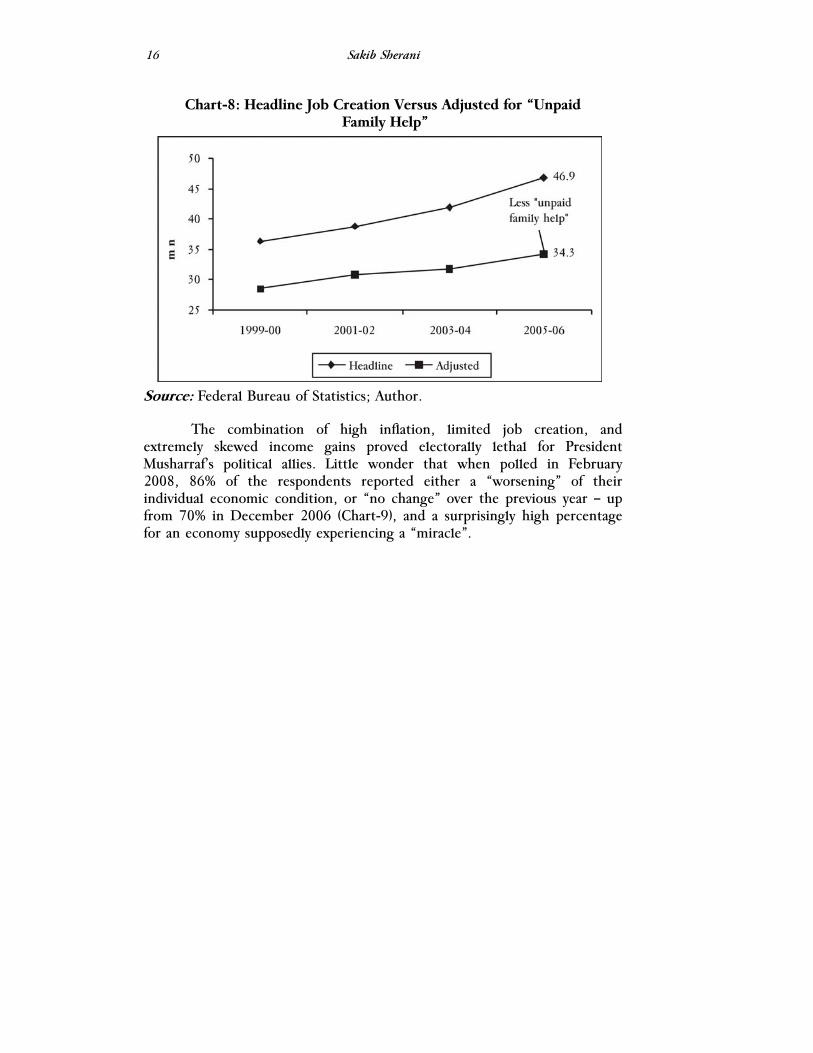
Compounding the economic misery of the population has been the fact that while top-line economic growth appeared impressive over the past several years, the headline figure masked the extremely skewed nature of gains. In addition, the economic expansion generated under the finance team led by Prime Minister Shaukat Aziz was relatively “jobless” in nature, with employment gains artificially inflated via the use of the “unpaid family help” category – a statistical construct that accounted for the bulk of the jobs created over the past five years (Chart-8).
Sakib Sherani
16
Chart-8: Headline Job Creation Versus Adjusted for “Unpaid Family Help”
Source: Federal Bureau of Statistics; Author.
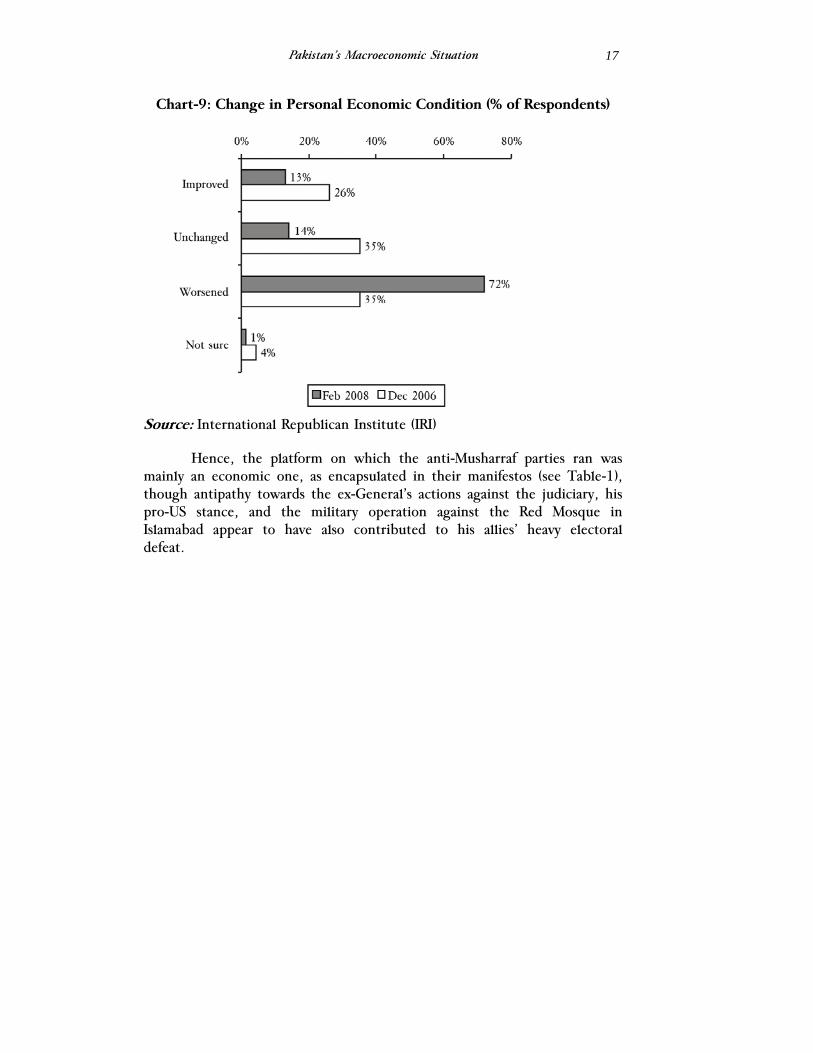
The combination of high inflation, limited job creation, and extremely skewed income gains proved electorally lethal for President Musharraf’s political allies. Little wonder that when polled in February 2008, 86% of the respondents reported either a “worsening” of their individual economic condition, or “no change” over the previous year – up from 70% in December 2006 (Chart-9), and a surprisingly high percentage for an economy supposedly experiencing a “miracle”.
Pakistan’s Macroeconomic Situation
17
Chart-9: Change in Personal Economic Condition (% of Respondents)
Source: International Republican Institute (IRI)
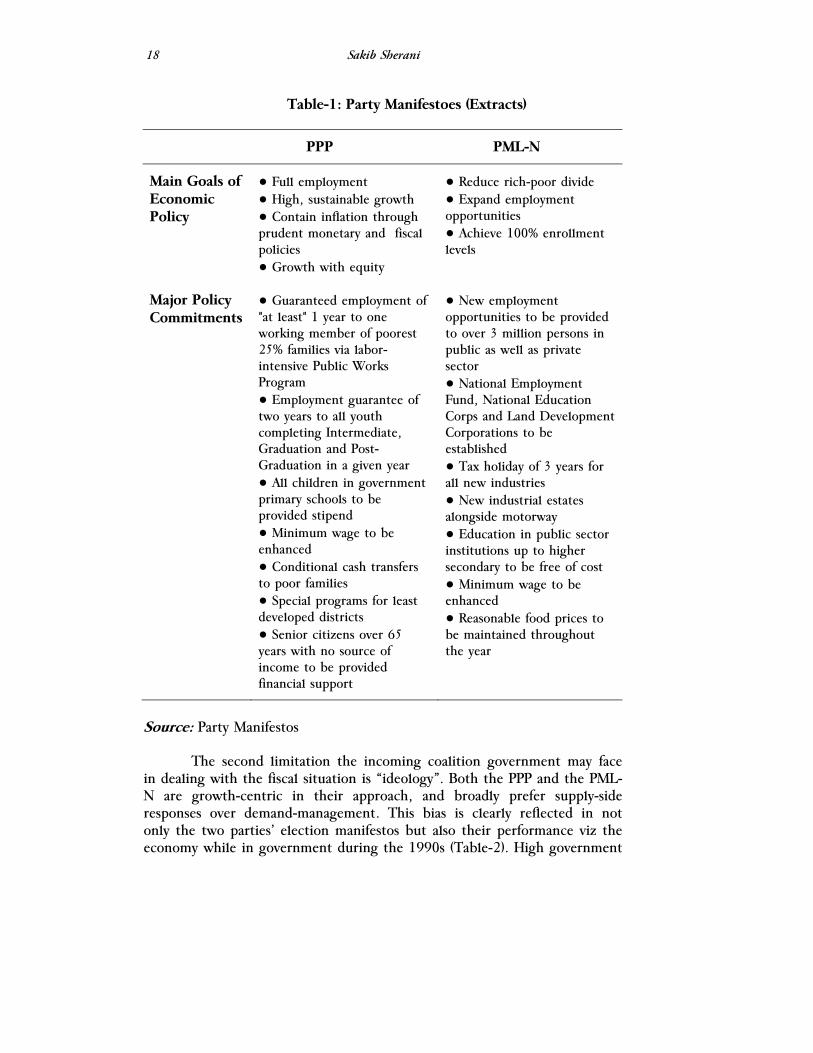
Hence, the platform on which the anti-Musharraf parties ran was mainly an economic one, as encapsulated in their manifestos (see Table-1), though antipathy towards the ex-General’s actions against the judiciary, his pro-US stance, and the military operation against the Red Mosque in Islamabad appear to have also contributed to his allies’ heavy electoral defeat.
Sakib Sherani
18
Table-1: Party Manifestoes (Extracts)
PPP PML-N
Main Goals of Economic Policy
● Full employment ● High, sustainable growth ● Contain inflation through prudent monetary and fiscal policies ● Growth with equity
● Reduce rich-poor divide ● Expand employment opportunities ● Achieve 100% enrollment levels
Major Policy Commitments
● Guaranteed employment of "at least" 1 year to one working member of poorest 25% families via labor-intensive Public Works Program ● Employment guarantee of two years to all youth completing Intermediate, Graduation and Post-Graduation in a given year ● All children in government primary schools to be provided stipend ● Minimum wage to be enhanced ● Conditional cash transfers to poor families ● Special programs for least developed districts ● Senior citizens over 65 years with no source of income to be provided financial support
● New employment opportunities to be provided to over 3 million persons in public as well as private sector ● National Employment Fund, National Education Corps and Land Development Corporations to be established ● Tax holiday of 3 years for all new industries ● New industrial estates alongside motorway ● Education in public sector institutions up to higher secondary to be free of cost ● Minimum wage to be enhanced ● Reasonable food prices to be maintained throughout the year
Source: Party Manifestos
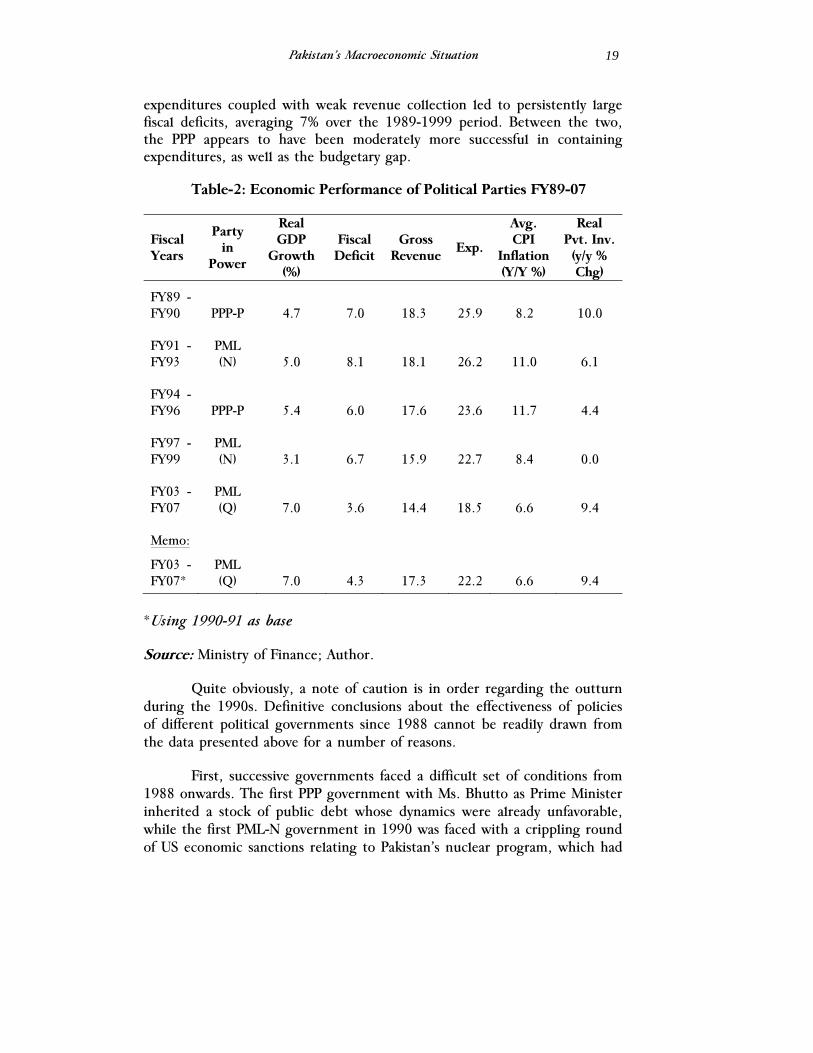
The second limitation the incoming coalition government may face in dealing with the fiscal situation is “ideology”. Both the PPP and the PML-N are growth-centric in their approach, and broadly prefer supply-side responses over demand-management. This bias is clearly reflected in not only the two parties’ election manifestos but also their performance viz the economy while in government during the 1990s (Table-2). High government
Pakistan’s Macroeconomic Situation
19
expenditures coupled with weak revenue collection led to persistently large fiscal deficits, averaging 7% over the 1989-1999 period. Between the two, the PPP appears to have been moderately more successful in containing expenditures, as well as the budgetary gap.
Table-2: Economic Performance of Political Parties FY89-07
Fiscal Years
Party in
Power
Real GDP
Growth (%)
Fiscal Deficit
Gross Revenue
Exp.
Avg. CPI
Inflation (Y/Y %)
Real Pvt. Inv. (y/y % Chg)
FY89 - FY90 PPP-P 4.7 7.0 18.3 25.9 8.2 10.0
FY91 - FY93
PML (N) 5.0 8.1 18.1 26.2 11.0 6.1
FY94 - FY96 PPP-P 5.4 6.0 17.6 23.6 11.7 4.4
FY97 - FY99
PML (N) 3.1 6.7 15.9 22.7 8.4 0.0
FY03 - FY07
PML (Q) 7.0 3.6 14.4 18.5 6.6 9.4
Memo:
FY03 - FY07*
PML (Q) 7.0 4.3 17.3 22.2 6.6 9.4
*Using 1990-91 as base
Source: Ministry of Finance; Author.
Quite obviously, a note of caution is in order regarding the outturn during the 1990s. Definitive conclusions about the effectiveness of policies of different political governments since 1988 cannot be readily drawn from the data presented above for a number of reasons.
First, successive governments faced a difficult set of conditions from 1988 onwards. The first PPP government with Ms. Bhutto as Prime Minister inherited a stock of public debt whose dynamics were already unfavorable, while the first PML-N government in 1990 was faced with a crippling round of US economic sanctions relating to Pakistan’s nuclear program, which had
Sakib Sherani
20
a far-reaching impact on investor perceptions and capital inflows. Similarly, the country was sanctioned yet again during the second PML-N government (1997-1999) on account of its response to India’s testing of nuclear devices with its own round of tests.
In fact, Pakistan’s economy lurched from crisis to crisis in the 1990s, with devastating floods and a ruinous viral attack on the key cotton crop in the early part of the decade, and a prolonged period of ethnic strife in Karachi that cast a shadow over the economy. To make matters worse, the transition to democracy that began in 1988 was uneasy, with at least seven different governments coming to power (including caretaker set-ups charged with overseeing elections) between 1988 and 1999.
Hence, considerable extraneous influences – from geopolitics to weather-related – exerted themselves over this period, worsening already fragile economic conditions. In addition, the outturn on the parameters chosen in Table 2 does not reveal an important dimension of economic policymaking – the extent of reform introduced. In this context, the 1990s saw considerable progress in the liberalization of the economy – particularly in the case of tariff reform and financial sector liberalization – under both PML-N as well as the PPP governments.
That said, not all economic outcomes during the 1990s were exogenously determined. Policies adopted by the two mainstream parties in power largely worsened an already precarious situation – both economic as well as political – with a dangerous drift towards polarization in the country.
In addition, there were a number of substantial offsets to the otherwise dire economic situation. Liberalization of the capital account in the early 1990s by the first PML-N government – combined with tax exemptions and constitutional guarantees against expropriation – encouraged reverse capital flight and a very rapid build-up of balances in onshore foreign currency accounts (FCAs). The hard currency from these accounts, coupled with inflows of “hot money” under the FE45 scheme for offshore institutional investors, was used by the authorities to finance the growing external imbalances through the 1990s. The other significant offset was the Saudi oil facility (essentially a grant), which was made available after Pakistan tested its nuclear devices in 1998, and continued until 2003. In total, this grant amounted to several billion US dollars.
Returning to our argument concerning potential impediments to running an economic program with a stabilization thrust, the third handicap is embedded in politics. Almost by definition, pursuing a course of action

Pakistan’s Macroeconomic Situation
21
that may be deemed to increase the economic hardship of the electorate may be a non-starter for a four-party coalition. The fact that the PPP is coming back into government after a twelve year interregnum, while the PML-N is staging a comeback after being removed by General Musharraf’s coup in 1999, reduces the likelihood of stabilization policies, in our view. Hence, the “natural” instinct for the coalition government may be to finance its way out of the current situation, rather than to adopt a path of adjustment, not unlike the course of action chosen by the previous administration. If so, it will only be delaying the inevitable.
Conclusion
Pakistan faces a difficult economic situation, even as the political transition to a popularly elected government has proceeded far more smoothly than anticipated. The current rough patch for the economy is not entirely unexpected, given the deeply flawed growth strategy that was being pursued since 2002. By and large, and despite the exogenous shocks, Pakistan’s imbalances are policy-induced. Herein lies one important piece of good news – that the situation can be reversed.
It remains to be seen what policies are introduced, and how effective they will be in addressing the imbalances. However, one thing is clear: a “muddle through” approach will not succeed. Without forceful measures, including possibly politically unpalatable ones, Pakistan may be unable to successfully navigate out of the current difficult situation.

The Lahore Journal of Economics Special Edition (September 2008): pp. 23-34
Industrial Policy: Domestic Challenges, Global Imperatives,
and Pakistan’s Choices
Shahid Javed Burki*
Abstract
Public policy is aimed at increasing the efficiency of the industrial sector in Pakistan. This paper looks at four issues. Firstly, it looks at the adjustments the new government needs to make to restore macroeconomic balance. Secondly, it discusses the global changes that have occurred in the industrial sector and how these could be incorporated into Pakistani policy making. Thirdly, I have briefly discussed the history of policies implemented in Pakistan. Lastly, I have discussed the importance of decentralized industrial policy making. This paper also conducts an empirical analysis of the impact of industrialization on poverty. It is concluded that industrial development in Pakistan has historically been heavily dependent on government intervention and there was poor growth in this sector as compared to other Asian economies. The paper also presents five proposals aimed at achieving higher growth in the industrial sector. JEL Classification: D33, H32, L12, L13
Keywords: Pakistan, Public Policy, Industry, Competitiveness, Poverty
Introduction
In the past policymakers in Pakistan were inclined to keep two objectives in view while designing public policy aimed at industrializing the country. The first was to gain self-sufficiency in items of basic consumption; the second, was to exploit the country’s perceived comparative advantage. In both cases the industrial policy overlapped considerably with trade policy; at times it was concern with some aspects of international trade that determined the content and orientation of the industrial policy. To take one example: The Indo-Pakistan trade war of 1949 forced Pakistan into adopting the first approach – to attempt for self sufficiency in basic manufactures. The model of planned growth adopted by the Government of President Ayub Khan led to
* Head, Policy Institute, Beaconhouse National University (BNU) and Former Minister of Finance, Government of Pakistan.
Shahid Javed Burki
24
the second approach – to develop industries using the country’s comparative advantage. Neither of the two approaches created an efficient industrial sector.
Instead, as I will argue in this paper, Pakistan needs to adopt an approach based on three considerations: selecting the winners, both industries and enterprises, that could exploit niches for themselves in the rapidly changing global system of production; decentralizing industrial policymaking to the provinces so that each province can take advantage of its endowments; choosing the industries that can play a role in creating a large number of jobs for the country’s rapidly increasing work force. With this as the approach the country will have not one but a number of industrial policies – at least four, one for each province of the country. In Punjab, to take one example, the policy will aim at expanding the food processing sector as well as small and medium industries focused on small engineering. In Sindh, to take another example, the industrial policy should take advantage of the large industries that are located in the province. The aim of policy should be to develop further the industrial base so that the existing industries and corporate entities working in the sector can acquire scale and expertise that would help them to compete with the tens of thousands of multinational corporations that are now operating in the global economy. The Indian industrial enterprises have been able to enter the global production system though mergers and acquisitions. Pakistan, however, has been left way behind.
This paper is presented in four parts. The first looks at the process of macroeconomic adjustment the new government needs to make in order to restore balance to the economy. I will argue that the adjustment needs to be done in a way that it does not compromise the country’s growth prospects. The second section deals with how the global production, trading and financial systems have changed and what these changes mean for policymaking in Pakistan. The third section gives a brief historical view of industrial policymaking in Pakistan. This is done since I believe that the politics of economic decision-making is an under-analyzed subject. The fourth section picks up on the role the provinces can – and should – play in the making of industrial policy. If that were to be done, industrial development should proceed on very different tracks in the provinces. I will illustrate this by making use of the Punjab as a case study.
The Need for Adjustment While Not Hurting Growth Prospects
Recent economic developments pose many serious problems for today’s policymakers. They have also created an opportunity for rethinking the priorities the state should adopt with respect to quickening the pace of
Industrial Policy: Domestic Challenges, Global Imperatives and Pakistan’s Choices
25
development – Pakistan is now a laggard among the large economies of Asia. While promoting growth, policymakers must also decide the direction in which the economy should proceed. The policies that helped the economy to grow at 7 percent a year over the last half a dozen years did not do enough for the poor, widened interpersonal and inter-regional income gaps, and did not increase the integration of the economy with the global economic system. The model of growth pursued did not solve the deep rooted structural problems the economy has faced for decades while some more have been added to those that already existed.
Not for the first time in its turbulent economic history, policy makers in Pakistan are faced with some critical choices. The economy has lost its balance. The fiscal deficit is increasing at an unsustainable rate. It has already reached the level where financing it could lead to a number of unpleasant consequences. Resorting to borrowing from the central bank, as was done in the first half of 2008 would result in inflation. This is not the route the policymakers should take. It would exacerbate the inflationary pressures that are already present in the economy. On April 16, 2008 the new government revealed that the rate of increase in general inflation had doubled in the last one year, reaching 14.2 percent a year. The food inflation was at more than 20 percent a year. This rise in the level of prices was the result of both public policy and the rise in global commodity prices. The previous government had already borrowed heavily from the central bank while the price of oil and several agricultural commodities was increasing at unprecedented amounts.
The second way of financing the deficit would be to borrow from the market. This would raise interest rates and also crowd out private investors, inhibiting new investments in the economy. The third would be to reduce government’s non-development expenditures. One way of reducing government expenditure and realigning its priorities would be to involve the provinces in the decision making process. What is required, therefore, is a balanced approach involving some central bank financing, some market borrowing, some privatization of the assets still owned by the government, and some reduction in the government’s current expenditure. Whichever combination of policies is adopted, it should be done in a way that the economy’s medium- and long-term growth objectives are not compromised. Adjustment should be done within the context of a medium-term development framework1. Unfortunately, such a framework does not
1 A comprehensive program for adjustment and growth was prepared by the Institute of Public Policy in its first annual report, Lahore, May 2008. See, the Institute of Public Policy (2008).
Shahid Javed Burki
26
exist. The Planning Commission’s Vision 2030 spells out some long-term strategies but it did not guide policymaking by the previous regime2. The framework within which adjustments should be undertaken should have built-in trade, industrial and agricultural development policies. These policies should be developed with full recognition given to some of the important changes taking place in the structure of the global economy. The main purpose of this short paper is to present some ideas on industrial policy, although there is a considerable amount of overlap in the policy content of industrial and trade policies.
In this broad overview of the opportunities available to Pakistan in the industrial sector, we will focus on a number of considerations that should inform the policymakers as they seek to industrialize the country. One, they should be mindful of the history of industrial development in the country, a subject that we discuss in the section that follows. Two, the changes that have occurred in the global economic system – in both the system of industrial production as well the system of international trade – should also be kept in mind as the policymakers begin to address this subject once again. Three, much of the industrial policy should be the responsibility of the provinces. This will lead to the state placing a different emphasis in different regions of the country. Four, this approach to policymaking should result in considerable emphasis on the development of small and medium enterprises. The development of this part of the industrial economy has not received as much state attention as it deserves.
Global Changes: How the International Production and Trading Systems Have Changed and What These Changes Mean for Pakistan
In the design of an industrial policy appropriate for the country at this time, Pakistan must factor in the changes that are taking place in the global economic system. Three of these are important. The global production system is changing rapidly as multinational corporations are able to use the rapid development in information and communication technologies to disperse their activities. The firms located in the industrial world are either outsourcing a great deal of what they used to do themselves or are taking their operations to the places that offer better prices for their inputs. This dispersal of activity has led to the second important change in the structure of the global economy. Now parts and components have become the largest component of international trade.
2 Government of Pakistan (2007).
Industrial Policy: Domestic Challenges, Global Imperatives and Pakistan’s Choices
27
That the changes in the global system of production and trade would suggest an industrial policy aimed at the development of small and medium industries with the ability to exploit external markets is reinforced by the fact that Pakistan today confronts a serious problem of poverty. What is the incidence of poverty is a hotly debated subject in the country. The previous government’s claim that the incidence had declined by 10 percentage points is contested by a number of independent analysts, most notably Akmal Hussain and the Karachi-based Social Policy and Development Centre. Hussain3 claims that during 1998-99 and 2004-05, there was no significant reduction in the level of poverty. The SPDC found that the decline in poverty in 2004-07 was of the order of 3 to 3.5 percentage points rather than the much larger figure suggested by the previous government. The reason for recalling this debate is not to settle it one way or the other4. The purpose is to underscore the important point that the laissez faire approach to economic development that guided Islamabad did not do much to the incidence of poverty and to narrow the widening inter-personal and inter-regional disparities. The policymakers during this period placed their faith in what was once called the “trickle down” approach to economic development.
If alleviating poverty is to be one of the main objectives of public policy, then it is clear that a new approach to industrialization should be one of its important components. Generation of employment should, therefore, be built into the industrial policy. This is one additional reason why Pakistan needs to focus public policy on the development of small and medium sized industries.
Why can’t investment choices be left to the private sector as advocated by the exponents of The Washington Consensus? This approach, articulated by the development finance institutions located in Washington, sought to reduce the role of the state in the management of the economy and promoting that of private enterprise. It also advocated more openness of the economy to the outside world by removing constraints on trade and the movement of capital. It may work in the economies where the private sector has developed without much handholding by the government. That is not the case in Pakistan. As noted below in the discussion of the history of industrial policy in the country, it was the government that was behind the development of private enterprise. Given that leaving further industrial development to private entrepreneurs is not likely to serve national interests, the state will need to play an important role. But the nature and
3 Hussain (2008). 4 Social Policy Development Centre (2007).
Shahid Javed Burki
28
scope of this should be different from those performed in the first sixty years of independence.
History of Industrial Policy-Making in Pakistan; Why Those Who Seek To Influence Policy-Making and Those Responsible For It Should Understand the Considerations That Motivate Various Stake Holders
The making of industrial policy in Pakistan has a chequered history. Industrial policies were made as either part of the medium-term development plans or in response to some crisis or other the country was faced with. Five industrial policies or distinct approaches have left a lasting impression on the structure of industry in the country. The first was made in 1948, soon after Pakistan gained independence, and was developed further as a consequence of the Indian decision in 1949 to place a trade embargo on Pakistan. The second was embedded in the Second (1960-65) and Third (1965-70) Five-year Development Plans adopted by the government headed by President Ayub Khan, the county’s first military ruler, the third was adopted by the administration of President (later Prime Minister) Zulfikar Ali Bhutto, the fourth was formulated by the several democratic governments that held office in the eleven year interregnum, 1988-1999, between two long rules by the military, and the fifth was adopted by the government of President Pervez Musharraf, the fourth military ruler. It would be in order to briefly discuss the approaches adopted in these five separate policies to prepare the ground for the discussion of what I believe should be the content of a new policy.
The first generation of Pakistani leaders was extremely concerned with the Indian attitude towards the country they had created. There was an impression that the Indian leadership would attempt to smother Pakistan by using economic means. This feeling was reinforced by some of the early decisions taken by New Delhi regarding the release of funds that were due to Pakistan as a result of the Partition Agreement. The Indian government blocked the transfer of funds that fell in the category of what was called the “Sterling Balances”5. When, in 1949, Pakistan chose not to follow other countries of what was then called the Sterling Area (now the Commonwealth) in devaluing its currency with respect to the American dollar, India retaliated by launching a trade war against its neighbor. Pakistan at that point was dependent on India for the supply of basic goods of consumption; a significant proportion of its imports came from India and a significant proportion of its exports went to that country. The Indian reaction to the Pakistani decision with respect to the value of its currency
5See Wolpert (2001), Chapter 24.

Industrial Policy: Domestic Challenges, Global Imperatives and Pakistan’s Choices
29
caused enormous deprivation. The government responded by adopting a series of policies that were to have a lasting impact on the development of the country’s industrial base. Karachi, at that time the country’s capital, encouraged private leadership in the process of industrialization, provided incentives to private entrepreneurs to invest in the production of consumption goods, and gave the fledging private sector protection from external competition. All this resulted in the rapid growth of the industrial sector and rapid increase in the rate of increase in industrial output. It is interesting to note that while India had chosen to industrialize by encouraging the establishment of heavy industry in the industrial sector, Pakistan went in the opposite direction. It encouraged the development of private enterprise and growth of consumer industries.
The government of Ayub Khan continued with this approach but with two differences. It used the industrial licensing policy to bring about a wider dispersal of industrial ownership. And, it used development finance companies such as the Pakistan Industrial and Commercial Investment Corporation (the PICIC) and the Industrial Development Bank of Pakistan (the IDBP) to influence the scope of industrialization. PICIC and IDBP received generous financial support from the World Bank. Development thinking at that time was in favor of using publicly owned development finance corporations to quicken the pace of industrialization. An important consequence of this policy was to encourage the establishment of small units in the areas other than Karachi, which by then had emerged as the industrial center of the country. Textile spinning and weaving sectors were most affected by this policy. Dozens of spinning mills with no more than 12,500 spindles were set up. This was significantly below the optimal scale even at that time. The approach adopted by the Ayub government was to introduce considerable inefficiency in the sector, a development that has continued to keep the textile industry relatively backward to this day.
The third approach towards industrialization occurred during the first few months of the tenure of the administration headed by Zulfikar Ali Bhutto.6 His decision to nationalize large scale industries suddenly increased the presence of the public sector in industry and finance. By this action he sought to take Pakistan on the route and in the direction on which India under Jawaharlal Nehru had embarked after gaining independence. The decision to set up a number of public sector corporations to undertake new investments in the industrial sector and to provide financial support to them through a new development finance corporation, further strengthened the role of the state in the industrial sector. The result was the introduction of
6 Burki (1980).
Shahid Javed Burki
30
several distortions into the management of the economy and widespread corruption that has continued to bedevil the country to this day.
The democratic administrations that held office in the 1990s took some initiatives to bring back the private sector as the leader in economic development by privatizing some of the state’s economic assets, in particular large banks and large industries. But privatization did not lead to a bursting of industrial activity on the parts of the large owners of assets in the sector. There was no attempt at product innovation, not much attention given to technological improvement, and very little effort made at market penetration. The old industrial families with their assets restored to them went about doing business in the old way. While the government was stepping back from direct involvement in industrial management, large private sector industrialists were not prepared to let go the hand of the government. They were not prepared to step back but wished to stay close to the government.
From our perspective, the most important policy initiative of this period was the establishment of the Small and Medium Enterprise Development Authority, the SMEDA. This was set up in October 1998, as a federal corporation with four regional offices, one in each province of the country. The corporation’s mandate was to facilitate the development of small and medium-sized enterprises by helping them to improve their line of products, introducing the entrepreneurs to new technologies, introducing them also to new ways of doing business and new management practices, helping them to do cost benefit analysis of the investments they were contemplating to make, and making them aware of the opportunities available in both internal and external markets.
However, it was only under President Pervez Musharraf that the private sector acquired a very prominent role. This was the fifth approach to industrial policymaking in the country’s history. Under it, the pace of privatization quickened as did deregulation and the opening of the economy to the outside world. Some significant adjustments were made in the tariff regime that provided incentives for the development of such large scale industries as automobiles and consumer electronics. The government also gave considerable room to the financial sector to participate in the process of industrialization by making choices made on the basis of market considerations.
The amount of room for maneuver allowed to the private sector did not develop enough confidence among the entrepreneurial class to stand on its own feet and deal with the changes occurring in the globe economic system without government intervention. The failure of the textile industry
Industrial Policy: Domestic Challenges, Global Imperatives and Pakistan’s Choices
31
to make use of the opportunities created by the end of the Multi-fiber Arrangement (MFA) on January 1, 2005 is the most telling example of the lasting impact on entrepreneurial behavior of the policies and approaches towards industrialization adopted in the past several decades.
While allowing considerable space to the private sector within the industrial domain, the Musharraf government should have also developed the regulatory system to provide protection to consumers, encouraging competition in the private sector, and improving corporate efficiency. Several regulatory bodies were set up in the sectors of finance, industry and public utilities but they were not allowed the autonomy without which they could not effectively operate. One way of ensuring the independence of the regulatory agencies from control of or influence by the executive branch of the government is to have the legislature approve the appointments of the chief executive. Although the Musharraf government created a number of regulatory bodies it appointed heads of the agencies who were close to the government. Consequently, most agencies did not achieve the desired amount of autonomy.
This brief history of Pakistan’s industrial development shows the changes that occurred in the way those who held the reins of power looked at the sector. The frequent changes in industrial policy noted above have kept the industrial sector relatively backward compared to the developments in other large Asian economies. How should the government approach the sector now that political power is in the process of passing to the elected representatives of the people?
The Need for a Larger Provincial Role in the Making of Industrial Policy and if That Were to Happen What is the Most Appropriate Course the Government Should Adopt?
For the reasons already discussed, the state has a diminished role to play in industrial development compared to its very active involvement in earlier times. The withdrawal of the state does not mean completely surrendering the area to the private sector. If that were to be done – and to some extent this was done during the just concluded Musharraf era – the pace of industrial progress would be slow and its direction not totally appropriate for the country. I believe that the state needs to be invited back to play a more significant role in industrialization than was advocated by those who believed in The Washington Consensus.
Given Pakistan’s history and the structure of its politics it would be right to divide the role of the state into five fairly distinct parts. These are
Shahid Javed Burki
32
picking the winners towards which the private sector should be guided but not forced. The ultimate decision to invest should be entirely the responsibility of the private entrepreneur. Second, once the decision has been taken to invest, a number of “facilitation” activities should be carried out, preferably by government agencies. The type of facilitation functions that state agencies can meaningfully perform were discussed above in the context of the mandate currently available to SMEDA. Third, better cooperation between the industrial and financial sectors should be encouraged so as to meet the financial needs of industry. Fourth, there must be attention paid to research and development, without which the industries located in the country will not be able to increase the level of productivity required for competing in the global market place. Fifth, a regulatory system needs to be in place aimed at preventing the development of monopolies in various sectors of the economy in which private entrepreneurs are actively involved. Once we disaggregate government’s functions, we need to identify what is the most appropriate place for their location. In the past, the central government has tended to concentrate these activities in its hands, leaving out the provinces. This tendency to centralize economic policymaking needs to change in favor of greater involvement of the provinces. Were that to happen, the policies each province will adopt will better suit their circumstances. I will develop this point with reference to Punjab.
I believe that the province of Punjab, recognizing its endowment and recognizing also its geographic location should pay particular attention to the development of small and medium enterprises. It has a well developed skill base for developing a number of industries for which appropriate inputs are available. These include ag-processing, small-scale engineering, leather products, and the IT industry. This is an illustrative list of possible “winners” needing the support of the government. They could become the focus of the state’s attention.
Having chosen the winners, the province should redefine the role of the SMEDA. The corporation should be divided into six separate entities, four for each of the four provinces and one each for the Federally Administered Tribal Areas (FATA) and Azad Jammu and Kashmir. These corporations should work to promote the development of the industrial sector in ways that conform to the comparative advantage of each geographic entity. By focusing on the development of an existing corporation, the Pakistani state will not need to create a new government enterprise.
As already discussed, the SMEDA is concentrating its attention on what I called “facilitation” – helping the selected enterprises and entrepreneurs to establish new production facilities or improve those they are
Industrial Policy: Domestic Challenges, Global Imperatives and Pakistan’s Choices
33
already operating. In addition, the corporation should stretch its mandate at both ends of the spectrum it is currently engaged in. It should do more analytical work aimed at identifying the “winners” and in helping its clients access sources of finance. Winners should be identified by carefully studying the opportunities available in both domestic and external markets for products. This examination should lead to the identification of niches into which the country could move. For the Punjab, these niches are likely to be in the areas already indicated.
Having picked the winners, the corporation should continue with its facilitation work but with greater attention given to developing appropriate technologies aimed at improving the productivity of the sectors chosen for attention. For that to be done effectively, the SMEDA will need to build the capacity to do R&D work. Ideally this should be done in association with the private sector with the private entrepreneurs required to pay for the help they are receiving.
Another new area for the SMEDA would be to get engaged in facilitating the access to sources of finance by the selected winners. It would be important to acquaint the people and enterprises being helped with new instruments of finance that have been developed in recent years. These include private equity and venture capital which provide equity rather than loans in return for claiming a significant share in future profits once the selected enterprises become successful.
I will conclude by summing up the argument presented in this short paper. I have argued for the adoption of an industrial policy to provide Pakistan with an industrial base (so far not developed) that would exploit its many advantages. The five approaches towards industrial policy adopted for the last six decades lacked a long-term vision; they were mostly responses to the problems the policymakers thought they faced when they held the reins of power. In designing an industrial policy it would be much more efficient to shift the locus of policymaking to the provinces rather than retain it in the center. In applying this approach to the province of the Punjab, I have argued that the list of “winners” the government should work on should be focused on the development of small and medium enterprises. In developing this approach the government needs to create a new entity but work on the evolution of the one that has done some interesting and useful work in the last decade. The Small and Medium Enterprise Development Authority has been effective in developing some new areas but it needs to expand its activities to include analytical work aimed at selecting the winners as well as helping the winners’ access new sources of finance.
Shahid Javed Burki
34
References
Burki, Shahid Javed, 1980, Pakistan under Bhutto, 1971-77, London, Macmillan.
Government of Pakistan, 2007, Vision 2030, Islamabad, the Planning
Commission, Islamabad. Hussain, Akmal, 2008, “Fallacy of Poverty Reduction”, Dawn, February 20. Institute of Public Policy, 2008, State of the Economy: Challenges and
Opportunities, Lahore. Social Policy Development Centre, 2007, Annual Report, 2007, Karachi. Wolpert, Stanley, 2001, Gandhi’s Passion: The Life Legacy of Mahatma
Gandhi, New York, Oxford University Press.
The Lahore Journal of Economics Special Edition (September 2008): pp. 35-46
Unfinished Agenda of Reforms
Hafeez Sheikh*
Abstract
This paper gives a brief overview of Pakistan’s economic growth over the past decades and critically examines the economic policies of the last government. It draws attention to the unchecked state dominance across all sectors of the economy and emphasizes the need for further privatization. The paper concludes with some suggestions on the way forward towards growth and economic prosperity.
JEL Classification: L33, O43, Q58
Keywords: Privatization, Economic Policy, Economic Growth
I. Introduction
At present, the Pakistan economy is coming under threat. Old problems, left unattended, are combining with emerging new ones. There is a real danger that if the government does not respond to the emerging economic challenges in a timely and resolute manner the macroeconomic situation could worsen significantly.
The topic of this paper, “An Unfinished Agenda of Reforms”, is so broad that it is hard to limit it to any single area. The paper starts by drawing general lessons of international experience. It then reviews Pakistan’s economic history, focusing on the recent past and the emerging difficulties. The conclusion gives some suggestions on the way forward. I believe that unless Pakistan can reorient, reduce and reform the role of the government in the economy, it is unlikely to sustain growth and improve the quality of life of its citizens.
Two general statements need to be made here: One is that these have been the best times the world has ever seen since the sixties: the best time in terms of growth and prosperity, in terms of expansion of trade and so on. The
* Former Minister of Investment and Privatization, Government of Pakistan. I want to acknowledge the excellent assistance of Ms. Uzma Afzal (Lahore School of Economics) in the preparation of this paper.

Hafeez Sheikh
36
second point is that because of changes in technology and multiple linkages and interconnections, things are happening at an unprecedented pace. Events have a way of fast-forwarding. And third, we know that some people in a society may get lucky, but luck has a way of deserting the unprepared. This also applies to economic management, which requires high levels of preparedness, agility, capacity to respond speedily and ability to execute.
It can be said that the cause of Pakistan’s looming difficulties is partly that for the past 18 months, the country has been in a slumber. Pakistan has been unable, or even unwilling to respond to the challenges, which have now multiplied and accumulated and begun to look ominous.
The thesis of this paper is that unless we transform and reorient the role of the government, it will be hard to get the results desired, and that policies requiring the government’s proper functioning will suffer. Recommendations involving the government, not being implemented or poorly implemented, leave a trail of unfinished business, incomplete projects, abandoned schemes and wasted resources.
II. Three Lessons of Development
Let us start by asking ourselves what are the lessons of the past sixty years of development experience. What have we learnt in terms of what works and what does not? Or to put it a different way, why have some countries done well while others have been left behind? After all, sixty years back, many countries, newly free from colonial rule were roughly facing the same conditions. Pakistan’s GDP for example was the same as that of Singapore. So which countries moved ahead and which were left behind, and why?
There are three major reasons behind the performance of countries:
Exports: Countries that found a way to sell their products to others got ahead, while those that could not, languished. So exports are a key determinant.
Education: Countries that focused on their citizens, on their human development and skill formation got ahead and those that ignored their citizens were left behind. In other words, you cannot have developed countries with underdeveloped people.
Private Sector: Countries that relied on governments to do everything, and there were 75-80 such countries - their economies ultimately collapsed. So while there is an obvious role for the state in the economy, it is not to do everything. And countries that assigned a primary role to the private sector and harnessed its energies were able to get ahead.
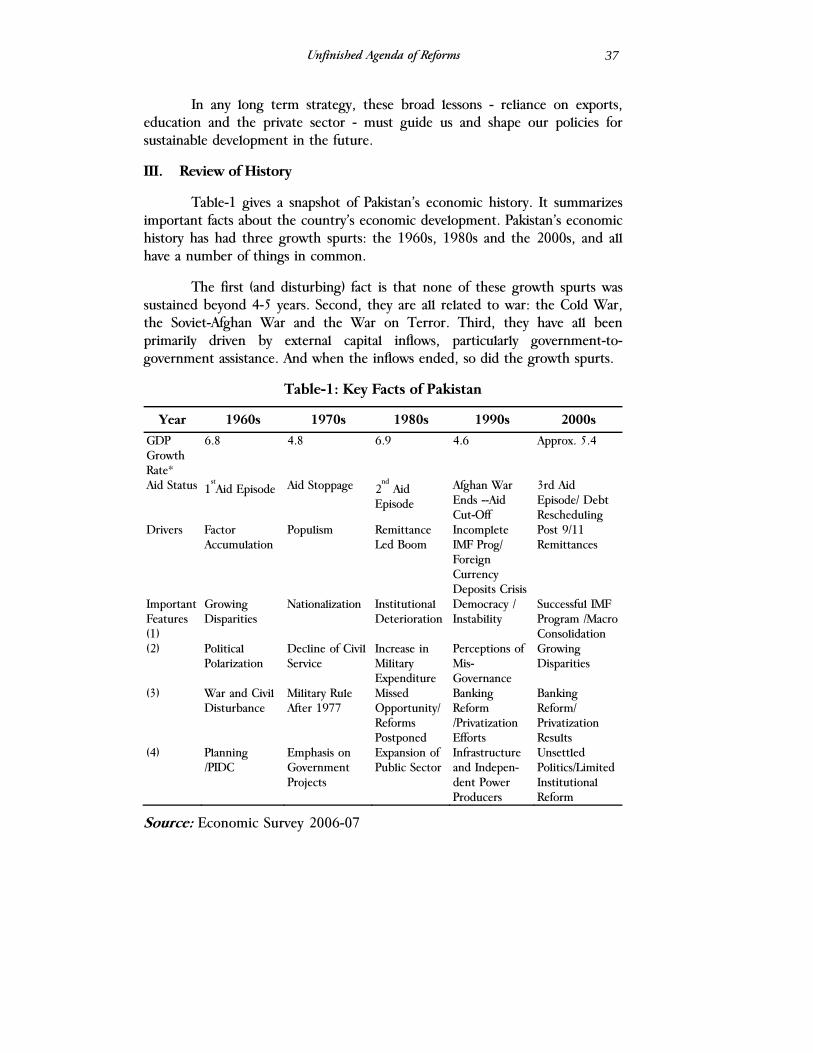
Unfinished Agenda of Reforms
37
In any long term strategy, these broad lessons - reliance on exports, education and the private sector - must guide us and shape our policies for sustainable development in the future.
III. Review of History
Table-1 gives a snapshot of Pakistan’s economic history. It summarizes important facts about the country’s economic development. Pakistan’s economic history has had three growth spurts: the 1960s, 1980s and the 2000s, and all have a number of things in common.
The first (and disturbing) fact is that none of these growth spurts was sustained beyond 4-5 years. Second, they are all related to war: the Cold War, the Soviet-Afghan War and the War on Terror. Third, they have all been primarily driven by external capital inflows, particularly government-to-government assistance. And when the inflows ended, so did the growth spurts.
Table-1: Key Facts of Pakistan
Year 1960s 1970s 1980s 1990s 2000s
GDP Growth Rate*
6.8 4.8 6.9 4.6 Approx. 5.4
Aid Status 1stAid Episode Aid Stoppage 2
nd Aid
Episode
Afghan War Ends --Aid Cut-Off
3rd Aid Episode/ Debt Rescheduling
Drivers Factor Accumulation
Populism Remittance Led Boom
Incomplete IMF Prog/ Foreign Currency Deposits Crisis
Post 9/11 Remittances
Important Features (1)
Growing Disparities
Nationalization Institutional Deterioration
Democracy / Instability
Successful IMF Program /Macro Consolidation
(2) Political Polarization
Decline of Civil Service
Increase in Military Expenditure
Perceptions of Mis-Governance
Growing Disparities
(3) War and Civil Disturbance
Military Rule After 1977
Missed Opportunity/ Reforms Postponed
Banking Reform /Privatization Efforts
Banking Reform/ Privatization Results
(4) Planning /PIDC
Emphasis on Government Projects
Expansion of Public Sector
Infrastructure and Indepen-dent Power Producers
Unsettled Politics/Limited Institutional Reform
Source: Economic Survey 2006-07
Hafeez Sheikh
38
Pakistan has never been an attractive destination for foreign direct investment. These aid driven growth spurts curtailed the motivation – if there was any – of the country’s leaders to try and fundamentally transform the economy. The dependence on agriculture remained unaltered while industrialization occurred with stunted growth and limited diversification. The dependence on primary (including cotton textiles) exports has resulted in a net export-import gap, which is increasing every year. Therefore, sustainable growth has never been achieved. This curtailed motivation and the lack of effort manifests itself most visibly in limited revenue mobilization. Government income from taxes remains less than 12% of GDP. Furthermore, even when the fiscal space was available, the money was not spent wisely (in tackling structural problems), and its efficiency of use was poor (in low-impact, corruption ridden, uncompleted government schemes). In addition, the role of the government has been excessive throughout the period. Finally, human capital development was never properly targeted and lagging regions were largely ignored resulting in, among other things, growing disparities.
A lot of this has to do with the nature of Pakistan’s government; how it tries to do so much and ends up doing so little. Nonetheless, these growth spurts inevitably accompanied worsened distribution of income, conspicuous consumption and social stress.
IV. Recent Past – 3 Phases
1) Reformist (1999-2002)
We will consider the recent past as the General Pervaiz Musharraf era. Within this time period, there are three distinct phases. The first can be called the ‘reformist phase’. In my opinion, Musharraf felt that his rationale for being in power was to govern better than others. His early administration attempted to tackle the politically difficult – and longstanding – problems of the economy. People with good reputation and international reform experience were brought in. Efforts were made across the board to decentralize, and to manage finances better, especially at the level of the provinces, which had been a neglected area in the past. Some effort was made to mobilize taxes. A report was commissioned to suggest a methodology to make the government manageable and efficient. Deregulation and privatization were initiated and the business sector was involved in a dialogue on how to make the system more conducive to enhanced economic activity. The IMF program was adhered to and successfully completed.
Unfinished Agenda of Reforms
39
2) Mixed Period (2002-2006)
In the second phase, roughly corresponding to the period of the first three years of the political government, or around the end of 2002 to early 2006. This is a period in which the reforms were sustained in some areas, such as privatization for example. Some of the fiscal management policies remained sensible and yet it was seen that certain provincial governments began undoing the good work done earlier. The provincial devolution program itself came under assault by the provincial ministries. Both in the center and the provinces, political expediency took precedence over governance and with the changed international circumstances money began to flow in.
This flow of easy money had a profoundly negative consequence for reforms as it provided the cushion for complacency, fiscal extravagance and a premature and misplaced sense of self-congratulation. This “income effect” of aid, contributed towards irresponsible management, just when we had the growth momentum and we could have put the economy on a long run sustainable path.
3) Drift, Reversal/Inaction (2006-2008)
The last two years can be considered as the years of gradual drift. Fiscal extravagance became the norm; a self-congratulatory tone crept in. Difficult, and even not so difficult decisions, were postponed. Issues of ultra importance to the country remained unsettled even though their settlement was within grasp.
Thus Pakistan had an unsteady domestic situation and this coincided with external events that were both good and bad: good, because the regional economy had been in a very dynamic state. India, China, Iran, the Gulf countries were experiencing unprecedented growth and economic activity.1 At the same time, other events happening in the global economy threatened Pakistan’s fragile gains. Some of these adverse developments were the increases in the prices of oil and agricultural commodities. Pakistan’s response to these changes has been hardly adequate.
Policies, which needed to be sharply tailored, remained static. The absolute requirement for domestic adjustment to the price of oil was 1 China for example, did what no country could do in history: achieve sustained double digit growth rates for over twenty five years. Despite being an ally and geographically connected to China, we have failed to leverage this dramatic economic development next door.
Hafeez Sheikh
40
ignored. Similarly, the potential for benefiting from the agricultural boom was not realized. These lapses created difficulties for the incoming government and made the process of adjustment more painful for the economy. Some of the emerging difficulties of Pakistan’s economy are summarized in Table-2. These just give a snapshot of the economy’s alarming condition.
Table-2: Deteriorating Fundamentals of 2007-08
• Fiscal deficit > 6.5% as a percentage of GDP • Increase in government expenditure by 33.1% • Interest on domestic debt increased by 10.7% • Increase in direct taxes: 14.8% • Inflation > 12% • Current account deficit: 8.4% of GDP • Decline in textile exports of about 2.5% • Stagnation in FDI: 0.25% growth • Stalled privatization • LSM growth declined by 50% from 8.6% to 4.8% • Widening regional disparities • Country wide power outages
• Unchecked bloated (and growing) government
Source: Pakistan Economic Survey 2007-08
V. Excessive Role of Government
Returning to the thesis statement, the key issue is the need for reorienting, reducing and reforming the government. The defining point for this discussion is that the role for government is crucial, but it should not be all encompassing, as in the case of Pakistan. This role must be defined and its limits ought to be clearly marked.
Successive governments have tried to reduce the government’s role in the commercial industrial sectors through privatization. Figure-1 shows the results of the success of privatization under different periods. The figures are only until 2005-06 as no activity has taken place since then. This gives further evidence of the diminished resolve on the reform front in the last two years. Huge progress was made in this area during the three year period of 2002-05, when 34 transactions worth $5 billion were concluded in a transparent manner.
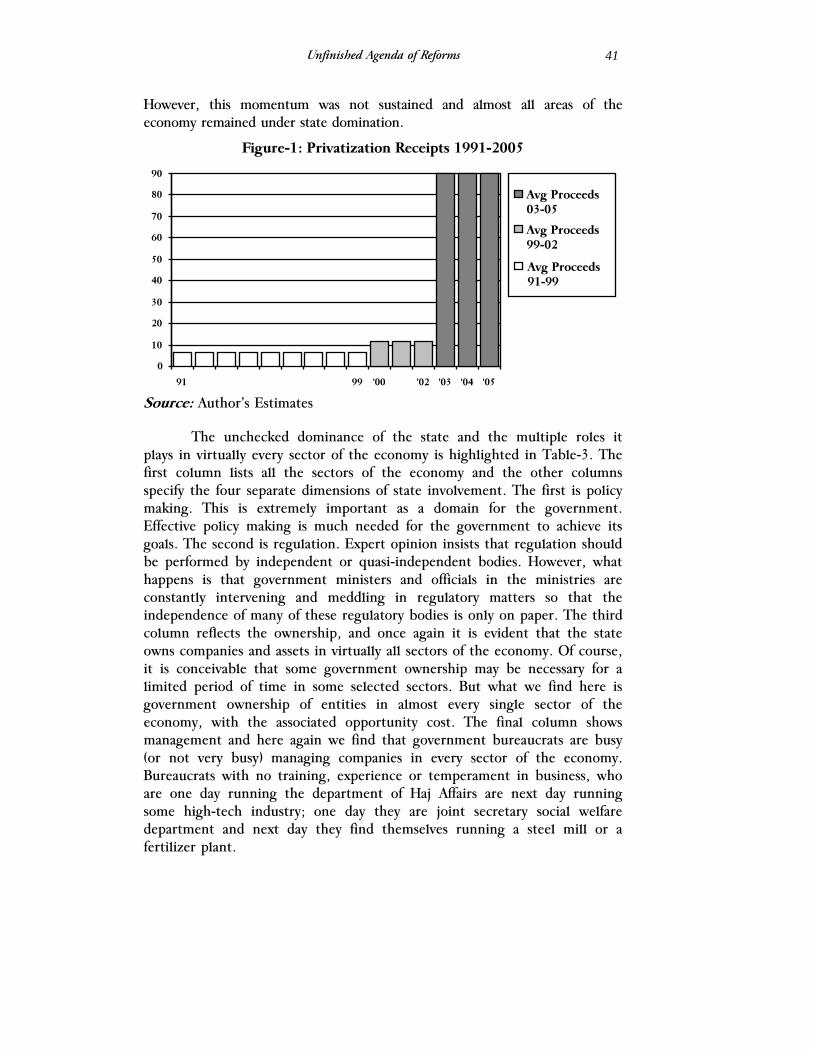
Unfinished Agenda of Reforms
41
However, this momentum was not sustained and almost all areas of the economy remained under state domination.
Figure-1: Privatization Receipts 1991-2005
Source: Author’s Estimates
The unchecked dominance of the state and the multiple roles it plays in virtually every sector of the economy is highlighted in Table-3. The first column lists all the sectors of the economy and the other columns specify the four separate dimensions of state involvement. The first is policy making. This is extremely important as a domain for the government. Effective policy making is much needed for the government to achieve its goals. The second is regulation. Expert opinion insists that regulation should be performed by independent or quasi-independent bodies. However, what happens is that government ministers and officials in the ministries are constantly intervening and meddling in regulatory matters so that the independence of many of these regulatory bodies is only on paper. The third column reflects the ownership, and once again it is evident that the state owns companies and assets in virtually all sectors of the economy. Of course, it is conceivable that some government ownership may be necessary for a limited period of time in some selected sectors. But what we find here is government ownership of entities in almost every single sector of the economy, with the associated opportunity cost. The final column shows management and here again we find that government bureaucrats are busy (or not very busy) managing companies in every sector of the economy. Bureaucrats with no training, experience or temperament in business, who are one day running the department of Haj Affairs are next day running some high-tech industry; one day they are joint secretary social welfare department and next day they find themselves running a steel mill or a fertilizer plant.
0
10
20
30
40
50
60
70
80
90
91 99 '00 '02 '03 '04 '05
Avg Proceeds 91-99
Avg Proceeds 99-02
Avg Proceeds 03-05
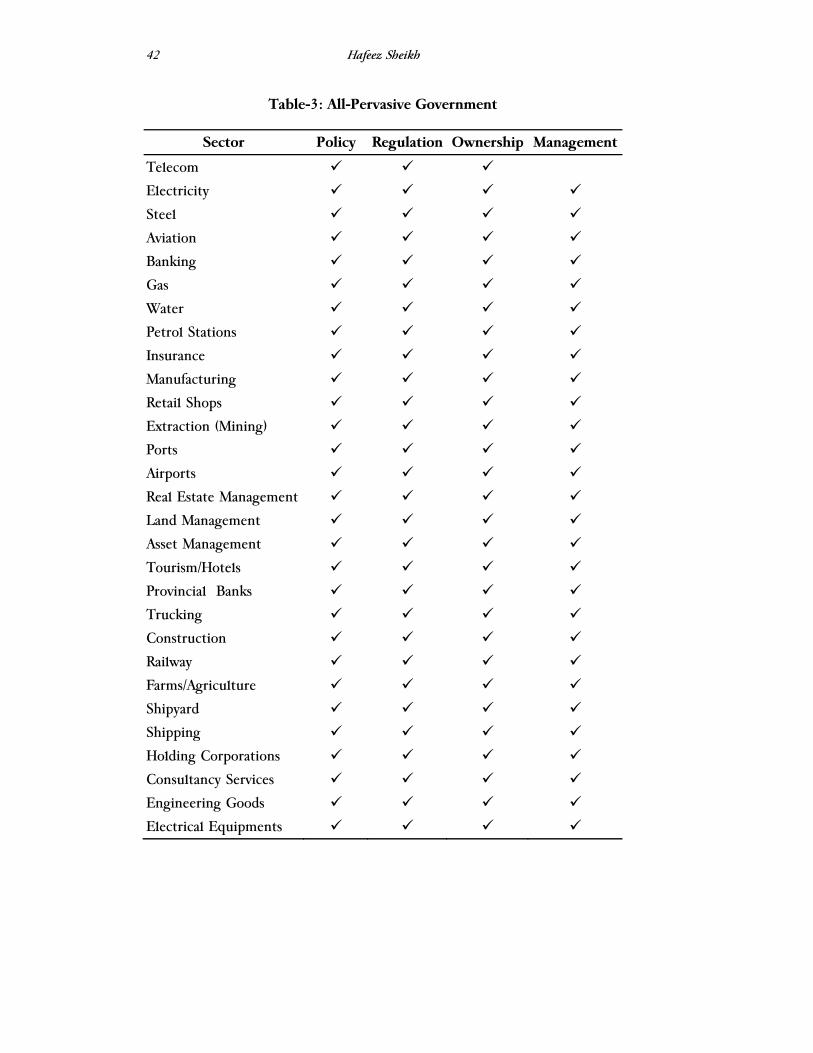
Hafeez Sheikh
42
Table-3: All-Pervasive Government
Sector Policy Regulation Ownership Management
Telecom
Electricity
Steel
Aviation
Banking
Gas
Water
Petrol Stations
Insurance
Manufacturing
Retail Shops
Extraction (Mining)
Ports
Airports
Real Estate Management
Land Management
Asset Management
Tourism/Hotels
Provincial Banks
Trucking
Construction
Railway
Farms/Agriculture
Shipyard
Shipping
Holding Corporations
Consultancy Services
Engineering Goods
Electrical Equipments

Unfinished Agenda of Reforms
43
Therefore, it can be said that while it appears that a lot has been done in the area of privatization, in reality, very little has been accomplished. In fact, the government continues to be massively and unproductively engaged in industry, while ignoring its primary areas of responsibility. Thus there is a lot of unfinished work to be done in this reform area.
The key reform issue is that with the government proliferating in every area, and being so stretched, will it have time to make sensible policies? If government officials are busy trying to do everything else, who will do their jobs? (See Box 1) If the government machinery does not work, all recommendations will be futile.
Box 1: Busy Bureaucrats
I will give a personal example of the excessive role of government. When I was the Minister for Finance and Planning in Sindh, I noticed that the Additional Chief Secretary (who heads the Planning and Development Department) was tremendously busy and traveling all the time. So I asked him to make a list of all the committees that he was chairing. It turned out that he was the chairman of 147 committees. Now if you allow for all the holidays and leaves and traveling to Islamabad and back, there is hardly any time left for one meeting per year per committee. Clearly no serious issue can be tackled in this way and the results of government performance are proof of this overreach.
The extent of government pervasiveness and its ineffectiveness can be seen from the following example: The fisheries sector in Pakistan has about thirty different agencies involved in its functioning. These comprise of about thirteen different ministries, departments and agencies at the federal level, and eighteen at the provincial level. At least seven ministries and departments are in direct control of the sector. What is the outcome of this? A newspaper headline stating: “EU bans seafood from Pakistan.”
VI. What to do
It is important, at the outset to recognize that a successful development strategy – and its implementation – requires that we do many things right.
A few years ago the World Bank had convened some of the economic gurus, practitioners and analysts to talk about some of the lessons they had learnt from their participation and study of the development experience of the 1990s. A consensus appeared on the central role of

Hafeez Sheikh
44
institutions in sustaining development. The following quote from Larry Summers, President, Harvard University, helps summarize this view:
“(an) overwhelming lesson… We have learned in the 1990s, is … the transcendent importance of the quality of institutions and … the efficacy of political administration.”
I think for a new government – any new government - the first thing to be done is to signal intentions. To convey, in an effective way, to the economic stakeholders – both domestic and international – that they are serious, that they mean business. These signals have to be communicated through actions and not speeches. In today’s ‘cut and paste’ world, everyone is making the speech from the same hard disk, and economic agents heavily discount speeches of policy makers focusing almost exclusively on their deeds. The action areas that will most effectively communicate the government’s intentions in the early part of their tenure and help rally the confidence and support of the economic stakeholders are discussed below. Undoubtedly, if the government takes early and serious action in these areas, it will be a good start and set the platform to build upon.
1) Tackle Bloated Government
The first and most important signal we can send is to tackle the bloated government. Every single reform has to start with that. Pakistan, for a long period had 32 ministries and then all of a sudden, the number was increased to 71. At the least we should go back to having 32 ministries. This paper will avoid getting into details in this regard. It is common knowledge that there is a lot of waste and unproductive expenditure and cutting that in an efficient manner is at the heart of signaling, as well as fiscal management.
2) Reform Annual Development Program
The Annual Development Program (ADP) – which many think has little to do with actual development, but has a lot to do with people in positions of power, bureaucrats and contractors and their friends to make money. Because of the fiscal space of the last few years, these ADPs have expanded with the mushrooming of ill-advised, politically motivated schemes. It is imperative that such schemes are checked in order to control government waste.
It is necessary to get a handle on the ADP, as it is mostly a colossal waste of resources with very little impact in terms of real development or affecting the quality of life of Pakistan’s citizens. The new government can
Unfinished Agenda of Reforms
45
send a very strong signal by reforming this area of unchecked governance (See Box 2).
Box 2: The ADP: A Need for Reform
When I started working in the Finance Ministry in Sindh, I discovered that there were roughly 1100 schemes as part of the ADP. And I can say without exaggeration that hardly any scheme – apart from some roads (of poor quality) – ever were successfully completed. And I am willing to challenge anyone to show me that even ten percent of the thousands of schemes launched over the last 60 years were actually completed, and are operational.
In one district HQ, Jacobabad, there is a water scheme that has been going on for the last twenty years and still it is not completed. The President, the Prime Minister, the Senate Chairman, all have inaugurated it, yet, it is still not operational.
Again, to go back to my own personal experience, during my first year in Sindh, we focused on completing projects instead of starting new ones as part of the reforms. A few schemes were actually completed out of the 1153 schemes on the books. Nonetheless, I recently met a senior official of the Sindh Government and asked him about the number of ADP schemes which were currently in place. His answer was: 7500.
The situation is no different at the Center. We were at National Economic Council (NEC) about two years back; the NEC is the highest economic decision making body where the ADPs get approved. The Prime Minister and virtually every important person in the government attends the NEC. You are given a document of around a thousand pages ten minutes before the meeting in which the ADP is approved. All these schemes are mentioned in these pages. These schemes are finalized based on cursory glances at their contexts and are passed on by the cabinet. In a one page summary, it shows how much money is allocated to a given sector, the next column shows the allotted budget, another column is about how much has been released and the final column explains how much is being actually utilized.
I would like to quote an interesting case of the water sector. About 290 billion rupees had been allocated for the water projects, the summary showed that 10 billion had been released and that in three quarters of the year, 2 billion had been spent. I raised the point that at this rate, spending two billion per year on projects totaling 290 billion would mean that the time required to complete them would be 145 years.
Hafeez Sheikh
46
3) Privatize, Deregulate and Involve Private Sector in Infrastructure
Upgradation of the infrastructure – especially electricity production- is an important area for further development. The failures of previous governments in this area have created a crisis situation both for the economy and the new government. However, it is important to note that if, in order to address the problem, the government resorts to public sector projects via the ADP, it will undoubtedly result in failure. The private sector must be given incentive to invest its capital in the creation of infrastructure; and the role of the government should be limited to policy making and designing of these incentives.
VII. Conclusion
Let me end this paper by giving a very simple yet inspiring example of how technology has advanced in Pakistan, despite its political and economic shortcomings. This will reveal my optimism and suggest that things can be done if we adopt the right approach. Fifteen years back, getting a telephone connection meant waiting for years. Now, in 2008, it only takes a few minutes. So I want you to think about it. What once sounded like an insurmountable problem was tackled simply by having sensible policies, with the right policy mix, reorientation of the role of the government and the private sector along with appropriate incentives. The lesson – an optimistic one- is that it can be done.
The Lahore Journal of Economics Special Edition (September 2008): pp. 47-62
Rethinking Pakistan’s Development Strategy
Naved Hamid∗
Abstract
The objective of this paper is to set out the key components of a development strategy for Pakistan. A fundamental premise of our analysis is that the world economic environment is changing dramatically and a development strategy today must position itself to take advantage of the changes taking place. The paper is divided into five sections: First, we provide a brief review of Pakistan’s experience with development strategies so far. Next, we discuss the changes that have occurred, or are taking place in the global economy, which have strategic relevance for Pakistan. In the third section we look at the current situation in Pakistan with regard to the potential drivers of growth, based on the earlier discussion of the global developments. In the final section key elements of an alternative development strategy for Pakistan are outlined.
JEL Classification: O11, O20, O40
Keywords: Development Strategy, Growth, Globalization
I. Evolution of Development Strategy in Pakistan – A Brief Economic History
Like most developing countries, in the 1950s and 1960s, Pakistan pursued a development strategy aimed at promoting industrialization through import substitution policies and planning, with the state playing the leading role. However, unlike many other countries public enterprises in the manufacturing sector in Pakistan were set up to show the way to the private sector and many were subsequently sold to private entrepreneurs. Also, manufactured exports were encouraged through a system of multiple exchange rates. Pakistan’s development strategy was clearly articulated by Mahbub-ul-Haq (1966), Pakistan’s Chief Economist in the 1960s, in his seminal work “The Strategy of Economic Planning” and made operational ∗ Director, Centre for Research in Economics & Business (CREB), Lahore School of Economics. I want to acknowledge the excellent assistance of Mr. Muhammad Aqeel Akbar Chaudhry (Lahore School of Economics) in the preparation of this paper.
Naved Hamid
48
through the Second and Third Five Year Plans. The strategy was extremely successful in accelerating economic growth and Pakistan was seen as one of the few development success stories of the 1960s.
In the 1970s, during the Bhutto period (1972-1977), there was a reversal of the private sector led growth strategy. Pakistan shifted to the Indian development strategy, i.e., state led, heavy industry based industrialization strategy. Engineering, cement, oil refineries, chemicals and many other industries, together with shipping, banking, life insurance and power utilities were nationalized. Export trade in rice and cotton was made a state monopoly. An ambitious public sector investment program in heavy industry was launched. The first oil crises, together with the massive public investment program and the large increase in other development expenditures led to ballooning fiscal and current account deficits. The nationalizations led to a drying up private investment and economic growth slowed sharply, and so Pakistan’s first growth episode came to an end.
The Zia government that took power following a military coup in 1977 started a gradual process of reversing policies of the previous six years. The development strategy of this period can best be described as a mixed economy, import substitution strategy. Industries were slowly de-nationalized, but the massive public sector investment program in heavy industry was continued. There was some trade liberalization, but the investment licensing system was retained and the state’s monopoly on cotton exports was used to tax cotton production and to provide huge incentives to the textile spinning industry. In the case of sugar, restrictions on imports and zoning regulations for sugar mills were continued and provided excessive profits in the sugar industry. State ownership of the banking sector was maintained and used to channel funds at low interest rates to cronies.
However, because of the Afghan war there were large capital inflows in the form of assistance from the U.S and International Financial Institutions. These inflows were supplemented by a sharp increase in workers’ remittances. As a result in the 1980s, Pakistan experienced rapid economic growth. However, the economic policies gave rise to an inefficient and unbalanced industrial sector. This consisted of a large and inefficient state owned basic industries sector (steel, engineering, fertilizers, cement, etc.) and an equally inefficient private large scale manufacturing sector concentrated in the rapidly expanding textiles and sugar industries. Growth was also not sustainable, as it was accompanied by growing fiscal and current account deficits financed by domestic borrowing and large inflows of foreign assistance. With the end of the Afghan war, capital inflows declined
Rethinking Pakistan’s Development Strategy
49
giving rise to a balance of payments crises in the late 1980s which brought Pakistan’s second growth episode to an end.
In the post 1988 period, Pakistan adopted the policy package associated with what is popularity known as, the “Washington Consensus”. First, the democratic governments from 1988 to 1999, and subsequently the Musharraf Government implemented widespread policy reforms including privatization, investment deregulation, trade liberalization, financial liberalization and tax reforms. Also since the governments during this period found it difficult to maintain fiscal discipline, they were forced to implement stabilization programs from time to time under the tutelage of the IMF. Thus in the last two decades Pakistan has experienced “Stop-go” growth, with the longest expansion being from 2003 to 2008.
In period 1988 to 1998, despite many changes of Government, there was a basic continuity of policies. However, this set of policies cannot be said to constitute development strategy. The assumption seems to have been that these policies would somehow put the country on a high and sustained growth path. Unfortunately, as was the experience of many developing countries in 1990s, they did not. One of the lessons of 1990s is that countries need to pursue growth strategies, not just stabilization and efficiency gains (World Bank, 2005; Rodrik, 2006).
II. Development Strategy in a Changing World
For most people, development strategy is synonymous with industrialization strategy. This is not surprising, historically; the way to economic development has been through industrialization. Both import substitution strategies, popular in the 1950s and 1960s, and export-oriented growth strategies advocated in the 1980s and 1990s were industrialization strategies. Based on historical experience, it is generally accepted that there are three stages of development, i.e., the traditional agriculture stage, followed by the manufacturing or industrial stage, and finally the “post-industrial” or the services stage. Within the manufacturing stage, there is also supposed to be a certain order with textiles and light consumer industry being the starting point (Rostow, 1960). Thus, if a country does not follow this ‘natural progression’ in its development process, economists talk of it ‘skipping a stage’ rather disapprovingly.
In my view in this era of globalization and emerging new technologies, there is a need to de-link development strategy from industrialization strategy. In an earlier paper, I had argued that exports of Information Technology (IT) and IT Enabled Services (ITES) could play a
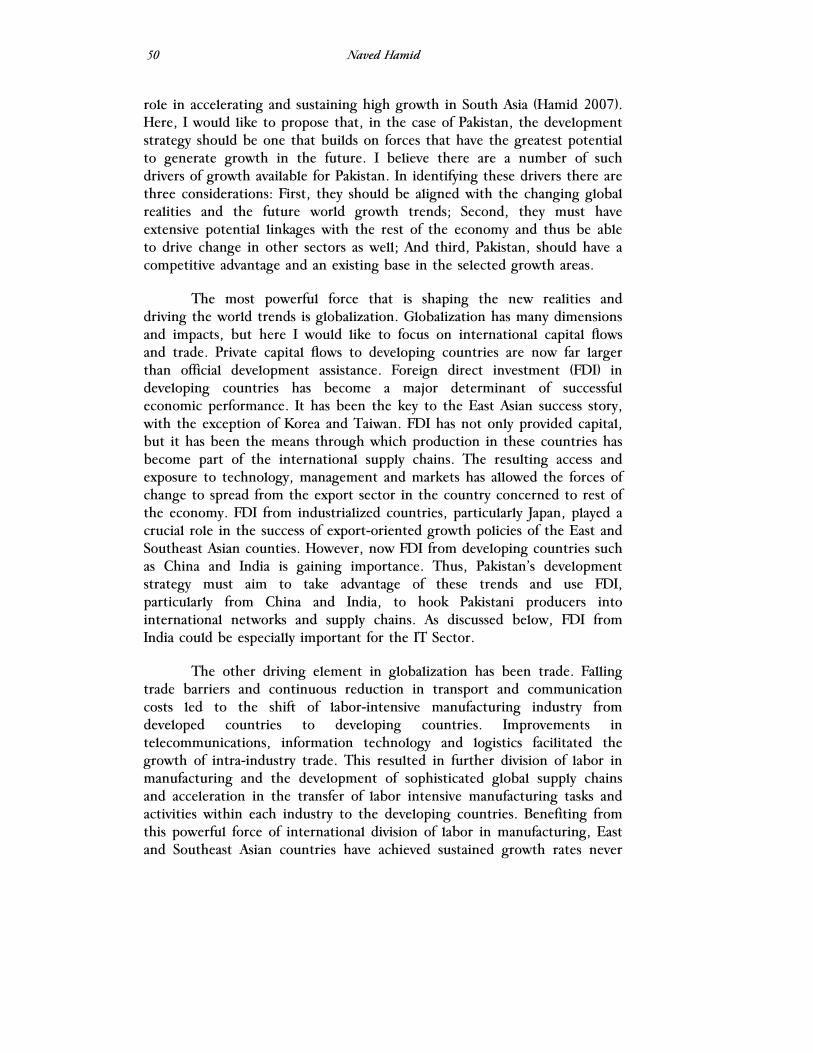
Naved Hamid
50
role in accelerating and sustaining high growth in South Asia (Hamid 2007). Here, I would like to propose that, in the case of Pakistan, the development strategy should be one that builds on forces that have the greatest potential to generate growth in the future. I believe there are a number of such drivers of growth available for Pakistan. In identifying these drivers there are three considerations: First, they should be aligned with the changing global realities and the future world growth trends; Second, they must have extensive potential linkages with the rest of the economy and thus be able to drive change in other sectors as well; And third, Pakistan, should have a competitive advantage and an existing base in the selected growth areas.
The most powerful force that is shaping the new realities and driving the world trends is globalization. Globalization has many dimensions and impacts, but here I would like to focus on international capital flows and trade. Private capital flows to developing countries are now far larger than official development assistance. Foreign direct investment (FDI) in developing countries has become a major determinant of successful economic performance. It has been the key to the East Asian success story, with the exception of Korea and Taiwan. FDI has not only provided capital, but it has been the means through which production in these countries has become part of the international supply chains. The resulting access and exposure to technology, management and markets has allowed the forces of change to spread from the export sector in the country concerned to rest of the economy. FDI from industrialized countries, particularly Japan, played a crucial role in the success of export-oriented growth policies of the East and Southeast Asian counties. However, now FDI from developing countries such as China and India is gaining importance. Thus, Pakistan’s development strategy must aim to take advantage of these trends and use FDI, particularly from China and India, to hook Pakistani producers into international networks and supply chains. As discussed below, FDI from India could be especially important for the IT Sector.
The other driving element in globalization has been trade. Falling trade barriers and continuous reduction in transport and communication costs led to the shift of labor-intensive manufacturing industry from developed countries to developing countries. Improvements in telecommunications, information technology and logistics facilitated the growth of intra-industry trade. This resulted in further division of labor in manufacturing and the development of sophisticated global supply chains and acceleration in the transfer of labor intensive manufacturing tasks and activities within each industry to the developing countries. Benefiting from this powerful force of international division of labor in manufacturing, East and Southeast Asian countries have achieved sustained growth rates never
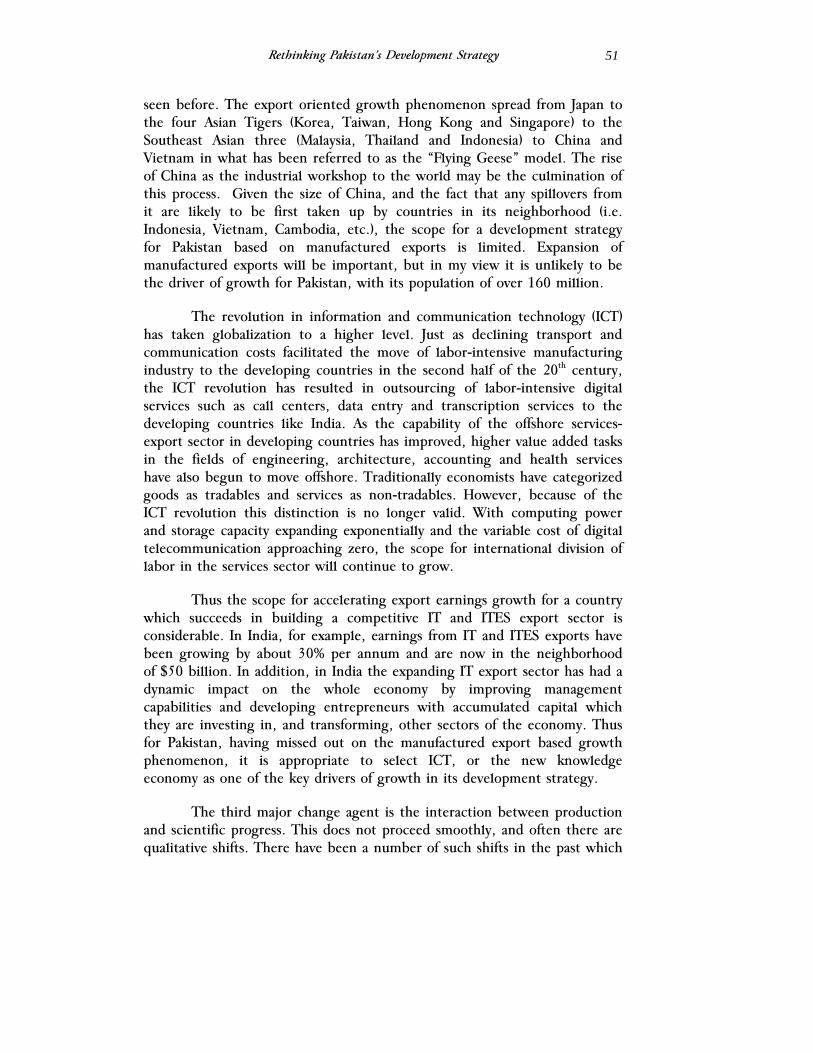
Rethinking Pakistan’s Development Strategy
51
seen before. The export oriented growth phenomenon spread from Japan to the four Asian Tigers (Korea, Taiwan, Hong Kong and Singapore) to the Southeast Asian three (Malaysia, Thailand and Indonesia) to China and Vietnam in what has been referred to as the “Flying Geese” model. The rise of China as the industrial workshop to the world may be the culmination of this process. Given the size of China, and the fact that any spillovers from it are likely to be first taken up by countries in its neighborhood (i.e. Indonesia, Vietnam, Cambodia, etc.), the scope for a development strategy for Pakistan based on manufactured exports is limited. Expansion of manufactured exports will be important, but in my view it is unlikely to be the driver of growth for Pakistan, with its population of over 160 million.
The revolution in information and communication technology (ICT) has taken globalization to a higher level. Just as declining transport and communication costs facilitated the move of labor-intensive manufacturing industry to the developing countries in the second half of the 20th century, the ICT revolution has resulted in outsourcing of labor-intensive digital services such as call centers, data entry and transcription services to the developing countries like India. As the capability of the offshore services-export sector in developing countries has improved, higher value added tasks in the fields of engineering, architecture, accounting and health services have also begun to move offshore. Traditionally economists have categorized goods as tradables and services as non-tradables. However, because of the ICT revolution this distinction is no longer valid. With computing power and storage capacity expanding exponentially and the variable cost of digital telecommunication approaching zero, the scope for international division of labor in the services sector will continue to grow.
Thus the scope for accelerating export earnings growth for a country which succeeds in building a competitive IT and ITES export sector is considerable. In India, for example, earnings from IT and ITES exports have been growing by about 30% per annum and are now in the neighborhood of $50 billion. In addition, in India the expanding IT export sector has had a dynamic impact on the whole economy by improving management capabilities and developing entrepreneurs with accumulated capital which they are investing in, and transforming, other sectors of the economy. Thus for Pakistan, having missed out on the manufactured export based growth phenomenon, it is appropriate to select ICT, or the new knowledge economy as one of the key drivers of growth in its development strategy.
The third major change agent is the interaction between production and scientific progress. This does not proceed smoothly, and often there are qualitative shifts. There have been a number of such shifts in the past which

Naved Hamid
52
have given rise to periods of rapid growth driven by the breakthrough that has taken place. For example, economic historians often divide the post-industrial revolution period into the mechanical, electrical, chemical and electronic eras. The next emerging era is likely to be that of genetics. While this will have profound implications for many sectors such as health, from the point of view of Pakistan the most important impact is likely to be the resulting biotechnology revolution. Agriculture biotechnology will impact both crop and animal productivity, through improved yields, resistance to disease, etc. The most controversial but significant of the improved biotechnologies are the transgenics, or genetically modified organisms. About 9 million farmers in China and India have adopted transgenic Bt cotton and it has reduced yield losses from insects and increased farmers’ profits, while also reducing pesticide use (World Bank, 2008).
Pakistan has a tremendous base in agriculture, and with the timely adoption of the continuously improving biotechnologies, it could initiate another green revolution. This green revolution would even more far reaching that brought by the high yielding varieties of wheat and rice in the 1960s and 1970s because it would not be limited to only a few crops but involve the whole range of crops and livestock. Thus agriculture growth driven by biotechnology should be at the forefront of any development strategy for Pakistan.
III. The New Drivers of Growth
The discussion above on the developments in the global economy has identified two potential growth areas for Pakistan, i.e. the ICT sector and a biotechnology driven agriculture sector. However, for the full potential of agriculture as a leading sector to be realized it must move into high value added products and for that it must be linked into the global supply chains. Pakistan has so far failed to become part of the global supply chain in any industry, and therefore for agriculture to achieve this will be the most difficult part. However, fortunately it is possible for Pakistan to be part of the FDI driven ‘modern retailing’ revolution taking place in other developing countries. If Pakistan can catch the emerging fourth wave of supermarket growth in developing countries, it would automatically become part of the international agriculture and agro-food industry supply chain. These three drivers of growth are discussed in more detail below.
A. The Knowledge Economy
As D’Costa (2006) puts it “there is increasing recognition that knowledge-based economic activities are the key to international
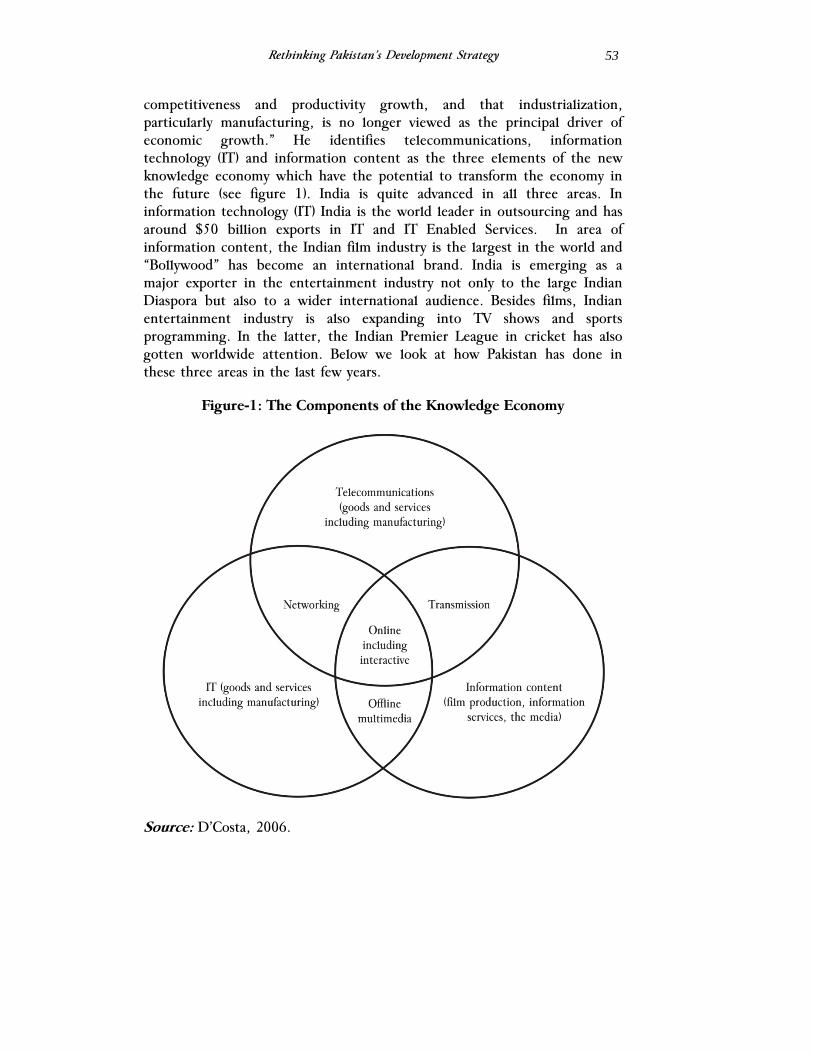
Rethinking Pakistan’s Development Strategy
53
competitiveness and productivity growth, and that industrialization, particularly manufacturing, is no longer viewed as the principal driver of economic growth.” He identifies telecommunications, information technology (IT) and information content as the three elements of the new knowledge economy which have the potential to transform the economy in the future (see figure 1). India is quite advanced in all three areas. In information technology (IT) India is the world leader in outsourcing and has around $50 billion exports in IT and IT Enabled Services. In area of information content, the Indian film industry is the largest in the world and “Bollywood” has become an international brand. India is emerging as a major exporter in the entertainment industry not only to the large Indian Diaspora but also to a wider international audience. Besides films, Indian entertainment industry is also expanding into TV shows and sports programming. In the latter, the Indian Premier League in cricket has also gotten worldwide attention. Below we look at how Pakistan has done in these three areas in the last few years.
Figure-1: The Components of the Knowledge Economy
Source: D’Costa, 2006.
Naved Hamid
54
1. Telecommunications
Telecoms industry has experienced rapid growth in Pakistan, which has been an outstanding performer in terms of growth in telecoms worldwide. Tele-density in 2007 was 47%, which was much greater than all of its neighbors (PTA Annual Report 2007 www.pta.gov.pk). Network coverage was 90% of the population and there were 77 million mobile phone subscribers. During the last 4 years (i.e., 2003-04 to 2006-07), investment in telecom sector in Pakistan was over $ 8 billion (about 12% of the total private investment during this period) of that over $ 4 billion was in the form of FDI (about 40% of the total FDI during this period). In terms of employment generation, 1.4 million people were employed, directly or indirectly, in this sector, which is about 7% of the total non-agricultural employment in the country. This figure includes the 0.5 million people employed through Public Call Offices and another 0.4 million people working in sales and franchise. Total revenue of the telecom Industry was Rs. 236 billion in 2006-07, and the total taxes paid were Rs. 100 billion, which was 11% of the government’s total tax revenue. In brief the telecoms industry in Pakistan has expanded rapidly in recent years and is now an important sector of the economy. There is great potential for continued expansion in number of users as well as in growth of value added services such as mobile internet and other data services, local content and information services, and mobile banking services.
2. Information Technology (IT)
According to the official balance of payments data, Pakistan had $150 million of exports in IT services in 2005-06. However, the official figures do not utilize the standard WTO methodology for calculating trade in services. India has adopted the WTO methodology for calculating exports of IT services, which not only adds the amount of services shipped abroad, but also the revenues of Indian companies and IT professionals that are based abroad. Using the WTO methodology for calculating trade in services, Pakistan IT export revenues were about $1 billion in 2005-06, and the total global revenue of IT industry were about $2.2 billion (Hussain, 2006). These figures seem quite reasonable, if we compare some of the key ratios between Pakistan and India. The above numbers imply a ratio between Pakistan and India for global IT revenue of 1:18 (1:38 for exports and 1:10 for domestic revenue); while in terms of IT personnel the ratio between Pakistan and India is 1:13 to 1:18 (estimates for IT professionals in Pakistan range from 54,000 to 75,000 compared with 965,000 in India), and the ratio for bandwidth usage was 1:10 (ibid). The direct contribution of the IT sector to the economy was about $1.5 billion in 2005-06 (direct exports of
Rethinking Pakistan’s Development Strategy
55
$150 million and domestic revenue of $1.35 billion), i.e. over 1% of the GNP.
Pakistan is considered one of the leaders in the second tier countries in the global ICT industry. Pakistan’s poor international image is a huge impediment for realizing its true potential in this industry. Other than that, Pakistan has more or less similar endowments, in terms of human resources, culture and language skills, as India. Thus Pakistan could become a major center for outsourcing purposes, if it could use its neighborhood advantage to leverage of India’s position as the leader in the field of IT outsourcing. The “Flying Geese” model, which worked so well in the East and Southeast Asia for spread of export industry from one country to another in the region, can be replicated in South Asia with IT outsourcing export industry spreading from India to other countries in the region. The development of the IT sector in India would have spillover effects to the other economies in the region. As the costs in the IT sector rise in established centers in India, firms look for less expensive locations and hence are moving into the smaller cities within India. However, if conditions permitted they could as easily move to locations in Pakistan (this we refer to as the neighborhood effect), but current restrictions on investment and trade prevent Indian IT firms from locating in Pakistan. Pakistan could get around the ‘poor image’ issue by forming joint ventures with Indian firms, who have the expertise and market connections. Also, management in the IT sector is a skill that has to be learnt, and Indian firms have developed the skills to run call centers employing large numbers of persons and the transfer of such management skills to local firms could be another spillover from such arrangements. Thus opening up investment and trade with India in the IT sector could help Pakistan establish itself as a global force in this sector.
3. Information Content
Pakistan is going through a media revolution. There are now 70 private satellite TV channels and 74 private FM radio stations, and new ones are being added every day. There are 350 newspaper dailies, and 560 magazines. There are 1600 licensed cable operators, and 3.5 million cable subscribers. It is reported that GEO TV has 10 million viewers, and the revenue of electronic media industry is over Rs. 8 billion (Planning Commission, 2008). Investment in satellite and cable industry is over Rs. 10 billion, and another Rs. 10 billion has been invested in the print media. In terms of content, there is great diversity and, while the quality is uneven, it has a large international market among the Pakistani Diaspora and in some areas such as pop music it is competitive even in a wider international market. In brief, the information content industry has also grown rapidly
Naved Hamid
56
and, while it may not be as competitive as India, it has the potential to be an important source of employment and even service exports.
Thus we can see that in recent years, Pakistan has done extremely well in all sectors of the “new knowledge economy”. Moreover, it is evident that Pakistan has considerable potential in these areas and with the right policies they could continue to expand rapidly. It is important to realize that, as stated earlier, these sectors are likely to be the key to international competitiveness and productivity growth in the future and have the potential to be an important driver of economic growth in Pakistan. It is necessary to recognize this, and not to see these activities as merely consumption – and luxury consumption at that – to be throttled by excessive taxation as is being done currently.
B. Agriculture Biotechnologies – The Next Green Revolution
Pakistan with the largest contiguous canal irrigation system in the world, diversity of climatic zones, rich soils and centuries of farming tradition has considerable competitive advantage in agriculture. Most of Pakistan’s exports are directly or indirectly based on agriculture, e.g., rice, cotton textiles, leather and leather products, fruits and processed food products. Pakistan is also one of the largest milk producers in the world. This is despite the fact that crop and milk yields are among the lowest in the world. These two contrasting realities are an indicator of the huge potential of agriculture sector as a driver of growth in Pakistan. The new agriculture biotechnologies have made it possible for Pakistan to realize this potential because of the possibility of a quantum jump in yields across a broad range of crops and livestock. With a large majority of the population dependent directly or indirectly on agriculture, including livestock, and the high levels of poverty in rural areas, accelerating agriculture growth is likely to have a greater impact on incomes and poverty in Pakistan than any other sector. Below we discuss the experience of Bt cotton in India and hybrid maize in Pakistan to show what is possible with the available biotechnologies and the right policies.
In 1998, Monsanto was negotiating with the Government for the introduction of genetically engineered cotton seeds in Pakistan. The new Government in 1999 abandoned these plans, not because of any ethical or environmental concerns, but because the bureaucracy convinced the decision makers that these seeds should be developed by the public sector. The argument ran along the usual lines, that the foreign multinational corporation will exploit the poor farmers by providing seeds for a vital crop such as cotton at exorbitant prices. Moreover, there is not much to the
Rethinking Pakistan’s Development Strategy
57
technology and it can be cheaply developed in the public sector and Bt seeds can be made available to the poor farmers at a nominal cost. As a result, Bt cotton seeds are still not available to farmers in Pakistan and cotton production is stagnating while farmers have to spend huge amounts on pesticides to barely maintain past yields.
In contrast, in India Monsanto’s Bt cotton seeds were approved for cultivation in 2002. In 5 years cotton production in India increased from less than 15 million bales to over 27 million bales, with yields increasing by about 60%. The farmers in India are also using less pesticides because of the built in pest resistance of Bt cotton seeds, and apparently even the quality of the fiber is better since it does not suffer from pest damage. Thus in five years, India has gone from being one of the largest importers of cotton to an exporter. Pakistani farmers are, however, using Bt cotton seeds smuggled from India which are not necessarily suited for agriculture conditions in Pakistan. Thus Pakistani farmers are paying the higher prices, but not the getting the full benefits of Bt cotton seeds.
The other story is a happier one. Hybrid maize varieties were introduced in Pakistan in the 1990s by a multinational corporation. The government did not interfere because it did not consider maize to be a vital crop like cotton. As a result maize production in irrigated Punjab increased from 0.75 million tons in 1999-2000 to 2.26 tons in 2005-06, i.e., by over 200%, while yields increased by over 100%. In brief there has been a revolution in maize production in the last decade because of biotechnologies, but not many people have heard of it.
There are several lessons from these two contrasting stories. First, as most agriculturists’ know, in Pakistan the Government and the bureaucracy are the problem rather than the solution. Second, the international seed companies have the knowledge of agriculture biotechnologies and the experience to distribute them in developing countries. They don’t force farmers to buy their seeds, and if the seeds don’t give value for money they will not be able to sell them. Therefore, the role of the Government should be to provide a supportive policy and regulatory framework for encouraging international seed companies to set up operations in Pakistan. As a regulator, the Government’s role should be to ensure observance of quality, environmental, safety and health standards on the one hand, and safeguard the intellectual property rights of the seed companies on the other.
Besides this, as far as agriculture is concerned, the Government should concentrate on building and maintaining rural and irrigation
Naved Hamid
58
infrastructure, modernizing agriculture marketing regulations and market infrastructure, and investing in human development in rural areas. It is evident that with the right policies and equitable investment – agriculture contributes over 20% to the GDP, but receives hardly 5% of the public investment – in rural infrastructure and human development, a biotechnology led revolution in agriculture is possible and that should be one of the pillars of Pakistan’s development strategy.
C. Modern Retailing – Linking Agriculture to World Markets
Globalization has many implications, but one that I want to discuss is the growth of modern retailing, i.e., supermarkets. Starting in the 1990s, there has been a phenomenal expansion of supermarkets in developing countries (Reardon and Berdegue, 2006). A key factor in this rapid growth has been FDI. The dominant players in FDI are five companies, Carrefour, Wal-Mart, Ahold, Metro and Tesco, which together have $600 billion in sales. Out of these, Metro already has supermarkets in Karachi, Lahore and Islamabad, and Carrefour has announced plans to open stores in Pakistan. These global players not only aim to expand their retailing activities in the developing countries, but also integrate these countries into their global supply chain.
The spread of supermarkets has taken place in waves, with India being a third-wave country with the process starting in 2004 and Pakistan seems to be part of the fourth emerging wave. In the second-wave countries, the supermarkets’ share of the retail market went from 5-10% in 1990 to 30-50% in early 2000s (ibid). Figure 2, which plots the share of supermarkets in retail food against the level income of a country, shows that the share rises very sharply between incomes of 2000 and 5000 Purchasing Power Parity (PPP) dollars. Pakistan’s per capita GDP today is around 2500 PPP dollars and on that basis, according to the fitted curve, supermarkets should account for about 20% of the retail food trade, but currently their share in Pakistan is almost negligible. What that means is that once supermarkets begin to expand in Pakistan, there share will increase rapidly and one can expect that by 2015 supermarkets will be major players in the retail market in the country.
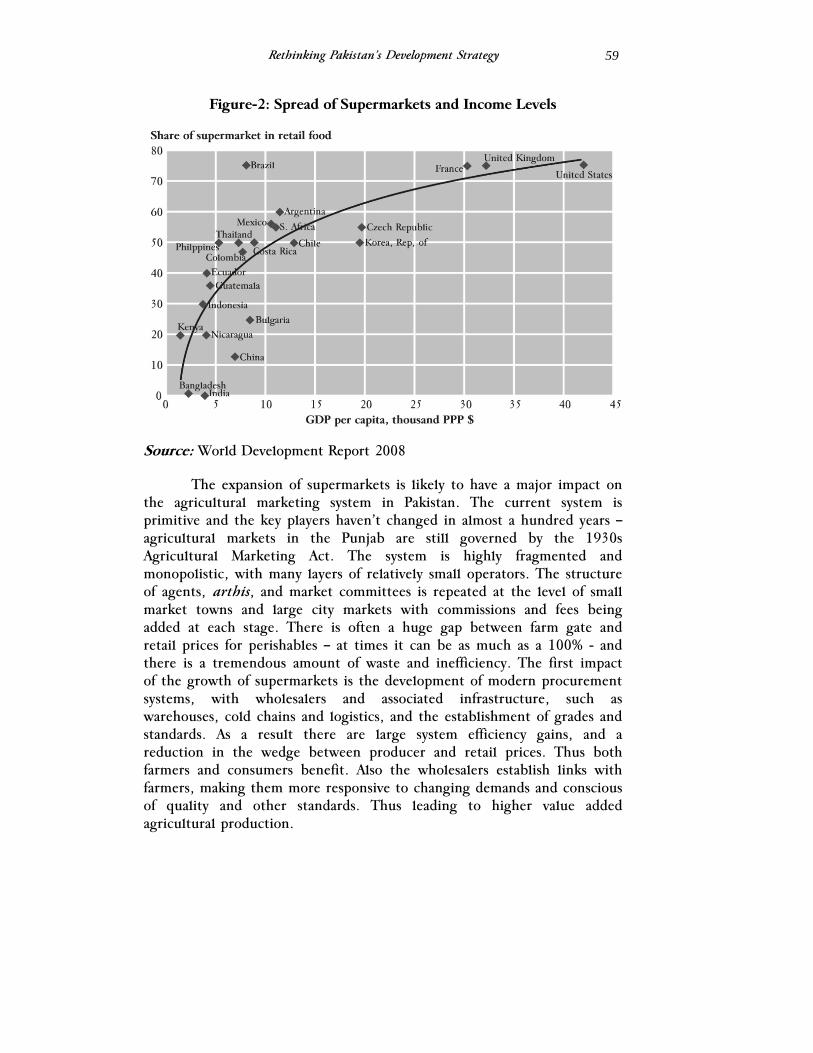
Rethinking Pakistan’s Development Strategy
59
Figure-2: Spread of Supermarkets and Income Levels
Source: World Development Report 2008
The expansion of supermarkets is likely to have a major impact on the agricultural marketing system in Pakistan. The current system is primitive and the key players haven’t changed in almost a hundred years – agricultural markets in the Punjab are still governed by the 1930s Agricultural Marketing Act. The system is highly fragmented and monopolistic, with many layers of relatively small operators. The structure of agents, arthis, and market committees is repeated at the level of small market towns and large city markets with commissions and fees being added at each stage. There is often a huge gap between farm gate and retail prices for perishables – at times it can be as much as a 100% - and there is a tremendous amount of waste and inefficiency. The first impact of the growth of supermarkets is the development of modern procurement systems, with wholesalers and associated infrastructure, such as warehouses, cold chains and logistics, and the establishment of grades and standards. As a result there are large system efficiency gains, and a reduction in the wedge between producer and retail prices. Thus both farmers and consumers benefit. Also the wholesalers establish links with farmers, making them more responsive to changing demands and conscious of quality and other standards. Thus leading to higher value added agricultural production.
Naved Hamid
60
In addition to backward linkages, supermarkets are also part of the global supply chains and procure on behalf of their sister stores in other countries. Thus once production in Pakistan begins to meet international quality and quantity requirements, they will begin to supply some agriculture products to stores in other countries from Pakistan. Thus Metro Pakistan may supply kinoos, mangoes, basmati rice, prawns, etc., to Metro stores in Russia or Turkey, just as it might get lentils, olives, etc., from there for its stores in Pakistan. Thus high value agriculture for international markets will be promoted in Pakistan.
Therefore, it is important to support the growth of modern retailing in Pakistan through appropriate policies and, where necessary, investment in infrastructure. However, at the same time it is important to assist small farmers by facilitating the formation of marketing cooperatives so that they too can fully benefit from the higher prices and the expanding market for high value agricultural products. Similarly, small shopkeepers in big cities may need support as they are likely to be most affected by increased competition from the expansion of supermarkets.
IV. Conclusion
The main components of the proposed development strategy are the knowledge economy, biotechnology driven agriculture growth and strong support for development of a modern retailing sector. There are obvious linkages between these three, but more important are the linkages between them and other growth areas in the economy. For example, expansion of supermarkets in Pakistan will not only help the agriculture sector link into global supply claims, but it will also facilitate the development of such linkages for the export oriented manufacturing sector. Moreover, investments needed to support these drivers of growth will also benefit other sectors, and may open up new internationally competitive avenues. These sectors need investment and policies supporting education and human development, agriculture research, and science and technology, which can open up the possibilities of developing export-oriented higher education and medical services capability. For export oriented agriculture sector to succeed the current anti-export bias of macro policy, particularly exchange rate policy, will have to be neutralized, which in turn will also benefit export oriented manufacturing, as well as tradable production for the domestic economy.
Besides, macro and sectoral policy changes, there will be a need to restructure the public sector development program. Fortunately, a large part of the infrastructure investment requirements of the selected sectors, such
Rethinking Pakistan’s Development Strategy
61
as in fiber optic cables, broadband connectivity, international gateways and uplink facilities, supermarkets infrastructure, etc., will be met by the private sector itself, provided a supportive policy framework is in place. However, public investment in the soft sectors, particularly education, and in improving the quality of urban infrastructure will need to be greatly increased. The latter is necessary because livable cities are essential for the successful development of a high value services-export sector.
To conclude, the potential and opportunities are there for Pakistan to achieve sustained high growth. Hopefully, this paper provides a rough sketch of a development strategy that can help Pakistan to do this. However, since these ideas are different from the usual manufacturing focused development strategy approach, they may be difficult to accept. To traditional economists, I would like to say that in this strategy I am not suggesting that there is no role for the manufacturing sector but only that the drivers of the proposed strategy are different. In pursuing this strategy we will also create an economic environment in which the manufacturing sector will flourish. However, there is a need to alter the focus because in a development strategy which starts with the manufacturing sector, the drivers identified above are likely to be neglected, but if the proposed strategy is adopted, the manufacturing sector will not suffer because of neglect.
Naved Hamid
62
References
D’Costa, A. P., 2006, The New Economy in Development: ICT Challenges and Opportunities, Palgrave Macmillan.
Hamid, Naved, 2007, “A Development Strategy for the Information Age. Asian Development Bank,” Report on the South Asia Department Economists' Annual Conference, pages 7-16.
Haq, Mahbub ul, 1966, The Strategy of Economic Planning: A Case Study of Pakistan, Karachi: Pakistan Branch, Oxford University Press, 1966.
Hussain, Yusaf, 2006, Pakistan’s IT Revenue May be Grossly Understated. Pakistan Software Export Board (PSEB), http://www.pseb.org.pk/ UserFiles/documents/IT_Revenue_Understated_V1.4.pdf.
Pakistan Telecommunication Authority (PTA), 2007, Annual Report 2007, Islamabad, Pakistan http://www.pta.gov.pk/annual-reports/ annrep0607/contents.pdf.
Planning Commission, 2008, Annual Plan 2007-08, Government of Pakistan, Islamabad, Pakistan.
Reardon, Thomas, and Julio A. Berdegue, 2006, “The Retail-led
Transformation of Agrifood Systems and its Implications for Development Polices.” Rimisp-Latin American Center for Rural Development. http://www.rimisp.org/getdoc.php?docid=6432.
Rodrik, Dani, 2006, “Goodbye Washington Concensus, Hello Washington Confusion?" Journal of Economic Literature: 44 (2006): 973-87.
Rostow, W. W., 1960, The Stages of Economic Growth: A Non-Communist Manifesto. Cambridge University Press, Cambridge, UK.
World Bank, 2005, Economic Growth in the 1990s: Learning from a Decade of Reform, Washington DC.
World Bank, 2008, Agriculture for Development, World Development Report, Washington DC.
The Lahore Journal of Economics Special Edition (September 2008): pp. 63-93
An Exploratory Analysis of Inflation Episodes in Pakistan
Riaz Riazuddin∗
Abstract
This paper explores the past 50 years of data on inflation, growth rates of money and real GDP. It is found that inflation is primarily a monetary phenomena; however, the quantity theory of money does not hold in Pakistan below money supply growth rates of 9 percent. A simple monetary rule is also derived by inspecting the maximum probabilities of keeping inflation low (at most 6 percent); this rule is simply to keep money growth rates below 12 percent. This paper also finds that food inflation too is a monetary phenomena and there is no trade-off between inflation and growth, which are independent in the sense of probability measures. The findings are confirmed by the application of Fisher’s Exact Test. The policy implication is that monetary policy should be pursued independently of growth policies of government.
JEL Classification: E41, E52
Keywords: Pakistan, Inflation, Monetary Policy
“Once upon a time, statisticians only explored. Then they learned to confirm exactly-- to confirm a few things exactly, each under very specific circumstances. As they emphasized exact confirmation, their techniques inevitably became less flexible. The connection of the most used techniques with past insights was weakened. Anything to which a confirmatory procedure was not explicitly attached was decried as “mere descriptive statistics”, no matter how much we had learned from it.”
John W. Tukey (1977)
1. Introduction
Tukey’s quotation above sets the direction of this paper. I explore the past 50 years of data on inflation, growth rates of money and real GDP to learn something that, though not necessarily new, is nonetheless important. This study, by calculating the probabilities of observed inflation ∗ Economic Advisor, State Bank of Pakistan.
Riaz Riazuddin
64
over the past 50 years conditioned on money supply growth, paints a clear picture. I also explore a few questions concerning the relevance of monetary policy in containing food inflation. What I learn is not unexpected, but may surprise the proponents declaring monetary policy as irrelevant for controlling food inflation. The paper also touches on the behavior and relevance of international commodity prices, which also seem to determine the course of overall global and domestic inflation. The paper ends with a discussion of the limitations of the analysis undertaken and its relevance to monetary policy and future research directions.
2. An Exploratory Review of Inflation and Money Growth between FY58 and FY07
I first construct simple stem and leaf displays in the tradition of Tukey (1977), but also add two more columns: of the number of years and fiscal years themselves, for a full reading of inflation and growth rates of broad money supply (M2). Table-1 describes the inflation data history of the past 50 years, dividing it into two equal parts of 25 years each, indicating that the observed median inflation was 7%. However, at most 5% inflation was observed in 20 out of 50 years, also indicating a considerable possibility for keeping inflation at a low level in Pakistan. We also see two years of deflation (FY59 and FY63) and close to zero inflation (FY63); these seem to be the outliers at the lower end of inflation. Two other outliers, at the higher end are 26% and 30% inflation for the years of FY73 and FY74, related to the oil price shock. Figure-1 presents a graph of inflation, showing a greater visibility of outliers.
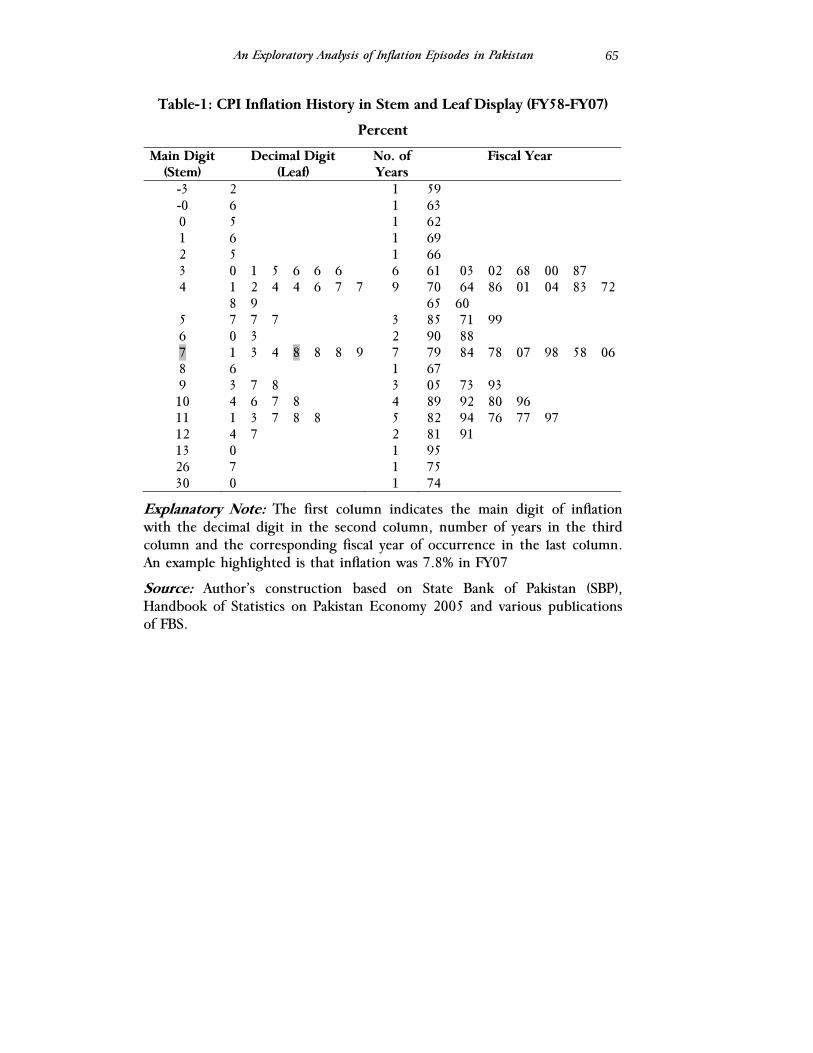
An Exploratory Analysis of Inflation Episodes in Pakistan
65
Table-1: CPI Inflation History in Stem and Leaf Display (FY58-FY07)
Percent
Main Digit (Stem)
Decimal Digit (Leaf)
No. of Years
Fiscal Year
-3 2 1 59 -0 6 1 63 0 5 1 62 1 6 1 69 2 5 1 66 3 0 1 5 6 6 6 6 61 03 02 68 00 87 4 1 2 4 4 6 7 7
8 9 9 70 64 86 01 04 83 72
65 60 5 7 7 7 3 85 71 99 6 0 3 2 90 88 7 1 3 4 8 8 8 9 7 79 84 78 07 98 58 06 8 6 1 67 9 3 7 8 3 05 73 93 10 4 6 7 8 4 89 92 80 96 11 1 3 7 8 8 5 82 94 76 77 97 12 4 7 2 81 91 13 0 1 95 26 7 1 75 30 0 1 74
Explanatory Note: The first column indicates the main digit of inflation with the decimal digit in the second column, number of years in the third column and the corresponding fiscal year of occurrence in the last column. An example highlighted is that inflation was 7.8% in FY07
Source: Author’s construction based on State Bank of Pakistan (SBP), Handbook of Statistics on Pakistan Economy 2005 and various publications of FBS.
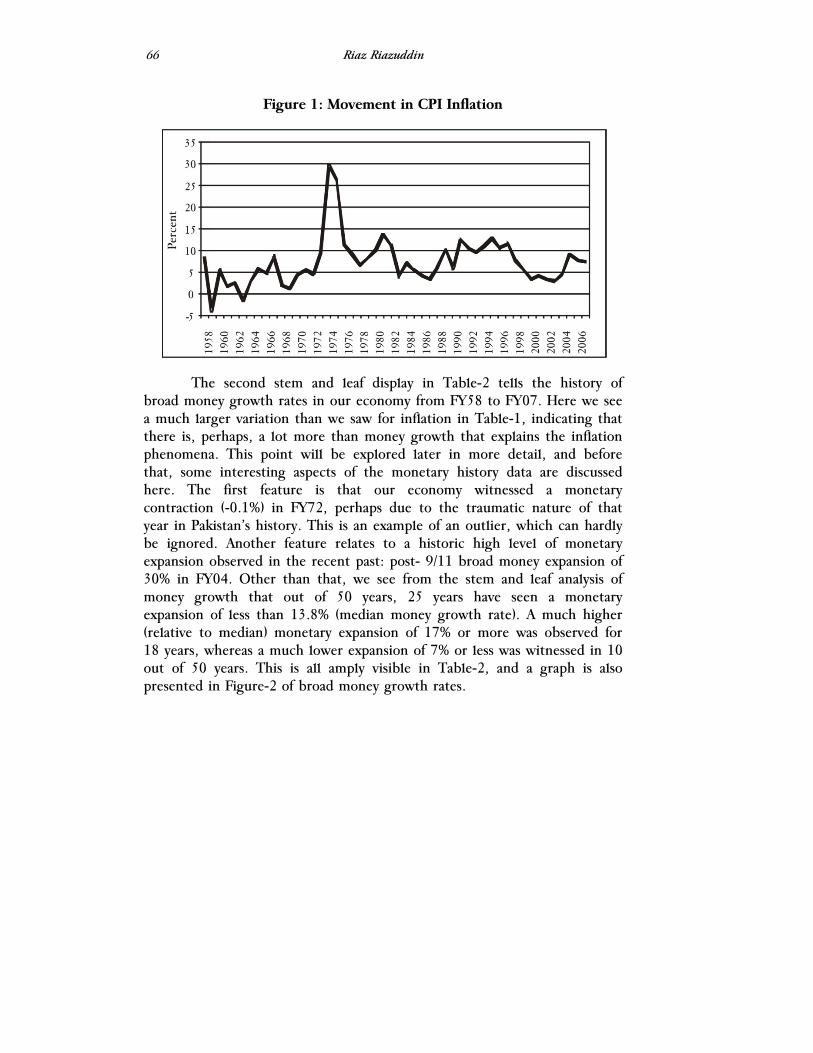
Riaz Riazuddin
66
Figure 1: Movement in CPI Inflation
The second stem and leaf display in Table-2 tells the history of broad money growth rates in our economy from FY58 to FY07. Here we see a much larger variation than we saw for inflation in Table-1, indicating that there is, perhaps, a lot more than money growth that explains the inflation phenomena. This point will be explored later in more detail, and before that, some interesting aspects of the monetary history data are discussed here. The first feature is that our economy witnessed a monetary contraction (-0.1%) in FY72, perhaps due to the traumatic nature of that year in Pakistan’s history. This is an example of an outlier, which can hardly be ignored. Another feature relates to a historic high level of monetary expansion observed in the recent past: post- 9/11 broad money expansion of 30% in FY04. Other than that, we see from the stem and leaf analysis of money growth that out of 50 years, 25 years have seen a monetary expansion of less than 13.8% (median money growth rate). A much higher (relative to median) monetary expansion of 17% or more was observed for 18 years, whereas a much lower expansion of 7% or less was witnessed in 10 out of 50 years. This is all amply visible in Table-2, and a graph is also presented in Figure-2 of broad money growth rates.
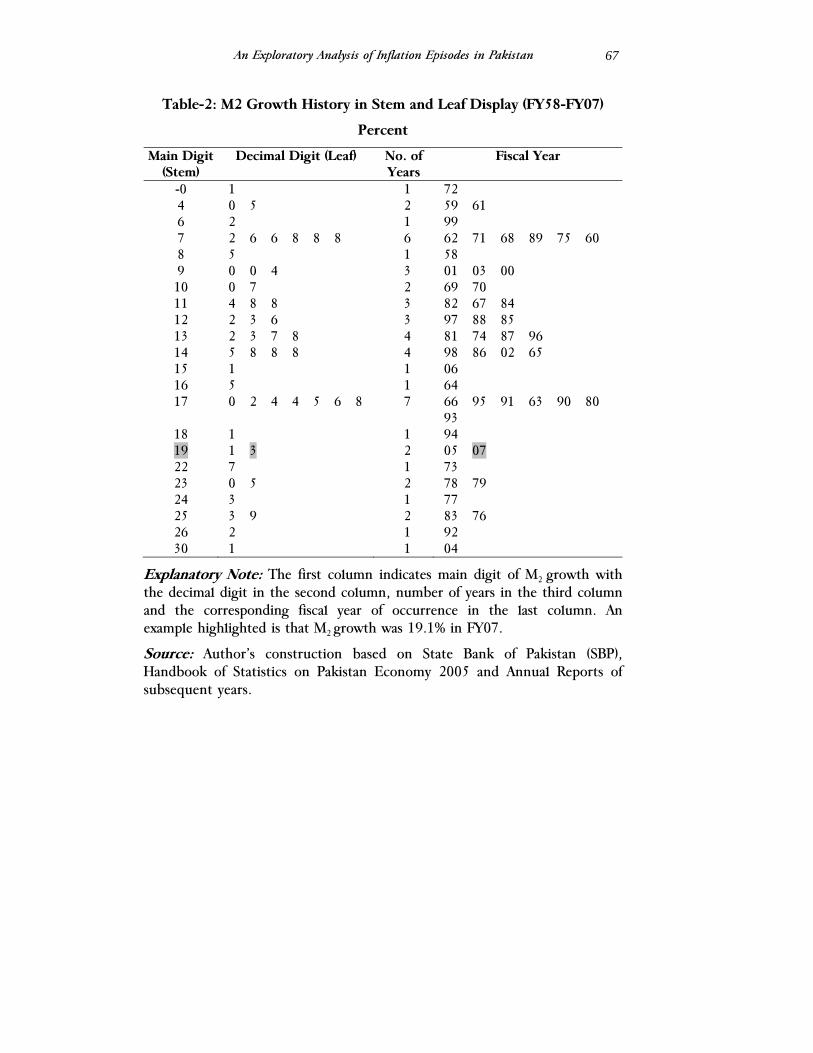
An Exploratory Analysis of Inflation Episodes in Pakistan
67
Table-2: M2 Growth History in Stem and Leaf Display (FY58-FY07)
Percent
Main Digit (Stem)
Decimal Digit (Leaf) No. of Years
Fiscal Year
-0 1 1 72 4 0 5 2 59 61 6 2 1 99 7 2 6 6 8 8 8 6 62 71 68 89 75 60 8 5 1 58 9 0 0 4 3 01 03 00 10 0 7 2 69 70 11 4 8 8 3 82 67 84 12 2 3 6 3 97 88 85 13 2 3 7 8 4 81 74 87 96 14 5 8 8 8 4 98 86 02 65 15 1 1 06 16 5 1 64 17 0 2 4 4 5 6 8 7 66 95 91 63 90 80
93 18 1 1 94 19 1 3 2 05 07 22 7 1 73 23 0 5 2 78 79 24 3 1 77 25 3 9 2 83 76 26 2 1 92 30 1 1 04
Explanatory Note: The first column indicates main digit of M2 growth with the decimal digit in the second column, number of years in the third column and the corresponding fiscal year of occurrence in the last column. An example highlighted is that M2 growth was 19.1% in FY07.
Source: Author’s construction based on State Bank of Pakistan (SBP), Handbook of Statistics on Pakistan Economy 2005 and Annual Reports of subsequent years.
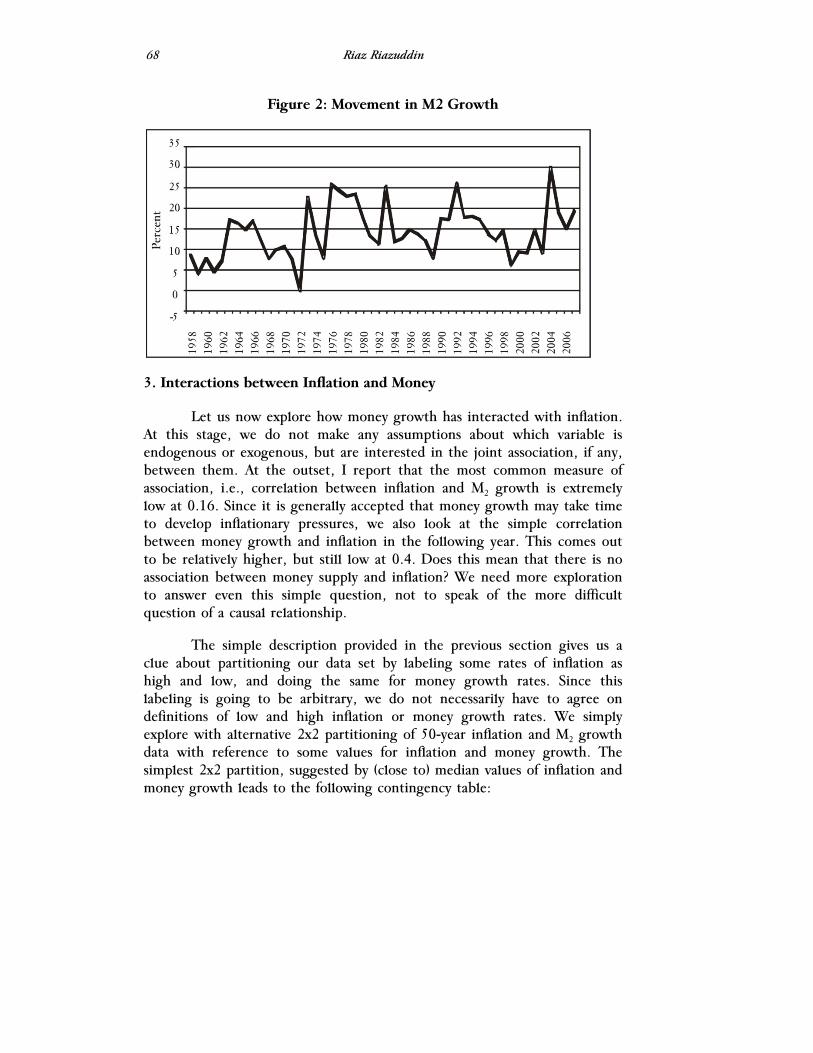
Riaz Riazuddin
68
Figure 2: Movement in M2 Growth
3. Interactions between Inflation and Money
Let us now explore how money growth has interacted with inflation. At this stage, we do not make any assumptions about which variable is endogenous or exogenous, but are interested in the joint association, if any, between them. At the outset, I report that the most common measure of association, i.e., correlation between inflation and M2 growth is extremely low at 0.16. Since it is generally accepted that money growth may take time to develop inflationary pressures, we also look at the simple correlation between money growth and inflation in the following year. This comes out to be relatively higher, but still low at 0.4. Does this mean that there is no association between money supply and inflation? We need more exploration to answer even this simple question, not to speak of the more difficult question of a causal relationship.
The simple description provided in the previous section gives us a clue about partitioning our data set by labeling some rates of inflation as high and low, and doing the same for money growth rates. Since this labeling is going to be arbitrary, we do not necessarily have to agree on definitions of low and high inflation or money growth rates. We simply explore with alternative 2x2 partitioning of 50-year inflation and M2 growth data with reference to some values for inflation and money growth. The simplest 2x2 partition, suggested by (close to) median values of inflation and money growth leads to the following contingency table:
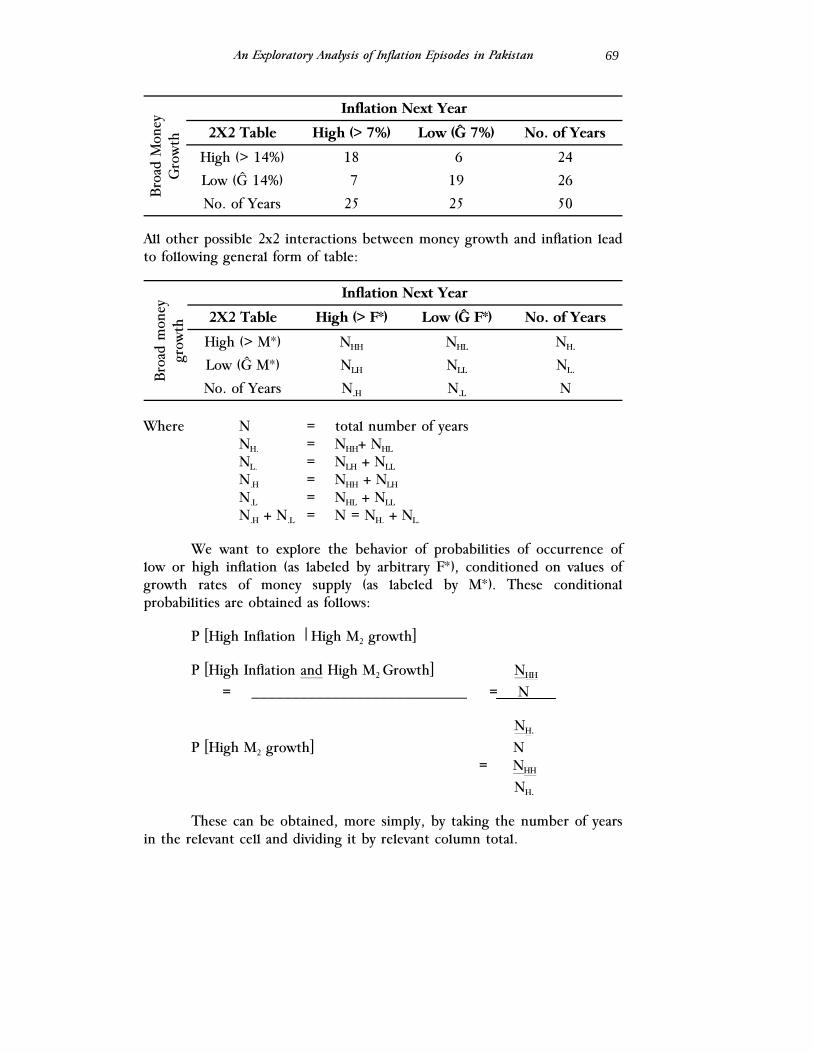
An Exploratory Analysis of Inflation Episodes in Pakistan
69
Broa
d M
oney
Gro
wth
Inflation Next Year
2X2 Table High (> 7%) Low (≤ 7%) No. of Years
High (> 14%) 18 6 24
Low (≤ 14%) 7 19 26
No. of Years 25 25 50
All other possible 2x2 interactions between money growth and inflation lead to following general form of table:
Broa
d m
oney
gr
owth
Inflation Next Year
2X2 Table High (> F*) Low (≤ F*) No. of Years
High (> M*) NHH NHL NH.
Low (≤ M*) NLH NLL NL.
No. of Years N.H N.L N
Where N = total number of years NH. = NHH+ NHL
NL. = NLH + NLL N.H = NHH + NLH N.L = NHL + NLL
N.H + N.L = N = NH. + NL.
We want to explore the behavior of probabilities of occurrence of low or high inflation (as labeled by arbitrary F*), conditioned on values of growth rates of money supply (as labeled by M*). These conditional probabilities are obtained as follows:
P [High Inflation |High M2 growth]
P [High Inflation and High M2 Growth] NHH = ___________________________ = N
NH. P [High M2 growth] N
= NHH NH.
These can be obtained, more simply, by taking the number of years in the relevant cell and dividing it by relevant column total.
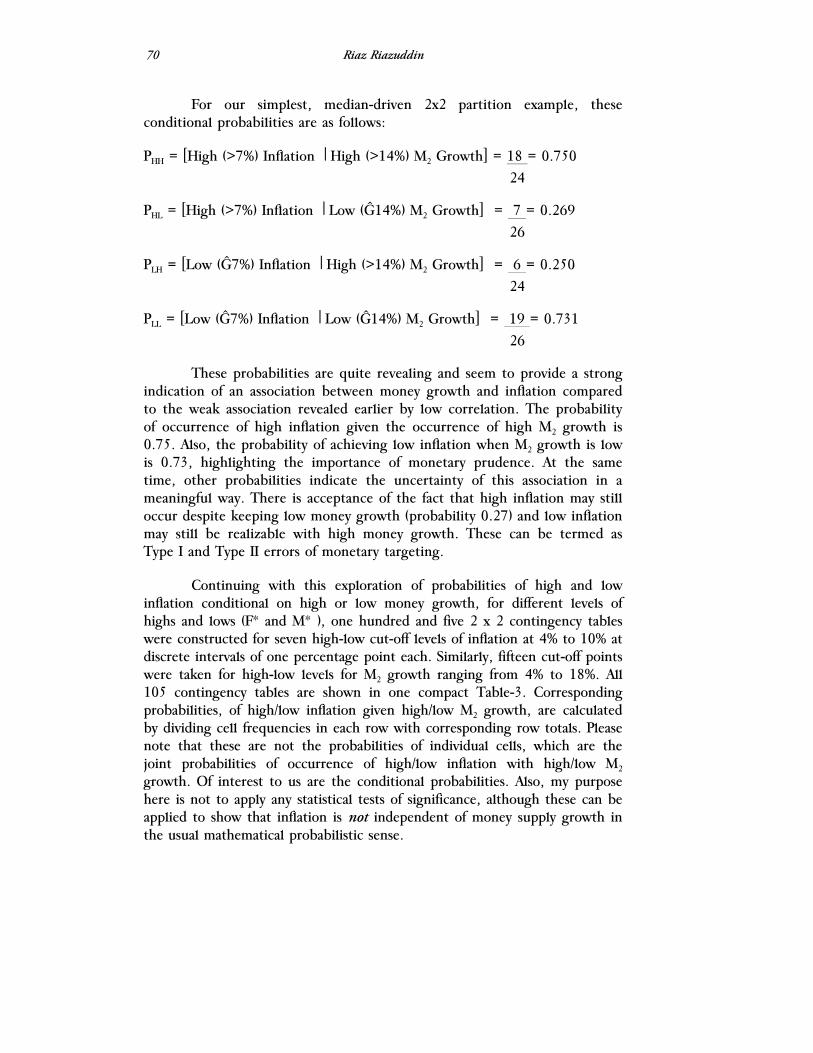
Riaz Riazuddin
70
For our simplest, median-driven 2x2 partition example, these conditional probabilities are as follows:
PHH = [High (>7%) Inflation |High (>14%) M2 Growth] = 18 = 0.750 24
PHL = [High (>7%) Inflation |Low (≤14%) M2 Growth] = 7 = 0.269 26
PLH = [Low (≤7%) Inflation |High (>14%) M2 Growth] = 6 = 0.250 24
PLL = [Low (≤7%) Inflation |Low (≤14%) M2 Growth] = 19 = 0.731 26
These probabilities are quite revealing and seem to provide a strong indication of an association between money growth and inflation compared to the weak association revealed earlier by low correlation. The probability of occurrence of high inflation given the occurrence of high M2 growth is 0.75. Also, the probability of achieving low inflation when M2 growth is low is 0.73, highlighting the importance of monetary prudence. At the same time, other probabilities indicate the uncertainty of this association in a meaningful way. There is acceptance of the fact that high inflation may still occur despite keeping low money growth (probability 0.27) and low inflation may still be realizable with high money growth. These can be termed as Type I and Type II errors of monetary targeting.
Continuing with this exploration of probabilities of high and low inflation conditional on high or low money growth, for different levels of highs and lows (F* and M* ), one hundred and five 2 x 2 contingency tables were constructed for seven high-low cut-off levels of inflation at 4% to 10% at discrete intervals of one percentage point each. Similarly, fifteen cut-off points were taken for high-low levels for M2 growth ranging from 4% to 18%. All 105 contingency tables are shown in one compact Table-3. Corresponding probabilities, of high/low inflation given high/low M2 growth, are calculated by dividing cell frequencies in each row with corresponding row totals. Please note that these are not the probabilities of individual cells, which are the joint probabilities of occurrence of high/low inflation with high/low M2 growth. Of interest to us are the conditional probabilities. Also, my purpose here is not to apply any statistical tests of significance, although these can be applied to show that inflation is not independent of money supply growth in the usual mathematical probabilistic sense.

An Exploratory Analysis of Inflation Episodes in Pakistan
71
Table-3: Interaction between M2 growth and Inflation during FY58-07 in terms of 105 2X2 contingency tables
CPI Inflation in % (next year) >4 <=4 >5 <=5 >6 <=6 >7 <=7 >8 <=8 >9 <=9 >10 <=10
M2
Gro
wth
(%)
>4 38 11 29 20 26 23 24 25 18 31 17 32 14 35 49 <=4 1 0 1 0 1 0 1 0 1 0 1 0 0 1 1 >5 37 10 29 18 26 21 24 23 18 29 17 30 14 33 47 <=5 2 1 1 2 1 2 1 2 1 2 1 2 0 3 3 >6 37 10 29 18 26 21 24 23 18 29 17 30 14 33 47 <=6 2 1 1 2 1 2 1 2 1 2 1 2 0 3 3 >7 37 9 29 17 26 20 24 22 18 28 17 29 14 32 46 <=7 2 2 1 3 1 3 1 3 1 3 1 3 0 4 4 >8 34 6 27 13 24 16 23 17 17 23 16 24 13 27 40 <=8 5 5 3 7 3 7 2 8 2 8 2 8 1 9 10 >9 34 4 27 11 24 14 23 15 17 21 16 22 13 25 38 <=9 5 7 3 9 3 9 2 10 2 10 2 10 1 11 12 >10 32 4 27 9 24 12 23 13 17 19 16 20 13 23 36 <=10 7 7 3 11 3 11 2 12 2 12 2 12 1 13 14 >11 30 4 26 8 24 10 23 11 17 17 16 18 13 21 34 <=11 9 7 4 12 3 13 2 14 2 14 2 14 1 15 16 >12 28 3 25 6 24 7 23 8 17 14 16 15 13 18 31 <=12 11 8 5 14 3 16 2 17 2 17 2 17 1 18 19 >13 25 3 23 5 22 6 21 7 16 12 15 13 12 16 28 <=13 14 8 7 15 5 17 4 18 3 19 3 19 2 20 22 >14 21 3 19 5 18 6 18 6 13 11 12 12 9 15 24 <=14 18 8 11 15 9 17 7 19 6 20 6 20 5 21 26 >15 20 0 18 2 18 2 18 2 13 7 12 8 9 11 20 <=15 19 11 12 18 9 21 7 23 6 24 6 24 5 25 30 >16 19 0 17 2 17 2 17 2 13 6 12 7 9 10 19 <=16 20 11 13 18 10 21 8 23 6 25 6 25 5 26 31 >17 17 0 16 1 16 1 16 1 12 5 12 5 9 8 17 <=17 22 11 14 19 11 22 9 24 7 26 6 27 5 28 33 >18 11 0 11 0 11 0 11 0 7 4 7 4 4 7 11 <=18 28 11 19 20 16 23 14 25 12 27 11 28 10 29 39 Total 39 11 30 20 27 23 25 25 19 31 18 32 14 36 50
Explanatory Note: The first contingency table on top left shows that for 38 years, inflation (next year) was higher than 4% as well as M2 growth; for only 1 year, inflation was higher than 4% when M2 growth was less than 4%; for 11 years, inflation was less than 4 percent when M2 growth was higher than 4 percent; for none of the years, inflation was less than 4 percent when M2 growth was less than 4 percent.
Source: Calculated by using SPSS from joint series of M2 growth rates and inflation rates of the next year reported in Table 1 and 2. For M2 growth rate of FY07, inflation rate of July-March FY08 (period average) is taken as proxy for full year FY08 inflation.
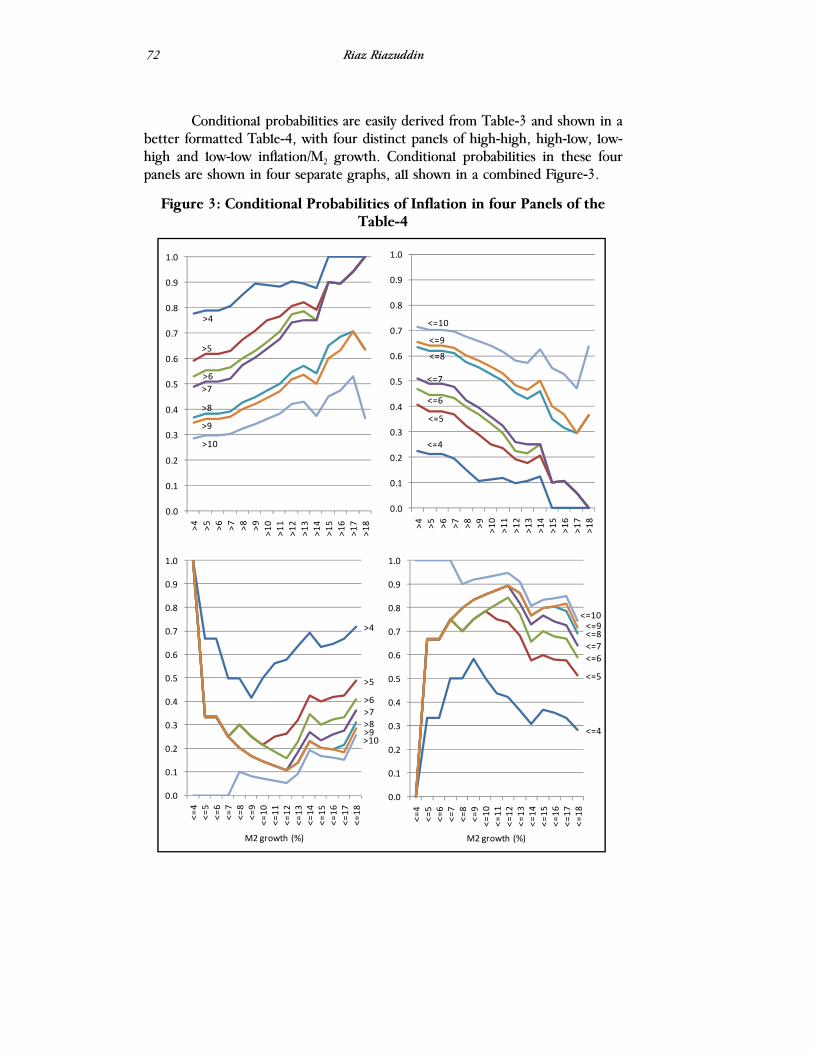
Riaz Riazuddin
72
Conditional probabilities are easily derived from Table-3 and shown in a
better formatted Table-4, with four distinct panels of high-high, high-low, low-high and low-low inflation/M2 growth. Conditional probabilities in these four panels are shown in four separate graphs, all shown in a combined Figure-3.
Figure 3: Conditional Probabilities of Inflation in four Panels of the Table-4
>4
>5
>6>7
>8
>9
>10
0.0
0.1
0.2
0.3
0.4
0.5
0.6
0.7
0.8
0.9
1.0
>4 >5 >6 >7 >8 >9 >10
>11
>12
>13
>14
>15
>16
>17
>18
<=4
<=5
<=6
<=7
<=8
<=9
<=10
0.0
0.1
0.2
0.3
0.4
0.5
0.6
0.7
0.8
0.9
1.0
>4 >5 >6 >7 >8 >9 >10
>11
>12
>13
>14
>15
>16
>17
>18
>4
>5
>6>7>8>9>10
0.0
0.1
0.2
0.3
0.4
0.5
0.6
0.7
0.8
0.9
1.0
<=4
<=5
<=6
<=7
<=8
<=9
<=10
<=11
<=12
<=13
<=14
<=15
<=16
<=17
<=18
M2 growth (%)
<=4
<=5
<=6<=7<=8<=9
<=10
0.0
0.1
0.2
0.3
0.4
0.5
0.6
0.7
0.8
0.9
1.0
<=4
<=5
<=6
<=7
<=8
<=9
<=10
<=11
<=12
<=13
<=14
<=15
<=16
<=17
<=18
M2 growth (%)
An Exploratory Analysis of Inflation Episodes in Pakistan
73
The most striking phenomena captured by these conditional probabilities can be seen in the fourth panel of Figure-3. This shows that if at most 4% inflation (≤ 4%) is taken as low inflation, then the probability of observing this low inflation increases with successive increases in low-high cut-off for M2 growth. But this probability is at a maximum (0.583) at M2
growth rate low-high cut-off of 9%. Reducing M2 growth further leads to a reduction in the probability of observing low inflation (of at most 4%). Many other important associations can also be learned from this graph. Increasing the tolerance of accepting higher inflation results in an increase in probability (0.786) of observing low inflation (at most 5%) at M2 growth of 10%. This maximum probability further increases for inflation tolerance of 6% to 0.842 for M2 growth cut-off of 12%. What is more striking is that at the same cut-off M2 growth of 12%, the maximum probability of observing high inflation is 0.895 for inflation tolerances of 7%, 8% or 9%. This indicates that it would be wise to keep M2 growth at or below 12%, if the objective of low inflation (≤ 6%) is to be taken seriously.
This exploration not only results in our understanding of inflation primarily as a monetary phenomena in a probabilistic sense but also yields a ‘monetary rule’ that keeping M2 growth at less than 12% is associated with the greatest chances for keeping inflation below 6%. This is exactly the rule of thumb indicated by the Quantity Theory of Money, which relates growth rate of money to the sum of the growth rate of real GDP and the rate of inflation when the velocity of money is assumed to be constant. Since we have derived our rule by exploring data of interactions of M2 growth with inflation only, with the interaction of real GDP with inflation already imbedded in historic data, we can ascribe the difference to the implicitly imbedded growth rate of 6% of GDP. However, our rule also suggests not to reduce M2 growth rate below 9% if inflation is to be kept at most 4%. Reducing money growth further will reduce the probability of keeping inflation below 4%. The rule observed here is not linear and implies the difficulties (embedded in past 50 year history) of keeping inflation below 4%, consistent with a GDP growth of 5%. This can also be taken as an indication that the quantity theory of money does not hold in Pakistan below M2 growth levels of 9%.
The other panels of graphs in Figure 3 are self explanatory. Suffice it to say here that the third panel plots the complementary probabilities of the fourth panel and does not give new insights. Conditional probabilities in the second panel are much easier to interpret; the chances of observing low inflation get dimmer with the increases in money supply growth. In fact, it was impossible to observe lower than 6% inflation when M2 growth was higher than 18%. The probabilities in the first panel are the complementary
Riaz Riazuddin
74
probabilities of the second panel. In summary, these conditional probabilities not only provide an intuitive acceptance of inflation as a monetary phenomenon in Pakistan, but also reveal monetary rules in terms of maximizing the conditional probability of low inflation given different tolerance rates of money supply growth.
Although I started by saying that there was no need to apply any test, there is no harm in using well-established tests for assessing the significance between probabilities of different treatments in a contingency table. Keeping a balance between exploratory and confirmatory data analysis may prove to be more prudent. The ‘sickness’ which we want to cure is high inflation, the treatment is the ‘application’ of low money growth. This treatment can only be shown to work effectively if the proportion (or probability) of cases of high inflation (given high M2 growth) is significantly higher than the proportion of cases of high inflation (given low M2 growth). So our null hypothesis here is HO : PHH < PHL, which should be rejected if our remedy is to work effectively. We should expect this rejection to occur in most of the cases of the 105 contingency tables we prepared. The appropriate statistical test in this case is the Fisher’s Exact Test, which is used when 2x2 contingency tables have lower cell frequencies.
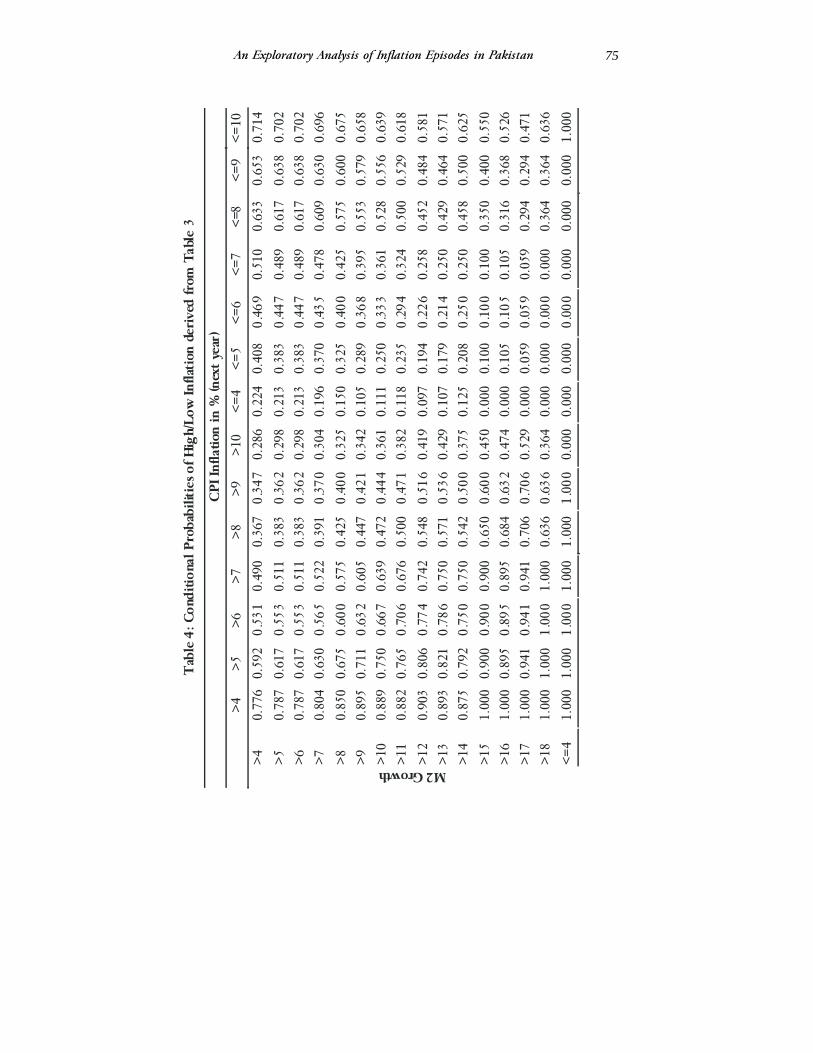
An Exploratory Analysis of Inflation Episodes in Pakistan
75
Tab
le 4
: Con
ditio
nal P
roba
bilit
ies o
f Hig
h/Lo
w In
flati
on d
eriv
ed fr
om T
able
3
CPI
Infla
tion
in %
(nex
t ye
ar)
>4>5
>6>7
>8>9
>10
<=4
<=5
<=6
<=7
<=8
<=9
<=10
>40.
776
0.59
20.
531
0.49
00.
367
0.34
70.
286
0.22
40.
408
0.46
90.
510
0.63
30.
653
0.71
4
>50.
787
0.61
70.
553
0.51
10.
383
0.36
20.
298
0.21
30.
383
0.44
70.
489
0.61
70.
638
0.70
2>6
0.78
70.
617
0.55
30.
511
0.38
30.
362
0.29
80.
213
0.38
30.
447
0.48
90.
617
0.63
80.
702
>70.
804
0.63
00.
565
0.52
20.
391
0.37
00.
304
0.19
60.
370
0.43
50.
478
0.60
90.
630
0.69
6
>80.
850
0.67
50.
600
0.57
50.
425
0.40
00.
325
0.15
00.
325
0.40
00.
425
0.57
50.
600
0.67
5>9
0.89
50.
711
0.63
20.
605
0.44
70.
421
0.34
20.
105
0.28
90.
368
0.39
50.
553
0.57
90.
658
>10
0.88
90.
750
0.66
70.
639
0.47
20.
444
0.36
10.
111
0.25
00.
333
0.36
10.
528
0.55
60.
639
>11
0.88
20.
765
0.70
60.
676
0.50
00.
471
0.38
20.
118
0.23
50.
294
0.32
40.
500
0.52
90.
618
>12
0.90
30.
806
0.77
40.
742
0.54
80.
516
0.41
90.
097
0.19
40.
226
0.25
80.
452
0.48
40.
581
>13
0.89
30.
821
0.78
60.
750
0.57
10.
536
0.42
90.
107
0.17
90.
214
0.25
00.
429
0.46
40.
571
>14
0.87
50.
792
0.75
00.
750
0.54
20.
500
0.37
50.
125
0.20
80.
250
0.25
00.
458
0.50
00.
625
>15
1.00
00.
900
0.90
00.
900
0.65
00.
600
0.45
00.
000
0.10
00.
100
0.10
00.
350
0.40
00.
550
>16
1.00
00.
895
0.89
50.
895
0.68
40.
632
0.47
40.
000
0.10
50.
105
0.10
50.
316
0.36
80.
526
>17
1.00
00.
941
0.94
10.
941
0.70
60.
706
0.52
90.
000
0.05
90.
059
0.05
90.
294
0.29
40.
471
>18
1.00
01.
000
1.00
01.
000
0.63
60.
636
0.36
40.
000
0.00
00.
000
0.00
00.
364
0.36
40.
636
M2Growth <=4
1.00
01.
000
1.00
01.
000
1.00
01.
000
0.00
00.
000
0.00
00.
000
0.00
00.
000
0.00
01.
000
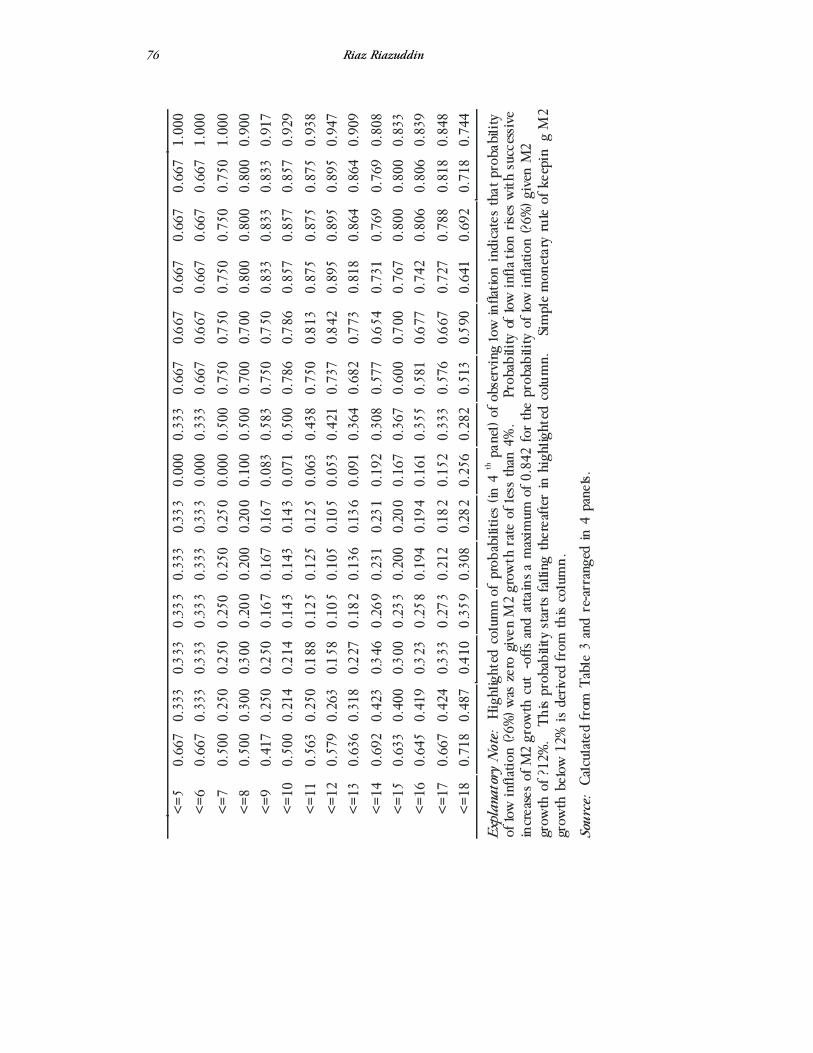
Riaz Riazuddin
76
<=5
0.66
70.
333
0.33
30.
333
0.33
30.
333
0.00
00.
333
0.66
70.66
70.
667
0.66
70.
667
1.00
0<=
60.
667
0.33
30.33
30.
333
0.33
30.
333
0.00
00.
333
0.66
70.66
70.
667
0.66
70.
667
1.00
0
<=7
0.50
00.
250
0.25
00.
250
0.25
00.
250
0.00
00.
500
0.75
00.75
00.
750
0.75
00.
750
1.00
0<=
80.
500
0.30
00.30
00.
200
0.20
00.
200
0.10
00.
500
0.70
00.70
00.
800
0.80
00.
800
0.90
0<=
90.
417
0.25
00.25
00.
167
0.16
70.
167
0.08
30.
583
0.75
00.75
00.
833
0.83
30.
833
0.91
7<=
100.
500
0.21
40.21
40.
143
0.14
30.
143
0.07
10.
500
0.78
60.78
60.
857
0.85
70.
857
0.92
9
<=11
0.56
30.
250
0.18
80.
125
0.12
50.
125
0.06
30.
438
0.75
00.81
30.
875
0.87
50.
875
0.93
8<=
120.
579
0.26
30.15
80.
105
0.10
50.
105
0.05
30.
421
0.73
70.84
20.
895
0.89
50.
895
0.94
7<=
130.
636
0.31
80.22
70.
182
0.13
60.
136
0.09
10.
364
0.68
20.77
30.
818
0.86
40.
864
0.90
9
<=14
0.69
20.
423
0.34
60.
269
0.23
10.
231
0.19
20.
308
0.57
70.65
40.
731
0.76
90.
769
0.80
8<=
150.
633
0.40
00.30
00.
233
0.20
00.
200
0.16
70.
367
0.60
00.70
00.
767
0.80
00.
800
0.83
3<=
160.
645
0.41
90.32
30.
258
0.19
40.
194
0.16
10.
355
0.58
10.67
70.
742
0.80
60.
806
0.83
9
<=17
0.66
70.
424
0.33
30.
273
0.21
20.
182
0.15
20.
333
0.57
60.66
70.
727
0.78
80.
818
0.84
8<=
180.
718
0.48
70.41
00.
359
0.30
80.
282
0.25
60.
282
0.51
30.59
00.
641
0.69
20.
718
0.74
4
Expl
anat
ory
Not
e: H
ighl
ight
ed c
olum
n of
pro
babi
lities (in
4th p
anel) o
f obs
erving
low
infla
tion
indi
cate
s th
at p
roba
bilit
y of
low in
flatio
n (?6
%) w
as zer
o gi
ven
M2
grow
th r
ate
of le
ss tha
n 4%
. Pr
obab
ility
of
low
infla
tion
rises
with
suc
cess
ive
increa
ses of
M2
grow
th c
ut-o
ffs a
nd a
ttain
s a m
axim
um o
f 0.8
42 fo
r th
e pr
obab
ility
of l
ow in
flatio
n (?6
%) g
iven
M2
grow
th o
f ?12
%.
This
prob
ability
start
s fa
lling
the
reafte
r in
hig
hlight
ed c
olum
n. S
impl
e m
onet
ary
rule o
f kee
pin
g M
2 gr
owth
below
12%
is d
erived
from
this
colu
mn.
Sour
ce:
Calcul
ated
from
Tab
le 3
and
re-ar
rang
ed in
4 p
anel
s.

An Exploratory Analysis of Inflation Episodes in Pakistan
77
Table-5 presents exact tail probabilities for the one sided Fisher’s Exact Test for all 105 contingency tables presented in Table-3. There is a disconcerting number of non-rejection of cases corresponding with money growth up to 8%. However, for money growth higher than 9%, most of the cases confirm rejection of the null hypothesis. Overall, there are 67 rejections at the 5% level of significance, out of 105 total cases. This in itself seems like we have not been successful in confirming our previous conclusions about inflation. This is far from true. We learned by inspection of probabilities in 4 panels of Figure 3, that inflation is a monetary phenomenon at money growth of 9% or higher. This is precisely what is being confirmed by the Fisher’s Exact Test. Out of 70 cases of 2x2 tables corresponding with at least 9% M2 growth, 64 cases are significant. In contrast, for the 35 cases of 2x2 tables corresponding with M2 growth of up to 8%, only 3 are significant. Hence, we are on a much stronger footing now about our findings after “passing” Fisher’s Exact Test!
Next we turn to the question “Is food inflation not a monetary phenomena?”
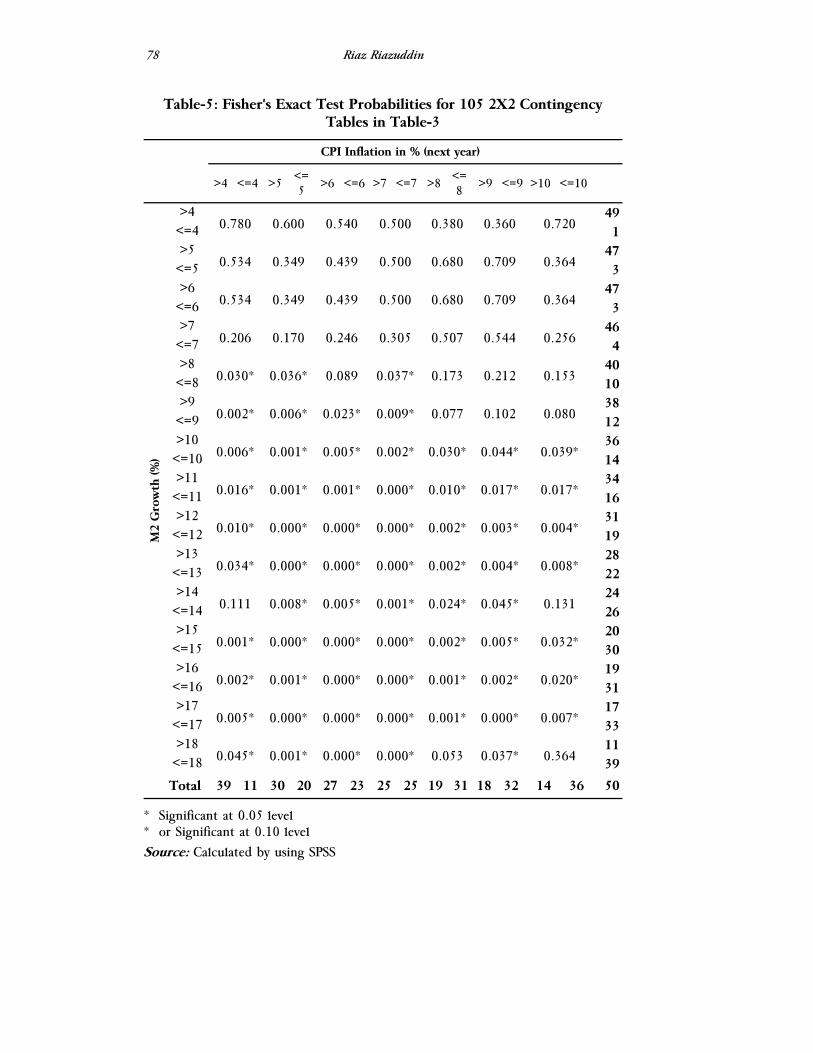
Riaz Riazuddin
78
Table-5: Fisher's Exact Test Probabilities for 105 2X2 Contingency Tables in Table-3
CPI Inflation in % (next year)
>4 <=4 >5 <=5 >6 <=6 >7 <=7 >8 <=
8 >9 <=9 >10 <=10
M2
Gro
wth
(%)
>4 0.780 0.600 0.540 0.500 0.380 0.360 0.720
49 <=4 1 >5
0.534 0.349 0.439 0.500 0.680 0.709 0.364 47
<=5 3 >6
0.534 0.349 0.439 0.500 0.680 0.709 0.364 47
<=6 3 >7
0.206 0.170 0.246 0.305 0.507 0.544 0.256 46
<=7 4 >8
0.030* 0.036* 0.089 0.037* 0.173 0.212 0.153 40
<=8 10 >9
0.002* 0.006* 0.023* 0.009* 0.077 0.102 0.080 38
<=9 12 >10
0.006* 0.001* 0.005* 0.002* 0.030* 0.044* 0.039* 36
<=10 14 >11
0.016* 0.001* 0.001* 0.000* 0.010* 0.017* 0.017* 34
<=11 16 >12
0.010* 0.000* 0.000* 0.000* 0.002* 0.003* 0.004* 31
<=12 19 >13
0.034* 0.000* 0.000* 0.000* 0.002* 0.004* 0.008* 28
<=13 22 >14
0.111 0.008* 0.005* 0.001* 0.024* 0.045* 0.131 24
<=14 26 >15
0.001* 0.000* 0.000* 0.000* 0.002* 0.005* 0.032* 20
<=15 30 >16
0.002* 0.001* 0.000* 0.000* 0.001* 0.002* 0.020* 19
<=16 31 >17
0.005* 0.000* 0.000* 0.000* 0.001* 0.000* 0.007* 17
<=17 33 >18
0.045* 0.001* 0.000* 0.000* 0.053 0.037* 0.364 11
<=18 39
Total 39 11 30 20 27 23 25 25 19 31 18 32 14 36 50
* Significant at 0.05 level * or Significant at 0.10 level Source: Calculated by using SPSS

An Exploratory Analysis of Inflation Episodes in Pakistan
79
4. Interactions between Food Inflation and Money
In this section I first present a data history of food inflation in Pakistan from FY58 to FY08 in a stem and leaf display (Table-6). For reference, we also show the stem and leaf display of non-food inflation history (Table-7). Some interesting facts are that 50-year median food inflation (7.2%) was higher than both CPI inflation (6.7%) and non-food inflation (6.3%). Another surprising historic fact is that food inflation was higher than overall inflation during FY74 and FY75, years synonymous with OPEC embargo driven oil price supply shock. Less well known is the fact that these years also saw an international wheat price shock. Figure 4 presents movements in international oil and wheat inflation during 1958-2007; considerable association between oil and wheat inflation seems to be present, which we do not explore here, but present it as a curious phenomenon of international commodity prices. History seems to be repeating itself nowadays (although not exactly in the same manner), and not necessarily due to the same reasons.
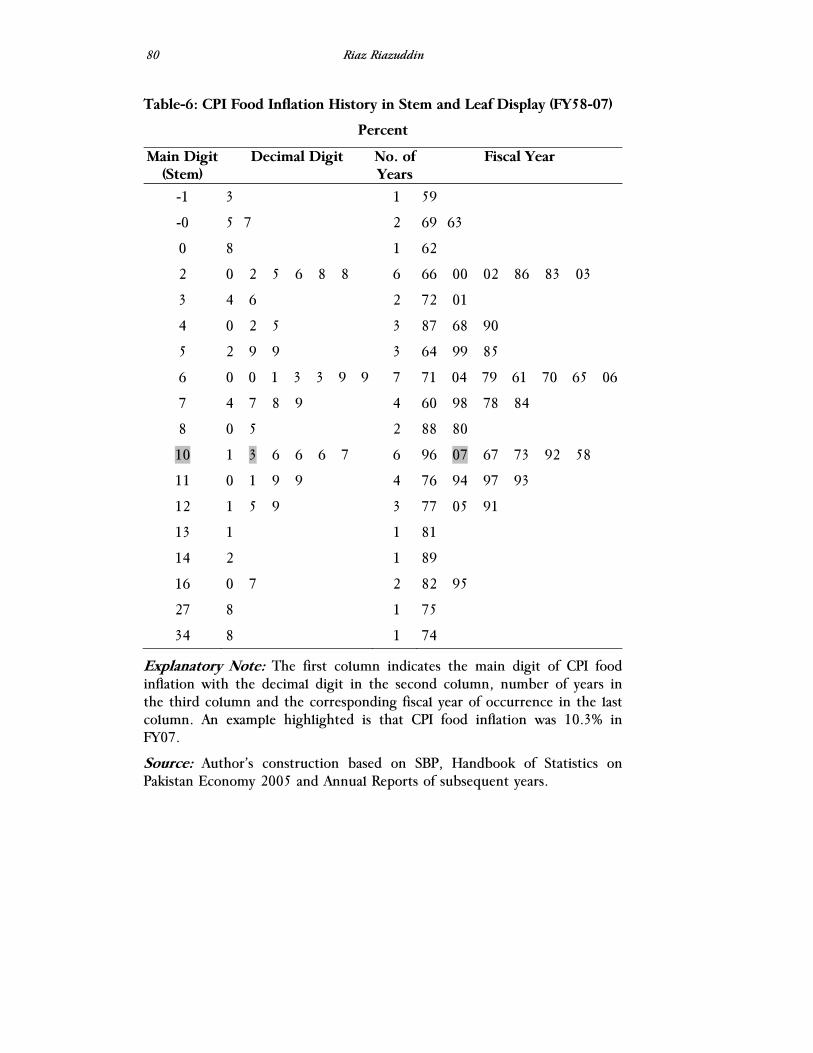
Riaz Riazuddin
80
Table-6: CPI Food Inflation History in Stem and Leaf Display (FY58-07)
Percent
Main Digit (Stem)
Decimal Digit No. of Years
Fiscal Year
-1 3 1 59
-0 5 7 2 69 63
0 8 1 62
2 0 2 5 6 8 8 6 66 00 02 86 83 03
3 4 6 2 72 01
4 0 2 5 3 87 68 90
5 2 9 9 3 64 99 85
6 0 0 1 3 3 9 9 7 71 04 79 61 70 65 06
7 4 7 8 9 4 60 98 78 84
8 0 5 2 88 80
10 1 3 6 6 6 7 6 96 07 67 73 92 58
11 0 1 9 9 4 76 94 97 93
12 1 5 9 3 77 05 91
13 1 1 81
14 2 1 89
16 0 7 2 82 95
27 8 1 75
34 8 1 74
Explanatory Note: The first column indicates the main digit of CPI food inflation with the decimal digit in the second column, number of years in the third column and the corresponding fiscal year of occurrence in the last column. An example highlighted is that CPI food inflation was 10.3% in FY07.
Source: Author’s construction based on SBP, Handbook of Statistics on Pakistan Economy 2005 and Annual Reports of subsequent years.
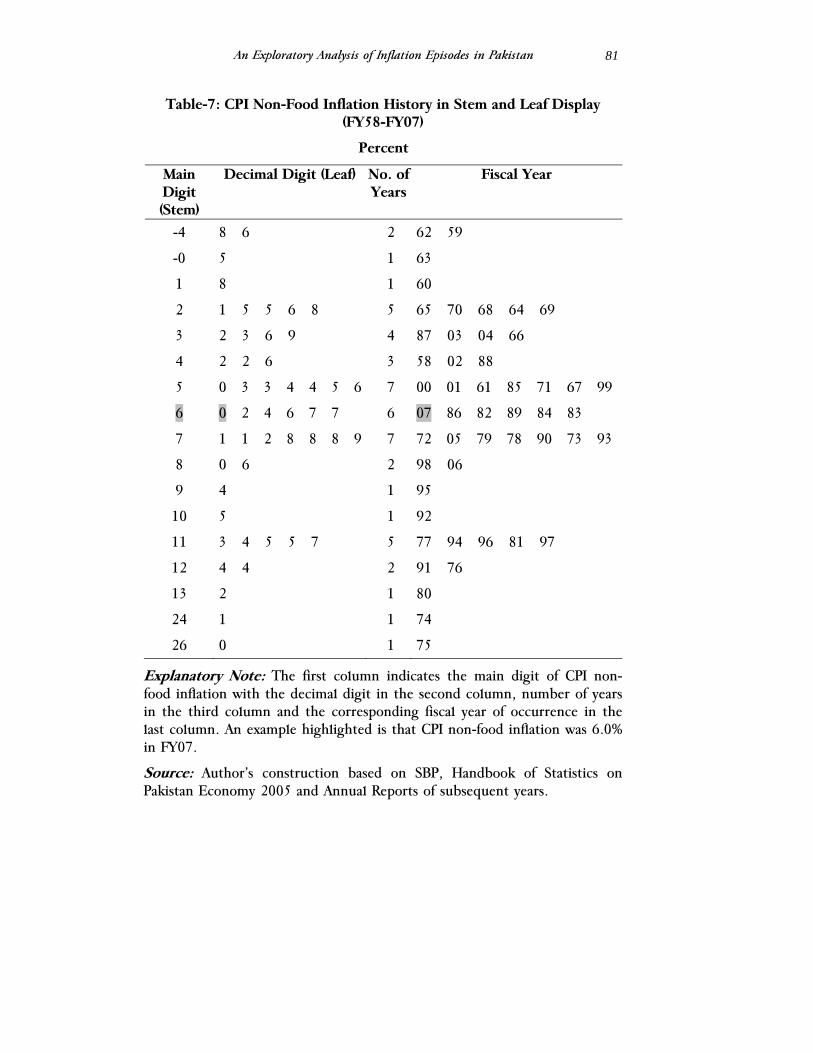
An Exploratory Analysis of Inflation Episodes in Pakistan
81
Table-7: CPI Non-Food Inflation History in Stem and Leaf Display (FY58-FY07)
Percent
Main Digit (Stem)
Decimal Digit (Leaf) No. of Years
Fiscal Year
-4 8 6 2 62 59
-0 5 1 63
1 8 1 60
2 1 5 5 6 8 5 65 70 68 64 69
3 2 3 6 9 4 87 03 04 66
4 2 2 6 3 58 02 88
5 0 3 3 4 4 5 6 7 00 01 61 85 71 67 99
6 0 2 4 6 7 7 6 07 86 82 89 84 83
7 1 1 2 8 8 8 9 7 72 05 79 78 90 73 93
8 0 6 2 98 06
9 4 1 95
10 5 1 92
11 3 4 5 5 7 5 77 94 96 81 97
12 4 4 2 91 76
13 2 1 80
24 1 1 74
26 0 1 75
Explanatory Note: The first column indicates the main digit of CPI non-food inflation with the decimal digit in the second column, number of years in the third column and the corresponding fiscal year of occurrence in the last column. An example highlighted is that CPI non-food inflation was 6.0% in FY07.
Source: Author’s construction based on SBP, Handbook of Statistics on Pakistan Economy 2005 and Annual Reports of subsequent years.
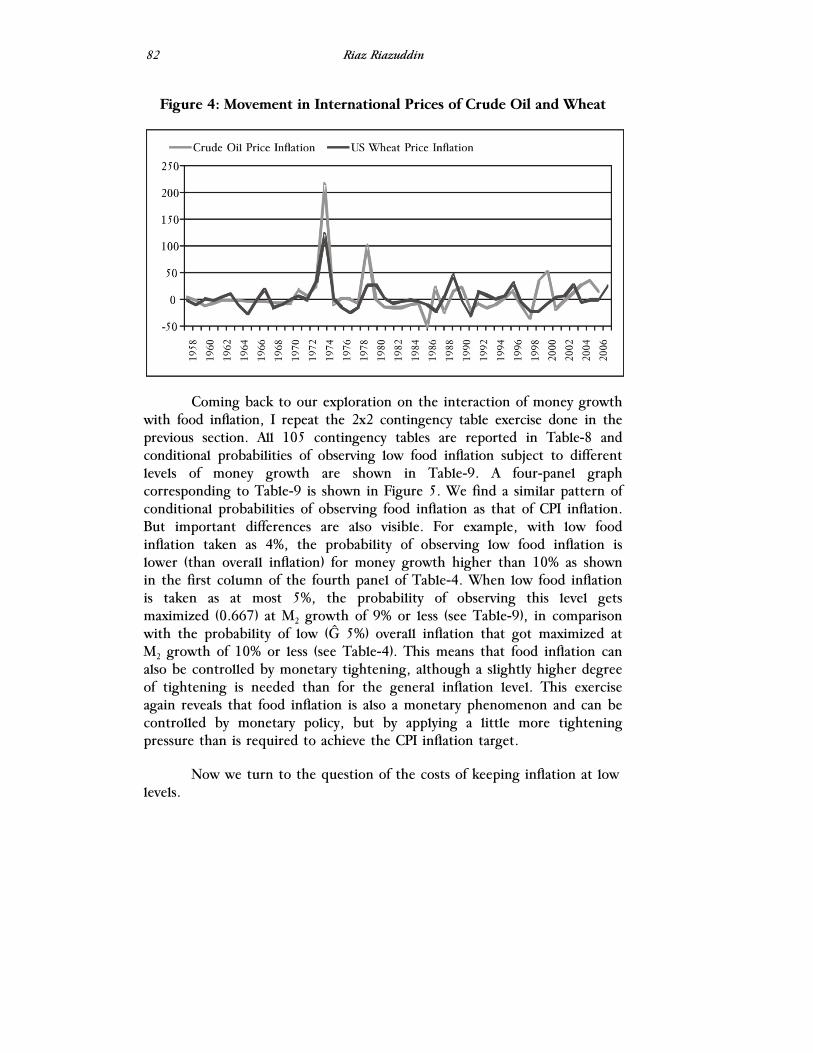
Riaz Riazuddin
82
Figure 4: Movement in International Prices of Crude Oil and Wheat
Coming back to our exploration on the interaction of money growth with food inflation, I repeat the 2x2 contingency table exercise done in the previous section. All 105 contingency tables are reported in Table-8 and conditional probabilities of observing low food inflation subject to different levels of money growth are shown in Table-9. A four-panel graph corresponding to Table-9 is shown in Figure 5. We find a similar pattern of conditional probabilities of observing food inflation as that of CPI inflation. But important differences are also visible. For example, with low food inflation taken as 4%, the probability of observing low food inflation is lower (than overall inflation) for money growth higher than 10% as shown in the first column of the fourth panel of Table-4. When low food inflation is taken as at most 5%, the probability of observing this level gets maximized (0.667) at M2 growth of 9% or less (see Table-9), in comparison with the probability of low (≤ 5%) overall inflation that got maximized at M2 growth of 10% or less (see Table-4). This means that food inflation can also be controlled by monetary tightening, although a slightly higher degree of tightening is needed than for the general inflation level. This exercise again reveals that food inflation is also a monetary phenomenon and can be controlled by monetary policy, but by applying a little more tightening pressure than is required to achieve the CPI inflation target.
Now we turn to the question of the costs of keeping inflation at low levels.

An Exploratory Analysis of Inflation Episodes in Pakistan
83
Table-8: Interaction between M2 growth and CPI food Inflation during FY58-07 in terms of 105 2X2 contingency tables
CPI food Inflation in % (next year) >4 <=4 >5 <=5 >6 <=6 >7 <=7 >8 <=8 >9 <=9 >10 <=10
M2
Gro
wth
(%)
>4 36 13 34 15 30 19 24 25 20 29 18 31 18 31 49 <=4 1 0 1 0 1 0 1 0 1 0 1 0 1 0 1 >5 35 12 33 14 29 18 23 24 20 27 18 29 18 29 47 <=5 2 1 2 1 2 1 2 1 1 2 1 2 1 2 3 >6 35 12 33 14 29 18 23 24 20 27 18 29 18 29 47 <=6 2 1 2 1 2 1 2 1 1 2 1 2 1 2 3 >7 35 11 33 13 29 17 23 23 20 26 18 28 18 28 46 <=7 2 2 2 2 2 2 2 2 1 3 1 3 1 3 4 >8 32 8 31 9 27 13 22 18 19 21 17 23 17 23 40 <=8 5 5 4 6 4 6 3 7 2 8 2 8 2 8 10 >9 32 6 31 7 27 11 22 16 19 19 17 21 17 21 38 <=9 5 7 4 8 4 8 3 9 2 10 2 10 2 10 12 >10 31 5 30 6 26 10 22 14 19 17 17 19 17 19 36 <=10 6 8 5 9 5 9 3 11 2 12 2 12 2 12 14 >11 29 5 28 6 25 9 22 12 19 15 17 17 17 17 34 <=11 8 8 7 9 6 10 3 13 2 14 2 14 2 14 16 >12 27 4 27 4 25 6 22 9 19 12 17 14 17 14 31 <=12 10 9 8 11 6 13 3 16 2 17 2 17 2 17 19 >13 25 3 25 3 23 5 20 8 18 10 16 12 16 12 28 <=13 12 10 10 12 8 14 5 17 3 19 3 19 3 19 22 >14 21 3 21 3 19 5 16 8 14 10 13 11 13 11 24 <=14 16 10 14 12 12 14 9 17 7 19 6 20 6 20 26 >15 20 0 20 0 19 1 16 4 14 6 13 7 13 7 20 <=15 17 13 15 15 12 18 9 21 7 23 6 24 6 24 30 >16 19 0 19 0 18 1 15 4 13 6 12 7 12 7 19 <=16 18 13 16 15 13 18 10 21 8 23 7 24 7 24 31 >17 17 0 17 0 16 1 14 3 12 5 11 6 11 6 17 <=17 20 13 18 15 15 18 11 22 9 24 8 25 8 25 33 >18 11 0 11 0 11 0 9 2 7 4 6 5 6 5 11 <=18 26 13 24 15 20 19 16 23 14 25 13 26 13 26 39 Total 37 13 35 15 31 19 25 25 21 29 19 31 19 31 50
Explanatory Note: Please see explanatory note for table 3.
Source: Calculated using SPSS form joint series of M2 growth rates and CPI food inflation of next year. For M2 growth rate of FY07, CPI food inflation rate of July-March FY08 (period average) is taken as proxy for full year FY08 food inflation.
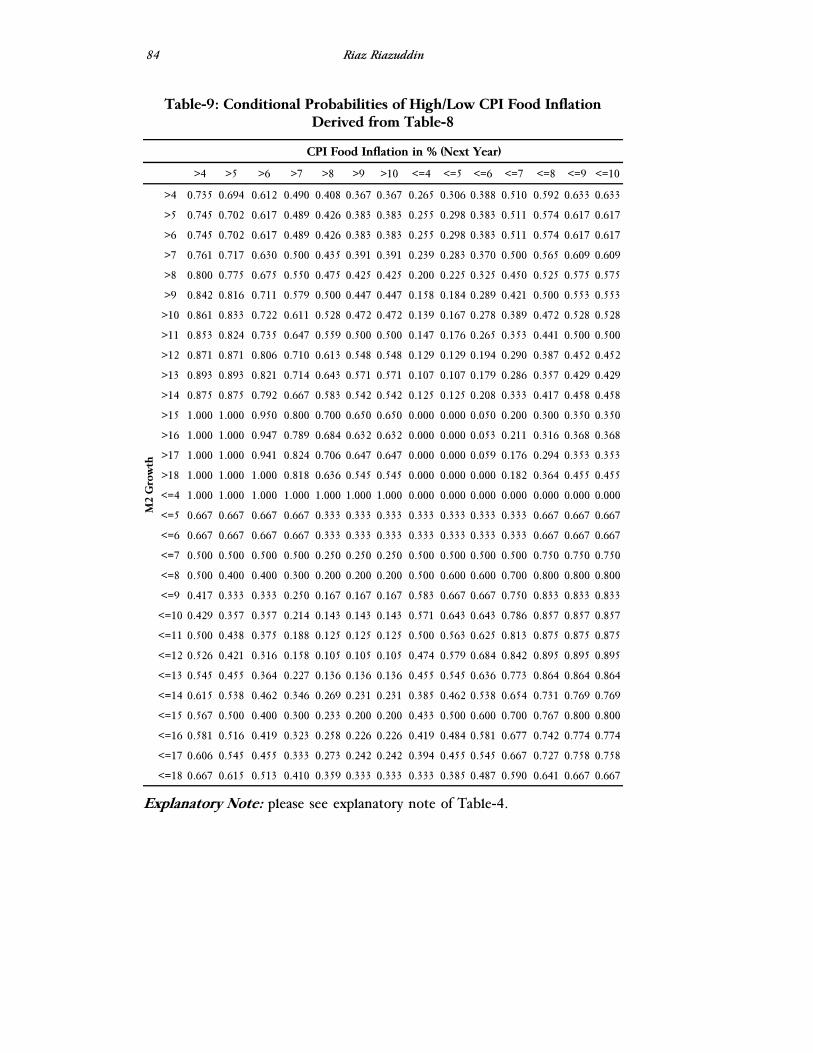
Riaz Riazuddin
84
Table-9: Conditional Probabilities of High/Low CPI Food Inflation Derived from Table-8
CPI Food Inflation in % (Next Year)
>4 >5 >6 >7 >8 >9 >10 <=4 <=5 <=6 <=7 <=8 <=9 <=10
M2
Gro
wth
>4 0.735 0.694 0.612 0.490 0.408 0.367 0.367 0.265 0.306 0.388 0.510 0.592 0.633 0.633
>5 0.745 0.702 0.617 0.489 0.426 0.383 0.383 0.255 0.298 0.383 0.511 0.574 0.617 0.617
>6 0.745 0.702 0.617 0.489 0.426 0.383 0.383 0.255 0.298 0.383 0.511 0.574 0.617 0.617
>7 0.761 0.717 0.630 0.500 0.435 0.391 0.391 0.239 0.283 0.370 0.500 0.565 0.609 0.609
>8 0.800 0.775 0.675 0.550 0.475 0.425 0.425 0.200 0.225 0.325 0.450 0.525 0.575 0.575
>9 0.842 0.816 0.711 0.579 0.500 0.447 0.447 0.158 0.184 0.289 0.421 0.500 0.553 0.553
>10 0.861 0.833 0.722 0.611 0.528 0.472 0.472 0.139 0.167 0.278 0.389 0.472 0.528 0.528
>11 0.853 0.824 0.735 0.647 0.559 0.500 0.500 0.147 0.176 0.265 0.353 0.441 0.500 0.500
>12 0.871 0.871 0.806 0.710 0.613 0.548 0.548 0.129 0.129 0.194 0.290 0.387 0.452 0.452
>13 0.893 0.893 0.821 0.714 0.643 0.571 0.571 0.107 0.107 0.179 0.286 0.357 0.429 0.429
>14 0.875 0.875 0.792 0.667 0.583 0.542 0.542 0.125 0.125 0.208 0.333 0.417 0.458 0.458
>15 1.000 1.000 0.950 0.800 0.700 0.650 0.650 0.000 0.000 0.050 0.200 0.300 0.350 0.350
>16 1.000 1.000 0.947 0.789 0.684 0.632 0.632 0.000 0.000 0.053 0.211 0.316 0.368 0.368
>17 1.000 1.000 0.941 0.824 0.706 0.647 0.647 0.000 0.000 0.059 0.176 0.294 0.353 0.353
>18 1.000 1.000 1.000 0.818 0.636 0.545 0.545 0.000 0.000 0.000 0.182 0.364 0.455 0.455
<=4 1.000 1.000 1.000 1.000 1.000 1.000 1.000 0.000 0.000 0.000 0.000 0.000 0.000 0.000
<=5 0.667 0.667 0.667 0.667 0.333 0.333 0.333 0.333 0.333 0.333 0.333 0.667 0.667 0.667
<=6 0.667 0.667 0.667 0.667 0.333 0.333 0.333 0.333 0.333 0.333 0.333 0.667 0.667 0.667
<=7 0.500 0.500 0.500 0.500 0.250 0.250 0.250 0.500 0.500 0.500 0.500 0.750 0.750 0.750
<=8 0.500 0.400 0.400 0.300 0.200 0.200 0.200 0.500 0.600 0.600 0.700 0.800 0.800 0.800
<=9 0.417 0.333 0.333 0.250 0.167 0.167 0.167 0.583 0.667 0.667 0.750 0.833 0.833 0.833
<=10 0.429 0.357 0.357 0.214 0.143 0.143 0.143 0.571 0.643 0.643 0.786 0.857 0.857 0.857
<=11 0.500 0.438 0.375 0.188 0.125 0.125 0.125 0.500 0.563 0.625 0.813 0.875 0.875 0.875
<=12 0.526 0.421 0.316 0.158 0.105 0.105 0.105 0.474 0.579 0.684 0.842 0.895 0.895 0.895
<=13 0.545 0.455 0.364 0.227 0.136 0.136 0.136 0.455 0.545 0.636 0.773 0.864 0.864 0.864
<=14 0.615 0.538 0.462 0.346 0.269 0.231 0.231 0.385 0.462 0.538 0.654 0.731 0.769 0.769
<=15 0.567 0.500 0.400 0.300 0.233 0.200 0.200 0.433 0.500 0.600 0.700 0.767 0.800 0.800
<=16 0.581 0.516 0.419 0.323 0.258 0.226 0.226 0.419 0.484 0.581 0.677 0.742 0.774 0.774
<=17 0.606 0.545 0.455 0.333 0.273 0.242 0.242 0.394 0.455 0.545 0.667 0.727 0.758 0.758
<=18 0.667 0.615 0.513 0.410 0.359 0.333 0.333 0.333 0.385 0.487 0.590 0.641 0.667 0.667
Explanatory Note: please see explanatory note of Table-4.
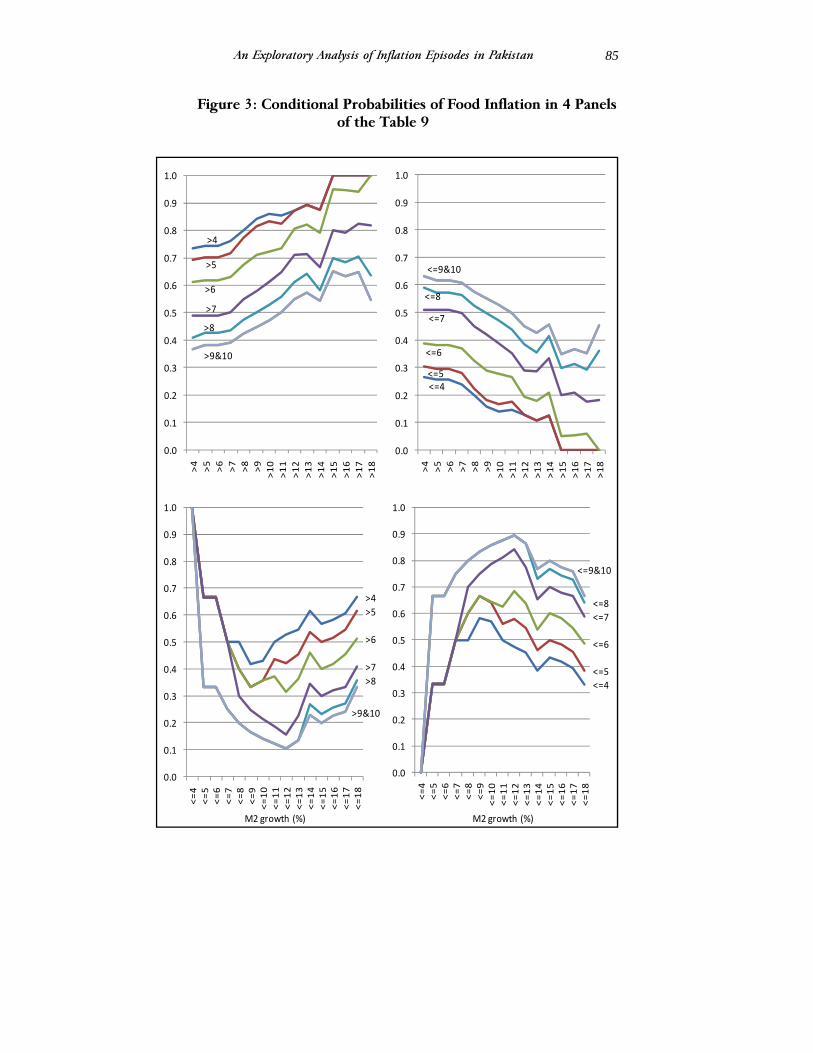
An Exploratory Analysis of Inflation Episodes in Pakistan
85
Figure 3: Conditional Probabilities of Food Inflation in 4 Panels of the Table 9
>4
>5
>6
>7
>8
>9&10
0.0
0.1
0.2
0.3
0.4
0.5
0.6
0.7
0.8
0.9
1.0
>4
>5
>6
>7
>8
>9
>10
>11
>12
>13
>14
>15
>16
>17
>18
<=4<=5
<=6
<=7
<=8
<=9&10
0.0
0.1
0.2
0.3
0.4
0.5
0.6
0.7
0.8
0.9
1.0
>4
>5
>6
>7
>8
>9
>10
>11
>12
>13
>14
>15
>16
>17
>18
>4>5
>6
>7>8
>9&10
0.0
0.1
0.2
0.3
0.4
0.5
0.6
0.7
0.8
0.9
1.0
<=4
<=5
<=6
<=7
<=8
<=9
<=10
<=11
<=12
<=13
<=14
<=15
<=16
<=17
<=18
M2 growth (%)
<=4<=5
<=6
<=7<=8
<=9&10
0.0
0.1
0.2
0.3
0.4
0.5
0.6
0.7
0.8
0.9
1.0
<=4
<=5
<=6
<=7
<=8
<=9
<=10
<=11
<=12
<=13
<=14
<=15
<=16
<=17
<=18
M2 growth (%)
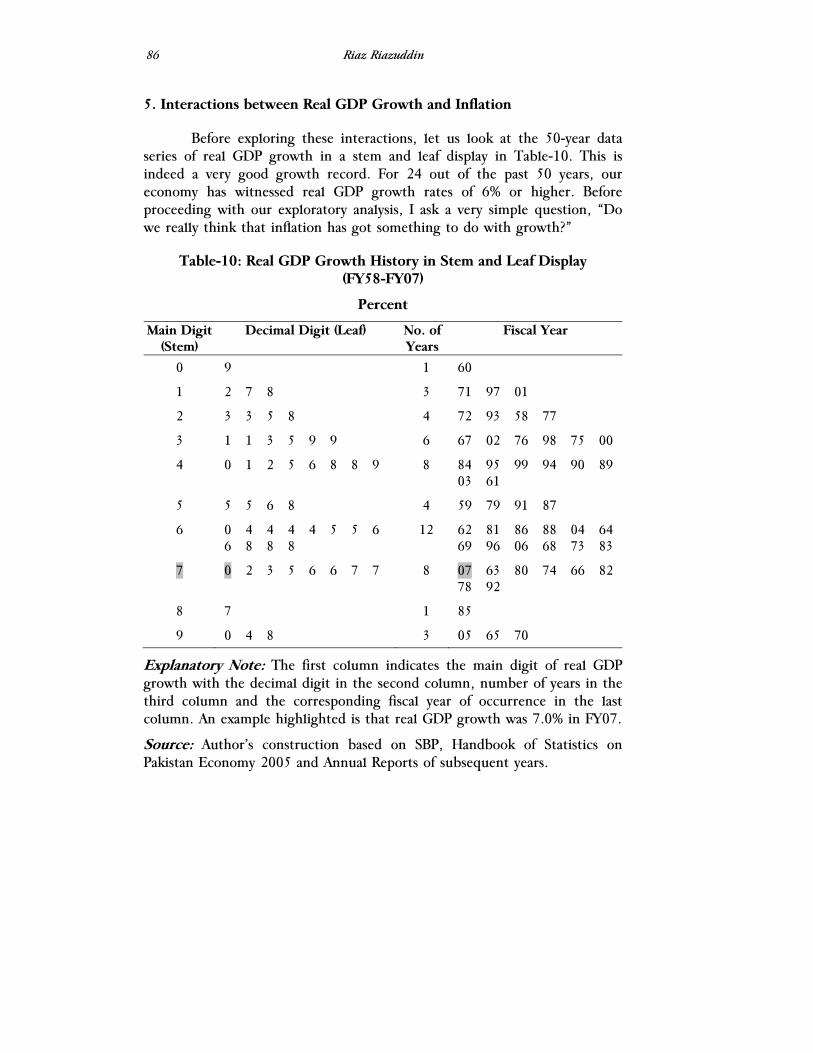
Riaz Riazuddin
86
5. Interactions between Real GDP Growth and Inflation
Before exploring these interactions, let us look at the 50-year data series of real GDP growth in a stem and leaf display in Table-10. This is indeed a very good growth record. For 24 out of the past 50 years, our economy has witnessed real GDP growth rates of 6% or higher. Before proceeding with our exploratory analysis, I ask a very simple question, “Do we really think that inflation has got something to do with growth?”
Table-10: Real GDP Growth History in Stem and Leaf Display (FY58-FY07)
Percent
Main Digit (Stem)
Decimal Digit (Leaf) No. of Years
Fiscal Year
0 9 1 60
1 2 7 8 3 71 97 01
2 3 3 5 8 4 72 93 58 77
3 1 1 3 5 9 9 6 67 02 76 98 75 00
4 0 1 2 5 6 8 8 9 8 84 95 99 94 90 89 03 61
5 5 5 6 8 4 59 79 91 87
6 0 4 4 4 4 5 5 6 6 8 8 8
12 62 81 86 88 04 64 69 96 06 68 73 83
7 0 2 3 5 6 6 7 7 8 07 63 80 74 66 82 78 92
8 7 1 85
9 0 4 8 3 05 65 70
Explanatory Note: The first column indicates the main digit of real GDP growth with the decimal digit in the second column, number of years in the third column and the corresponding fiscal year of occurrence in the last column. An example highlighted is that real GDP growth was 7.0% in FY07.
Source: Author’s construction based on SBP, Handbook of Statistics on Pakistan Economy 2005 and Annual Reports of subsequent years.

An Exploratory Analysis of Inflation Episodes in Pakistan
87
Let us try to find an answer to this question by looking at 63 2x2 contingency tables presented in Table-11. These are constructed simply by successively slicing the real GDP growth rates with tolerance levels of 1% to 9%, with discrete jumps of one percentage point each. Inflation tolerances are taken as in earlier sections. Conditional probabilities of high/low inflation with given high/low growth rates of real GDP are presented in the same format in Table-12. It is much easier to interpret these probabilities meaningfully in this format compared to what we presented earlier. The most striking point to note is that the set of the first two probabilities in each column do not seem to differ much from each other. This means that the probability of observing high inflation does not really differ when real GDP growth is either high or low. This seems to suggest a common sense observation that inflation and growth are independent; inflation is influenced by factors other than growth and growth is influenced by factors other than inflation.
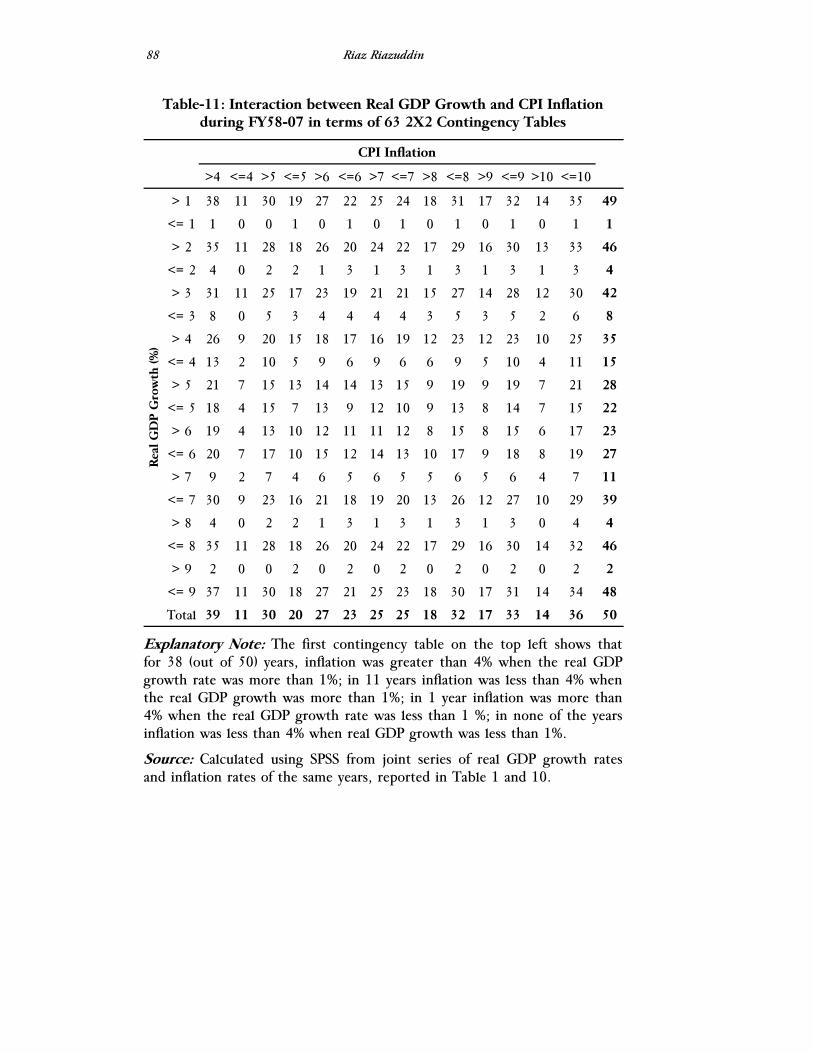
Riaz Riazuddin
88
Table-11: Interaction between Real GDP Growth and CPI Inflation during FY58-07 in terms of 63 2X2 Contingency Tables
CPI Inflation >4 <=4 >5 <=5 >6 <=6 >7 <=7 >8 <=8 >9 <=9 >10 <=10
Rea
l GD
P G
row
th (%
)
> 1 38 11 30 19 27 22 25 24 18 31 17 32 14 35 49
<= 1 1 0 0 1 0 1 0 1 0 1 0 1 0 1 1
> 2 35 11 28 18 26 20 24 22 17 29 16 30 13 33 46
<= 2 4 0 2 2 1 3 1 3 1 3 1 3 1 3 4
> 3 31 11 25 17 23 19 21 21 15 27 14 28 12 30 42
<= 3 8 0 5 3 4 4 4 4 3 5 3 5 2 6 8
> 4 26 9 20 15 18 17 16 19 12 23 12 23 10 25 35
<= 4 13 2 10 5 9 6 9 6 6 9 5 10 4 11 15
> 5 21 7 15 13 14 14 13 15 9 19 9 19 7 21 28
<= 5 18 4 15 7 13 9 12 10 9 13 8 14 7 15 22
> 6 19 4 13 10 12 11 11 12 8 15 8 15 6 17 23
<= 6 20 7 17 10 15 12 14 13 10 17 9 18 8 19 27
> 7 9 2 7 4 6 5 6 5 5 6 5 6 4 7 11
<= 7 30 9 23 16 21 18 19 20 13 26 12 27 10 29 39
> 8 4 0 2 2 1 3 1 3 1 3 1 3 0 4 4
<= 8 35 11 28 18 26 20 24 22 17 29 16 30 14 32 46
> 9 2 0 0 2 0 2 0 2 0 2 0 2 0 2 2
<= 9 37 11 30 18 27 21 25 23 18 30 17 31 14 34 48
Total 39 11 30 20 27 23 25 25 18 32 17 33 14 36 50
Explanatory Note: The first contingency table on the top left shows that for 38 (out of 50) years, inflation was greater than 4% when the real GDP growth rate was more than 1%; in 11 years inflation was less than 4% when the real GDP growth was more than 1%; in 1 year inflation was more than 4% when the real GDP growth rate was less than 1 %; in none of the years inflation was less than 4% when real GDP growth was less than 1%.
Source: Calculated using SPSS from joint series of real GDP growth rates and inflation rates of the same years, reported in Table 1 and 10.
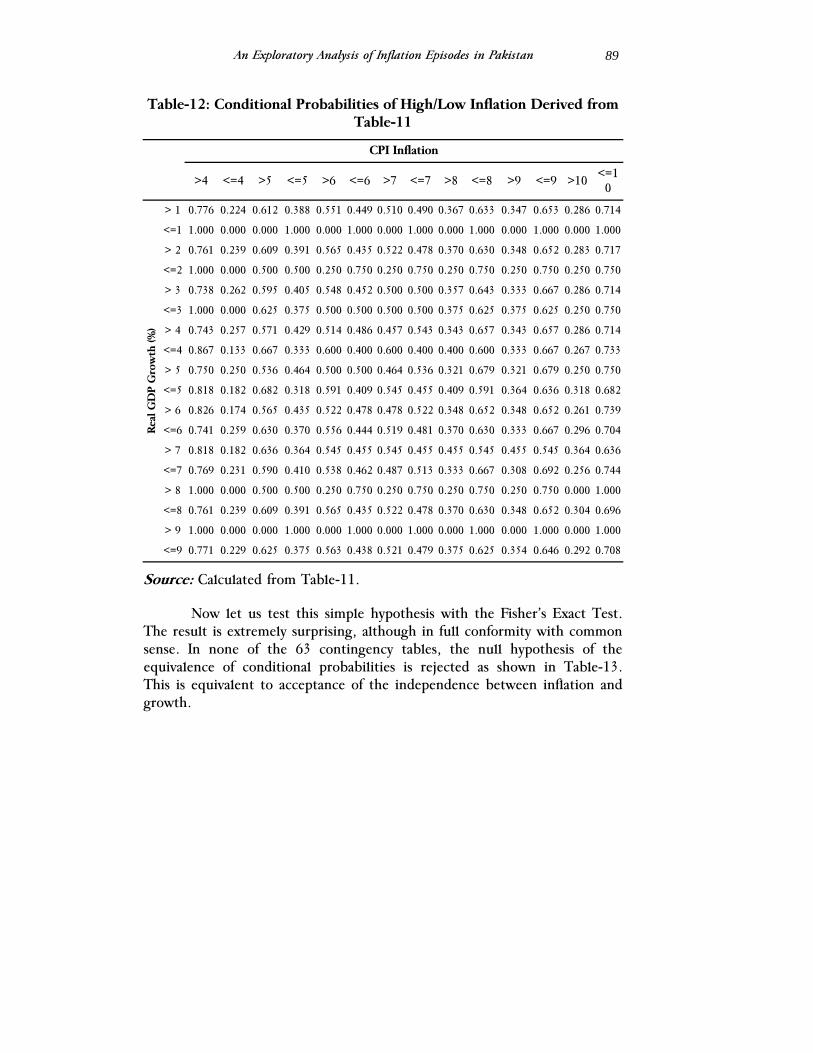
An Exploratory Analysis of Inflation Episodes in Pakistan
89
Table-12: Conditional Probabilities of High/Low Inflation Derived from Table-11
CPI Inflation
>4 <=4 >5 <=5 >6 <=6 >7 <=7 >8 <=8 >9 <=9 >10 <=10
Rea
l GD
P G
row
th (%
)
> 1 0.776 0.224 0.612 0.388 0.551 0.449 0.510 0.490 0.367 0.633 0.347 0.653 0.286 0.714
<=1 1.000 0.000 0.000 1.000 0.000 1.000 0.000 1.000 0.000 1.000 0.000 1.000 0.000 1.000
> 2 0.761 0.239 0.609 0.391 0.565 0.435 0.522 0.478 0.370 0.630 0.348 0.652 0.283 0.717
<=2 1.000 0.000 0.500 0.500 0.250 0.750 0.250 0.750 0.250 0.750 0.250 0.750 0.250 0.750
> 3 0.738 0.262 0.595 0.405 0.548 0.452 0.500 0.500 0.357 0.643 0.333 0.667 0.286 0.714
<=3 1.000 0.000 0.625 0.375 0.500 0.500 0.500 0.500 0.375 0.625 0.375 0.625 0.250 0.750
> 4 0.743 0.257 0.571 0.429 0.514 0.486 0.457 0.543 0.343 0.657 0.343 0.657 0.286 0.714
<=4 0.867 0.133 0.667 0.333 0.600 0.400 0.600 0.400 0.400 0.600 0.333 0.667 0.267 0.733
> 5 0.750 0.250 0.536 0.464 0.500 0.500 0.464 0.536 0.321 0.679 0.321 0.679 0.250 0.750
<=5 0.818 0.182 0.682 0.318 0.591 0.409 0.545 0.455 0.409 0.591 0.364 0.636 0.318 0.682
> 6 0.826 0.174 0.565 0.435 0.522 0.478 0.478 0.522 0.348 0.652 0.348 0.652 0.261 0.739
<=6 0.741 0.259 0.630 0.370 0.556 0.444 0.519 0.481 0.370 0.630 0.333 0.667 0.296 0.704
> 7 0.818 0.182 0.636 0.364 0.545 0.455 0.545 0.455 0.455 0.545 0.455 0.545 0.364 0.636
<=7 0.769 0.231 0.590 0.410 0.538 0.462 0.487 0.513 0.333 0.667 0.308 0.692 0.256 0.744
> 8 1.000 0.000 0.500 0.500 0.250 0.750 0.250 0.750 0.250 0.750 0.250 0.750 0.000 1.000
<=8 0.761 0.239 0.609 0.391 0.565 0.435 0.522 0.478 0.370 0.630 0.348 0.652 0.304 0.696
> 9 1.000 0.000 0.000 1.000 0.000 1.000 0.000 1.000 0.000 1.000 0.000 1.000 0.000 1.000
<=9 0.771 0.229 0.625 0.375 0.563 0.438 0.521 0.479 0.375 0.625 0.354 0.646 0.292 0.708
Source: Calculated from Table-11.
Now let us test this simple hypothesis with the Fisher’s Exact Test. The result is extremely surprising, although in full conformity with common sense. In none of the 63 contingency tables, the null hypothesis of the equivalence of conditional probabilities is rejected as shown in Table-13. This is equivalent to acceptance of the independence between inflation and growth.
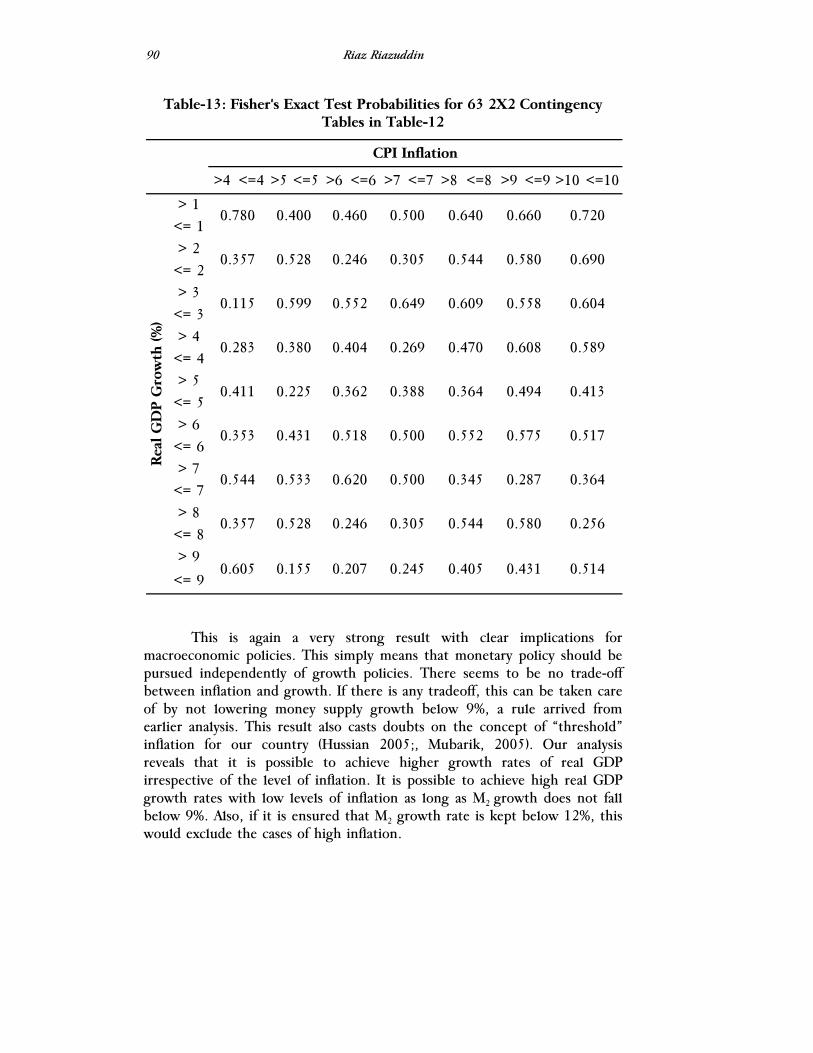
Riaz Riazuddin
90
Table-13: Fisher's Exact Test Probabilities for 63 2X2 Contingency Tables in Table-12
CPI Inflation
>4 <=4 >5 <=5 >6 <=6 >7 <=7 >8 <=8 >9 <=9 >10 <=10
Rea
l GD
P G
row
th (%
)
> 1 0.780 0.400 0.460 0.500 0.640 0.660 0.720
<= 1 > 2
0.357 0.528 0.246 0.305 0.544 0.580 0.690 <= 2 > 3
0.115 0.599 0.552 0.649 0.609 0.558 0.604 <= 3 > 4
0.283 0.380 0.404 0.269 0.470 0.608 0.589 <= 4 > 5
0.411 0.225 0.362 0.388 0.364 0.494 0.413 <= 5 > 6
0.353 0.431 0.518 0.500 0.552 0.575 0.517 <= 6 > 7
0.544 0.533 0.620 0.500 0.345 0.287 0.364 <= 7 > 8
0.357 0.528 0.246 0.305 0.544 0.580 0.256 <= 8 > 9
0.605 0.155 0.207 0.245 0.405 0.431 0.514 <= 9
This is again a very strong result with clear implications for macroeconomic policies. This simply means that monetary policy should be pursued independently of growth policies. There seems to be no trade-off between inflation and growth. If there is any tradeoff, this can be taken care of by not lowering money supply growth below 9%, a rule arrived from earlier analysis. This result also casts doubts on the concept of “threshold” inflation for our country (Hussian 2005;, Mubarik, 2005). Our analysis reveals that it is possible to achieve higher growth rates of real GDP irrespective of the level of inflation. It is possible to achieve high real GDP growth rates with low levels of inflation as long as M2 growth does not fall below 9%. Also, if it is ensured that M2 growth rate is kept below 12%, this would exclude the cases of high inflation.
An Exploratory Analysis of Inflation Episodes in Pakistan
91
6. Conclusion, Relevance for Monetary Policy, Limitations of Exploration and Future Research Directions
We have learn from our examination of the data that inflation is primarily a monetary phenomenon. However, the quantity theory of money does not seem to hold for expansions in money supply below 9%. A simple monetary rule to maximize the probability of keeping inflation low (at most 6%) is to keep money growth at most 12%. These exploratory findings are strengthened by the results of Fisher’s Exact Test. In addition, we learned that food inflation is also a monetary phenomena, and in order to keep food inflation lower, greater tightening is necessary than for the general inflation level. Our study also indicated the absence of a trade-off between inflation and real GDP growth. Therefore, monetary policy should be pursued independently of the growth oriented policies of government.
We need to be cautious here because our exploratory analysis was derived from the use of contingency tables in a way, perhaps, not done before. Nothing is new here, except for the repeated construction of 2x2 contingency tables, exploring the group of probabilities by putting them into new formats, and applying conventional statistical tests of independence or significance on the difference of conditional probabilities. In this way, our approach can be labeled as “2x2 qualitative exploratory analysis of quantitative data”. First caution relates to unforeseen methodological problems that may arise due to the repeated partitioning of continuous time series data to make it qualitative. Contingency table analysis is usually applied on qualitative data, a mix of qualitative and quantitative data or also on classified quantitative data. I have not only classified the quantitative data but also done it repeatedly for pairs of time series data. Intuitively, there does not seem to be a problem. But this needs to be checked by other experts also. If it receives academic acceptance, this can lead to its replication on 2x2 interactions of other macroeconomic variables of interest that can potentially be bifurcated into high-low categories. Further applications can be explored in terms of the simultaneous interactions of more than two variables by using higher dimensional contingency tables.
A second cautionary note concerns drawing very strong policy conclusions for the future. This is so because we have only analyzed the past 50 years of data, without recourse to any economic theory. Analysis eschewed the questions of cause and effect, exogeneity and endogeneity etc. The focus of the analysis is exclusively on “interactions”, and whether these are independent (in a probability sense) or not. It may be pertinent here to relate a famous saying of Imam Ghazali, who said if you beat a dog with a stick, the dog is going to bite you and not the stick! Hence, the dog knows

Riaz Riazuddin
92
that stick has not caused the beating. Similarly, I can say it is excessive money growth which is beating the prices up and not vice versa. Therefore, cause and effect should be better ascribed by taking recourse to knowledge outside our analytical approach. The confusion in establishing cause and effect can be taken as a superiority of human beings who have been abundantly endowed with the seeds of doubt, that have created the bulk of human knowledge, though not necessarily the core knowledge.
An Exploratory Analysis of Inflation Episodes in Pakistan
93
References
Fienberg, Stephen E., 1980, The Analysis of Cross-Classified Categorical Data, MIT Press, Cambridge, Massachusetts.
Fisher, Ronald A., 1963, Statistical Methods for Research Workers, Thirteenth Edition-Revised, Oliver and Boyd, Edinburgh.
Hussain, Manzoor, 2005, “Inflation and Growth: Estimation of Threshold Point for Pakistan.” Pakistan Business Review, October.
Mubarik, Yasir A., 2005, “Inflation and Growth: An Estimation of Threshold Level of Inflation in Pakistan.” SBP Research Bulletin, 1:5-34.
State Bank of Pakistan, 2005, Handbook of Statistics on Pakistan Economy, Statistics Department.
Tukey, John W., 1977, Exploratory Data Analysis, Addison Wesley, Reading Massachusetts.

The Lahore Journal of Economics Special Edition (September 2008): pp. 95-116
Public Policy Fundamentals for Sustainable and Inclusive
Growth
Ijaz Nabi*
Abstract
Pakistan has seen strong economic growth in recent years accompanied by a reduction in poverty. However, growth has been concentrated, which has meant that regional and inter-personal disparities are on the rise. In a contestable political environment, this casts a shadow on the sustainability of high growth. The budget, a corrective instrument, has been subject to boom and bust cycles because of rigid claims, poor tax effort and external shocks, rendering it ineffective in addressing long term priorities. This paper argues that robust budgets for sustained and inclusive growth require government programs to be credible (monitoring and evaluation and public information) and cost effective (streamlined budget cycle, public-private partnerships); this will help increase citizen willingness to pay for public programs via improved tax compliance.
JEL Classification: E22, E23, O43
Keywords: Pakistan, Budget, Growth
A. Sustainable and Inclusive Growth in South Asia and in Pakistan
South Asian economies have seen robust growth in the last 7 years (2001-2007, Figure-1). The big three, India, Pakistan and Bangladesh, registered average growth of 5.5 percent or more; 2007 real GDP growth was, on average, 1 percentage point higher. Pakistan, as a result of policy reform and a more favorable external environment, finally emerged out of the doldrums of the 1990’s to get back to its historical trend growth rate of 6 percent.
* Sector Manager, Economic Policy, South Asia Region, World Bank, Washington DC.
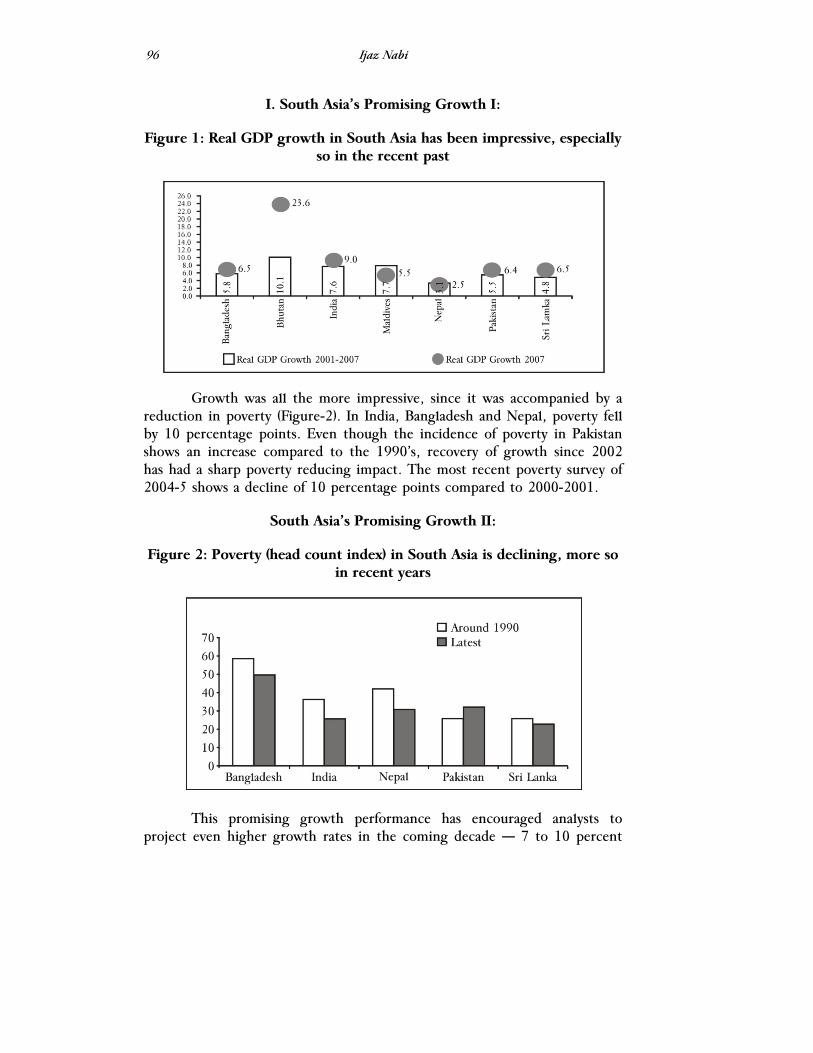
Ijaz Nabi
96
I. South Asia’s Promising Growth I:
Figure 1: Real GDP growth in South Asia has been impressive, especially so in the recent past
Growth was all the more impressive, since it was accompanied by a reduction in poverty (Figure-2). In India, Bangladesh and Nepal, poverty fell by 10 percentage points. Even though the incidence of poverty in Pakistan shows an increase compared to the 1990’s, recovery of growth since 2002 has had a sharp poverty reducing impact. The most recent poverty survey of 2004-5 shows a decline of 10 percentage points compared to 2000-2001.
South Asia’s Promising Growth II:
Figure 2: Poverty (head count index) in South Asia is declining, more so in recent years
This promising growth performance has encouraged analysts to project even higher growth rates in the coming decade — 7 to 10 percent
Public Policy Fundamentals for Sustainable and Inclusive Growth
97
— and argue that this will result in the highly desirable objective of complete elimination of poverty in our lifetime8. Of course, the recent oil and food price shocks were not taken into account in constructing these positive scenarios.
It is well understood that such desirable outcomes are predicated on movements on many structural dimensions, the most critical is rising inequality across income groups and across regions. In India, average income per capita in the four richest southern states (Kerala, Tamil Nadu, Andhra Pradesh and Karnataka) is nearly three times the income per capita of the largest two northern states (UP and Bihar), and with much higher GDP growth rates, the Southern states are poised to gallop ahead even faster. Poverty outcomes are similarly differentiated. The two northern states have poverty rates (38 percent) that are twice the rate in the four southern states. In Pakistan’s Punjab, poverty incidence in Southern Punjab (40 percent) is substantially higher than in the Northern and Central districts (30 and 32 percent respectively).
Large geographical differences in income growth and poverty outcomes are the undesirable features of South Asia’s growth performance and, in an increasingly contestable political environment, cast a shadow on the sustainability of rapid economic growth over long periods of time.
This paper reviews the structural imbalances that need to be addressed for sustainable and inclusive growth (Section B) and points out the centrality of the budget as an instrument to address the imbalances. It then (Section C) argues that the budget has been unable to address medium term development priorities because of its boom and bust cycles. Those cycles are best broken through a greater willingness by citizens to pay for public programs, but that will happen when there is greater citizen buy-in of public programs and the programs are more efficiently administered to make the tax rupee go further (Section D).
B. The Structural Imbalances that Need to be Addressed for High and Inclusive Growth
Sustained high growth is also predicated on improvement in the quality of the work force and infrastructure in order to sustain productivity growth in manufacturing and services. On these dimensions, comparisons with East Asia show that all South Asian economies lag far behind their East Asian neighbors that have enjoyed rapid economic growth over several
8 Devarajan and Nabi, 2006.

Ijaz Nabi
98
decades (Figure-3 and Figure-4), and many have already acquired middle income status along with single digit poverty incidence.
Figure-3: Is High Growth in South Asia Sustainable? II: Obstacles that might become the next binding constraints; Insufficient power and port
facilities Difference in Infrastructure in South and East Asia
Figure-4: The Work Force Deficit Trainability attributes of workers in South and East Asia
Pakistan’s Chronic Imbalance
A notable feature of Pakistan’s public expenditure patters is that outcomes, as measured in access to services, are heavily biased towards infrastructure compared to social services (Table-1). On six key social indicators viz. infant mortality rate, under five mortality rate, total fertility rate and primary school enrollment rate, outcomes are worse than other countries at
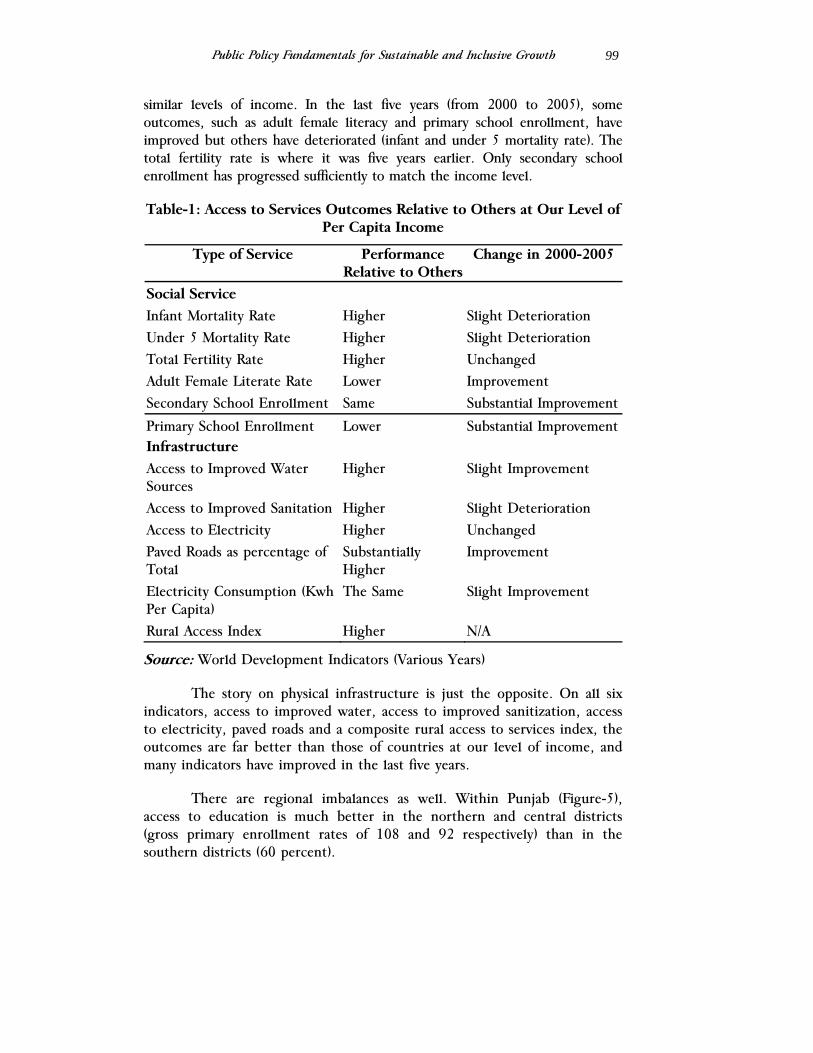
Public Policy Fundamentals for Sustainable and Inclusive Growth
99
similar levels of income. In the last five years (from 2000 to 2005), some outcomes, such as adult female literacy and primary school enrollment, have improved but others have deteriorated (infant and under 5 mortality rate). The total fertility rate is where it was five years earlier. Only secondary school enrollment has progressed sufficiently to match the income level.
Table-1: Access to Services Outcomes Relative to Others at Our Level of Per Capita Income
Type of Service Performance Relative to Others
Change in 2000-2005
Social Service Infant Mortality Rate Higher Slight Deterioration Under 5 Mortality Rate Higher Slight Deterioration Total Fertility Rate Higher Unchanged Adult Female Literate Rate Lower Improvement Secondary School Enrollment Same Substantial Improvement
Primary School Enrollment Lower Substantial Improvement Infrastructure Access to Improved Water Sources
Higher Slight Improvement
Access to Improved Sanitation Higher Slight Deterioration Access to Electricity Higher Unchanged Paved Roads as percentage of Total
Substantially Higher
Improvement
Electricity Consumption (Kwh Per Capita)
The Same Slight Improvement
Rural Access Index Higher N/A
Source: World Development Indicators (Various Years)
The story on physical infrastructure is just the opposite. On all six indicators, access to improved water, access to improved sanitization, access to electricity, paved roads and a composite rural access to services index, the outcomes are far better than those of countries at our level of income, and many indicators have improved in the last five years.
There are regional imbalances as well. Within Punjab (Figure-5), access to education is much better in the northern and central districts (gross primary enrollment rates of 108 and 92 respectively) than in the southern districts (60 percent).
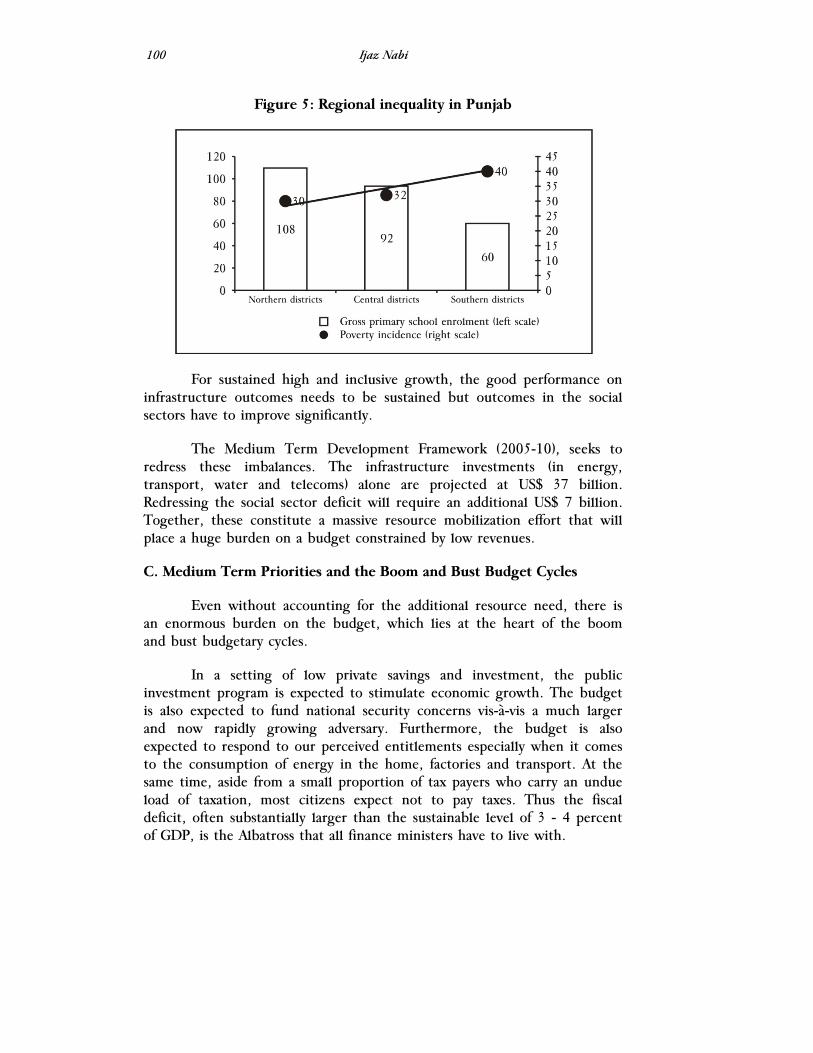
Ijaz Nabi
100
Figure 5: Regional inequality in Punjab
For sustained high and inclusive growth, the good performance on infrastructure outcomes needs to be sustained but outcomes in the social sectors have to improve significantly.
The Medium Term Development Framework (2005-10), seeks to redress these imbalances. The infrastructure investments (in energy, transport, water and telecoms) alone are projected at US$ 37 billion. Redressing the social sector deficit will require an additional US$ 7 billion. Together, these constitute a massive resource mobilization effort that will place a huge burden on a budget constrained by low revenues.
C. Medium Term Priorities and the Boom and Bust Budget Cycles
Even without accounting for the additional resource need, there is an enormous burden on the budget, which lies at the heart of the boom and bust budgetary cycles.
In a setting of low private savings and investment, the public investment program is expected to stimulate economic growth. The budget is also expected to fund national security concerns vis-à-vis a much larger and now rapidly growing adversary. Furthermore, the budget is also expected to respond to our perceived entitlements especially when it comes to the consumption of energy in the home, factories and transport. At the same time, aside from a small proportion of tax payers who carry an undue load of taxation, most citizens expect not to pay taxes. Thus the fiscal deficit, often substantially larger than the sustainable level of 3 - 4 percent of GDP, is the Albatross that all finance ministers have to live with.

Public Policy Fundamentals for Sustainable and Inclusive Growth
101
A higher than sustainable fiscal deficit in normal times means that the budget cannot sustain directional shifts to the economy, such as greater expenditure in the poorer regions and build up reserves for contingencies due to internal and external shocks. Even expenditure outlays to bridge glaring social deficits in education and health cannot be sustained with the slightest tightening of the funding environment.
The burden on the budget is especially heavy in an environment of considerable vulnerability to external shocks. These shocks typically manifest themselves in terms of high energy prices and high interest rates on public debt. Occasionally, the external shock is triggered by decisions regarding national security (such as the 1998 nuclear explosion). Such shocks tighten the funding of deficits from external commercial sources and inflict painful adjustments.
The other implication of larger than sustainable fiscal deficits over a sustained period of time is that there is high dependency on foreign donors --- both bilateral and multilateral.
This is a source of discomfort since such official funding is conditional on support to major donors’ geo-political concerns and development priorities.
The current fiscal crisis thus has a familiar ring (Figures 6-8). In the late 1990s and early 2000s, under the supervision of an IMF austerity program, measures for fiscal tightening were put in place that eventually bore results. In 2001-06, the fiscal deficit was maintained at sustainable levels of 4 percent or less. Subsidies (including greater pass through of energy prices and setting up mechanisms to do so on a regular basis) were cut back and defense spending was moderated, but the bulk of adjustment came via a steep reduction in public investment and continued under-spending on the social sectors. Revenue performance continued to be anemic because of weak economic growth and poor collections.
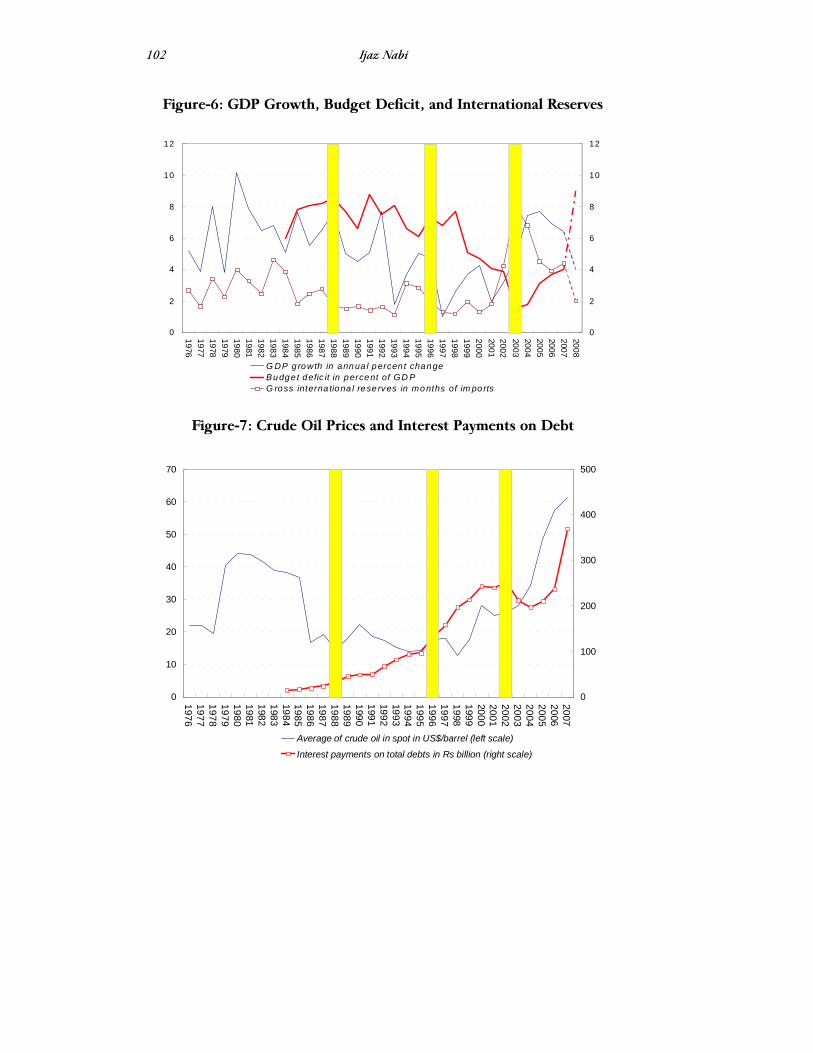
Ijaz Nabi
102
Figure-6: GDP Growth, Budget Deficit, and International Reserves
0
2
4
6
8
10
12
197619771978197919801981198219831984198519861987198819891990199119921993199419951996199719981999200020012002200320042005200620072008
0
2
4
6
8
10
12
G DP g rowth in annua l percen t changeBudge t defic it in percent of GD PG ross interna tiona l rese rves in months of im po rts
Figure-7: Crude Oil Prices and Interest Payments on Debt
0
10
20
30
40
50
60
70
19761977197819791980198119821983198419851986198719881989199019911992199319941995199619971998199920002001200220032004200520062007
0
100
200
300
400
500
Average of crude oil in spot in US$/barrel (left scale)
Interest payments on total debts in Rs billion (right scale)
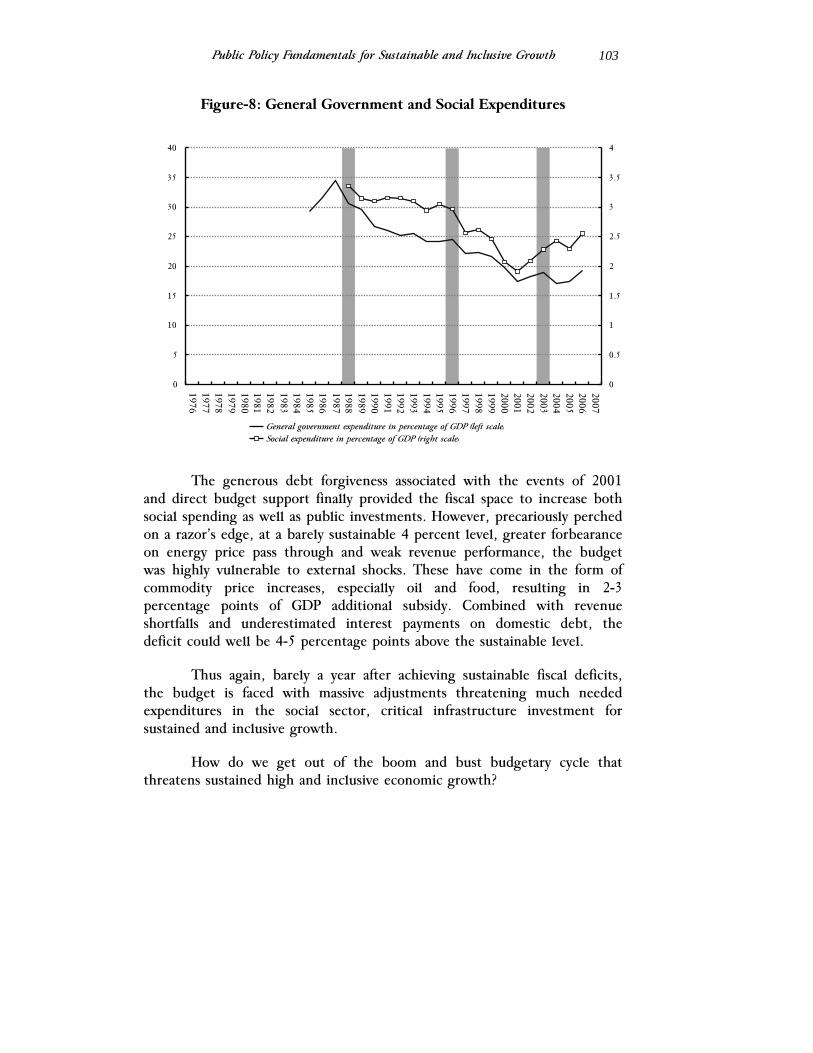
Public Policy Fundamentals for Sustainable and Inclusive Growth
103
Figure-8: General Government and Social Expenditures
The generous debt forgiveness associated with the events of 2001 and direct budget support finally provided the fiscal space to increase both social spending as well as public investments. However, precariously perched on a razor’s edge, at a barely sustainable 4 percent level, greater forbearance on energy price pass through and weak revenue performance, the budget was highly vulnerable to external shocks. These have come in the form of commodity price increases, especially oil and food, resulting in 2-3 percentage points of GDP additional subsidy. Combined with revenue shortfalls and underestimated interest payments on domestic debt, the deficit could well be 4-5 percentage points above the sustainable level.
Thus again, barely a year after achieving sustainable fiscal deficits, the budget is faced with massive adjustments threatening much needed expenditures in the social sector, critical infrastructure investment for sustained and inclusive growth.
How do we get out of the boom and bust budgetary cycle that threatens sustained high and inclusive economic growth?
0
5
10
15
20
25
30
35
40
1976
0
0.5
1
1.5
2
2.5
3
3.5
4
General government expenditure in percentage of GDP (left scale)Social expenditure in percentage of GDP (right scale)
1977197819791980198119821983198419851986198719881989199019911992199319941995199619971998199920002001200220032004200520062007
Ijaz Nabi
104
D. The Design of Public Policy for Fiscal Prudence to Sustain High, Inclusive Growth
Here is an illuminating anecdote from a prosperous Lahore neighborhood that has stimulated the analytical framework for this paper.
By the early 1990s, public space in this prosperous neighborhood had deteriorated sharply. Street lights barely worked, roads were potholed and the public park had gone to the dogs, literally. The residents of big houses on large lots had private gardens and did not care much for the public space. Fifteen years ago, one of the large houses was sold and converted into twenty town houses. The new residents needed their public space, which required additional expenditure above what the municipality could provide. They came together and devised the strategy of first improving public services (street lighting, guard petrol) and circulating their accounts to the residents. This was followed by a highly successful campaign at raising revenues, and the cycle was repeated. The neighborhood now is well lit, has orderly public space and a great public park. The government saw the success and chipped in with a road re-surfacing program.
Drawing upon this micro experience, which is similar to what happens worldwide on larger scale, this paper argues that putting the fiscal house in order requires addressing the design of public policy in the following areas:
1. Citizen ownership of public programs, which entails:
• Making expenditures credible via monitoring and evaluation of outcomes;
• Improving the quality of data and statistics for evidence based policy making;
2. Efficiency of public expenditure, which requires:
• Streamlining the project cycle at all tiers of the government;
• Seeking public private partnership in the provision of infrastructure and services;
3. Revenue collection;
Public Policy Fundamentals for Sustainable and Inclusive Growth
105
D.1a: Citizen Ownership of Public Programs: Strengthen Monitoring and Evaluation
Proper monitoring and evaluation of ongoing public programs helps ensure that expected outcomes are indeed being achieved. This enhances the credibility of programs and promotes citizen buy-in and willingness to pay either directly while using the service or indirectly via taxation. For example, the program of basic health units (BHUs) that was intended to provide basic health care (respiratory, skin and stomach related illnesses) to citizens quickly lost credibility as doctors did not show up, paramedical staff absconded and medicines were pilfered. Before long, the buildings became grain stores and animal shelters.
There is similar evidence of rampant teacher absenteeism (15-20 percent) in government run primary schools, which also get converted into storage spaces and animal shelters for the area’s influential farmers. Such evidence of neglect and misappropriation does little to boost citizen credibility and willingness to pay taxes.
Following the establishments of district governments, some nazims have implemented imaginative programs along with strict monitoring to curb doctor absenteeism in BHUs. This rehabilitated the physical structures and the credibility of the program as evidenced in the throngs of rural poor in the rehabilitated BHUs.
Monitoring and evaluation of public programs contributes to improving the design of public programs through feedback loops. Learning and Educational Achievements in Punjab School (LEAPS), a study funded by the World Bank, Pomona College, USA, the Knowledge for Change Program and others, is a good example of using the latest evaluation techniques to inform the design of education expenditures in Pakistan. The study’s objective was to assess the quality of education in public and private primary schools to inform the design of public policy as Pakistan gears up to incur large expenditures to increase primary school enrollment and completion rates.
The study is based on annual surveys in 112 Punjab villages (in 3 districts: Attock in the North, Faisalabad in the Center and Rahim Yar Khan in the South) between 2003 and 2007, covering 812 government and private schools, 12000 students, 5000 teachers, and 2000 households.
The findings of the study are that “government schools require twice the resources to educate a child compared to private schools --- furthermore, children studying in private schools report higher test-scores in

Ijaz Nabi
106
all subjects ---- partly because teachers exert greater effort”, however, “access to private schools is not universal….private schools choose to locate themselves in richer villages and richer settlements within villages, limiting access to poor households….in contrast government schools ensure equal geographical access to all…. government reform should ensure that no child is left behind” in learning achievements.
This evaluation exercise has three important implications for improving the design of the program to achieve better outcomes of the large expected government expenditure in primary education. One is that the government has a critical role in providing information to households for taking informed decisions about school choice. Second, public schools should focus only on those areas where private schools will not go and also on programs that improve teacher quality and reduce teacher absenteeism. Third, the potential for various types of public/private partnerships in the provision of education should be explored for cost effective delivery of education to all.
Taking this approach to public programs in general will go a long way towards improving cost effectiveness of government programs, increase credibility with citizens and hence their willingness to pay taxes to fund government programs.
D.1b: Citizen Ownership of Public Programs: Improve the Quality of Data and Statistics for Evidence Based Policy Making
Achieving better policy outcomes requires evidence based policy making. In turn, that requires credible and timely public information of acceptable standards of quality. Moreover, statistics should be made available to the general public for independent analysis to inform public debate on issues of national concern. Along with an independent and competitive media, timely public information can go a long way in monitoring and evaluating policy outcomes and involving citizen voice in improving the design of programs. Indeed, one can argue that an independent statistical office is as vital a pillar of society as the judiciary and the media.
The recent controversy surrounding GDP growth and poverty reduction estimates underscores the importance of an independent statistical office. The contrast with India is instructive. The media in India and Pakistan are equally skeptical of their respective governments’ statistical pronouncements but with a difference. If both governments announce GDP growth rates of 7 percent, the Indian media reports that it is more like 8 percent; the Pakistani media, on the other hand, reports the government
Public Policy Fundamentals for Sustainable and Inclusive Growth
107
numbers but editorials convey that growth is more like 6 percent or less. The Indian Statistical establishment, though in desperate need of modernization, is considered to be independent while Pakistan’s statistical offices are considered to have lost their independence to Ms Rosy Scenario that haunts the corridors of the Federal Secretariat!9
Such skepticism of government statistics is particularly troublesome as both investors and the media look to evidence-based due diligence and public debate.
Building statistical capacity along with strengthening freedom of information are thus central to modern economic management. A number of steps need to be taken to strengthen statistical capacity. These include:
• Setting up an independent Statistical Commission through an act of parliament headed by a person of reputation and supported by Commission members selected from among users of statistics in the public and private sectors including research establishments.
• The Commission, supported by best available expertise, formulating a strategy for improving the quality and timely availability of statistics.
• Improving the quality of provincial statistical offices by clarifying the relationship between the provincial and federal statistical offices including the latter’s leadership role in capacity building and standardization of statistical norms. Provinces should prepare detailed plans for statistical improvements addressing manpower and hardware needs, and also website development to disseminate statistical information in a timely fashion.
• Being proactive in promoting evidence-based policy making through informed parliamentary oversight of policy implementation and by making data available to researchers and the media on information of public interest.
• Engaging with multi-lateral and bilateral donors to procure best international practice and funding for hardware and human capacity.
9 Attributed to John Wall, former World Bank Country Director for Pakistan.
Ijaz Nabi
108
D.2a. Efficiency of Public Expenditure: Streamline the Project Cycle at All Tiers of the Government
A central question to ask about public expenditures is whether citizens, as tax payers ---now or in the future--- are getting their money’s worth. In other words how efficient is public expenditure? The evidence on this is mixed:
• At the aggregate macro level, Pakistan generally has lower Incremental Capital Output Ratios (ICORs) than most countries which can be interpreted to imply greater overall investment efficiency (both public an private) than most countries.
• Despite lower and frequently disrupted public investment in infrastructure, and lower expenditure on repair and maintenance, Pakistan’s infrastructure outcomes are relatively good compared to countries at its level of income.
• Comparisons across countries for health and education sector-wide public expenditures show that public expenditure in Pakistan is relatively efficient; it ranks in the top 40th -60th percentile in health and top 50th-80th percentile in education.10
• At the micro-project level, however, there is room for greater efficiency, as elaborated below.
A recent study of 37 public projects illustrates the inefficiencies in public investment. On average, the projects took twice as long to complete as stated in the plan, and the cost over-run was 180%. The over-run is greater for public infrastructure projects than social sector projects, and over-run increases when projects are executed jointly by national and sub-national entities.
How inefficient this over-run is depends on how one measures it. It turns out the government departments tend to set a much higher bar of efficiency for their projects compared to international norms. Thus, on average, at planning stages, government agencies set highly ambitious completion time targets and compared to those, it takes twice as long and costs 80 percent more. However, compared to the more realistic international norms for project completion time, the time inefficiency declines to 60 -70%. This is still quite high! With the annual development
10 Herrera and Pang, 2005.
Public Policy Fundamentals for Sustainable and Inclusive Growth
109
plan rising to $10- 12 billion, a time and cost efficiency improvement of 10-20% would save $1-2 billion.
It would take effort on three fronts to achieve greater efficiency at the project level. First, more due diligence at the project entry level is needed to select only the projects that have sorted out the site and land acquisition problems which is often the most important source of project delay. Second, a major effort is needed to improve cash flow over the project cycle. It can take up to 111 days for the funds to be released to the contractor (twice as long at lower tiers of government). Third, when multiple tiers of government are involved, project ownership needs to be clearly established and coordination across line ministries, the Planning Commission, the Finance Department and Accountant General Pakistan Revenues (AGPR) improved to avoid the end-fiscal year crush. Finally, the acute shortage of good project directors needs to addressed through training and mentoring programs (domestic and abroad) and greater use of private sector contractors11.
D.2b. Efficiency of Public Expenditure: Public Private Partnership in the Provision of Infrastructure and Other Services
Imagine a developing country that has scored the following firsts in harnessing public/private partnerships for investment in infrastructure: (i) attracted $ 5.3 billion private investment (a quarter of which was foreign equity) by 20 Independent Power Producers to generate 4500 megawatts of power, including the gigantic single 1292 megawatt, US $1.6 billion, project hailed by Euromoney as the “Deal of the Decade” for its size and complexity, (ii) succeeded in raising $3 billion of foreign debt, from official sources and the international capital market, (iii) established a clear policy framework for executing power generation by private entities and its purchase by a public entity, including indexation of pricing to rising fuel costs and general inflation, (iv) acquired critical skills in the public sector to execute public-private partnerships on a large scale and of great complexity.
The country is Pakistan, the program is Independent Power production and the Deal of the Decade refers to the HUBCO deal. The years of accolades were 1994-1999. As a result of the successful program, Pakistan succeeded in raising power generation from 10,500 MW in 1993 to 17,399 MW in 2000 which, given demand at the time, resulted in an exportable surplus.
11 World Bank, 2007.
Ijaz Nabi
110
Today, following rapid income growth in the last six years, Pakistan is again faced with peak period power shortage of 25 percent, and insufficient power may well become the binding constraint to growth as rising demand for power (expected with high growth rates) is unmatched by supply, thereby dampening demand and GDP growth. This situation is the result of a combination of several factors all rooted in mismanagement of this critical public investment program.
The scope of the investments needed to meet the forecasted demand of 20,160 MW by 2010 and 44000 MW by 202012,13 is such that relying solely on the public sector to provide the additional power makes no sense. This is especially so in light of the fact that since 2000 only one additional power generation plant, the 1,450MW Ghazi Barotha plant, was commissioned in the public sector. Furthermore, large hydroelectric projects such as Kalabagh and even Bhasha dam face huge political challenges. In any case, following the recent increase in fuel costs, food prices and other claims on the budget, the fiscal space for large public projects has shrunk.
However, the rich experience gained from the success of public-private partnership for public investment in the power sector in the 1990s, both the initial euphoria and the subsequent sobering lessons from experience in dispute resolution and work outs, should be harnessed to attract private investment in public infrastructure generally and the power sector especially.
Some of the lessons learned from our own rich experience for forging successful public-private partnerships for investment in infrastructure include: (i) carry out sector-wide reforms to ensure cost effective delivery in the private sector (distribution efficiency and appropriate tariff policies are key), (ii) address the structure of public infrastructure providers to allow the market mechanism to operate as much as possible (in the power sector, unbundling of WAPDA to promote competition and associated efficiencies), (iii) put in place transparent, competitive, bidding procedures staggered over time to avoid information bottlenecks and suspicion of wheeling-dealing by political rivals, (iv) carry out thorough due diligence for contingent liabilities (especially for obligations denominated in foreign currency and (v) establish independent, well-staffed, regulatory bodies that allow for a smooth pass through of costs in the pricing of infrastructure services.
12 WAPDA, 2006. 13 Hydrocarbon Institute of Pakistan, 2005.
Public Policy Fundamentals for Sustainable and Inclusive Growth
111
D.3. Strengthen Revenue Collection
Pakistan’s (consolidated) revenue mobilization at 14.9 percent of GDP is half that of developed countries, considerably lower than middle income countries (Malaysia 23%, Mexico 22%), and also does not compare well with countries at $1000 income per capita (China 16%, Indonesia 16.5%) or neighboring India (18.4%). This pattern of lackluster revenue effort persists for total tax revenues and also for the principal tax instruments i.e. income and sales tax.
Moreover, revenue effort tracks GDP growth poorly. Between 1999/2000 and 2002/03, when GDP growth was a lackluster 3.5 percent, revenue increased from 13.4 percent of GDP to 14.9 percent. But between 2002/03 and 2005/06, when average GDP growth recovered to an impressive 7 percent, there was virtually no revenue growth. Over the same period in India, average GDP growth of 7.3 percent was accompanied by average revenue growth of 2.5 percent of GDP.
Nearly a third of Pakistan’s total revenue is accounted for by non-tax revenues and this ratio has changed little in the rapid growth period. This revenue structure partly accounts for the poor elasticity with respect to growth since the principal sources of non-tax revenue (charges for services provided by civil administration (35%) and income from property and enterprises (29%)) are not responsive to GDP growth.
One striking feature of Pakistan’s tax system is that, despite the Federal structure of the country, provincial governments account for a tiny share (5 percent) of the consolidated tax revenue. The rest is collected by the Federation via the Federal (previously Central) Board of Revenue. A comparison of Indian and Pakistani Punjabs, both components of their respective federations, illustrates this (Figure-9). The share of own taxes to provincial/state GDP is a paltry 0.6 percent in Pakistan’s Punjab, while it is 6.8 percent in the Indian Punjab. Thus provincial governments, closer to tax payers both in terms of service delivery as well as by sources of income generation, are engaged in efforts to increase tax revenues. Instead, they continue to be dependent on federal transfers to meet their expenditure needs. Pakistani Punjab’s receives 4.6% of provincial GDP in transfers from the Center compared to the Indian Punjab (1.6 percent of State GDP).
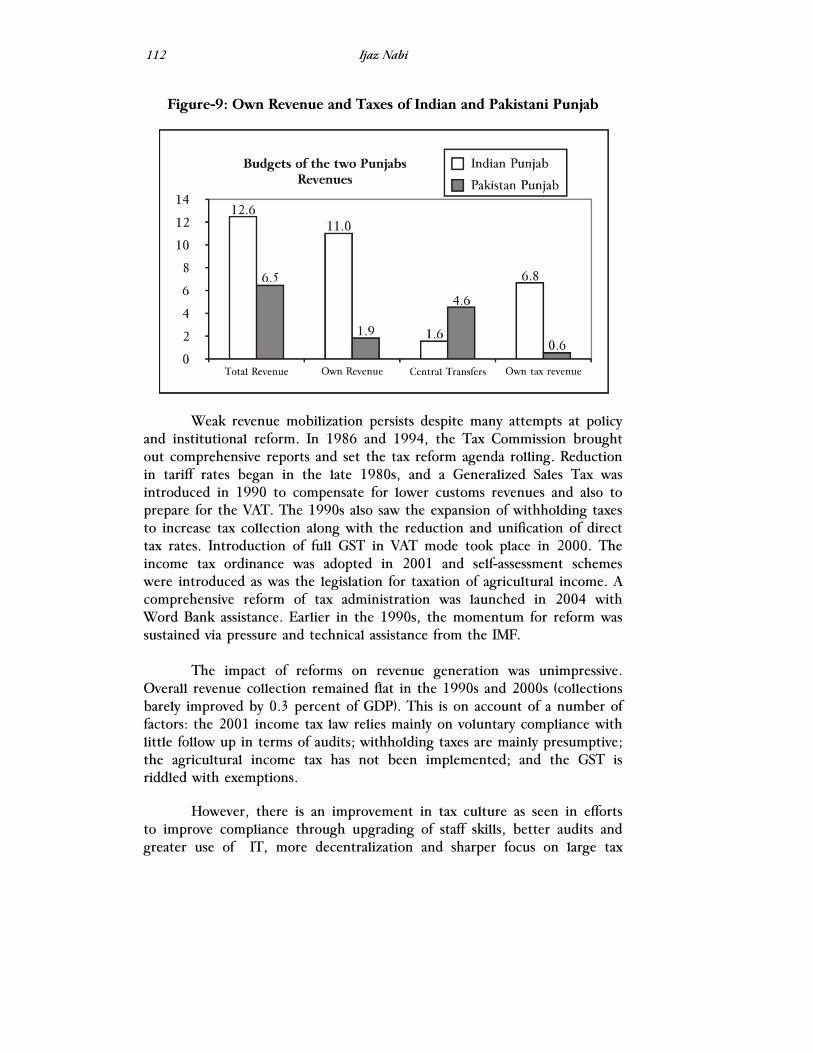
Ijaz Nabi
112
Figure-9: Own Revenue and Taxes of Indian and Pakistani Punjab
Weak revenue mobilization persists despite many attempts at policy and institutional reform. In 1986 and 1994, the Tax Commission brought out comprehensive reports and set the tax reform agenda rolling. Reduction in tariff rates began in the late 1980s, and a Generalized Sales Tax was introduced in 1990 to compensate for lower customs revenues and also to prepare for the VAT. The 1990s also saw the expansion of withholding taxes to increase tax collection along with the reduction and unification of direct tax rates. Introduction of full GST in VAT mode took place in 2000. The income tax ordinance was adopted in 2001 and self-assessment schemes were introduced as was the legislation for taxation of agricultural income. A comprehensive reform of tax administration was launched in 2004 with Word Bank assistance. Earlier in the 1990s, the momentum for reform was sustained via pressure and technical assistance from the IMF.
The impact of reforms on revenue generation was unimpressive.
Overall revenue collection remained flat in the 1990s and 2000s (collections barely improved by 0.3 percent of GDP). This is on account of a number of factors: the 2001 income tax law relies mainly on voluntary compliance with little follow up in terms of audits; withholding taxes are mainly presumptive; the agricultural income tax has not been implemented; and the GST is riddled with exemptions.
However, there is an improvement in tax culture as seen in efforts to improve compliance through upgrading of staff skills, better audits and greater use of IT, more decentralization and sharper focus on large tax
Public Policy Fundamentals for Sustainable and Inclusive Growth
113
payers, improvement in the data base of registered tax payers and setting up an integrated tax management system.
A significant improvement is that the composition of taxes is evolving in the right direction. High import tariffs that distort production have come down from an average of 50 percent in 1995 to 15 percent in 2007. Also, excise duties and surcharges on gas and petroleum have been removed or reduced. Following these measures, the share of direct (39%) and sales (36%) taxes in total tax revenue has increased to 75 percent (60% in 2000) while the share of excise (9%) and customs (16%) taxes has fallen. This bodes well for efficient resource allocation in the economy but has not done much for overall revenue collection. Following the reduction in tariffs between the 1990s and 2000s, revenue from customs duties fell from 4 percent of GDP to 1.5 percent. Similarly, phasing out of excise and surcharges on gas and petroleum resulted in revenue loss of 3.5 percent of GDP. This handing back of “bad” taxes (to the tune of 5.5 percent o GDP) to economic agents has not been compensated for by raising similar revenues through less distorting taxes on consumption and income.
But the full revenue generation potential, as shown in many examples from developing countries of successful tax reform, has not been realized.
Recognizing that potential, FBR has set some ambitious targets. It aims to increase tax collection on direct and sales taxes by 4.5 percentage points of GDP by 2016/17 to off-set the revenue loss. This implies an annual increase of tax collection by 0.5 percent of GDP. This will happen only if there is progress on all key fronts viz. broadening the tax base of the “good” taxes, phasing out exemptions (estimates are that all told these cost 6.5 GDP in foregone tax revenue) and sharing the efficiencies with tax payers by lowering rates (and thereby motivating greater compliance).
General Sales Tax
Consumption, a proxy for the sales tax base, has grown rapidly in the last 5 years, while GST collection has fallen by 0.6 percent of GDP. This is largely because of exemptions. With fewer exemptions, and a tax rate of 15 percent rate, GST should yield between 6 to 7 percent of GDP in tax collection rather than the current 3.5 percent. To achieve these targets, a large part of the services sector that includes retail and wholesale trade, transport, construction, electricity, hotels, and restaurants, currently exempted, need to be brought into the tax net.
Ijaz Nabi
114
Furthermore, zero rating of the textile chain, that constitutes a large part of manufacturing, has narrowed the tax base and has increased undocumented economic transactions. The textile chain needs to be brought into the tax net, and the problems of corruption and inefficiencies associated with duty drawbacks on export activities can be solved through streamlining procedures and information technology rather than exemptions.
The threshold of Rs 5 million turnover for GST registration is high by international standards and results in less than 2 percent of firms filing returns. This needs to be reduced to bring more firms into the tax base. India’s successful experience with this tax can be useful in realizing the potential revenue increase from this tax instrument.
Direct Taxes
Exemptions (on pension income, income from federal securities, mutual funds and capital gains on assets other than immovable property) in the second schedule of income tax ordinance “cost” Rs 230 billion (nearly 3 percent of GDP) in foregone tax revenue and need to be reduced.
FBR collects income tax via withholding schemes rather than taxing wages and salaries directly. This lowers collections due to widespread evasion. With advances in information technology and better outreach, salaries and wages should be taxed directly.
Favorable treatment of small companies (lower tax rate of 20 percent as opposed to 35 percent for corporations) results in firms opting to remain small. This may lead to sub-optimal growth strategies and loss of potential tax revenue. This calls for equal treatment of firms and also for improving presumptive taxation of small businesses.
Provincial Taxes
Sub-national entities will have to play their proper role in improving revenue collection. The key features are effective taxation of services (already devolved to provinces) and expanding the property tax base. Given the huge recent increase in property values, it makes no sense for Lahore to suck in resources from small towns like Bhakkar, Muzaffargarh or Pakpattan. Provincial governments need to be motivated to improve tax administration (via IT, training and rational business practices) to enlarge their tax base. But this will require tackling the design of National Financial Commission award that, as currently structured, does not reward such effort.
Public Policy Fundamentals for Sustainable and Inclusive Growth
115
E. Conclusion
Even without the recent increase in commodity prices, the budget faced huge development challenges. Smoothing out the boom and bust cycle of the budget and allowing it to play the role of steering the economy towards sustained and stable growth will require a substantial mobilization of resources. This paper has argued that the need for additional revenues, and therefore an inordinately high tax burden, can be mitigated by using scare public resources efficiently and through public-private partnerships in infrastructure and social investments. It is also argued that greater citizen buy-in of public programs should be sought through proper monitoring and evaluation of programs and greater access to quality and timely information. This will encourage greater tax compliance and will help raise the revenues to meet the development challenges.
Ijaz Nabi
116
References Devarajan, S. and Nabi, I., 2006, “Economic Growth in South Asia;
Promising, Unequalizing, Sustainable” Economics and Politics Weekly.
Herrera, S. and Pang, G., 2005, “Efficiency of Public Spending in
Developing Countries: An Efficiency Frontier Approach,” Policy Research Paper 3645, World Bank, Washington D.C.
Hydrocarbon Institute of Pakistan, 2005, Pakistan Energy Yearbook 2005,
Islamabad. Water and Power Development Authority (WAPDA), 2006, Presentation to
the South Asia-Central Asia Electricity Trade conference, Islamabad. World Bank, 2007, Pakistan Infrastructure Implementation Assessment
Capacity, Washington D.C. World Bank, World Development Indicators, Various Years, Washington D.C.
The Lahore Journal of Economics Special Edition (September 2008): pp. 117-138
The Effects of Rising Food and Fuel Costs on Poverty in
Pakistan
Theresa Thompson Chaudhry and Azam Amjad Chaudhry*
Abstract
The dramatic increase in international food and fuel prices in recent times is a crucial issue for developing countries and the most vulnerable to these price shocks are the poorest segments of society. In countries like Pakistan, the discussion has focused on the impact of substantially higher food and fuel prices on poverty. This paper used PSLM and MICS household level data to analyze the impact of higher food and energy prices on the poverty head count and the poverty gap ratio in Pakistan. Simulated food and energy price shocks present some important results: First, the impact of food price increases on Pakistani poverty levels is substantially greater than the impact of energy price increases. Second, the impact of food price inflation on Pakistani poverty levels is significantly higher for rural populations as compared to urban populations. Finally, food price inflation can lead to significant increases in Pakistani poverty levels: For Pakistan as a whole, a 20% increase in food prices would lead to an 8% increase in the poverty head count.
JEL Classification: D33, E3, R21
Keywords: Pakistan, Poverty, Inflation, Household Budget, Food, Fuel
I. Introduction
Given the recent unprecedented levels of food and fuel prices, and their rapid rise, concern has arisen among policymakers, politicians, and international agencies about the effects of these on their populations and, in particular, the poor. According to the World Bank, global food prices have risen by 83% from February 2005 to February 2008 (see Figure 1). In the first quarter of 2008 alone, the price of wheat exported by the U.S.
* Associate Professor of Economics and Dean of Economics (respectively), Lahore School of Economics. The authors would like to gratefully acknowledge the research assistance of Mehak Ejaz and Usman Sikander.
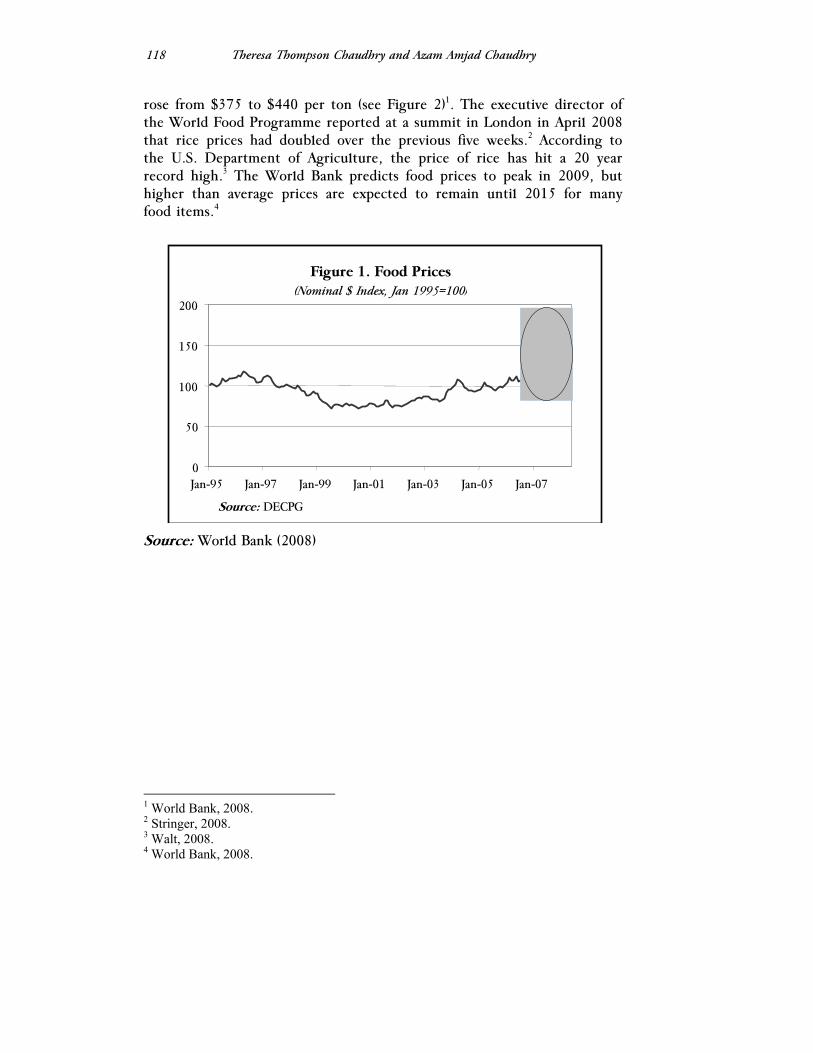
Theresa Thompson Chaudhry and Azam Amjad Chaudhry
118
rose from $375 to $440 per ton (see Figure 2)1. The executive director of the World Food Programme reported at a summit in London in April 2008 that rice prices had doubled over the previous five weeks.2 According to the U.S. Department of Agriculture, the price of rice has hit a 20 year record high.3 The World Bank predicts food prices to peak in 2009, but higher than average prices are expected to remain until 2015 for many food items.4
Figure 1. Food Prices(Nominal $ Index, Jan 1995=100)
0
50
100
150
200
Jan-95 Jan-97 Jan-99 Jan-01 Jan-03 Jan-05 Jan-07
Source: DECPG
Source: World Bank (2008)
1 World Bank, 2008. 2 Stringer, 2008. 3 Walt, 2008. 4 World Bank, 2008.
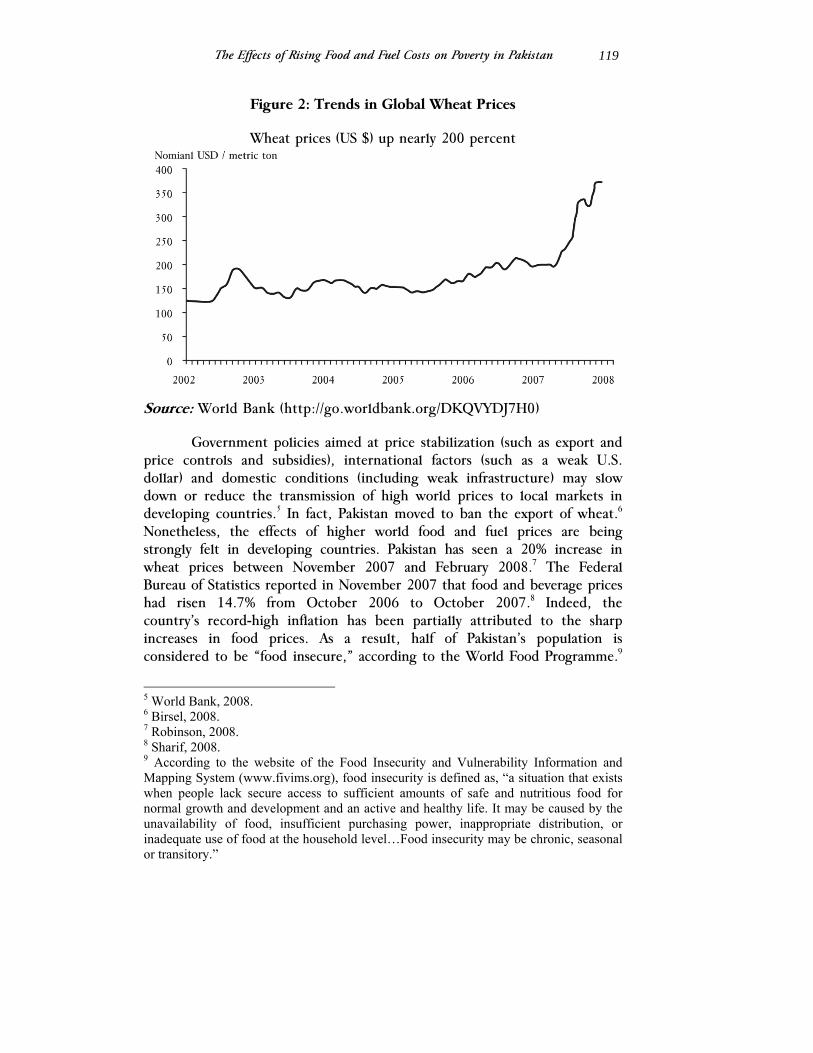
The Effects of Rising Food and Fuel Costs on Poverty in Pakistan
119
Figure 2: Trends in Global Wheat Prices
Wheat prices (US $) up nearly 200 percent
Source: World Bank (http://go.worldbank.org/DKQVYDJ7H0)
Government policies aimed at price stabilization (such as export and price controls and subsidies), international factors (such as a weak U.S. dollar) and domestic conditions (including weak infrastructure) may slow down or reduce the transmission of high world prices to local markets in developing countries.5 In fact, Pakistan moved to ban the export of wheat.6 Nonetheless, the effects of higher world food and fuel prices are being strongly felt in developing countries. Pakistan has seen a 20% increase in wheat prices between November 2007 and February 2008.7 The Federal Bureau of Statistics reported in November 2007 that food and beverage prices had risen 14.7% from October 2006 to October 2007.8 Indeed, the country’s record-high inflation has been partially attributed to the sharp increases in food prices. As a result, half of Pakistan’s population is considered to be “food insecure,” according to the World Food Programme.9
5 World Bank, 2008. 6 Birsel, 2008. 7 Robinson, 2008. 8 Sharif, 2008. 9 According to the website of the Food Insecurity and Vulnerability Information and Mapping System (www.fivims.org), food insecurity is defined as, “a situation that exists when people lack secure access to sufficient amounts of safe and nutritious food for normal growth and development and an active and healthy life. It may be caused by the unavailability of food, insufficient purchasing power, inappropriate distribution, or inadequate use of food at the household level…Food insecurity may be chronic, seasonal or transitory.”
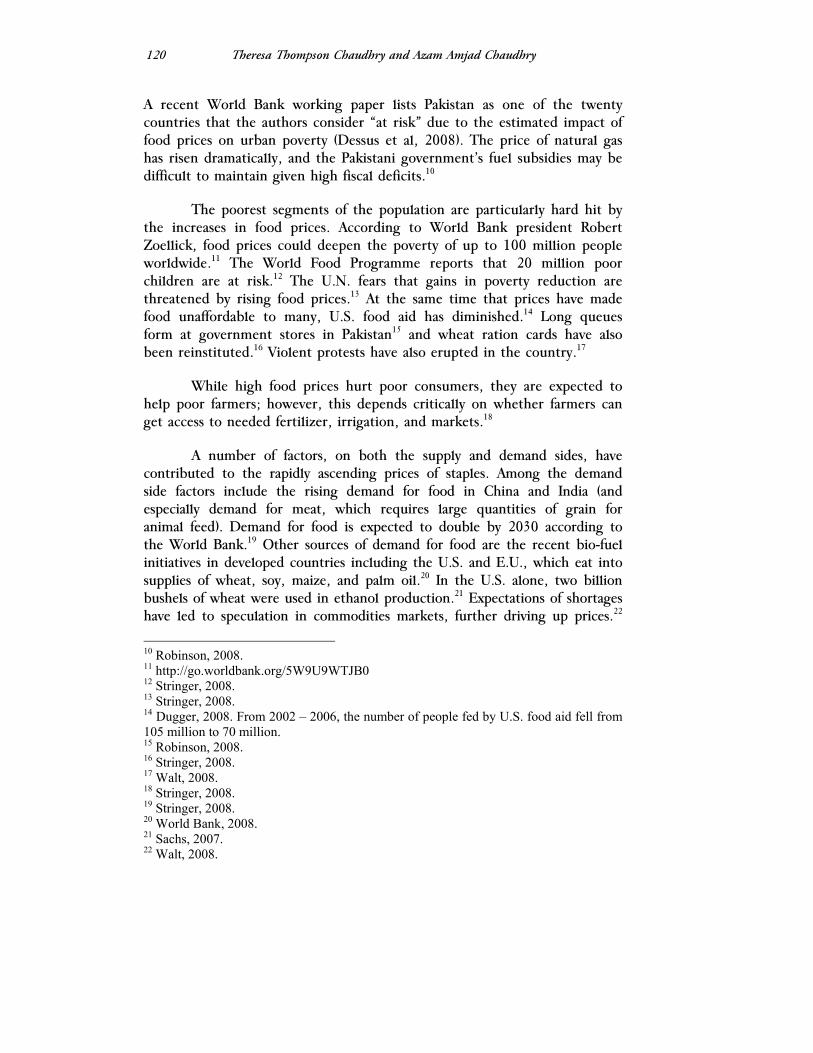
Theresa Thompson Chaudhry and Azam Amjad Chaudhry
120
A recent World Bank working paper lists Pakistan as one of the twenty countries that the authors consider “at risk” due to the estimated impact of food prices on urban poverty (Dessus et al, 2008). The price of natural gas has risen dramatically, and the Pakistani government’s fuel subsidies may be difficult to maintain given high fiscal deficits.10
The poorest segments of the population are particularly hard hit by the increases in food prices. According to World Bank president Robert Zoellick, food prices could deepen the poverty of up to 100 million people worldwide.11 The World Food Programme reports that 20 million poor children are at risk.12 The U.N. fears that gains in poverty reduction are threatened by rising food prices.13 At the same time that prices have made food unaffordable to many, U.S. food aid has diminished.14 Long queues form at government stores in Pakistan15 and wheat ration cards have also been reinstituted.16 Violent protests have also erupted in the country.17
While high food prices hurt poor consumers, they are expected to help poor farmers; however, this depends critically on whether farmers can get access to needed fertilizer, irrigation, and markets.18
A number of factors, on both the supply and demand sides, have contributed to the rapidly ascending prices of staples. Among the demand side factors include the rising demand for food in China and India (and especially demand for meat, which requires large quantities of grain for animal feed). Demand for food is expected to double by 2030 according to the World Bank.19 Other sources of demand for food are the recent bio-fuel initiatives in developed countries including the U.S. and E.U., which eat into supplies of wheat, soy, maize, and palm oil.20 In the U.S. alone, two billion bushels of wheat were used in ethanol production.21 Expectations of shortages have led to speculation in commodities markets, further driving up prices.22
10 Robinson, 2008. 11 http://go.worldbank.org/5W9U9WTJB0 12 Stringer, 2008. 13 Stringer, 2008. 14 Dugger, 2008. From 2002 – 2006, the number of people fed by U.S. food aid fell from 105 million to 70 million. 15 Robinson, 2008. 16 Stringer, 2008. 17 Walt, 2008. 18 Stringer, 2008. 19 Stringer, 2008. 20 World Bank, 2008. 21 Sachs, 2007. 22 Walt, 2008.
The Effects of Rising Food and Fuel Costs on Poverty in Pakistan
121
Recent events have also affected the supply side of global food markets. Among these are high petroleum prices, which increase both the price of fertilizer and transport costs.23 Disruptive weather patterns have led to poor harvests in many regions: lack of rainfall in Australia and southern Africa, flooding in West Africa, cooler than normal temperatures in China, and abnormally warm weather in Europe.24 As a result of these factors, wheat production fell by 29 million metric tons between 2005-2006 and 2006-2007.25,26
In addition to the international developments that have contributed to world price trends, a number of local factors in Pakistan can also be noted. Hoarding by speculating millers and retailers has been reported (both at the time of the elections and again more recently).27 Another factor that has been cited is the breakdown of the joint family system, putting nuclear families at greater risk when they face economic difficulties.28
The rest of the paper will proceed as follows. The data and basic statistics about the expenditure shares of food and fuel will be presented in Section II. The methodology and discussion of results will follow in Sections III and IV. Section V will present conclusions and policy implications.
II. Data and Summary Statistics
This paper uses household level data to analyze the impact of food and energy price increases on the poverty head count and the poverty gap ratio. The data is taken from two different sources: The Pakistan Social and Living Standards Measurement Survey (PLSM), 2004-2005 and the Punjab Multiple Indicators Cluster Survey (MICS), 2003-2004. Household level data was taken from these sources and missing data points and outliers were eliminated from the data sets. After the data was cleaned, the PSLM dataset contained 14,100 households (with 96,833 people), while the MICS dataset contained 29,342 households (with 192,398 people) The basic household level information taken from these surveys were (1) Household size, (2) Household
23 Walt, 2008. As a caveat, the World Bank (2008) notes that energy costs have only contributed to about 15% of the rise in food costs. 24 Walt, 2008. 25 Sachs, 2007. 26 Mitchell (2008) cites biofuels as the most important factor in food price inflation, with higher energy prices, a weak U.S. dollar, speculation, and export bans as other contributing factors. He considers increasing demand in developing countries and weather to be of lesser importance. 27 IRIN, 2008 and Robinson, 2008. 28 Comments of Kaisar Bengali, cited in IRIN, 2008.
Theresa Thompson Chaudhry and Azam Amjad Chaudhry
122
Income, (3) Disaggregated Household Expenditures, (4) Household location (Rural/Urban) and (5) Provincial location of the household (Punjab, Sindh, Northwest Frontier Province (NWFP) and Balochistan).
The first, and most important, piece of information taken from the surveys was the income (in rupees) per household member, which was then compared to the poverty line. The poverty line given by the Government of Pakistan in 2004-2005 (and used in the analysis of the PSLM data) was Rs. 878.64 per person and the poverty line given by the Government of Punjab in 2003-2004 (and used in the analysis of the MICS data) was Rs. 750 per person. Thus, a household was characterized as poor if the average income of its members was below the poverty line. Based upon this criteria, the poverty head count was calculated as the number of people as a proportion on the population that had incomes below the poverty line.
The second piece of information used in the analysis that follows was the disaggregated expenditures of each household. These expenditures can be broken down into a variety of categories, but for the analysis of the poverty head count, five major categories were taken: (1) Food Expenditures, (2) Energy Expenditures (which contained expenditures on gas, electricity, cooking and heating oil and other fuel related expenditures), (3) Educational Expenditures, (4) Medical Expenditures, and (5) Other Expenditures.
The interesting result of looking at this breakdown was the expenditure shares spent by individuals on these different categories, which is illustrated in Figures 3 and 4. As can be seen in Figure 3 (for Pakistan as a whole using PSLM data) and Figure 4 (for Punjab using MICS data), the majority of household expenditures in Pakistan were made up of food expenditures and these expenditures made up an average of about 60% of household expenditures at the lowest income levels for Pakistan and almost 70% of household expenditures at the lowest income levels for Punjab. Also, food expenditures fall as a proportion of total expenditures as the income level increases. After food, the second most major expenditure category across households was energy expenditures, which averaged about 10% of total household expenditures, and did not change across income levels. The third major category was medical expenditures, which averaged about 5% of total household expenditures, and did not vary across income groups. Finally, it can be seen that educational expenditures ranked the lowest in terms of percentage of household expenditures (averaging less than 5% of household expenditures) and increase as a proportion of income as income increases (though not substantially) in both Figure 3 (for Pakistan) and Figure 4 (for Punjab).
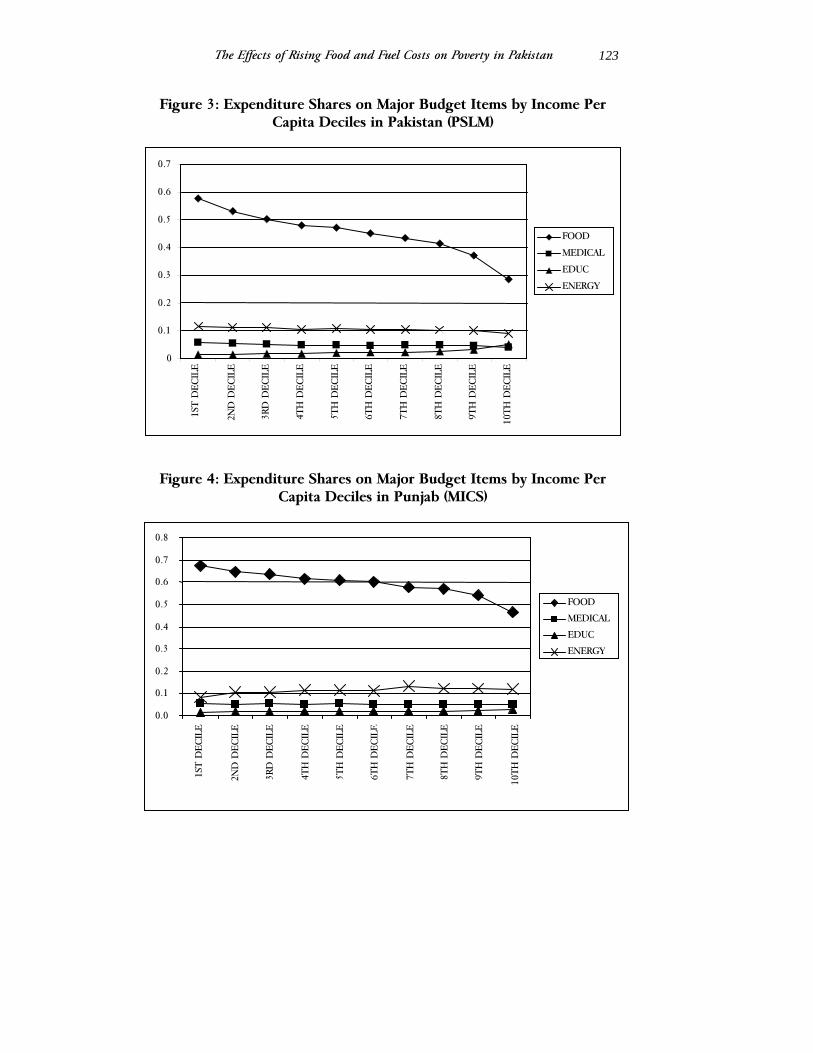
The Effects of Rising Food and Fuel Costs on Poverty in Pakistan
123
Figure 3: Expenditure Shares on Major Budget Items by Income Per Capita Deciles in Pakistan (PSLM)
Figure 4: Expenditure Shares on Major Budget Items by Income Per Capita Deciles in Punjab (MICS)
0.0
0.1
0.2
0.3
0.4
0.5
0.6
0.7
0.8
FOOD MEDICAL
EDUC ENERGY
1ST D
ECIL
E
2ND
DEC
ILE
3RD
DEC
ILE
4TH
DEC
ILE
5TH
DEC
ILE
6TH
DEC
ILE
7TH
DEC
ILE
8TH
DEC
ILE
9TH
DEC
ILE
10TH
DEC
ILE
FOOD MEDICAL
EDUC ENERGY
0
0.1
0.2
0.3
0.4
0.5
0.6
0.7
1ST D
ECIL
E
2ND
DEC
ILE
3RD
DEC
ILE
4TH
DEC
ILE
5TH
DEC
ILE
6TH
DEC
ILE
7TH
DEC
ILE
8TH
DEC
ILE
9TH
DEC
ILE
10TH
DEC
ILE
Theresa Thompson Chaudhry and Azam Amjad Chaudhry
124
III. Methodology
In this paper, we measure the impact of food and energy price changes on two measures of poverty: the poverty head count and the poverty gap ratio.
In the analysis of the impact of price changes on poverty, this paper focuses on the impact of increases in food prices and increases in energy prices. This has been done for two reasons. First and foremost, much of the discussion on rising prices (and the impact of higher prices on the poor) has focused on food and energy prices. Second, the analysis has focused on these particular price changes since the households spend the greatest proportion of their income on food and energy and the impact of changes in these two will have the greatest impact on poverty.
At this stage it is important to note that the impact of food and energy price increases is looked at in a short-term framework. Thus, the effect of food price increases is analyzed without adjusting for the possibility of higher incomes in certain segments of the population due to higher food prices. Also, the analysis does not allow for the possibility of the consumer altering their consumption patterns due to price changes, which may not be an unrealistic assumption in the short run because of the inelasticity of demand for most goods purchased by consumers below or near the poverty line. This simplification makes the analysis far more manageable, though it can lead to the overestimation (or underestimation) of the impact of price increases on the poverty levels and for this reason the poverty impacts should be seen as short term impacts.
The analysis performed for this paper calculated the effects of price changes on poverty head counts and the poverty gap ratio for the PSLM and MICS datasets, and for sub-samples of both these datasets (for rural versus urban areas in both the PSLM and MICS datasets and for the different provinces in the PSLM dataset).
The Poverty Head Count
The poverty head count is simply the percentage of households whose income per capita falls below the poverty line. First, we will show (following Son and Kakwani, 2006b) how we plan to measure the impact of price changes on the poverty head count.
Given the basic expenditure minimization problem (as the dual of the utility maximization problem) from microeconomic theory, we can
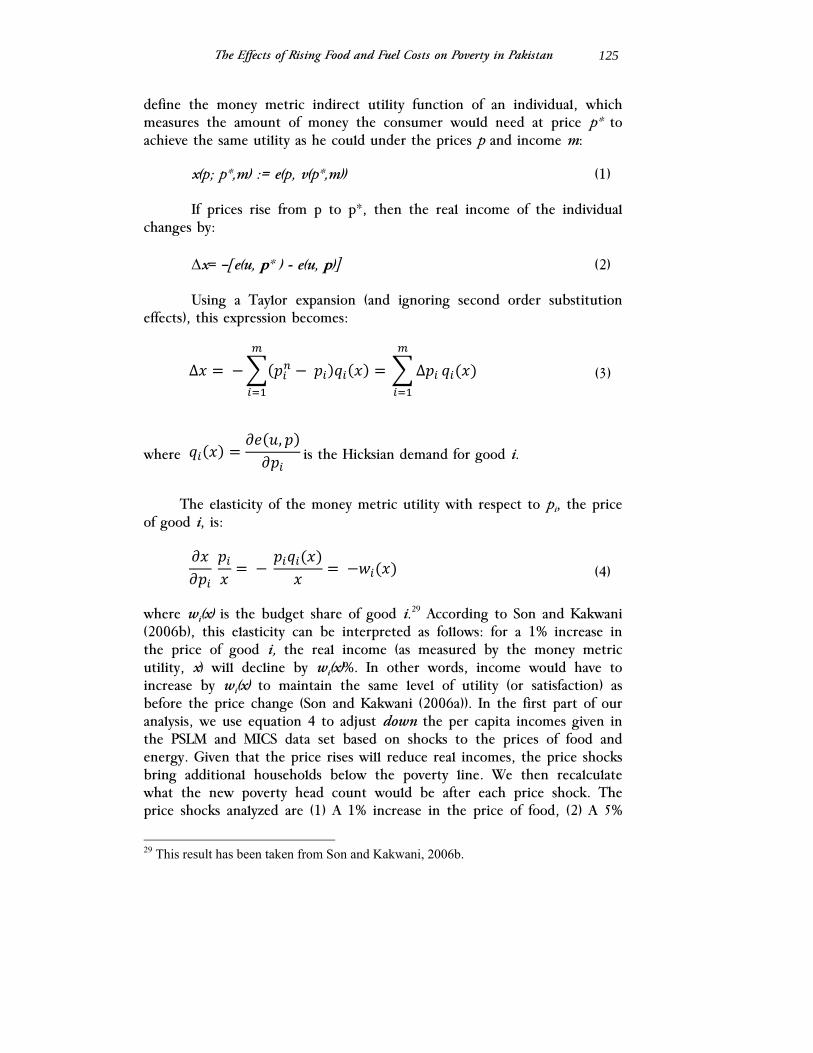
The Effects of Rising Food and Fuel Costs on Poverty in Pakistan
125
define the money metric indirect utility function of an individual, which measures the amount of money the consumer would need at price p* to achieve the same utility as he could under the prices p and income m:
x(p; p*,m) := e(p, v(p*,m)) (1)
If prices rise from p to p*, then the real income of the individual changes by:
Δx= –[e(u, p* ) - e(u, p)] (2)
Using a Taylor expansion (and ignoring second order substitution effects), this expression becomes:
where is the Hicksian demand for good i.
The elasticity of the money metric utility with respect to pi, the price of good i, is:
(4)
where wi(x) is the budget share of good i.29 According to Son and Kakwani (2006b), this elasticity can be interpreted as follows: for a 1% increase in the price of good i, the real income (as measured by the money metric utility, x) will decline by wi(x)%. In other words, income would have to increase by wi(x) to maintain the same level of utility (or satisfaction) as before the price change (Son and Kakwani (2006a)). In the first part of our analysis, we use equation 4 to adjust down the per capita incomes given in the PSLM and MICS data set based on shocks to the prices of food and energy. Given that the price rises will reduce real incomes, the price shocks bring additional households below the poverty line. We then recalculate what the new poverty head count would be after each price shock. The price shocks analyzed are (1) A 1% increase in the price of food, (2) A 5%
29 This result has been taken from Son and Kakwani, 2006b.
∆ ∆ (3)
,

Theresa Thompson Chaudhry and Azam Amjad Chaudhry
126
increase in the price of food, (3) A 10% increase in the price of food, (4) A 20% increase in the price of food, (5) A 1% increase in the price of energy, (6) A 5% increase in the price of energy, (7) A 10% increase in the price of energy, and (8) A 20% increase in the price of energy. Finally, we consider the impact of energy prices along with a rough estimation of the spillover effect of energy prices onto food prices: (9) A 1% increase in the price of energy plus spillover effects on food, (10) A 5% increase in the price of energy plus spillovers, (11) A 10% increase in the price of energy plus spillovers, and (12) A 20% increase in the price of energy plus spillover effects on food. Our rough estimate of the spillover effects of energy prices onto food prices is based on the results of Baffes (2007), which estimated the elasticity of food prices with respect to oil prices to be 0.18.30
The Poverty Gap Ratio
The second part of the analysis looks at the effects of price changes on another measure of poverty, the poverty gap ratio. The poverty gap is defined as:
where α =1, z is the poverty line, x is the per capita income, and f(x) is the density function (for the population). The poverty gap provides an indication of how much the poor households’ per capita incomes fall short of the poverty line. In other words, it is considered a measure of the “depth” of poverty. The poverty gap ratio averages, over all poor households, the proportion by which each household’s income x is below the poverty line z.
Son and Kakwani (2006b) show that the elasticity of poverty with respect to the price of good i is (again setting α =1 for the poverty gap ratio):
Using equation (5) above, we can estimate the elasticity of the poverty gap with respect to changes in the price of commodity i. Given that the commodities considered will be food and energy, we will be able to
30 We calculate (roughly) the joint impact of energy and food prices, where for each 1% increase in energy prices, food prices also increase by 0.18%.
(5)
1
0
(6)
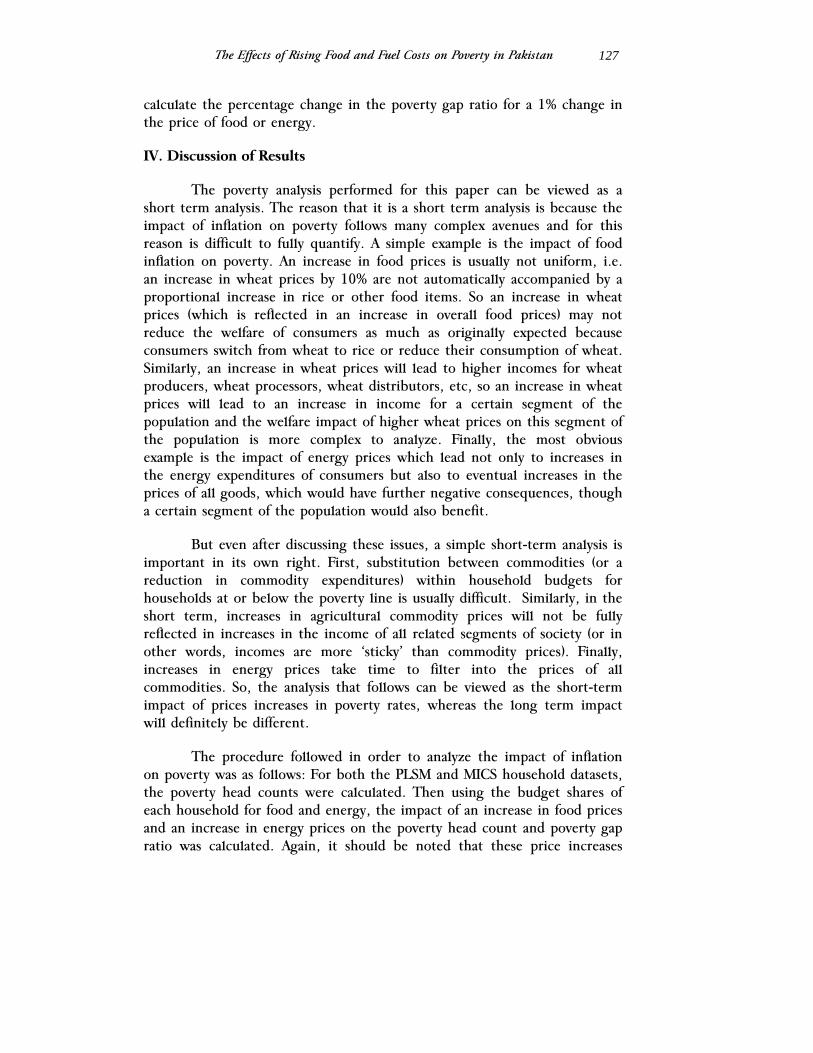
The Effects of Rising Food and Fuel Costs on Poverty in Pakistan
127
calculate the percentage change in the poverty gap ratio for a 1% change in the price of food or energy.
IV. Discussion of Results
The poverty analysis performed for this paper can be viewed as a short term analysis. The reason that it is a short term analysis is because the impact of inflation on poverty follows many complex avenues and for this reason is difficult to fully quantify. A simple example is the impact of food inflation on poverty. An increase in food prices is usually not uniform, i.e. an increase in wheat prices by 10% are not automatically accompanied by a proportional increase in rice or other food items. So an increase in wheat prices (which is reflected in an increase in overall food prices) may not reduce the welfare of consumers as much as originally expected because consumers switch from wheat to rice or reduce their consumption of wheat. Similarly, an increase in wheat prices will lead to higher incomes for wheat producers, wheat processors, wheat distributors, etc, so an increase in wheat prices will lead to an increase in income for a certain segment of the population and the welfare impact of higher wheat prices on this segment of the population is more complex to analyze. Finally, the most obvious example is the impact of energy prices which lead not only to increases in the energy expenditures of consumers but also to eventual increases in the prices of all goods, which would have further negative consequences, though a certain segment of the population would also benefit.
But even after discussing these issues, a simple short-term analysis is important in its own right. First, substitution between commodities (or a reduction in commodity expenditures) within household budgets for households at or below the poverty line is usually difficult. Similarly, in the short term, increases in agricultural commodity prices will not be fully reflected in increases in the income of all related segments of society (or in other words, incomes are more ‘sticky’ than commodity prices). Finally, increases in energy prices take time to filter into the prices of all commodities. So, the analysis that follows can be viewed as the short-term impact of prices increases in poverty rates, whereas the long term impact will definitely be different.
The procedure followed in order to analyze the impact of inflation on poverty was as follows: For both the PLSM and MICS household datasets, the poverty head counts were calculated. Then using the budget shares of each household for food and energy, the impact of an increase in food prices and an increase in energy prices on the poverty head count and poverty gap ratio was calculated. Again, it should be noted that these price increases
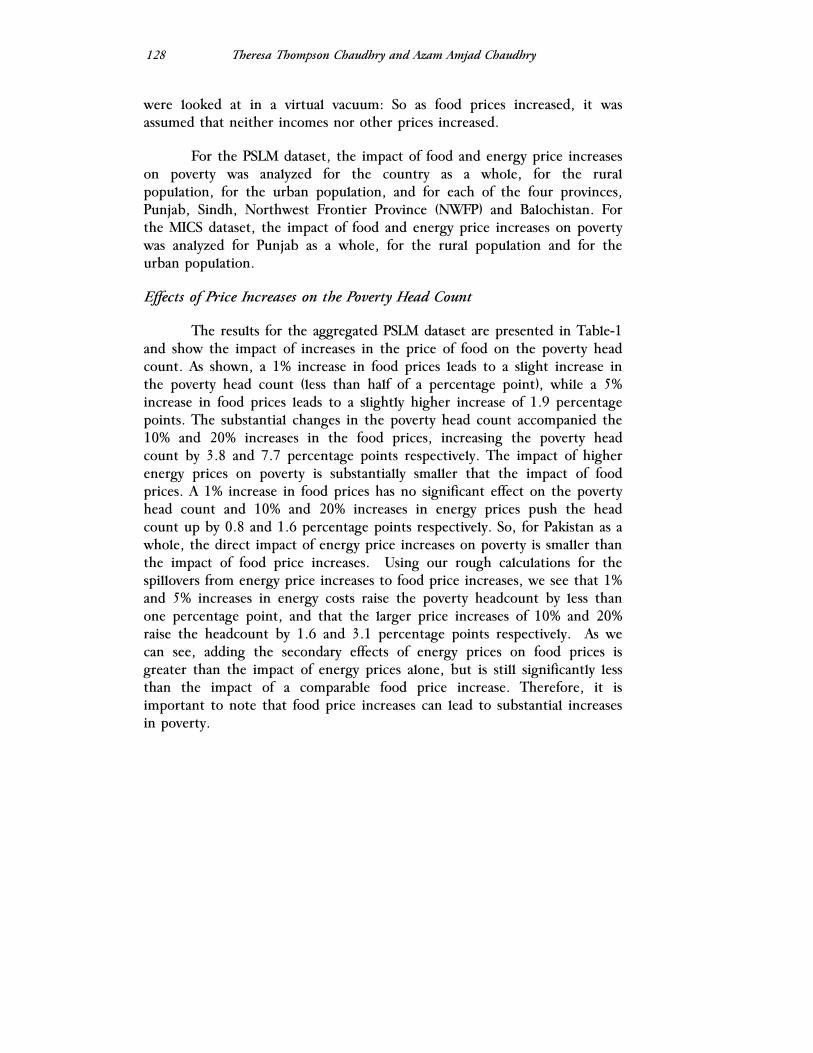
Theresa Thompson Chaudhry and Azam Amjad Chaudhry
128
were looked at in a virtual vacuum: So as food prices increased, it was assumed that neither incomes nor other prices increased.
For the PSLM dataset, the impact of food and energy price increases on poverty was analyzed for the country as a whole, for the rural population, for the urban population, and for each of the four provinces, Punjab, Sindh, Northwest Frontier Province (NWFP) and Balochistan. For the MICS dataset, the impact of food and energy price increases on poverty was analyzed for Punjab as a whole, for the rural population and for the urban population.
Effects of Price Increases on the Poverty Head Count
The results for the aggregated PSLM dataset are presented in Table-1 and show the impact of increases in the price of food on the poverty head count. As shown, a 1% increase in food prices leads to a slight increase in the poverty head count (less than half of a percentage point), while a 5% increase in food prices leads to a slightly higher increase of 1.9 percentage points. The substantial changes in the poverty head count accompanied the 10% and 20% increases in the food prices, increasing the poverty head count by 3.8 and 7.7 percentage points respectively. The impact of higher energy prices on poverty is substantially smaller that the impact of food prices. A 1% increase in food prices has no significant effect on the poverty head count and 10% and 20% increases in energy prices push the head count up by 0.8 and 1.6 percentage points respectively. So, for Pakistan as a whole, the direct impact of energy price increases on poverty is smaller than the impact of food price increases. Using our rough calculations for the spillovers from energy price increases to food price increases, we see that 1% and 5% increases in energy costs raise the poverty headcount by less than one percentage point, and that the larger price increases of 10% and 20% raise the headcount by 1.6 and 3.1 percentage points respectively. As we can see, adding the secondary effects of energy prices on food prices is greater than the impact of energy prices alone, but is still significantly less than the impact of a comparable food price increase. Therefore, it is important to note that food price increases can lead to substantial increases in poverty.
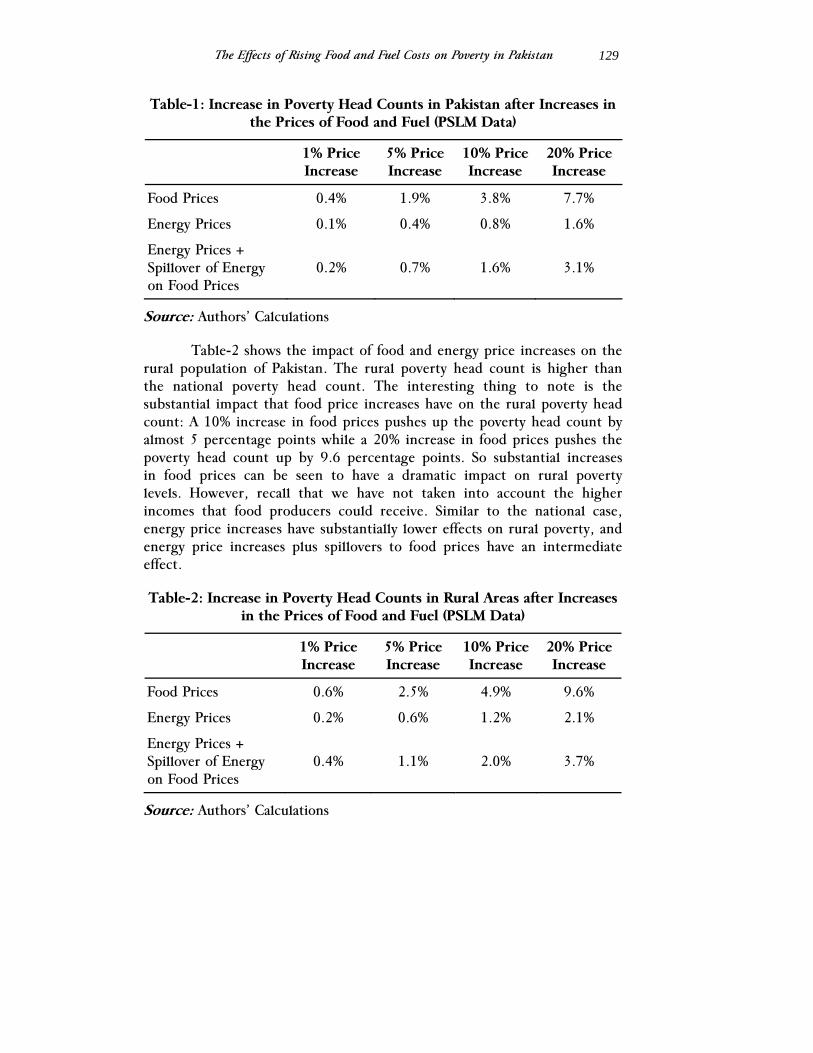
The Effects of Rising Food and Fuel Costs on Poverty in Pakistan
129
Table-1: Increase in Poverty Head Counts in Pakistan after Increases in the Prices of Food and Fuel (PSLM Data)
1% Price Increase
5% Price Increase
10% Price Increase
20% Price Increase
Food Prices 0.4% 1.9% 3.8% 7.7%
Energy Prices 0.1% 0.4% 0.8% 1.6%
Energy Prices + Spillover of Energy on Food Prices
0.2% 0.7% 1.6% 3.1%
Source: Authors’ Calculations
Table-2 shows the impact of food and energy price increases on the rural population of Pakistan. The rural poverty head count is higher than the national poverty head count. The interesting thing to note is the substantial impact that food price increases have on the rural poverty head count: A 10% increase in food prices pushes up the poverty head count by almost 5 percentage points while a 20% increase in food prices pushes the poverty head count up by 9.6 percentage points. So substantial increases in food prices can be seen to have a dramatic impact on rural poverty levels. However, recall that we have not taken into account the higher incomes that food producers could receive. Similar to the national case, energy price increases have substantially lower effects on rural poverty, and energy price increases plus spillovers to food prices have an intermediate effect.
Table-2: Increase in Poverty Head Counts in Rural Areas after Increases in the Prices of Food and Fuel (PSLM Data)
1% Price Increase
5% Price Increase
10% Price Increase
20% Price Increase
Food Prices 0.6% 2.5% 4.9% 9.6%
Energy Prices 0.2% 0.6% 1.2% 2.1%
Energy Prices + Spillover of Energy on Food Prices
0.4% 1.1% 2.0% 3.7%
Source: Authors’ Calculations
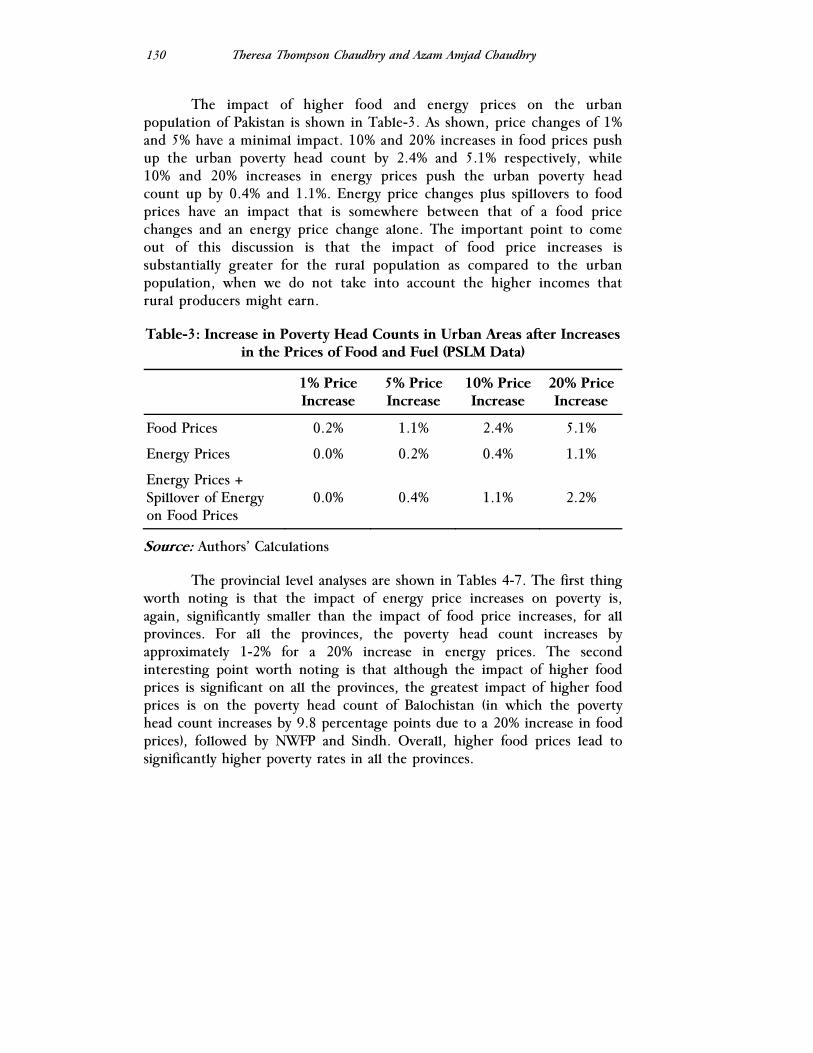
Theresa Thompson Chaudhry and Azam Amjad Chaudhry
130
The impact of higher food and energy prices on the urban population of Pakistan is shown in Table-3. As shown, price changes of 1% and 5% have a minimal impact. 10% and 20% increases in food prices push up the urban poverty head count by 2.4% and 5.1% respectively, while 10% and 20% increases in energy prices push the urban poverty head count up by 0.4% and 1.1%. Energy price changes plus spillovers to food prices have an impact that is somewhere between that of a food price changes and an energy price change alone. The important point to come out of this discussion is that the impact of food price increases is substantially greater for the rural population as compared to the urban population, when we do not take into account the higher incomes that rural producers might earn.
Table-3: Increase in Poverty Head Counts in Urban Areas after Increases in the Prices of Food and Fuel (PSLM Data)
1% Price Increase
5% Price Increase
10% Price Increase
20% Price Increase
Food Prices 0.2% 1.1% 2.4% 5.1%
Energy Prices 0.0% 0.2% 0.4% 1.1%
Energy Prices + Spillover of Energy on Food Prices
0.0% 0.4% 1.1% 2.2%
Source: Authors’ Calculations
The provincial level analyses are shown in Tables 4-7. The first thing worth noting is that the impact of energy price increases on poverty is, again, significantly smaller than the impact of food price increases, for all provinces. For all the provinces, the poverty head count increases by approximately 1-2% for a 20% increase in energy prices. The second interesting point worth noting is that although the impact of higher food prices is significant on all the provinces, the greatest impact of higher food prices is on the poverty head count of Balochistan (in which the poverty head count increases by 9.8 percentage points due to a 20% increase in food prices), followed by NWFP and Sindh. Overall, higher food prices lead to significantly higher poverty rates in all the provinces.
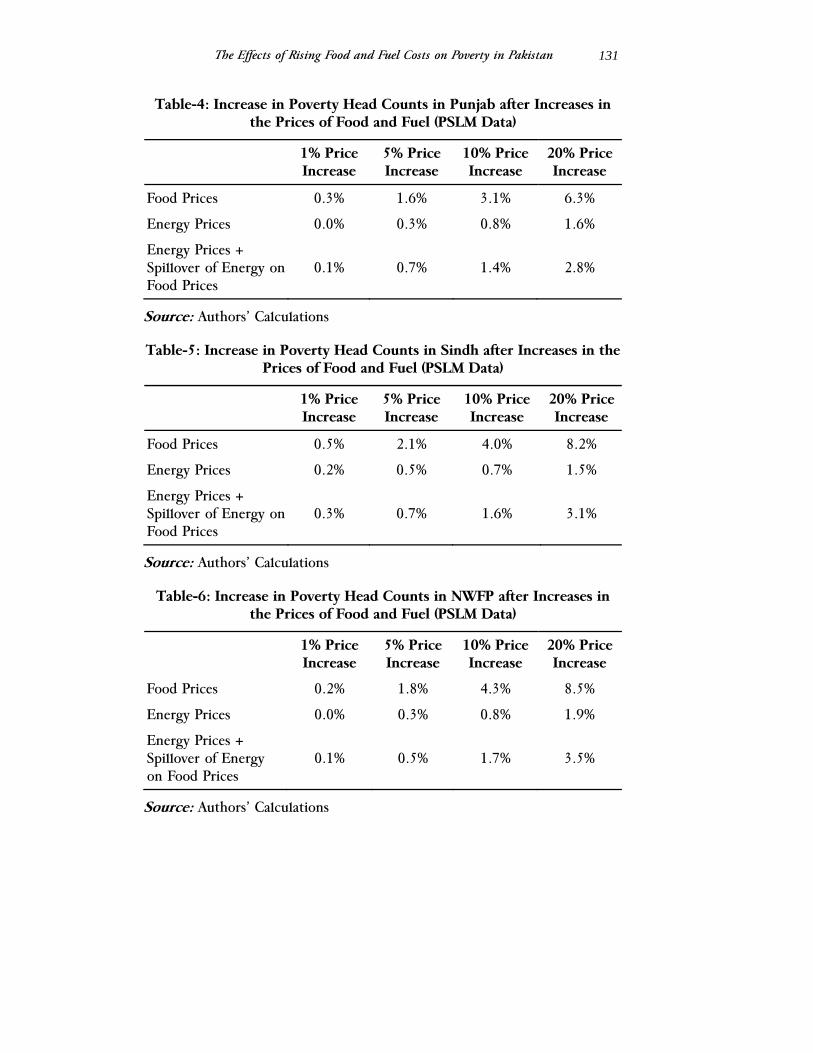
The Effects of Rising Food and Fuel Costs on Poverty in Pakistan
131
Table-4: Increase in Poverty Head Counts in Punjab after Increases in the Prices of Food and Fuel (PSLM Data)
1% Price Increase
5% Price Increase
10% Price Increase
20% Price Increase
Food Prices 0.3% 1.6% 3.1% 6.3%
Energy Prices 0.0% 0.3% 0.8% 1.6%
Energy Prices + Spillover of Energy on Food Prices
0.1% 0.7% 1.4% 2.8%
Source: Authors’ Calculations
Table-5: Increase in Poverty Head Counts in Sindh after Increases in the Prices of Food and Fuel (PSLM Data)
1% Price Increase
5% Price Increase
10% Price Increase
20% Price Increase
Food Prices 0.5% 2.1% 4.0% 8.2%
Energy Prices 0.2% 0.5% 0.7% 1.5%
Energy Prices + Spillover of Energy on Food Prices
0.3% 0.7% 1.6% 3.1%
Source: Authors’ Calculations
Table-6: Increase in Poverty Head Counts in NWFP after Increases in the Prices of Food and Fuel (PSLM Data)
1% Price Increase
5% Price Increase
10% Price Increase
20% Price Increase
Food Prices 0.2% 1.8% 4.3% 8.5%
Energy Prices 0.0% 0.3% 0.8% 1.9%
Energy Prices + Spillover of Energy on Food Prices
0.1% 0.5% 1.7% 3.5%
Source: Authors’ Calculations
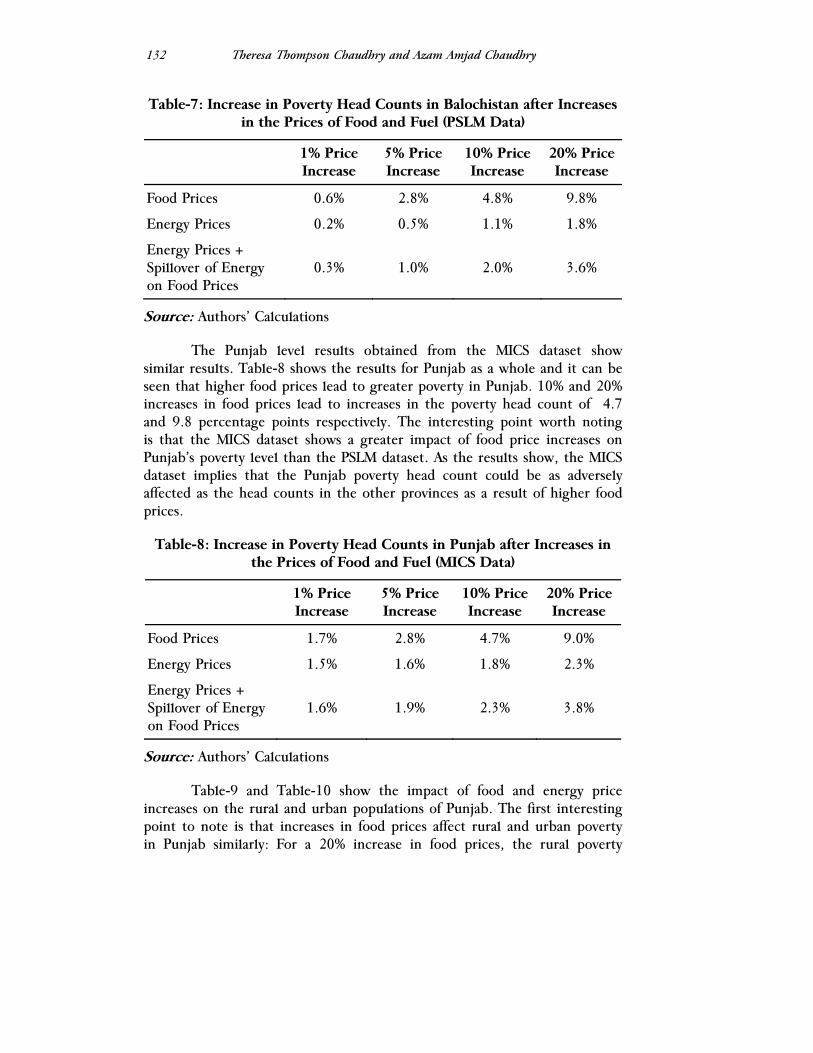
Theresa Thompson Chaudhry and Azam Amjad Chaudhry
132
Table-7: Increase in Poverty Head Counts in Balochistan after Increases in the Prices of Food and Fuel (PSLM Data)
1% Price Increase
5% Price Increase
10% Price Increase
20% Price Increase
Food Prices 0.6% 2.8% 4.8% 9.8%
Energy Prices 0.2% 0.5% 1.1% 1.8%
Energy Prices + Spillover of Energy on Food Prices
0.3% 1.0% 2.0% 3.6%
Source: Authors’ Calculations
The Punjab level results obtained from the MICS dataset show similar results. Table-8 shows the results for Punjab as a whole and it can be seen that higher food prices lead to greater poverty in Punjab. 10% and 20% increases in food prices lead to increases in the poverty head count of 4.7 and 9.8 percentage points respectively. The interesting point worth noting is that the MICS dataset shows a greater impact of food price increases on Punjab’s poverty level than the PSLM dataset. As the results show, the MICS dataset implies that the Punjab poverty head count could be as adversely affected as the head counts in the other provinces as a result of higher food prices.
Table-8: Increase in Poverty Head Counts in Punjab after Increases in the Prices of Food and Fuel (MICS Data)
1% Price Increase
5% Price Increase
10% Price Increase
20% Price Increase
Food Prices 1.7% 2.8% 4.7% 9.0%
Energy Prices 1.5% 1.6% 1.8% 2.3%
Energy Prices + Spillover of Energy on Food Prices
1.6% 1.9% 2.3% 3.8%
Source: Authors’ Calculations
Table-9 and Table-10 show the impact of food and energy price increases on the rural and urban populations of Punjab. The first interesting point to note is that increases in food prices affect rural and urban poverty in Punjab similarly: For a 20% increase in food prices, the rural poverty

The Effects of Rising Food and Fuel Costs on Poverty in Pakistan
133
head count increases by 9 percentage points, while the urban poverty head count increases by 9.3. Secondly, it is interesting to note from the MICS dataset results that the impact of energy price increases is slightly higher for the urban population in Punjab than for the rural population: A 20% increase in energy prices will lead to an increase in the urban poverty head count of 2.8 percentage points, while it will lead to an increase in the rural poverty head count by 2.3.
Table-9: Increase in Poverty Head Counts in Rural Punjab after Increases in the Prices of Food and Fuel (MICS Data)
1% Price Increase
5% Price Increase
10% Price Increase
20% Price Increase
Food Prices 1.5% 2.8% 4.8% 9.3%
Energy Prices 1.3% 1.3% 1.5% 2.0%
Energy Prices + Spillover of Energy on Food Prices
1.4% 1.7% 2.2% 3.5%
Source: Authors’ Calculations
Table-10: Increase in Poverty Head Counts in Urban Punjab after Increases in the Prices of Food and Fuel (MICS Data)
1% Price Increase
5% Price Increase
10% Price Increase
20% Price Increase
Food Prices 1.9% 2.8% 4.5% 8.4%
Energy Prices 1.9% 1.9% 2.2% 2.8%
Energy Prices + Spillover of Energy on Food Prices 1.9% 2.2% 2.5% 4.1%
Source: Authors’ Calculations
The analysis presents some important results: First, the short term direct impact on poverty levels of food price increases is substantially greater than the short term direct impact of energy price increases and energy prices plus spillovers to food prices, and this result is consistent across provinces and across rural and urban populations. The primary reason for this is the fact that food is the largest item in poor households’ budgets. Second, the short term impact of food price inflation on poverty

Theresa Thompson Chaudhry and Azam Amjad Chaudhry
134
is significantly higher for rural populations as compared to urban populations (though this result has be qualified by the fact the food price inflation will eventually impact rural incomes which in turn will reduce the impact of food price inflation on poverty). Third, the short term impact of food price inflation on poverty is significant across provinces and a 20% increase in food prices will lead to increases in the poverty head count ranging from 6% (for Punjab) to 10% (for Balochistan). Finally (and most importantly), across data sets, food price inflation can lead to significant increases in poverty. For Pakistan as a whole, a 20% increase in food prices would lead to an 8 percentage point increase in the poverty head count.
Effects of Price Changes on the Poverty Gap Ratio
Tables-11 and 12 present the results of calculating the elasticity of the poverty gap ratio with respect to price changes for the PSLM and the MICS data. Recall that the poverty gap is an indication of the depth of poverty, since it takes into account the degree to which the poor’s incomes fall below the poverty line.
The figures for the elasticity of the poverty gap with respect to food prices does not vary much across provinces (for the PSLM data) nor the rural-urban divide (for both PSLM and MICS data). According to these calculations, increasing food prices by 1% would increase the poverty gap ratio by approximately 2%. This is significantly higher than the poverty gap elasticity of 0.56 that Son and Kakwani (2006b) calculated for Brazil. There is slightly more variation in the elasticity figures with respect to energy prices. For the PSLM data, the elasticities vary from 0.33 to 0.53, the highest being for NWFP and the lowest for Sindh. The elasticity of the poverty gap with respect to energy varies for Punjab between the PSLM and MICS data sets; in this case, the elasticity is greater when calculated from the PSLM data (0.44) rather than the MICS data (0.32).
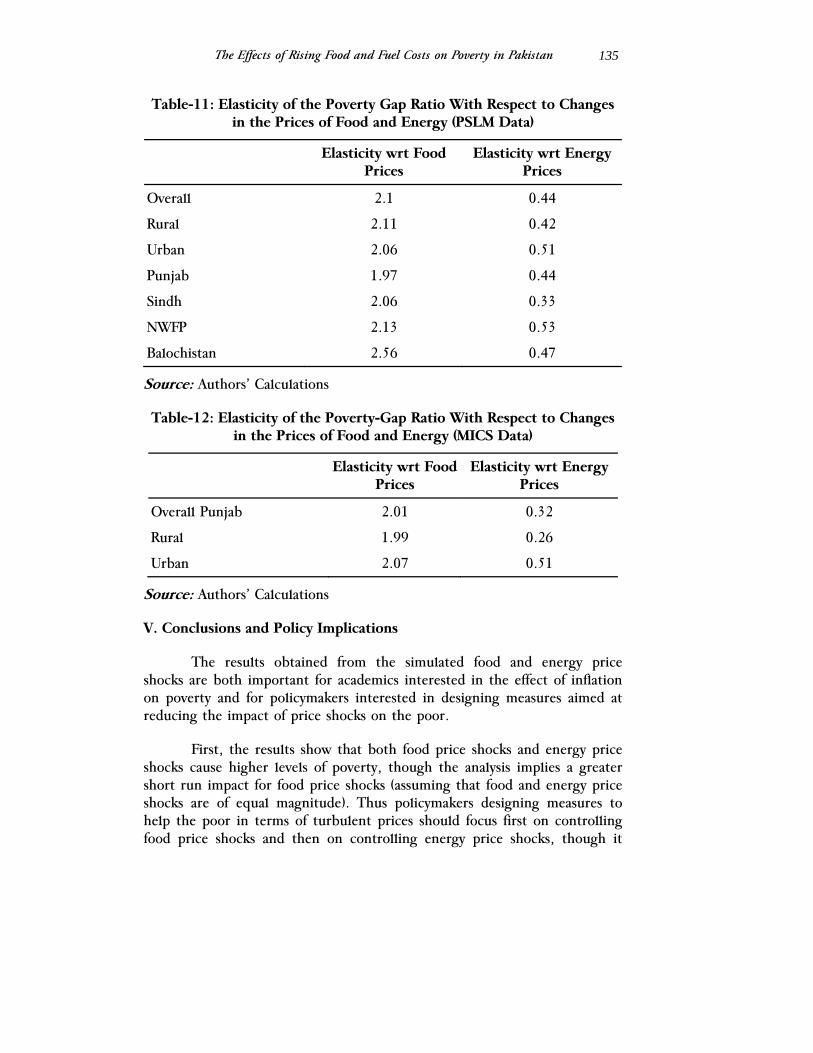
The Effects of Rising Food and Fuel Costs on Poverty in Pakistan
135
Table-11: Elasticity of the Poverty Gap Ratio With Respect to Changes in the Prices of Food and Energy (PSLM Data)
Elasticity wrt Food Prices
Elasticity wrt Energy Prices
Overall 2.1 0.44
Rural 2.11 0.42
Urban 2.06 0.51
Punjab 1.97 0.44
Sindh 2.06 0.33
NWFP 2.13 0.53
Balochistan 2.56 0.47
Source: Authors’ Calculations
Table-12: Elasticity of the Poverty-Gap Ratio With Respect to Changes in the Prices of Food and Energy (MICS Data)
Elasticity wrt Food Prices
Elasticity wrt Energy Prices
Overall Punjab 2.01 0.32
Rural 1.99 0.26
Urban 2.07 0.51
Source: Authors’ Calculations
V. Conclusions and Policy Implications
The results obtained from the simulated food and energy price shocks are both important for academics interested in the effect of inflation on poverty and for policymakers interested in designing measures aimed at reducing the impact of price shocks on the poor.
First, the results show that both food price shocks and energy price shocks cause higher levels of poverty, though the analysis implies a greater short run impact for food price shocks (assuming that food and energy price shocks are of equal magnitude). Thus policymakers designing measures to help the poor in terms of turbulent prices should focus first on controlling food price shocks and then on controlling energy price shocks, though it
Theresa Thompson Chaudhry and Azam Amjad Chaudhry
136
must be noted that large energy price shocks have a greater impact than small food price shocks.
Second, the results show that the negative impact of food price shocks falls disproportionately on the rural poor, as opposed to the urban poor. This means that policies designed at providing food security should start with the rural poor, though the urban poor is also substantially affected and should not be ignored. However, over the medium to longer-term, rural farmers will likely see welfare improvements as the selling price of their commodities rise.
Third, the negative impact of food price shocks is significant across provinces, which implies that both provincial and federal policies targeting poverty must address the issue of food security as soon as possible. As the results above show, a 20% increase in food prices could lead to a nearly 8 point higher poverty head count across provinces.
The policy level questions that arise from this discussion must focus on three major issues: First, the government must ensure household food security in the face of dramatic food price shocks through targeted safety nets. The safety nets can take the form of (a) aid and feeding programs, (b) employment programs (providing jobs and starting food for work programs), and (c) cash transfers to vulnerable groups such as the rural poor. Second, the government must ensure food security by controlling domestic food prices. The various mechanisms that have been discussed (and implemented with varying levels of success) are (a) targeted consumer subsidies/rations, (b) using buffer stocks to increase domestic food supply, and (c) reducing taxes on food items. Third, government policies must focus on the supply side in order to stimulate greater food production in the medium and long terms.
The issue facing Pakistan is not whether food and energy price shocks are going to occur, but rather the impact of the coming shocks and the actions which must be taken by the government in order to reduce the impact of these shocks on the poor. As the results in this paper show, the impact of the food and energy price shocks on the poor could be devastating and if the government fails to take immediate and targeted actions, the resulting increases in poverty could take a significant amount of time and effort to reverse.

The Effects of Rising Food and Fuel Costs on Poverty in Pakistan
137
References
Baffes, John, 2007, “Oil Spills on Other Commodities,” World Bank Policy Research Working Paper #4333, Washington DC: World Bank.
Birsel, Robert, 2008, “Export bans compounding Asia food insecurity – WFP,” Reuters, April 22, 2008.
Dessus, Sebastien, Herrera, Santiago, and Rafael de Hoyos, 2008, “The Impact of Food Inflation on Urban Poverty,” World Bank Policy Research Working Paper #4666, Washington, DC: World Bank.
Dugger, Celia, 2008, “As Prices Soar, U.S. Food Aid Buys Less,” The New York Times, September 29, 2007.
IRIN, 2008, “Pakistan: Signs of increasing desperation as food prices rise further,” April 9, 2008, http://www.irinnews.org/Report.aspx? Reported=77683.
Mitchell, Donald, 2008, “A Note on Rising Food Prices,” World Bank Policy Research Working Paper #4682, Washington, DC: World Bank.
Robinson, Simon, 2008, “Food Price Hikes Roil Pakistan,” Time Magazine, February 27, 2008.
Sachs, Jeffrey, 2007, “The Rising Cost of Nature,” Project Syndicate, www.project-syndicate.org.
Sharif, Farhan, 2008, “Pakistan Inflation Accelerates to 9.3% on Food Prices,” Bloomberg.com, November 13, 2007.
Son, Hyun, and Nanak Kakwani, 2006a, “Measuring the Impact of Prices on Inequality: With Applications to Thailand and Korea,” International Poverty Working Paper #11, UNDP, January 2006.
Son, Hyun, and Nanak Kakwani, 2006b, Measuring the Impact of Price Changes on Poverty,” International Poverty Working Paper #33, UNDP, November 2006.
Stringer, David, 2008, “World Food Program warns of ‘silent tsunami’ of hunger,” Associated Press, April 23, 2008.
Theresa Thompson Chaudhry and Azam Amjad Chaudhry
138
Walt, Vivienne, 2008, “The World’s Growing Food-Price Crisis,” Time Magazine, February 27, 2008.
World Bank, 2008, “Rising Food Prices: Policy Options and World Bank Response,” Background note for the meeting of the Development Committee.
The Lahore Journal of Economics Special Edition (September 2008): pp. 139-162
Does the Labor Market Structure Explain Differences in
Poverty in Rural Punjab?
Rashid Amjad, G. M. Arif and Usman Mustafa*
Abstract
The main focus of this study is Rural Punjab and it contributes to regional poverty research in two ways; first, using a more recent household survey data, carried out in August 2007 by the Pakistan Institute of Development Economics (PIDE), it provides fresh poverty estimates for the rural areas of the Punjab. Second, the poverty differential across the agro-climatic zones of Punjab have been explained by urbanization, overseas migration and the labor market structure operating in these zones. This study shows four major factors that explain inequalities in poverty levels. First, the rural areas of two zones, barani and rice/wheat, are well integrated with urban settings. This integration has allowed their rural populations to work in the industrial sector of Central Punjab and the services sector in North Punjab primarily Rawalpindi and Islamabad. Second, the belt from Lahore to Attock in the Punjab has benefited the most from overseas migration. The flow of remittances has helped in reducing poverty levels. Third, the cotton/wheat and low intensity zone still largely depend for employment on the agricultural sector while this dependency is very low in the barani zone, which has good opportunity to seek job opportunities for its labor force in the armed services and government departments. Finally, demographic and social factors including education are less favorable in the cotton/wheat and low intensity zones which negatively impacts on a breakthrough in poverty reduction.
JEL Classification: D33, J20, J61
Keywords: Pakistan, Poverty, Migration, Labor Market
* Rashid Amjad is the Vice Chancellor of Pakistan Institute of Development Economics (PIDE), G. M. Arif is the Dean, Faculty of Development Studies and Usman Mustafa is Chief, Training Programme and Project Evaluation Division of PIDE. Authors are thankful to Mr. Masood Ishfaq, Muhammad Kamran Khan and Ms. Amena Urooj from PIDE for their help in data analysis. Typing assistance from Mohammad Sarwar is also acknowledged.
Rashid Amjad, G. M. Arif and Usman Mustafa
140
1. Introduction
The poverty debate in Pakistan has centered on trends in the headcount ratio. However, regional poverty differences, particularly within the rural areas, have been neglected. It has been well documented in studies carried out over the past two decades, which have utilized nationally representative as well as special small surveys, that poverty in some regions, for example barani Punjab (rural), is lower than in other regions particularly the cotton growing zones of Punjab and Sindh. Consistently low-levels of poverty in barani Punjab are largely attributed to certain socio-economic characteristics of the region such as integration of its rural areas with the prosperous urban centers, relatively better human capital, access to jobs in the armed forces and government departments located in Capital city of Islamabad, and its long tradition of overseas migration. However, there is little empirical work showing these relationships.
This study contributes in the regional poverty research by two ways; first, by using a more recent household survey data, carried out in August 2007 by the Pakistan Institute of Development Economics (PIDE), it provides fresh poverty estimates for rural areas of Punjab. Second, the poverty differential across the agro-climatic zones of Punjab have been explained by urbanization, overseas migration and the labor market structure operating in these zones.
Rural Punjab is the focus of this study, and it is organized as follows. After the brief introduction, the review of literature is presented in the next section, followed by theoretical considerations in section 3. A discussion on recent poverty estimates is presented in section 4. Section 5 presents a short discussion on factors that can explain poverty differences across zones, including urbanization, overseas migration, employment structure and human capital. Concluding remarks are given in the final section.
2. Setting the Context: A Review of Literature
The earlier studies that found significant differences in poverty levels across agro-climatic zones include Malik (1992), Arif and Ahmad (2001), Malik (2005) and Irfan (2008). A common feature of these studies is that they have used the methodology of Pickney (1989) to classify rural areas into zones/regions. Pickney classified the entire country into nine agro-climatic or crop zones based on Kharif crops (cotton and rice mainly) because wheat is the predominant crop in Rabi season virtually in all areas of the country. These zones are named as rice/wheat Punjab, mixed Punjab, cotton/wheat Punjab, barani Punjab, low-intensity Punjab, cotton/wheat Sindh, rice/other

Does the Labor Market Structure Explain Differences in Poverty in Rural Punjab?
141
Sindh, NWFP except D.I. Khan, Balochistan except Nasirabad.1 The other common feature of the earlier studies is that they are based on micro (or household-level) nationally representative datasets, carried out during the last two decades by the Federal Bureau of Statistics (FBS), although Arif and Ahmed (2001) have also used a survey managed by the PIDE in 1998-99. It is worth noting that all these datasets may not be necessarily representative at the agro-climatic zone level.
The major similarity in the findings of all these studies is that the lowest levels of poverty are found for barani Punjab (Appendix Table-2), consisting of currently five northern districts of the province, Rawalpindi, Jhleum, Chakwal, Attock and Islamabad. Concerning the other zones, Malik (1992) found the highest incidence of poverty in cotton/wheat Punjab, followed by Balochistan and rice/other Sindh in 1984-85. This order, according to Malik, changed to low intensity Punjab followed by cotton/wheat Punjab and rice/other Sindh in 1987-88. Arif and Ahmed (2001) estimated that cotton/wheat Sindh and rice/wheat Punjab were the poorest regions in 1993-94 and 1998-99. For the 2001-02 period, Malik (2005) found that Sindh and Southern Punjab were the poorest regions of Pakistan. According to the recent work of Irfan (2008), based on the 2004-05 PSLM data and official poverty line, cotton/wheat zone of Punjab is still the poorest region followed by NWFP and low intensity Punjab.
A few other studies that have used different approaches for the classification of Punjab districts into regions have reached to similar results. For example, the FBS, which divided Punjab into three regions, north, central and south, substantiate these findings, and shows the highest levels of poverty in southern Punjab and lowest in northern Punjab, representing respectively the cotton/wheat and barani zones of Punjab (GoP, 2003). Results of the study carried out by Gazder, et. al. (1995) based on the two datasets also support this view.2 They desegregated rural Punjab into north and south and indicated that rural south Punjab had an extremely high incidence of poverty - significantly higher than in rural north Punjab. More recently, using the district-level representative Multiple Indicator Cluster Survey carried out in Punjab in 2003-04, Cheema (2008) has reported the results of an on-going study in Dawn (April 7, 2008) and shows that poverty is concentrated in the southern districts of Punjab. He found a low incidence of poverty in the districts of Sialkot, Jhelum, Rawalpindi, Chakwal, Gujrat, Lahore and Attock – four of which are in barani Punjab zone. The
1 Classification of districts in these zones is shown in Appendix Table-1. 2 1990/91 Household Integrated Economic Survey (HIES) and 1991 Pakistan Integrated Household Survey (PIHS). (Also cite these references)

Rashid Amjad, G. M. Arif and Usman Mustafa
142
findings of socio-economic ranking of districts are also similar to the poverty research (Jamal, et al. 2003).
3. Theoretical Considerations
Although several factors that have affected household well-being differently across the agro-climatic zones can be identified, this study adopts the analytical framework that the labor market is the main transmission process determining whether economic growth will result in the alleviation of poverty. Using the notion of employment as the nexus between growth and poverty, there are two broad categories of proximate causes of poverty: underemployment (the quantity of employment is inadequate) and low returns to labor (earnings per unit of employment is inadequate). For growth to be able to reduce poverty, the nature of the growth process must be such that the forces creating underemployment and low returns to labor are weakened (Osmani, 2004). This can happen with the expansion of an economy’s production potential and the extent to which growth in output expands the scope for improving the quantity and quality of employment – the employment potential. The greater the expansion of the employment potential, the greater will be the opportunity for reducing underemployment and raising the returns to labor (Osmani, 2004).
Economic activities, generated through rapid growth and the employment potential, can create greater opportunities for workers to increase their income; and while the overall employment intensity of growth does not matter for poverty reduction, the sectoral pattern of employment growth and productivity growth is vital (Gutierrez et al., 2007). However, extracting some benefit from these opportunities depends on the correspondence between the structure of these opportunities and the structure of capabilities possessed by the poor. The greater the degree of correspondence, the more extensively will the poor be able to integrate into the processes of economic expansion and the faster will be the rate of poverty reduction (Osmani, 2004).
The standard development discourse suggests that, with economic growth, the structure of employment changes – a shift from agriculture to industry and the services sector. Wage and salaried work becomes more dominant. These changes in the employment structure reduce poverty because wage and salaried workers are often considered less vulnerable.
The rural areas of Pakistan are not homogeneous in cropping patterns, households’ access to land, provision of health and education services, proximity to cities and the structure of employment including

Does the Labor Market Structure Explain Differences in Poverty in Rural Punjab?
143
access to overseas labor markets, particularly in the Middle East. This diversity in the rural areas shows that the structure of employment and other socio-economic channels through which economic growth trickles down to improve the living standard of the poor varies across the regions. More than half of the rural population is landless. In those rural regions, where poverty is high such as southern Punjab, employment prospects in industry and the services sector are lower than the regions that are better connected to major centers of growth (cities).
The pattern of urbanization in Punjab has generated two urban systems that have helped to connect the rural population with urban jobs. One such system is found in Lahore and its surrounding districts where industries are interlinked and the rural population of these districts has access to urban centers through good road networks. This rural-urban linkage is likely to have helped the rural population to improve their living standards through job opportunities in these centers and the sale of their agricultural products in urban markets. A second urban corridor has been developed in north Punjab by establishing the capital, Islamabad, alongside Rawalpindi, resulting in an increase in the size of the twin cities that has generated a lot of opportunities for nearby areas. They have integrated their rural population as well as populations from surrounding districts, including Jhelum, Chakwal and Attock, by providing them employment opportunities, mainly in the services sector. Moreover, a triangle of three districts, Sialkot, Gujrat and Gujranwala, where light industries are concentrated, is providing better employment opportunities to rural residents. However, it is difficult to find this type of strong linkage between the rural population and urban centers among the cotton/wheat and low intensity zones of Punjab, resulting in a concentration of workers in low-paid jobs (low returns to labor).
Moreover, migration is almost universally argued to be beneficial, allowing individuals to seek out opportunities in new places and, through remittances, to increase private investment in the places they leave (Phillipson, 2005). Pakistan has a long history of sending its workers overseas for employment particularly to the Middle East. But the participation of the poorest regions of the country in this migration has been historically low, leading to regional inequalities in remittances and their effects on poverty. In short, this study considers that the employment structure can largely explain the regional variations in rural poverty in the context of opportunities provided to them in the form of both urbanization and overseas migration.
Rashid Amjad, G. M. Arif and Usman Mustafa
144
4. Recent Evidence on Poverty in Rural Punjab
4.1. Data and Methodology
In August 2007, PIDE conducted a survey, under the Sustainable Livelihood in Barani Area Punjab (SLBAP) project, covering 647 households in ten districts of Punjab – Rawalpindi, Chakwal, Jhleum, Gujrat, Sialkot, Narowal, Khoshab, Minawali, Bhakkar and Layya. This survey is not representative for any geographical area and has not exactly used the HIES-type consumption module, which is commonly utilized in Pakistan for poverty estimation. It however contains data on major components required for poverty estimation, including food items, fuel and utilities, housing, frequent nonfood expenses (household laundry and cleaning personal care products and services) and other nonfood expenses (clothes, footwear, education, and health related expenses). The PIDE/SLBAP survey has collected information on more than 40 food and non-food items sufficient for poverty estimation.
This study has used the official poverty line after inflating it for the 2007 period. Using the PIHS 1998-99 data, the Planning Commission estimated absolute poverty line as Rs. 673.54 per month per adult equivalent. The Commission has already adjusted the poverty line for the 2000/01 and 2004/05 periods using the Consumer Price Index (CPI). In 2004/05, the official poverty line was Rs. 878.64 per month per adult equivalent. For the present study, it has been adjusted by using the CPI for the 2007 period, when the PIDE/SLBAP survey was carried out. The adjusted poverty line for 2007 is calculated as Rs. 1023 per month per adult equivalent.3
For this study, the ten districts covered in the PIDE/SLBAP survey
are divided into three zones: barani Punjab consisting of Rawalpindi, Jhelum and Chakwal districts; the rice/wheat zone including three districts, Sialkot, Narowal and Gujrat; and the low intensity zone consisting of four districts - Mianwali, Khushab, Bhakkar and Layya. This zonal classification matches largely with the agro-climatic classification of rural areas by Pinckney (1989). However, the poorest districts of cotton/wheat and low intensity zones, D. G. Khan, Rajanpur, Muzaffargarh, Rahim Yar Khan and Bahawalpur (see Appendix Table-1), have not been covered in the PIDE/SLBAP Survey. Poverty is thus likely to be underestimated for the low intensity zone.
3 While adjusting household consumption expenditure in order to get per adult equivalent expenditure, this study has used an equivalent scale that gives a weight of 0.8 to individuals younger than 15 years and 1 for all other individuals.

Does the Labor Market Structure Explain Differences in Poverty in Rural Punjab?
145
4.2. Poverty Profile, 2007
The incidence of poverty based on the 2007 PIDE/SLBAP survey is presented in Table-1. The overall incidence in ten surveyed districts is 19.2 percent in 2007; approximately one-fifth of the sampled rural population was living below the poverty line. Zone-level poverty estimates show that the incidence of poverty is lowest in barani districts (15.6%) and it is highest in the rice/wheat zone (22.6%). However, there is only a three percentage point difference between the low intensity (18.9%) and rice/wheat (22.6%) zones. As noted above, relatively low poverty in the ‘low intensity’ zone is due to the exclusion of the poorest districts e.g. Rajanpur and Muzaffargarh. Table-1 also presents information on the poverty gap and poverty severity; the overall poverty gap is 3.80 percent and severity of poverty is 1.29 percent, compared to the figures 5.64 percent and 1.77 percent respectively in rural Pakistan according to the 2004/05 PSLM survey (GoP, 2007). Low values of both poverty gap and severity of poverty indicate that most of the poor cluster around the poverty line.
Table-1: Head Count Ratios, Poverty Gap and Severity by Zones, 2007
Zones Head Count Ratio
Poverty Gap Poverty Severity
Overall 19.2 3.80 1.29
Barani Rawalpindi Zone 15.6 2.73 0.82
Rice/Wheat Zone 22.6 4.71 1.49
Low Intensity Zone 18.9 3.79 1.43
Source: PIDE/SLBAP Survey, 2007
The findings of the PIDE/SLBAP survey are not claimed to be representative or strictly comparable with other studies. However, they support the earlier work that poverty in barani Punjab remains low compared to other regions. In terms of the poverty profile, the results of the 2007 PIDE/SLBAP survey also support the earlier research. For instance, the highest incidence of poverty is found among the landless population and the poverty incidence declines with increases in landholdings and almost vanishes in large landholdings. The importance of livestock in poverty reduction is also evident from the PIDE/SLBAP survey; poverty among those who owned 5 or more animals was only 8.5 percent compared to 28 percent among those who did not own any livestock. It appears that ‘natural capital’,
Rashid Amjad, G. M. Arif and Usman Mustafa
146
represented by the ownership of land and financial capital in the form of livestock, has a very strong association with poverty.
As expected, poverty was lower in households headed by literate persons compared to households headed by non-literate persons. The educational attainment of household heads was negatively related to the incidence of poverty. Literacy of the head of household has also a significant and negative association with both chronic and transitory poverty (Arif and Bilquees, 2008); human capital thus improves the quality of labor as an asset and is the key element in contexts where access to material assets is highly constrained (CPRC, 2005).
Finally, the 2007 PIDE/SLBAP survey showed that family size was positively associated with the incidence of poverty. Large households were more likely to be poor than small households. The incidence of poverty for the largest households was more than three times the incidence for the smallest households. Larger households in terms of size are likely to have more young children and dependents. The incidence of poverty is usually higher among households with a higher dependency ratio.
5. Understanding Poverty Differences in Rural Punjab?
The real question is how to explain regional/zonal differences in rural poverty. In other words, why is poverty considerably lower in barani areas than in other regions of Punjab? This study has first examined land inequality and landlessness across the regions to understand poverty differentials. It then has explored three areas, urbanization, overseas migration and employment structure, as the factors affecting poverty differently across the regions/zones.
5.1. Land Inequality and Poverty Differences Across Regions4
The ownership of assets, particularly of land and livestock, can be a critical means of alleviating rural poverty. But the ownership of land is highly unequal in Pakistan; only less than half of all rural households 4 This study has not analyzed the role of agricultural growth in explaining the regional poverty differences since it is well-researched by Malik (2005). For example he shows from the Agriculture Census for 2000 that, as farm size increases, people tend to grow sugarcane in Muzaffargarh, and rice and sugarcane in Bahawalpur, Rahim Yar Khan and Bahawalnagar. However, in Rahim Yar Khan, the extent of crop diversification is less than that in Bahawalnagar, indicating that, in case of crop failure, households in these districts are more vulnerable. These households have neither enough resources for crop diversification nor access to opportunities for off-farm employment. However, there are few alternative opportunities for supplementing their income.
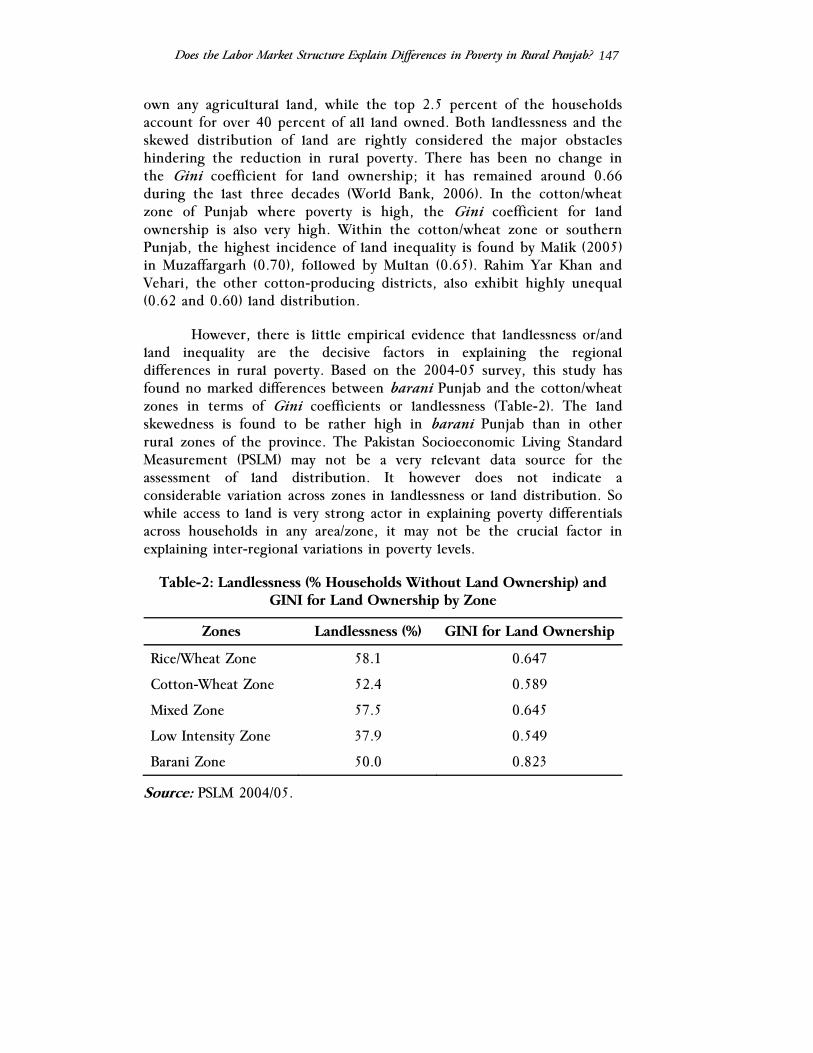
Does the Labor Market Structure Explain Differences in Poverty in Rural Punjab?
147
own any agricultural land, while the top 2.5 percent of the households account for over 40 percent of all land owned. Both landlessness and the skewed distribution of land are rightly considered the major obstacles hindering the reduction in rural poverty. There has been no change in the Gini coefficient for land ownership; it has remained around 0.66 during the last three decades (World Bank, 2006). In the cotton/wheat zone of Punjab where poverty is high, the Gini coefficient for land ownership is also very high. Within the cotton/wheat zone or southern Punjab, the highest incidence of land inequality is found by Malik (2005) in Muzaffargarh (0.70), followed by Multan (0.65). Rahim Yar Khan and Vehari, the other cotton-producing districts, also exhibit highly unequal (0.62 and 0.60) land distribution.
However, there is little empirical evidence that landlessness or/and land inequality are the decisive factors in explaining the regional differences in rural poverty. Based on the 2004-05 survey, this study has found no marked differences between barani Punjab and the cotton/wheat zones in terms of Gini coefficients or landlessness (Table-2). The land skewedness is found to be rather high in barani Punjab than in other rural zones of the province. The Pakistan Socioeconomic Living Standard Measurement (PSLM) may not be a very relevant data source for the assessment of land distribution. It however does not indicate a considerable variation across zones in landlessness or land distribution. So while access to land is very strong actor in explaining poverty differentials across households in any area/zone, it may not be the crucial factor in explaining inter-regional variations in poverty levels.
Table-2: Landlessness (% Households Without Land Ownership) and GINI for Land Ownership by Zone
Zones Landlessness (%) GINI for Land Ownership
Rice/Wheat Zone 58.1 0.647
Cotton-Wheat Zone 52.4 0.589
Mixed Zone 57.5 0.645
Low Intensity Zone 37.9 0.549
Barani Zone 50.0 0.823
Source: PSLM 2004/05.
Rashid Amjad, G. M. Arif and Usman Mustafa
148
5.2. Urbanization and Regional Poverty
One of the major arguments in the literature regarding the lower levels of poverty in rural barani Punjab zone compared to other zones is its integration with the prosperous urban centers and strong linkages to the services sector. But this has not been systematically examined. The earlier work of Arif (2003) based on stem-and-leaf display of district-wise 1998 census data for the whole country shows the great concentration of districts with less than 30 percent urban population. Districts that are less than 30 percent urban are mainly located in Southern Punjab, NWFP, Sindh and Balochistan.
Table-3 (column 3) presents data on urbanization and shows that out of 15 districts located in the cotton/wheat and low intensity zones of Punjab, 13 districts had in 1998 less than 20 percent urban population; in fact the figure is less than 15 percent in 6 districts. In remaining three zones of Punjab (barani, mixed and rice/wheat), consisting of 20 districts in total, only 4 had less than 20 percent of urban population. In barani districts, the level of urbanization is particularly high in Islamabad, Rawalpindi and Jhelum.
In the northern and Central Punjab districts, large rural centers having urban characteristics have also developed. This development has not generally taken place in the districts of Southern Punjab. For example, based on the evaluation of the 1998 population census, Arif (2003) identified that 361 rural localities inhabited by more than 5000 persons were better than many small urban centers in terms of the urban related characteristics such as water supply, literacy and non-farm employment. There is a great concentration of these urban-type rural localities in districts of Central and Northern Punjab including Faisalabad, Gujranwala, Sheikhupura, Rawalpindi and Attock. When these localities are taken into account, central Punjab and barani Punjab appear to be more urbanized (Column-4, Table-3), but with no real effect on the Southern Punjab districts.
As noted in Section-3, the pattern of urbanization in Punjab has generated two urban systems in the central and northern areas, which have helped to integrate the rural population with urban centers. It is difficult to find this same type of strong integration between the rural population and urban centers among the cotton/wheat and low intensity zones of Punjab.
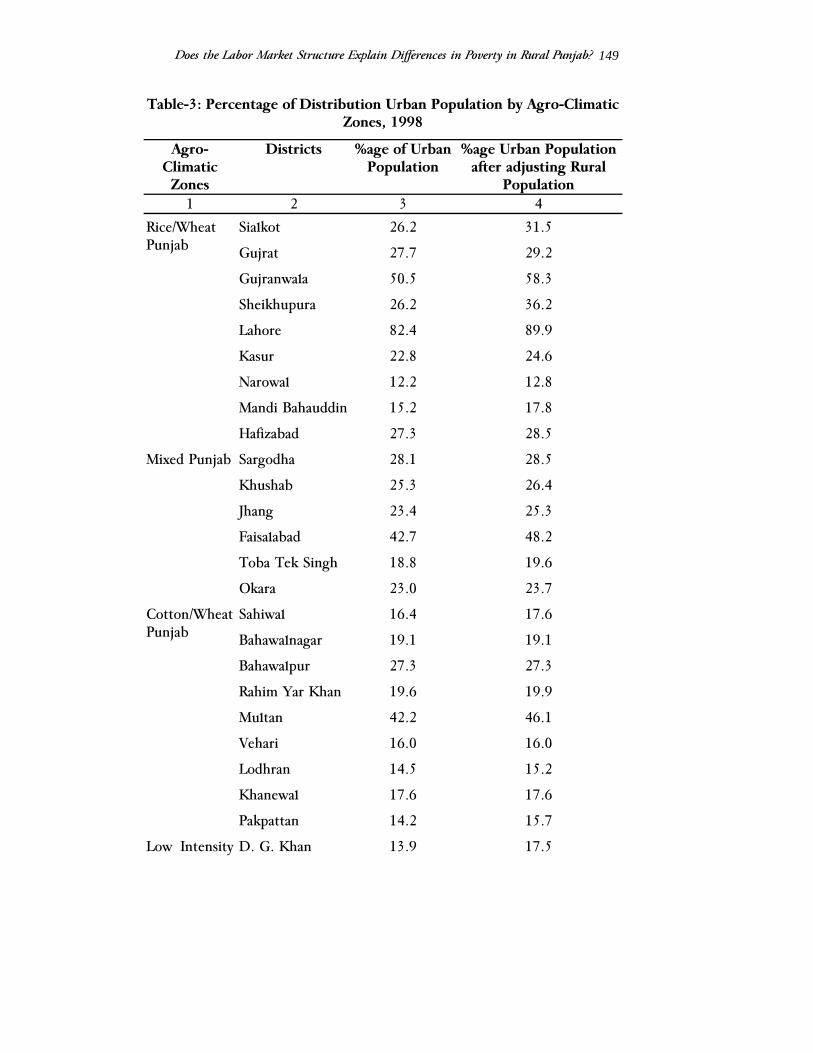
Does the Labor Market Structure Explain Differences in Poverty in Rural Punjab?
149
Table-3: Percentage of Distribution Urban Population by Agro-Climatic Zones, 1998
Agro-Climatic Zones
Districts %age of Urban Population
%age Urban Population after adjusting Rural
Population 1 2 3 4
Rice/Wheat Punjab
Sialkot 26.2 31.5
Gujrat 27.7 29.2
Gujranwala 50.5 58.3
Sheikhupura 26.2 36.2
Lahore 82.4 89.9
Kasur 22.8 24.6
Narowal 12.2 12.8
Mandi Bahauddin 15.2 17.8
Hafizabad 27.3 28.5
Mixed Punjab Sargodha 28.1 28.5
Khushab 25.3 26.4
Jhang 23.4 25.3
Faisalabad 42.7 48.2
Toba Tek Singh 18.8 19.6
Okara 23.0 23.7
Cotton/Wheat Punjab
Sahiwal 16.4 17.6
Bahawalnagar 19.1 19.1
Bahawalpur 27.3 27.3
Rahim Yar Khan 19.6 19.9
Multan 42.2 46.1
Vehari 16.0 16.0
Lodhran 14.5 15.2
Khanewal 17.6 17.6
Pakpattan 14.2 15.7
Low Intensity D. G. Khan 13.9 17.5

Rashid Amjad, G. M. Arif and Usman Mustafa
150
Punjab Rajanpur 14.5 14.5
Muzaffargarh 12.9 13.8
Leiah 12.9 12.9
Mianwali 20.8 30.3
Bhakkar 16.0 16.0
Barani Punjab Attock 21.3 26.9
Jhelum 27.7 27.7
Rawalpindi 53.2 59.9
Islamabad - 69.1
Chakwal 12.2 16.7
Note: Islamabad is included in barani Punjab for this study
Source: Pickney (1989); Arif (2003).
5.3. Overseas Migration
Approximately 4 million Pakistanis were abroad in 2004; about half of them (48%) were in the Middle East while 28 percent and 21 percent of overseas Pakistanis were in Europe and North America. Within regions, there was heavy concentration in a few countries: Saudi Arabia and United Arab Emirates in the Middle East; United Kingdom in Europe; and United States of America and Canada in North America.
According to official estimates, about 1.9 million Pakistanis were in the Middle East in 2004. Data on the annual placement of Pakistanis in the region show four important dimensions. First, during the last three decades the annual placement of Pakistanis in the Middle East fluctuated substantially, peaking first in 1977 and then in 1981. After the 1990 Gulf War, the placement reached a record level of 195,000. In 2003 and 2007, it exceeded 200,000. Second, Saudi Arabia has provided the most employment opportunities to those Pakistanis who had a chance to emigrate to the region. However, the share of Pakistanis going to the UAE has gradually increased and, more recently, the majority of workers have found employment in this country. Kuwait and other Middle Eastern countries also remain among the common destinations of workers. Third, the skill composition of Pakistani workers in the Middle East has hardly changed during the last three decades. The unskilled category remains the dominant category, followed by skilled, semi-skilled and professional workers. The

Does the Labor Market Structure Explain Differences in Poverty in Rural Punjab?
151
unskilled workers are more likely than others to be less educated and vulnerable to exploitative practices of recruitment.
The fourth feature, which is directly related to the objectives of this study, is that Middle East migration is not drawn evenly from across the country. Recent data show that sixty percent of Pakistanis in the Middle East migrated from only 20 districts, with heavy concentration in north and central Punjab, NWFP, and only Karachi in Sindh and a couple of districts in Southern Punjab. Table-4 shows that all four districts of barani Punjab zone – Rawalpindi, Attock, Chakwal and Jhelum – are among the top 20 districts, and 12 percent of all emigrants who went to the Middle East during 2001-06 period were drawn from these districts. Moreover, the majority of the more than 1000 registered overseas employment promoters are located in the Rawalpindi region. The share of six districts located in the rice/wheat and mixed Punjab zones in overseas migration was 22 percent (Table-4). While only two districts from Southern Punjab –Multan and D. G. Khan – were among the top 20 high–migration districts, no district from the low intensity zone was found. The ranking of the 20 high-migration districts for 1980-2000 periods is not different from the ranking based on the recent data (Table-4).
So what is the lesson? Almost all empirical studies carried out in developing countries including Pakistan have shown a strong linkage between low levels of poverty and overseas migration primarily through remittances. Region/zones which are relatively better in Punjab, having tapped the opportunity of emigration, have been able to attract remittances from abroad (Table-5). This has also probably encouraged the local labor force to enhance their skill levels to compete in the overseas labor market.
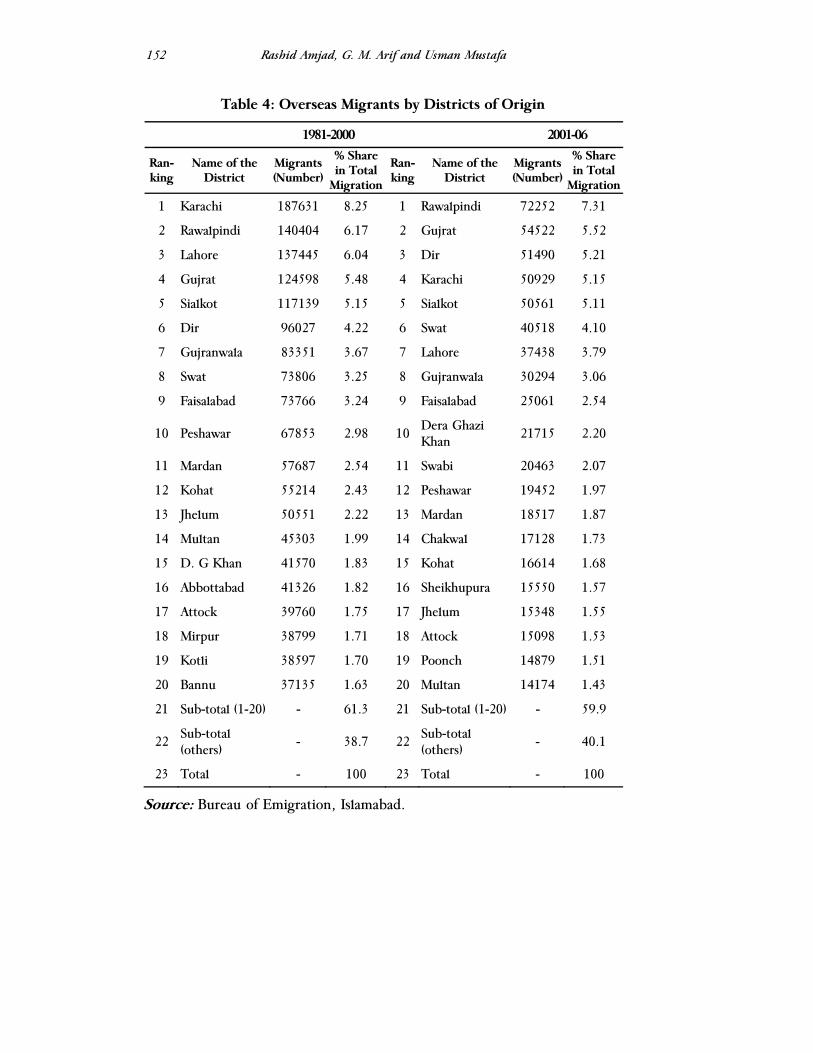
Rashid Amjad, G. M. Arif and Usman Mustafa
152
Table 4: Overseas Migrants by Districts of Origin
1981-2000 2001-06
Ran-king
Name of the District
Migrants (Number)
% Share in Total
Migration
Ran-king
Name of the District
Migrants (Number)
% Share in Total
Migration
1 Karachi 187631 8.25 1 Rawalpindi 72252 7.31
2 Rawalpindi 140404 6.17 2 Gujrat 54522 5.52
3 Lahore 137445 6.04 3 Dir 51490 5.21
4 Gujrat 124598 5.48 4 Karachi 50929 5.15
5 Sialkot 117139 5.15 5 Sialkot 50561 5.11
6 Dir 96027 4.22 6 Swat 40518 4.10
7 Gujranwala 83351 3.67 7 Lahore 37438 3.79
8 Swat 73806 3.25 8 Gujranwala 30294 3.06
9 Faisalabad 73766 3.24 9 Faisalabad 25061 2.54
10 Peshawar 67853 2.98 10 Dera Ghazi Khan 21715 2.20
11 Mardan 57687 2.54 11 Swabi 20463 2.07
12 Kohat 55214 2.43 12 Peshawar 19452 1.97
13 Jhelum 50551 2.22 13 Mardan 18517 1.87
14 Multan 45303 1.99 14 Chakwal 17128 1.73
15 D. G Khan 41570 1.83 15 Kohat 16614 1.68
16 Abbottabad 41326 1.82 16 Sheikhupura 15550 1.57
17 Attock 39760 1.75 17 Jhelum 15348 1.55
18 Mirpur 38799 1.71 18 Attock 15098 1.53
19 Kotli 38597 1.70 19 Poonch 14879 1.51
20 Bannu 37135 1.63 20 Multan 14174 1.43
21 Sub-total (1-20) - 61.3 21 Sub-total (1-20) - 59.9
22 Sub-total (others)
- 38.7 22 Sub-total (others)
- 40.1
23 Total - 100 23 Total - 100
Source: Bureau of Emigration, Islamabad.
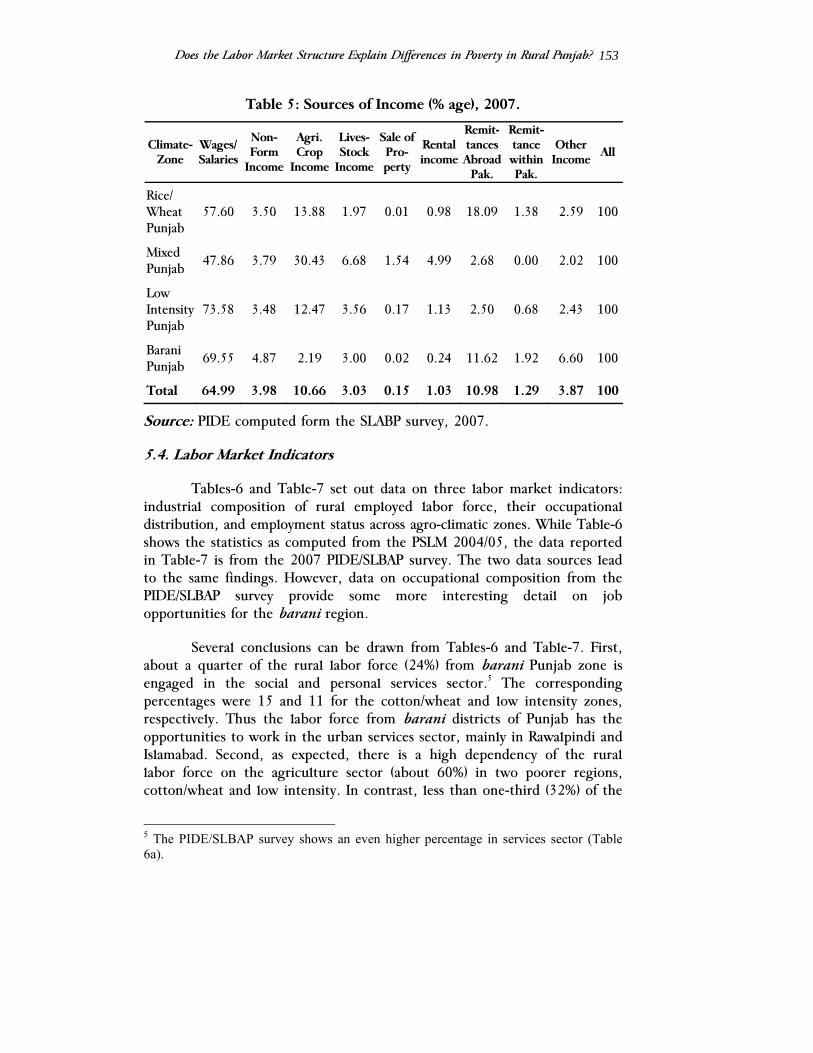
Does the Labor Market Structure Explain Differences in Poverty in Rural Punjab?
153
Table 5: Sources of Income (% age), 2007.
Climate-Zone
Wages/ Salaries
Non- Form
Income
Agri. Crop
Income
Lives- Stock
Income
Sale of Pro-perty
Rental income
Remit-tances Abroad
Pak.
Remit-tance within Pak.
Other Income All
Rice/ Wheat Punjab
57.60 3.50 13.88 1.97 0.01 0.98 18.09 1.38 2.59 100
Mixed Punjab 47.86 3.79 30.43 6.68 1.54 4.99 2.68 0.00 2.02 100
Low Intensity Punjab
73.58 3.48 12.47 3.56 0.17 1.13 2.50 0.68 2.43 100
Barani Punjab
69.55 4.87 2.19 3.00 0.02 0.24 11.62 1.92 6.60 100
Total 64.99 3.98 10.66 3.03 0.15 1.03 10.98 1.29 3.87 100
Source: PIDE computed form the SLABP survey, 2007.
5.4. Labor Market Indicators
Tables-6 and Table-7 set out data on three labor market indicators: industrial composition of rural employed labor force, their occupational distribution, and employment status across agro-climatic zones. While Table-6 shows the statistics as computed from the PSLM 2004/05, the data reported in Table-7 is from the 2007 PIDE/SLBAP survey. The two data sources lead to the same findings. However, data on occupational composition from the PIDE/SLBAP survey provide some more interesting detail on job opportunities for the barani region.
Several conclusions can be drawn from Tables-6 and Table-7. First, about a quarter of the rural labor force (24%) from barani Punjab zone is engaged in the social and personal services sector.5 The corresponding percentages were 15 and 11 for the cotton/wheat and low intensity zones, respectively. Thus the labor force from barani districts of Punjab has the opportunities to work in the urban services sector, mainly in Rawalpindi and Islamabad. Second, as expected, there is a high dependency of the rural labor force on the agriculture sector (about 60%) in two poorer regions, cotton/wheat and low intensity. In contrast, less than one-third (32%) of the
5 The PIDE/SLBAP survey shows an even higher percentage in services sector (Table 6a).
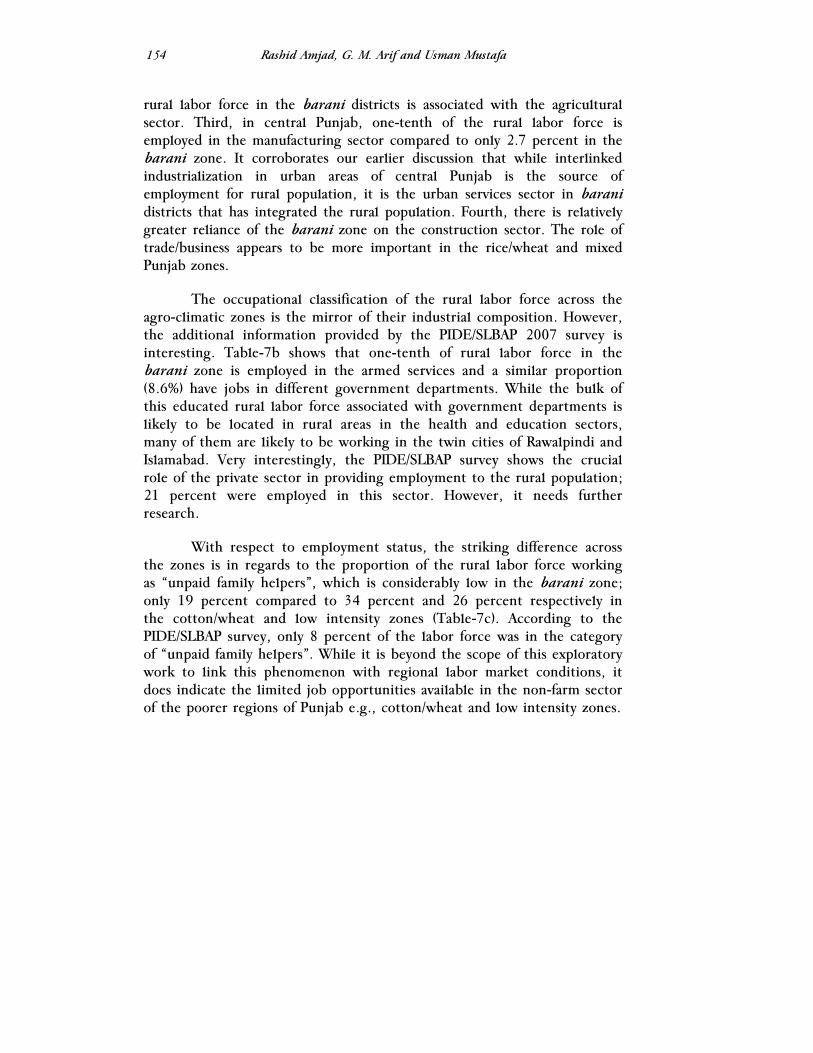
Rashid Amjad, G. M. Arif and Usman Mustafa
154
rural labor force in the barani districts is associated with the agricultural sector. Third, in central Punjab, one-tenth of the rural labor force is employed in the manufacturing sector compared to only 2.7 percent in the barani zone. It corroborates our earlier discussion that while interlinked industrialization in urban areas of central Punjab is the source of employment for rural population, it is the urban services sector in barani districts that has integrated the rural population. Fourth, there is relatively greater reliance of the barani zone on the construction sector. The role of trade/business appears to be more important in the rice/wheat and mixed Punjab zones.
The occupational classification of the rural labor force across the agro-climatic zones is the mirror of their industrial composition. However, the additional information provided by the PIDE/SLBAP 2007 survey is interesting. Table-7b shows that one-tenth of rural labor force in the barani zone is employed in the armed services and a similar proportion (8.6%) have jobs in different government departments. While the bulk of this educated rural labor force associated with government departments is likely to be located in rural areas in the health and education sectors, many of them are likely to be working in the twin cities of Rawalpindi and Islamabad. Very interestingly, the PIDE/SLBAP survey shows the crucial role of the private sector in providing employment to the rural population; 21 percent were employed in this sector. However, it needs further research.
With respect to employment status, the striking difference across the zones is in regards to the proportion of the rural labor force working as “unpaid family helpers”, which is considerably low in the barani zone; only 19 percent compared to 34 percent and 26 percent respectively in the cotton/wheat and low intensity zones (Table-7c). According to the PIDE/SLBAP survey, only 8 percent of the labor force was in the category of “unpaid family helpers”. While it is beyond the scope of this exploratory work to link this phenomenon with regional labor market conditions, it does indicate the limited job opportunities available in the non-farm sector of the poorer regions of Punjab e.g., cotton/wheat and low intensity zones.
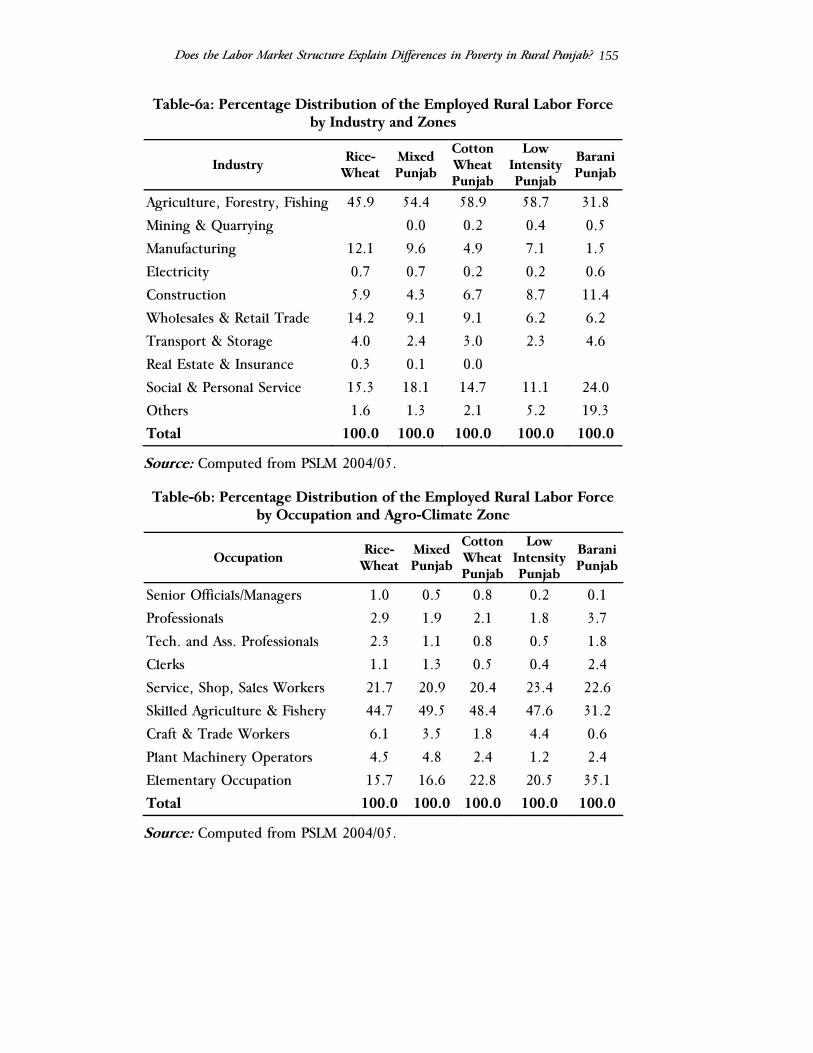
Does the Labor Market Structure Explain Differences in Poverty in Rural Punjab?
155
Table-6a: Percentage Distribution of the Employed Rural Labor Force by Industry and Zones
Industry Rice-
Wheat Mixed Punjab
Cotton Wheat Punjab
Low Intensity Punjab
Barani Punjab
Agriculture, Forestry, Fishing 45.9 54.4 58.9 58.7 31.8
Mining & Quarrying 0.0 0.2 0.4 0.5
Manufacturing 12.1 9.6 4.9 7.1 1.5
Electricity 0.7 0.7 0.2 0.2 0.6
Construction 5.9 4.3 6.7 8.7 11.4
Wholesales & Retail Trade 14.2 9.1 9.1 6.2 6.2
Transport & Storage 4.0 2.4 3.0 2.3 4.6
Real Estate & Insurance 0.3 0.1 0.0
Social & Personal Service 15.3 18.1 14.7 11.1 24.0
Others 1.6 1.3 2.1 5.2 19.3
Total 100.0 100.0 100.0 100.0 100.0
Source: Computed from PSLM 2004/05.
Table-6b: Percentage Distribution of the Employed Rural Labor Force by Occupation and Agro-Climate Zone
Occupation Rice-
WheatMixed Punjab
Cotton Wheat Punjab
Low Intensity Punjab
Barani Punjab
Senior Officials/Managers 1.0 0.5 0.8 0.2 0.1
Professionals 2.9 1.9 2.1 1.8 3.7
Tech. and Ass. Professionals 2.3 1.1 0.8 0.5 1.8
Clerks 1.1 1.3 0.5 0.4 2.4
Service, Shop, Sales Workers 21.7 20.9 20.4 23.4 22.6
Skilled Agriculture & Fishery 44.7 49.5 48.4 47.6 31.2
Craft & Trade Workers 6.1 3.5 1.8 4.4 0.6
Plant Machinery Operators 4.5 4.8 2.4 1.2 2.4
Elementary Occupation 15.7 16.6 22.8 20.5 35.1
Total 100.0 100.0 100.0 100.0 100.0
Source: Computed from PSLM 2004/05.

Rashid Amjad, G. M. Arif and Usman Mustafa
156
Table-6c: Percentage Distribution of the Employed Rural Labor Force by Employment Status and Zones
Employment Status
Rice-Wheat
Mixed Punjab
Cotton Wheat Punjab
Low Intensity Punjab
Barani Punjab
Employees 29.8 30.4 38.9 29.0 45.1
Self Employed 45.4 38.4 36.2 37.4 35.3
Employers 0.3 0.1 0.1 0.1 0.7
Unpaid Family Helpers
24.5 31.2 24.9 33.6 18.9
Total 100.0 100.0 100.0 100.0 100.0
Source: Computed from PSLM 2004/05.
Table-7a: Percentage Distribution of the Employed Rural Labor Force by Industry and Zones
Industry Barani Mixed Punjab
Low Intensity
Total
Agriculture, Forestry & Fishing 13.9 25.1 28.5 23.9
Mining & Quarrying 1.5 .6 .3 .7
Manufacturing 22.1 25.3 14.5 19.7
Construction 4.7 4.4 5.9 5.1
Whole Sale/Retail Trade 4.2 4.1 2.5 3.4
Transport & Storage 4.7 3.5 2.5 3.3
Social & Personal Services 39.0 28.0 39.4 35.7
Not Defined/Other 9.9 9.1 6.5 8.2
Total 100 100 100 100
Source: PIDE computed from the SLBAP Survey, 2007.
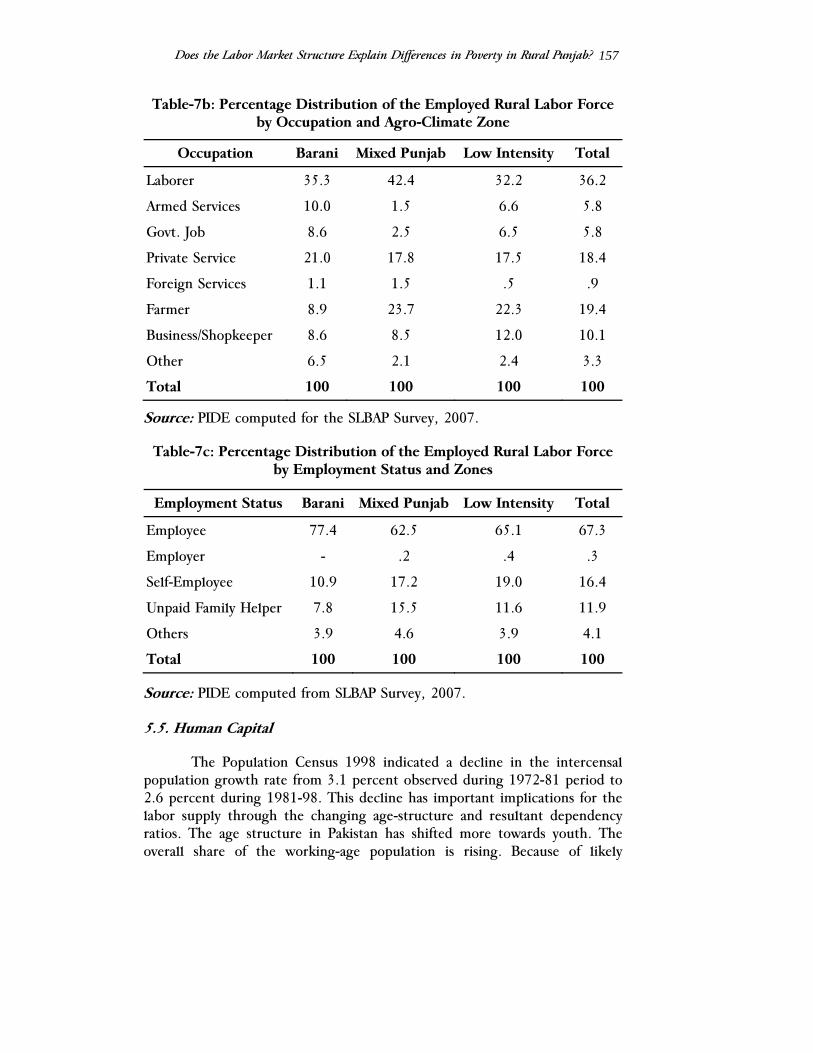
Does the Labor Market Structure Explain Differences in Poverty in Rural Punjab?
157
Table-7b: Percentage Distribution of the Employed Rural Labor Force by Occupation and Agro-Climate Zone
Occupation Barani Mixed Punjab Low Intensity Total
Laborer 35.3 42.4 32.2 36.2
Armed Services 10.0 1.5 6.6 5.8
Govt. Job 8.6 2.5 6.5 5.8
Private Service 21.0 17.8 17.5 18.4
Foreign Services 1.1 1.5 .5 .9
Farmer 8.9 23.7 22.3 19.4
Business/Shopkeeper 8.6 8.5 12.0 10.1
Other 6.5 2.1 2.4 3.3
Total 100 100 100 100
Source: PIDE computed for the SLBAP Survey, 2007.
Table-7c: Percentage Distribution of the Employed Rural Labor Force by Employment Status and Zones
Employment Status Barani Mixed Punjab Low Intensity Total
Employee 77.4 62.5 65.1 67.3
Employer - .2 .4 .3
Self-Employee 10.9 17.2 19.0 16.4
Unpaid Family Helper 7.8 15.5 11.6 11.9
Others 3.9 4.6 3.9 4.1
Total 100 100 100 100
Source: PIDE computed from SLBAP Survey, 2007.
5.5. Human Capital
The Population Census 1998 indicated a decline in the intercensal population growth rate from 3.1 percent observed during 1972-81 period to 2.6 percent during 1981-98. This decline has important implications for the labor supply through the changing age-structure and resultant dependency ratios. The age structure in Pakistan has shifted more towards youth. The overall share of the working-age population is rising. Because of likely
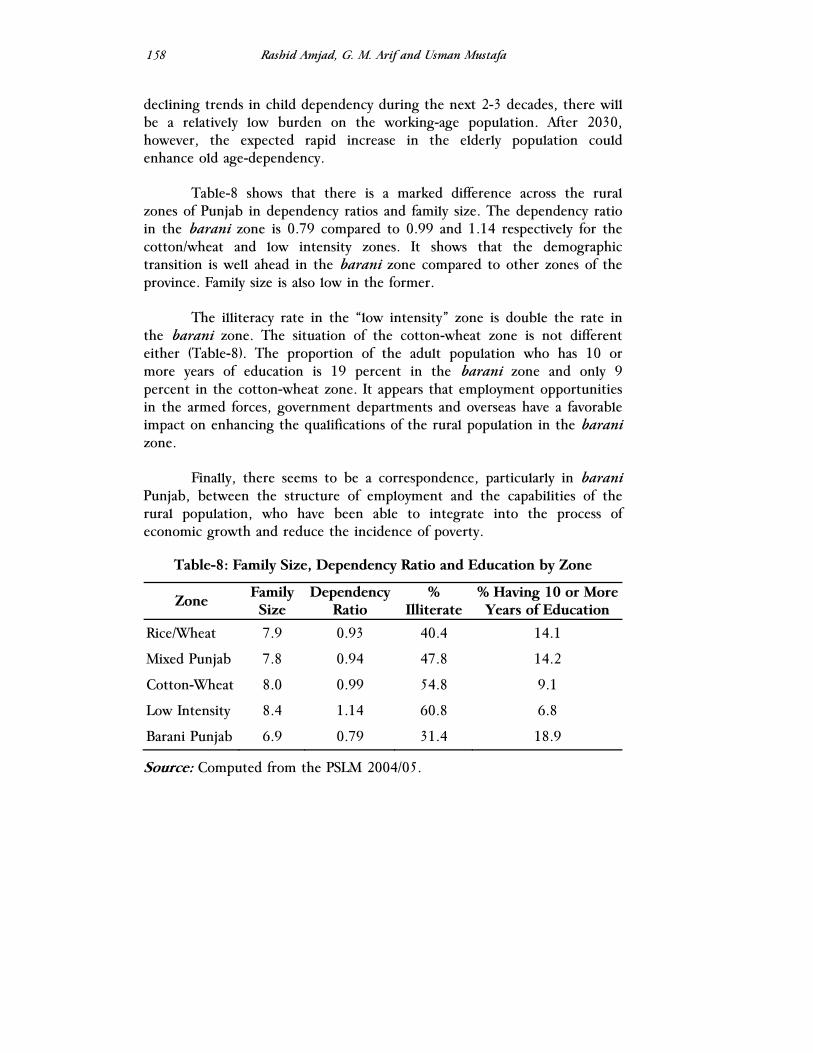
Rashid Amjad, G. M. Arif and Usman Mustafa
158
declining trends in child dependency during the next 2-3 decades, there will be a relatively low burden on the working-age population. After 2030, however, the expected rapid increase in the elderly population could enhance old age-dependency.
Table-8 shows that there is a marked difference across the rural zones of Punjab in dependency ratios and family size. The dependency ratio in the barani zone is 0.79 compared to 0.99 and 1.14 respectively for the cotton/wheat and low intensity zones. It shows that the demographic transition is well ahead in the barani zone compared to other zones of the province. Family size is also low in the former.
The illiteracy rate in the “low intensity” zone is double the rate in the barani zone. The situation of the cotton-wheat zone is not different either (Table-8). The proportion of the adult population who has 10 or more years of education is 19 percent in the barani zone and only 9 percent in the cotton-wheat zone. It appears that employment opportunities in the armed forces, government departments and overseas have a favorable impact on enhancing the qualifications of the rural population in the barani zone.
Finally, there seems to be a correspondence, particularly in barani Punjab, between the structure of employment and the capabilities of the rural population, who have been able to integrate into the process of economic growth and reduce the incidence of poverty.
Table-8: Family Size, Dependency Ratio and Education by Zone
Zone Family Size
Dependency Ratio
% Illiterate
% Having 10 or More Years of Education
Rice/Wheat 7.9 0.93 40.4 14.1
Mixed Punjab 7.8 0.94 47.8 14.2
Cotton-Wheat 8.0 0.99 54.8 9.1
Low Intensity 8.4 1.14 60.8 6.8
Barani Punjab 6.9 0.79 31.4 18.9
Source: Computed from the PSLM 2004/05.
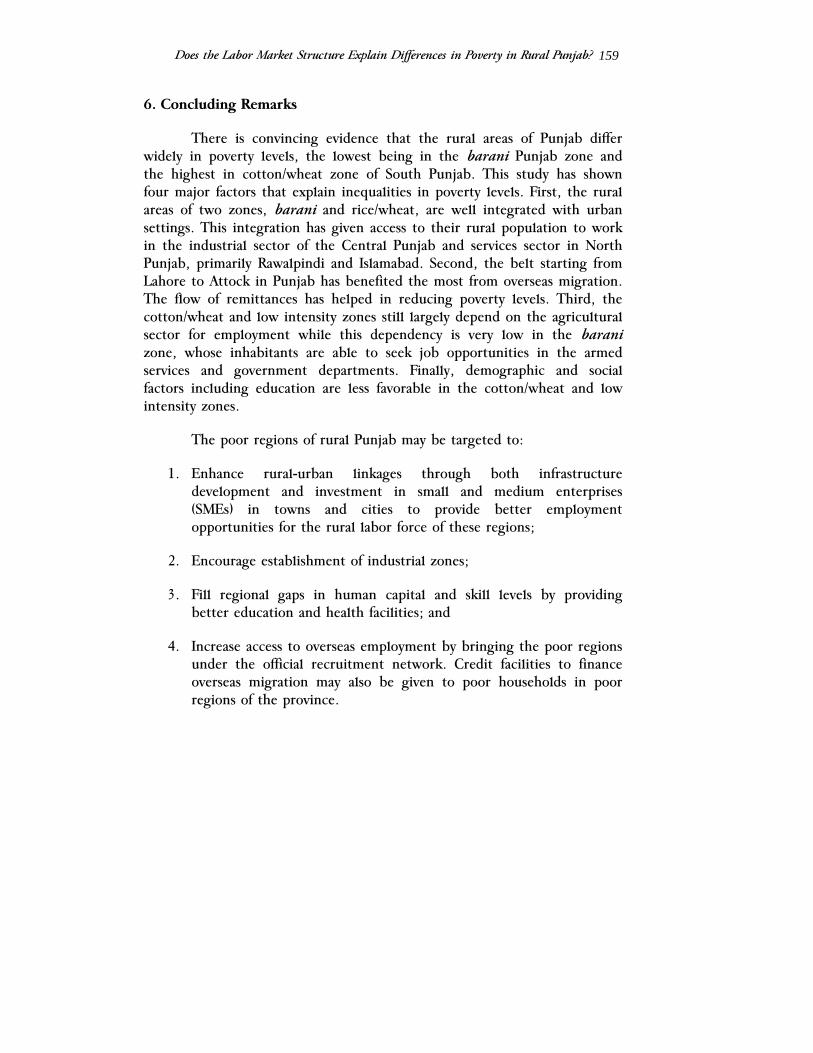
Does the Labor Market Structure Explain Differences in Poverty in Rural Punjab?
159
6. Concluding Remarks
There is convincing evidence that the rural areas of Punjab differ widely in poverty levels, the lowest being in the barani Punjab zone and the highest in cotton/wheat zone of South Punjab. This study has shown four major factors that explain inequalities in poverty levels. First, the rural areas of two zones, barani and rice/wheat, are well integrated with urban settings. This integration has given access to their rural population to work in the industrial sector of the Central Punjab and services sector in North Punjab, primarily Rawalpindi and Islamabad. Second, the belt starting from Lahore to Attock in Punjab has benefited the most from overseas migration. The flow of remittances has helped in reducing poverty levels. Third, the cotton/wheat and low intensity zones still largely depend on the agricultural sector for employment while this dependency is very low in the barani zone, whose inhabitants are able to seek job opportunities in the armed services and government departments. Finally, demographic and social factors including education are less favorable in the cotton/wheat and low intensity zones.
The poor regions of rural Punjab may be targeted to:
1. Enhance rural-urban linkages through both infrastructure development and investment in small and medium enterprises (SMEs) in towns and cities to provide better employment opportunities for the rural labor force of these regions;
2. Encourage establishment of industrial zones;
3. Fill regional gaps in human capital and skill levels by providing better education and health facilities; and
4. Increase access to overseas employment by bringing the poor regions under the official recruitment network. Credit facilities to finance overseas migration may also be given to poor households in poor regions of the province.

Rashid Amjad, G. M. Arif and Usman Mustafa
160
References
Arif, G. M., 2003, “Urbanization in Pakistan: Trends, Growth and Evaluation of the 1998 Census” in A. R. Kemal, Muhammad Irfan, Naushin Mahmood, (Eds.), Population of Pakistan: An Analysis of 1998 Population and Housing Census, Pakistan Institute of Development Economics, Islamabad.
Arif, G. M., 2006, “Poverty Targeting in Pakistan: The Case of Zakat and the Lady Health Worker Program,” in Poverty Strategies in Asia: A Growth Plus Approach. Edited by John Weiss and Haider A. Khan, Edward Elgar Cheltenham, UK.
Arif, G. M., and Munir Ahmad, 2001, “Poverty Across the Agro-Ecological Zones in Rural Pakistan”. Paper presented at the National Workshop on Pro-Poor Intervention Strategies in Irrigated Agriculture in Asia: Pakistan, International Water Management Institute, Lahore, 12 March.
Arif, G.M. and Bilquees, 2008, “Chronic and Transitory Poverty in Pakistan: Evidence from Longitudinal Household Survey”. Submitted for publication in the Pakistan Development Review.
Cheema, Ali, 2008, “Stress on Poverty Reduction” The Daily Dawn, April 7, 2008.
CPRC., 2005, The Chronic Poverty Report 2004-05. Chronic Poverty Research Centre, University of Manchester, UK.
Government of Pakistan, 2003, National Accounts of Pakistan 2001-02. Islamabad, FBS/Statistics Division.
Government of Pakistan, 2007, Ensuring a Demographic Dividend – Unleashing Human Potential in a Globalized World. Ministry of Finance, Government of Pakistan, Islamabad.
Gutierrez Catalina, 2007, Does Employment Generation Really Matter for Poverty Reduction? World Bank, Washington DC.
Irfan, Mohammad, 2008, “Poverty and Natural Resources Management in Pakistan”. Paper presented in the 23rd Annual General Meeting and Conference, Pakistan Institute of Development Economics, Islamabad, March 12-14, 2008.
Does the Labor Market Structure Explain Differences in Poverty in Rural Punjab?
161
Jamal, Haroon, A. J. Khan, I. A. Toor, and N. Anwar, 2003, “Mapping the Spatial Deprivation of Pakistan”. Pakistan Development Review 42 (2): 91–112.
Malik, Sohail J., 2005, “Agricultural Growth and Rural Poverty: A Review of the Evidence,” Working Paper No.2, Pakistan Resident Mission Working Paper Series, Asian Development Bank, Islamabad.
Malik, Sohail J., 1992, “Rural Poverty in Pakistan: Some Recent Evidence”. Pakistan Development Review 31(4).
Osmani S. R., 2004, “The Employment Nexus between Growth and Poverty: An Asian Perspective”. University of Ulster, U.K.
Phillipson Rachel, 2005, “Understanding Labour Markets and Poverty Reduction: How May Regional and Spatial Perspectives Help?” A Report for the Urban Rural Change Team Department for International Development.
Pickney, Thomas C., 1989, “The Demand for Public Storage of Wheat in Pakistan”. Research Report 77. IFPRI, Washington, DC.
World Bank, 2006, Development and the Next Generation, WDR 2007. The World Bank, Washington, DC.
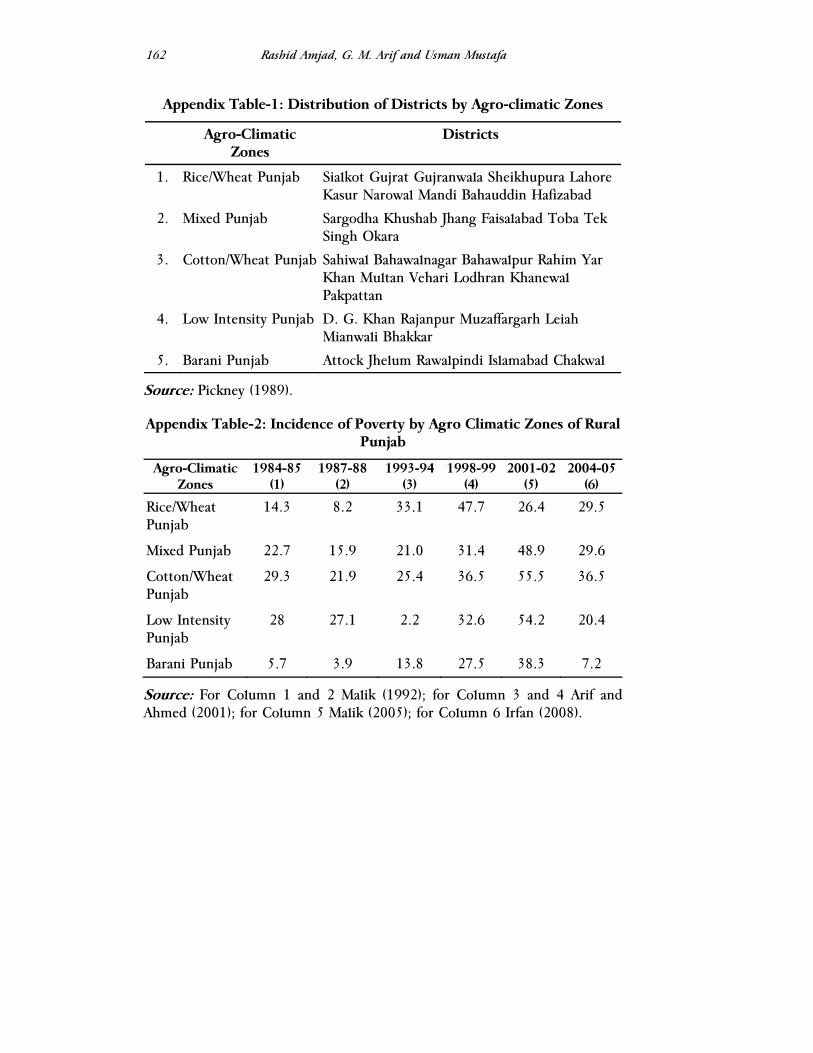
Rashid Amjad, G. M. Arif and Usman Mustafa
162
Appendix Table-1: Distribution of Districts by Agro-climatic Zones
Agro-Climatic Zones
Districts
1. Rice/Wheat Punjab Sialkot Gujrat Gujranwala Sheikhupura Lahore Kasur Narowal Mandi Bahauddin Hafizabad
2. Mixed Punjab Sargodha Khushab Jhang Faisalabad Toba Tek Singh Okara
3. Cotton/Wheat Punjab Sahiwal Bahawalnagar Bahawalpur Rahim Yar Khan Multan Vehari Lodhran Khanewal Pakpattan
4. Low Intensity Punjab D. G. Khan Rajanpur Muzaffargarh Leiah Mianwali Bhakkar
5. Barani Punjab Attock Jhelum Rawalpindi Islamabad Chakwal
Source: Pickney (1989).
Appendix Table-2: Incidence of Poverty by Agro Climatic Zones of Rural Punjab
Agro-Climatic Zones
1984-85 (1)
1987-88 (2)
1993-94 (3)
1998-99 (4)
2001-02 (5)
2004-05 (6)
Rice/Wheat Punjab
14.3 8.2 33.1 47.7 26.4 29.5
Mixed Punjab 22.7 15.9 21.0 31.4 48.9 29.6
Cotton/Wheat Punjab
29.3 21.9 25.4 36.5 55.5 36.5
Low Intensity Punjab
28 27.1 2.2 32.6 54.2 20.4
Barani Punjab 5.7 3.9 13.8 27.5 38.3 7.2
Source: For Column 1 and 2 Malik (1992); for Column 3 and 4 Arif and Ahmed (2001); for Column 5 Malik (2005); for Column 6 Irfan (2008).

The Lahore Journal of Economics Special Edition (September 2008): pp. 163-188
The Geography of Poverty: Evidence from the Punjab
Ali Cheema*, Lyyla Khalid** and Manasa Patnam***
Abstract
The article is the first comprehensive attempt at estimating the variation in the incidence, intensity and severity of poverty in the Punjab at the level of sub-provincial regions and districts. This estimation has been made possible because of the availability of the Multiple Indicators Cluster Survey (2003-04), which has a sample that is representative at the district-level. Estimates suggest the existence of a high poverty enclave in the south and the west regions of the Punjab. The incidence and severity of poverty in a majority of districts in this enclave, with a few exceptions, is extremely high with one out of every two households being poor on average. The high levels of poverty in this enclave contrast with the relatively low poverty in the more urbanized north, where households are well integrated into the national and international labor market. The paper also argues that there is tremendous variation in the poverty experience of the districts in the centre. Poverty incidence in the more urbanized and industrialized northern districts of the centre contrasts sharply with the experience of Kasur, Okara and Pakpattan, where the incidence and severity of poverty is extremely high. Finally, we find that in nine districts rural households do much worse in terms of poverty incidence than their urban counterparts. The gap between urban and rural poverty incidence and severity is highest within the district of Lahore suggesting that urbanization co-exists with a large poor population that inhabits the peri-urban areas of the district. An important aim of development policy and poverty targeting is to bridge these multi-faceted divides in the geography of poverty.
JEL Classification: D33, I32
Keywords: Poverty, Pakistan
* Acting Head of Economics, Lahore University of Management Sciences (LUMS). ** , *** Teaching Fellows, Economics Department, Lahore University of Management Sciences (LUMS).
Ali Cheema, Lyyla Khalid and Manasa Patnam
164
Introduction
During the last few years there has been a lot of interest in the analysis and estimation of poverty in Pakistan (FBS 2001, World Bank 2002 and 2005, Anwar and Qureshi 2002, Cheema 2005, Anwar et. al. 2005, Jamal 2002 and 2007). However, the literature has largely confined itself to estimating changes in the mean incidence and severity of poverty at the national and provincial levels during the last decade. Far less attention has been paid to the spatial pattern of poverty or the “geography of poverty”. The emphasis on spatial poverty, to the extent that it is emphasized, confines itself to estimating the differences in poverty between the provinces and between rural and urban areas. The literature remains largely silent about the spatial pattern of poverty at the sub-provincial and the district levels. Gazdar (1999) and Malik (2005) are two notable exceptions in that they report poverty incidence estimates at the level of sub-provincial regions.
Estimating and analyzing the spatial pattern of poverty at the sub-provincial level is important for number of reasons. The Constitutional assignment of expenditure functions assigns essential social sector, physical infrastructure and other important poverty reduction expenditures to the provinces. At the most basic level, the design of poverty reduction programs at the provincial level will require the creation of map that shows the distribution in the incidence and severity of poverty at the district and the regional levels. Without this map, targeting poverty will be extremely difficult. Furthermore, as result of the Provincial Local Government Ordinances (2001), critical poverty reduction expenditures related to primary and secondary education and basic health care have been devolved to district governments. The major share of finances used to meet these district expenditures comes from the province and are allocated to the district governments on the basis of the Provincial Finance Commission (PFC) award. These awards determine both the distribution of the proceeds of the Provincial Consolidated Fund between the Provincial Government and the local governments, as well as the formula for the distribution of the Provincial Allocable Amount between the districts. The PFCs will only be able to give weight to poverty-reduction in their formula to the extent that poverty estimates are available at the district level.
Estimating the variation in the geography of poverty at the sub-provincial level is also important because there is a large body of literature that suggests that sub-provincial regions differ in their resource base; the history and pattern of migration; historical and current occupation patterns; availability of infrastructure; land ownership patterns; availability of human
The Geography of Poverty: Evidence from the Punjab
165
capital assets; the operation of markets; the degree of urbanization; and in the structure of electoral politics (Alavi 1976, Darling 1947, Malik 2005, Wilder 1999, Jamal 2003 and Gazdar 1999). It is, therefore, instructive to estimate whether differences in the incidence and severity of poverty exist across different sub-provincial regions and districts that reflect different socio-economic structures.
The lack of emphasis, in the literature, on the spatial pattern of poverty at the sub-provincial level has been due to the lack of availability of data-sets that are representative at the district-level and below. The present article analyzes the spatial pattern of poverty in the Punjab province by estimating poverty incidence and severity measures at the level of the districts and the sub-provincial regions. It is able to do this because of the availability of the Government of Punjab’s Multiple Indicators Cluster Survey (2003-04)1
that has a sample representative at the district-level. This is the
first comprehensive estimation of the spatial variation in poverty measures at the district-level using a data-set that is representative at this level. Section 2 provides a classification of sub-provincial regions that is used to report the differences in the incidence and severity of poverty. Sector 3 describes the methodology used to measure poverty and development deficits at the level of the regions and the districts. Section 4 presents the evidence regarding the differences in the incidence and severity of poverty and development deficits across different regions and districts of the Punjab. Section 5 concludes and highlights areas of future research.
2. Defining the Regions
In order to make the analysis tractable we report our estimates at the level of the district and sub-provincial regions. We adopt the classification of regions suggested by Wilder (1999). He divides Punjab into northern, central, southern and western regions (Figure-1) based on: ”geographical boundaries, official district and (old) division borders, regional economic differences, variations in irrigation, agriculture, and cropping patterns, differences in farm-size and land tenure patterns, and distinct historical, cultural, and linguistic influences in each region” (pg. 34).
We prefer Wilder’s (1999) classification over Gazdar (1999) and Malik’s (1991 and 2005) because it is more nuanced and comprehensive and takes into account a wider range of factors in classifying different regions. Malik’s (2005) classification restricts itself to agronomic zones; however,
1 We are grateful to the Punjab Planning and Development Board for making the data-set available to us.
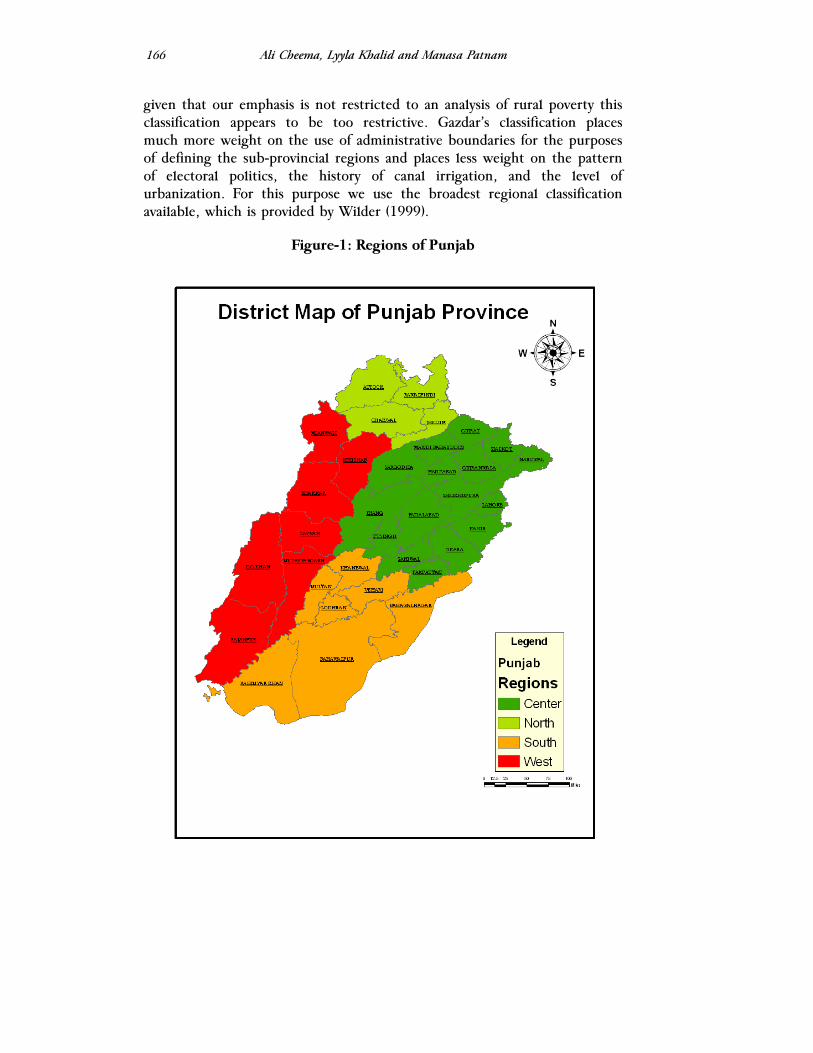
Ali Cheema, Lyyla Khalid and Manasa Patnam
166
given that our emphasis is not restricted to an analysis of rural poverty this classification appears to be too restrictive. Gazdar’s classification places much more weight on the use of administrative boundaries for the purposes of defining the sub-provincial regions and places less weight on the pattern of electoral politics, the history of canal irrigation, and the level of urbanization. For this purpose we use the broadest regional classification available, which is provided by Wilder (1999).
Figure-1: Regions of Punjab
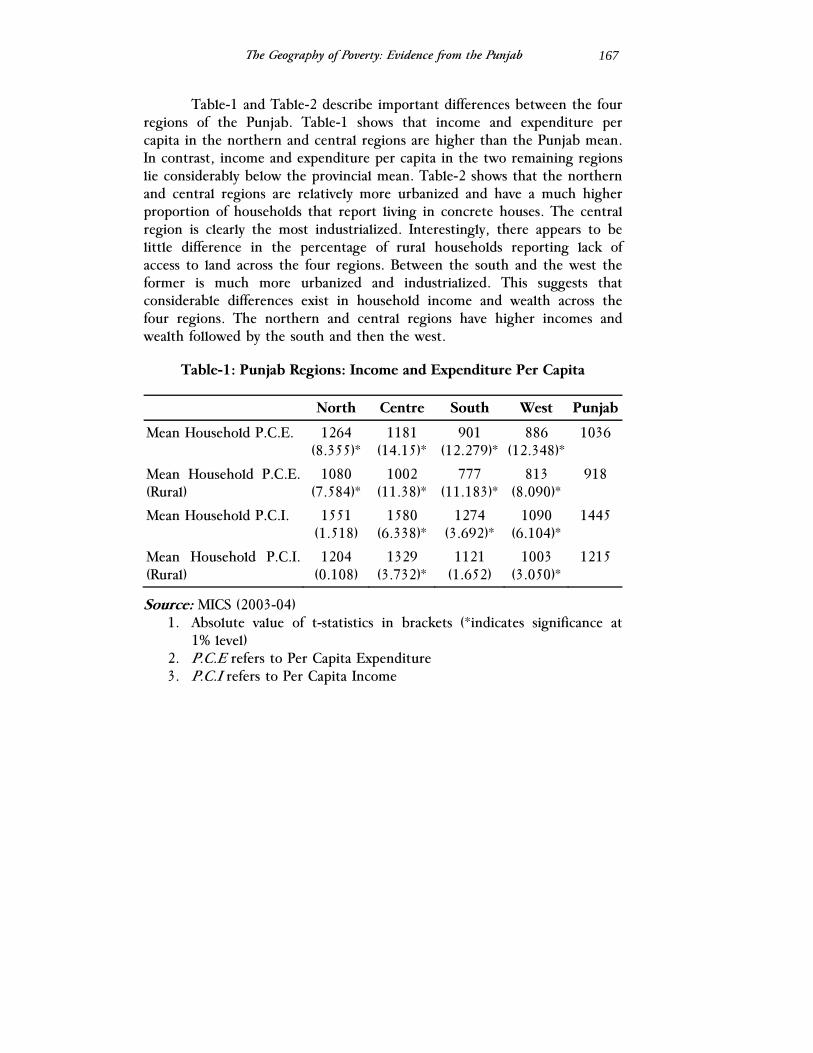
The Geography of Poverty: Evidence from the Punjab
167
Table-1 and Table-2 describe important differences between the four regions of the Punjab. Table-1 shows that income and expenditure per capita in the northern and central regions are higher than the Punjab mean. In contrast, income and expenditure per capita in the two remaining regions lie considerably below the provincial mean. Table-2 shows that the northern and central regions are relatively more urbanized and have a much higher proportion of households that report living in concrete houses. The central region is clearly the most industrialized. Interestingly, there appears to be little difference in the percentage of rural households reporting lack of access to land across the four regions. Between the south and the west the former is much more urbanized and industrialized. This suggests that considerable differences exist in household income and wealth across the four regions. The northern and central regions have higher incomes and wealth followed by the south and then the west.
Table-1: Punjab Regions: Income and Expenditure Per Capita
North Centre South West Punjab
Mean Household P.C.E. 1264 (8.355)*
1181 (14.15)*
901 (12.279)*
886 (12.348)*
1036
Mean Household P.C.E. (Rural)
1080 (7.584)*
1002 (11.38)*
777 (11.183)*
813 (8.090)*
918
Mean Household P.C.I. 1551 (1.518)
1580 (6.338)*
1274 (3.692)*
1090 (6.104)*
1445
Mean Household P.C.I. (Rural)
1204 (0.108)
1329 (3.732)*
1121 (1.652)
1003 (3.050)*
1215
Source: MICS (2003-04) 1. Absolute value of t-statistics in brackets (*indicates significance at
1% level) 2. P.C.E refers to Per Capita Expenditure 3. P.C.I refers to Per Capita Income
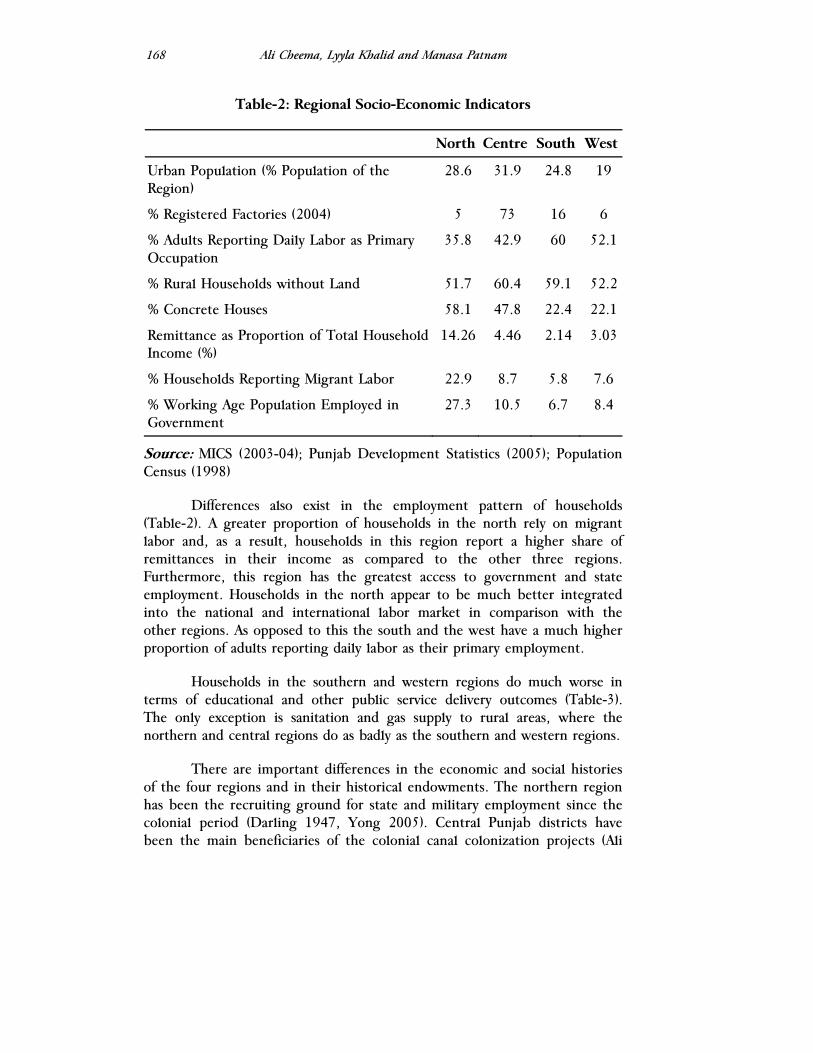
Ali Cheema, Lyyla Khalid and Manasa Patnam
168
Table-2: Regional Socio-Economic Indicators
North Centre South West
Urban Population (% Population of the Region)
28.6 31.9 24.8 19
% Registered Factories (2004) 5 73 16 6
% Adults Reporting Daily Labor as Primary Occupation
35.8 42.9 60 52.1
% Rural Households without Land 51.7 60.4 59.1 52.2
% Concrete Houses 58.1 47.8 22.4 22.1
Remittance as Proportion of Total Household Income (%)
14.26 4.46 2.14 3.03
% Households Reporting Migrant Labor 22.9 8.7 5.8 7.6
% Working Age Population Employed in Government
27.3 10.5 6.7 8.4
Source: MICS (2003-04); Punjab Development Statistics (2005); Population Census (1998)
Differences also exist in the employment pattern of households (Table-2). A greater proportion of households in the north rely on migrant labor and, as a result, households in this region report a higher share of remittances in their income as compared to the other three regions. Furthermore, this region has the greatest access to government and state employment. Households in the north appear to be much better integrated into the national and international labor market in comparison with the other regions. As opposed to this the south and the west have a much higher proportion of adults reporting daily labor as their primary employment.
Households in the southern and western regions do much worse in terms of educational and other public service delivery outcomes (Table-3). The only exception is sanitation and gas supply to rural areas, where the northern and central regions do as badly as the southern and western regions.
There are important differences in the economic and social histories of the four regions and in their historical endowments. The northern region has been the recruiting ground for state and military employment since the colonial period (Darling 1947, Yong 2005). Central Punjab districts have been the main beneficiaries of the colonial canal colonization projects (Ali
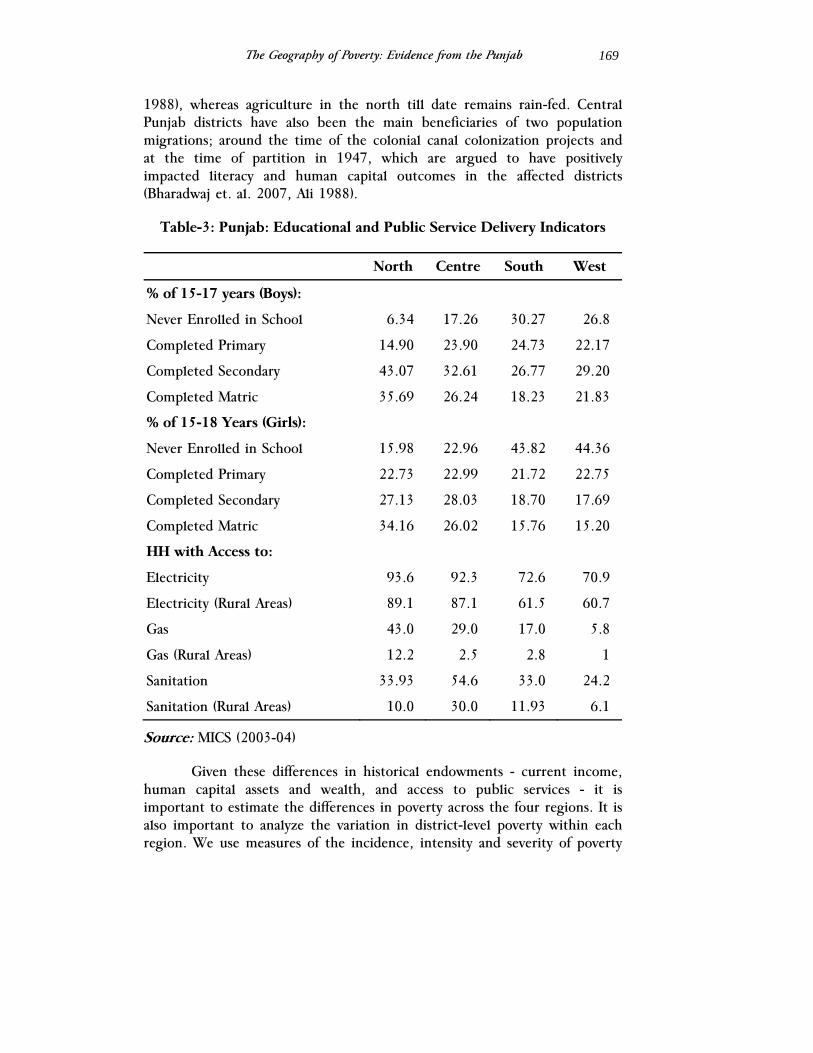
The Geography of Poverty: Evidence from the Punjab
169
1988), whereas agriculture in the north till date remains rain-fed. Central Punjab districts have also been the main beneficiaries of two population migrations; around the time of the colonial canal colonization projects and at the time of partition in 1947, which are argued to have positively impacted literacy and human capital outcomes in the affected districts (Bharadwaj et. al. 2007, Ali 1988).
Table-3: Punjab: Educational and Public Service Delivery Indicators
North Centre South West
% of 15-17 years (Boys):
Never Enrolled in School 6.34 17.26 30.27 26.8
Completed Primary 14.90 23.90 24.73 22.17
Completed Secondary 43.07 32.61 26.77 29.20
Completed Matric 35.69 26.24 18.23 21.83
% of 15-18 Years (Girls):
Never Enrolled in School 15.98 22.96 43.82 44.36
Completed Primary 22.73 22.99 21.72 22.75
Completed Secondary 27.13 28.03 18.70 17.69
Completed Matric 34.16 26.02 15.76 15.20
HH with Access to:
Electricity 93.6 92.3 72.6 70.9
Electricity (Rural Areas) 89.1 87.1 61.5 60.7
Gas 43.0 29.0 17.0 5.8
Gas (Rural Areas) 12.2 2.5 2.8 1
Sanitation 33.93 54.6 33.0 24.2
Sanitation (Rural Areas) 10.0 30.0 11.93 6.1
Source: MICS (2003-04)
Given these differences in historical endowments - current income, human capital assets and wealth, and access to public services - it is important to estimate the differences in poverty across the four regions. It is also important to analyze the variation in district-level poverty within each region. We use measures of the incidence, intensity and severity of poverty
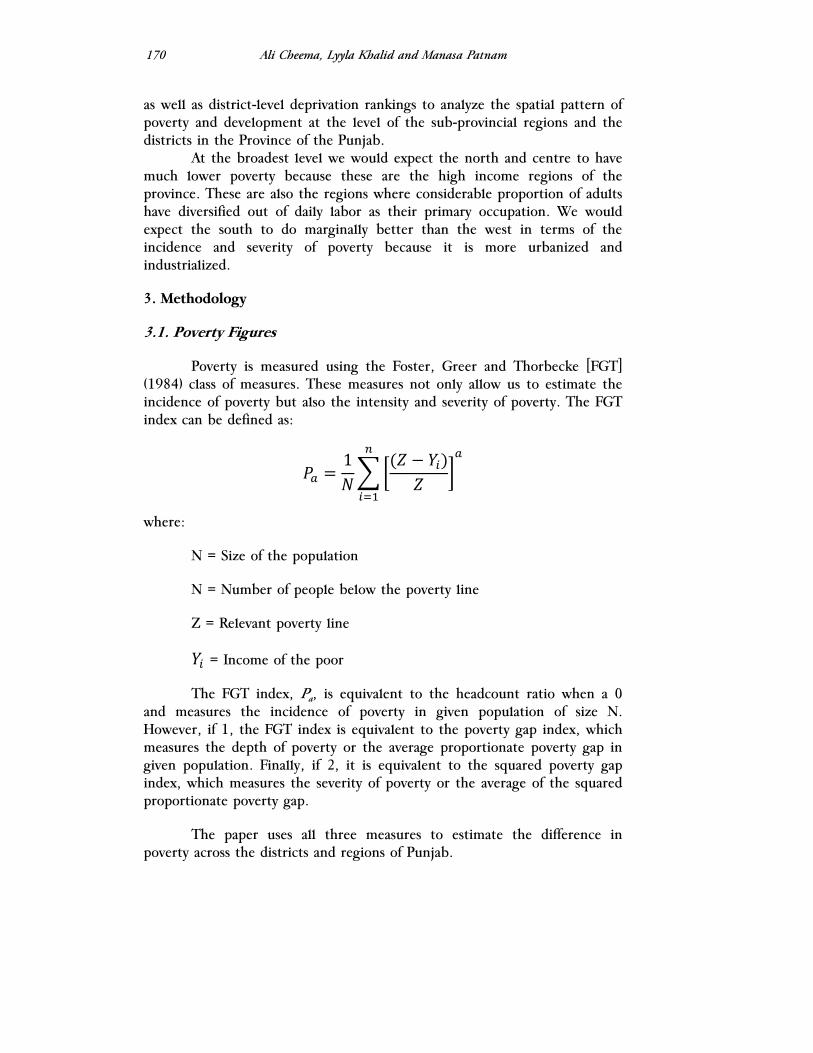
Ali Cheema, Lyyla Khalid and Manasa Patnam
170
as well as district-level deprivation rankings to analyze the spatial pattern of poverty and development at the level of the sub-provincial regions and the districts in the Province of the Punjab.
At the broadest level we would expect the north and centre to have much lower poverty because these are the high income regions of the province. These are also the regions where considerable proportion of adults have diversified out of daily labor as their primary occupation. We would expect the south to do marginally better than the west in terms of the incidence and severity of poverty because it is more urbanized and industrialized.
3. Methodology
3.1. Poverty Figures
Poverty is measured using the Foster, Greer and Thorbecke [FGT] (1984) class of measures. These measures not only allow us to estimate the incidence of poverty but also the intensity and severity of poverty. The FGT index can be defined as:
1
where:
N = Size of the population
N = Number of people below the poverty line
Z = Relevant poverty line
= Income of the poor
The FGT index, Pa, is equivalent to the headcount ratio when a 0 and measures the incidence of poverty in given population of size N. However, if 1, the FGT index is equivalent to the poverty gap index, which measures the depth of poverty or the average proportionate poverty gap in given population. Finally, if 2, it is equivalent to the squared poverty gap index, which measures the severity of poverty or the average of the squared proportionate poverty gap.
The paper uses all three measures to estimate the difference in poverty across the districts and regions of Punjab.
The Geography of Poverty: Evidence from the Punjab
171
3.2. Poverty Estimation
Consistent with the literature for developing countries, we use a consumption based expenditure indicator rather than an income based indicator for the measurement of poverty. As argued by Deaton and Zaidi (2002) there are several reasons for doing so. Firstly, current consumption is less volatile to negative income shocks and hence is less variable over time. This is so especially in settings which are highly dependent on agriculture, where the households’ stream of income fluctuates considerably over seasons and years. Secondly, there is a risk involved in measuring the income for households whose occupations are self-employment based. Often, these incomes (which are self-reported) are either underreported or reported with significant error. In such cases using income as measure for poverty will seriously bias our results.
Having chosen the consumption-based measure, we now discuss the methods used to calculate the poverty line and the real per capita expenditure of households, two essential measures that are needed in the calculation of poverty. The poverty line used in the paper is an inflation-adjusted version of the national poverty line estimated by the Planning Commission (Cheema 2005) and validated by the World Bank (2005)2
. The
national poverty line, which uses the calorific requirement approach and is based on calorie intake requirement of 2350 calories per adult equivalent per day, is estimated to be Rs. 723.4 per capita per month for 2000-01 (World Bank 2005). For the year 2003-04, the year of the MICS survey, adjusting for inflation using the Consumer Price Index (CPI), the poverty line stands at Rs. 807.53 per capita per month. Households with monthly consumption expenditure lower than this are classified as ‘poor’.
In order to ensure comparability with the Planning Commission (Cheema 2005) and the World Bank (2005) estimates and analysis we use a single provincial poverty line for both rural and urban areas, which is based on the World Bank validated national poverty line. However, we check the robustness of our estimation using separate poverty lines for urban and rural areas that are inflation-adjusted versions of the urban and rural national poverty lines reported in World Bank (2002). Robustness is also checked by employing different methods to deflate the consumption expenditure of households.
2 For details see (http://siteresources.worldbank.org/INTSAREGTOPPOVRED/1337567-1152551765388/20987772/ PovertyHCR2000-2005.pdf)
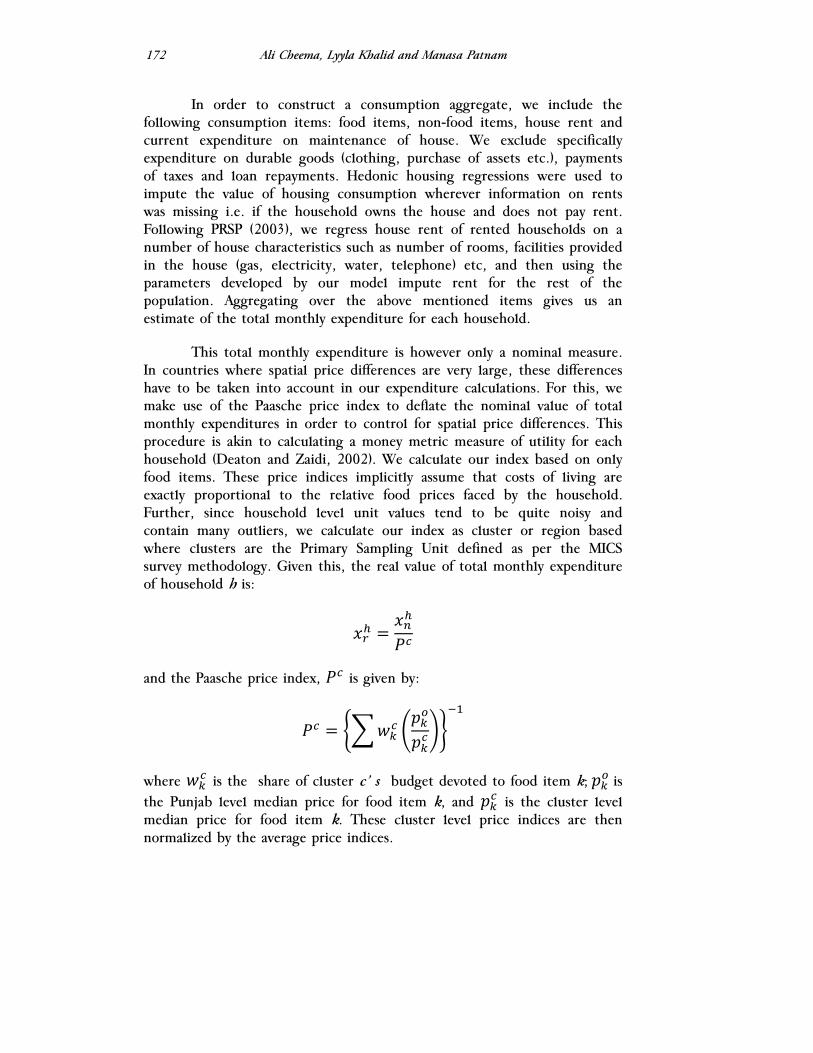
Ali Cheema, Lyyla Khalid and Manasa Patnam
172
In order to construct a consumption aggregate, we include the following consumption items: food items, non-food items, house rent and current expenditure on maintenance of house. We exclude specifically expenditure on durable goods (clothing, purchase of assets etc.), payments of taxes and loan repayments. Hedonic housing regressions were used to impute the value of housing consumption wherever information on rents was missing i.e. if the household owns the house and does not pay rent. Following PRSP (2003), we regress house rent of rented households on a number of house characteristics such as number of rooms, facilities provided in the house (gas, electricity, water, telephone) etc, and then using the parameters developed by our model impute rent for the rest of the population. Aggregating over the above mentioned items gives us an estimate of the total monthly expenditure for each household.
This total monthly expenditure is however only a nominal measure. In countries where spatial price differences are very large, these differences have to be taken into account in our expenditure calculations. For this, we make use of the Paasche price index to deflate the nominal value of total monthly expenditures in order to control for spatial price differences. This procedure is akin to calculating a money metric measure of utility for each household (Deaton and Zaidi, 2002). We calculate our index based on only food items. These price indices implicitly assume that costs of living are exactly proportional to the relative food prices faced by the household. Further, since household level unit values tend to be quite noisy and contain many outliers, we calculate our index as cluster or region based where clusters are the Primary Sampling Unit defined as per the MICS survey methodology. Given this, the real value of total monthly expenditure of household h is:
and the Paasche price index, is given by:
where is the share of cluster c’ s budget devoted to food item k; is the Punjab level median price for food item k, and is the cluster level median price for food item k. These cluster level price indices are then normalized by the average price indices.
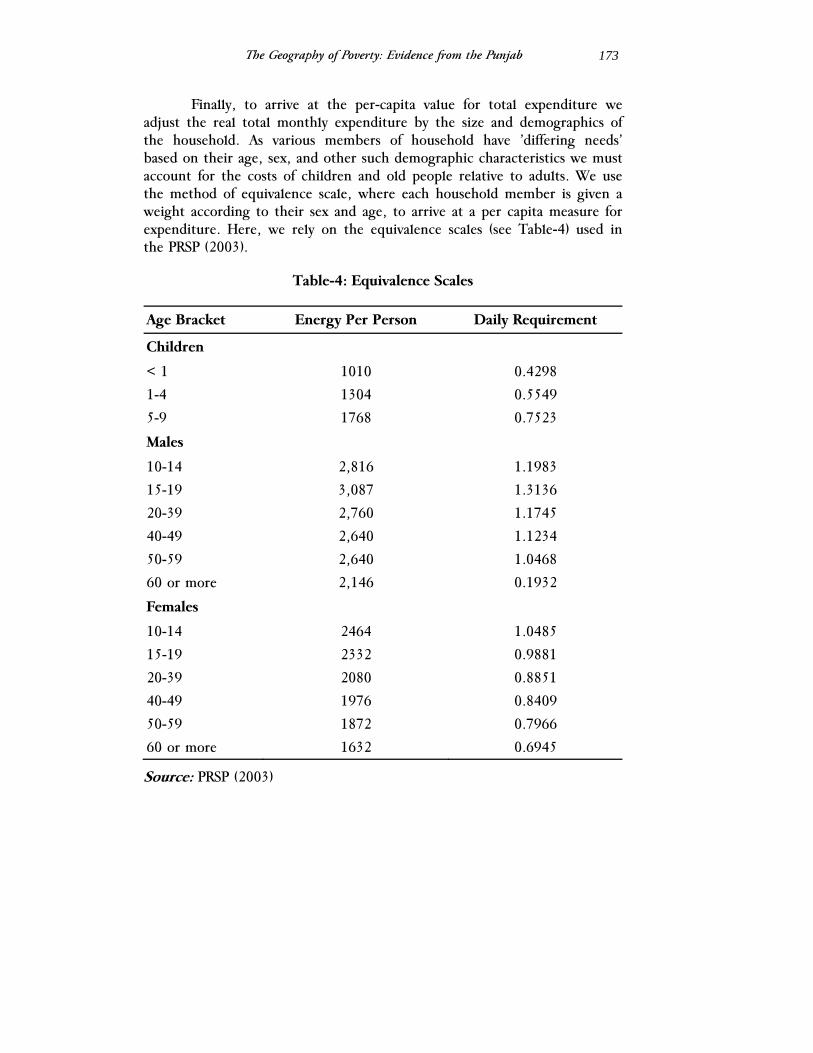
The Geography of Poverty: Evidence from the Punjab
173
Finally, to arrive at the per-capita value for total expenditure we adjust the real total monthly expenditure by the size and demographics of the household. As various members of household have ’differing needs’ based on their age, sex, and other such demographic characteristics we must account for the costs of children and old people relative to adults. We use the method of equivalence scale, where each household member is given a weight according to their sex and age, to arrive at a per capita measure for expenditure. Here, we rely on the equivalence scales (see Table-4) used in the PRSP (2003).
Table-4: Equivalence Scales
Age Bracket Energy Per Person Daily Requirement
Children
< 1 1010 0.4298
1-4 1304 0.5549
5-9 1768 0.7523
Males
10-14 2,816 1.1983
15-19 3,087 1.3136
20-39 2,760 1.1745
40-49 2,640 1.1234
50-59 2,640 1.0468
60 or more 2,146 0.1932
Females
10-14 2464 1.0485
15-19 2332 0.9881
20-39 2080 0.8851
40-49 1976 0.8409
50-59 1872 0.7966
60 or more 1632 0.6945
Source: PRSP (2003)
Ali Cheema, Lyyla Khalid and Manasa Patnam
174
3.3. Deprivation Indices
The paper also analyzes the extent to which there is an overlap between district-level poverty and district-level socio-economic deprivation. Socio-economic deprivation may be assessed through a variety of economic and social measures. Following the work of Jamal et al (2003) we compute indices of multiple socioeconomic deprivations, which are based on separate indicators of development deprivation.
District rankings on the basis of deprivation indices are extremely sensitive, not only to the composition of the indices under consideration but also to the methodology employed. In the analysis below we compute four separate deprivation indices for the districts of the Punjab using principal component analysis (PCA). PCA transforms a number of correlated variables into a smaller number of uncorrelated variables using the eigenvector values obtained.
Deprivation indices are calculated using a combination of the following six indicators:
1) Education: Male illiteracy rate (10 years and above); female illiteracy rate (10 years and above); male proportion out of school children; and female proportion out of school children.
2) Housing Quality: Proportion of adobe houses; persons per room; percentage of housing units with one room; percentage of non-owner households; and households with no latrine facility.
3) Housing Services: Percentage of un-electrified households; percentage of households without gas; percentage of households with no inside piped water connection; and households with no telephone connection.
4) Employment: Unemployment rate [15-65 years].
5) Poverty: Head Count Ratios
6) Social Indicators: Under 5 mortality rates; ante-natal care by skilled health workers.
Using these indicators the following indices are computed:
Index 1 Consists of items to 5 (i.e. Education, Housing Quality, Housing Services, Employment, Poverty HCR’s).
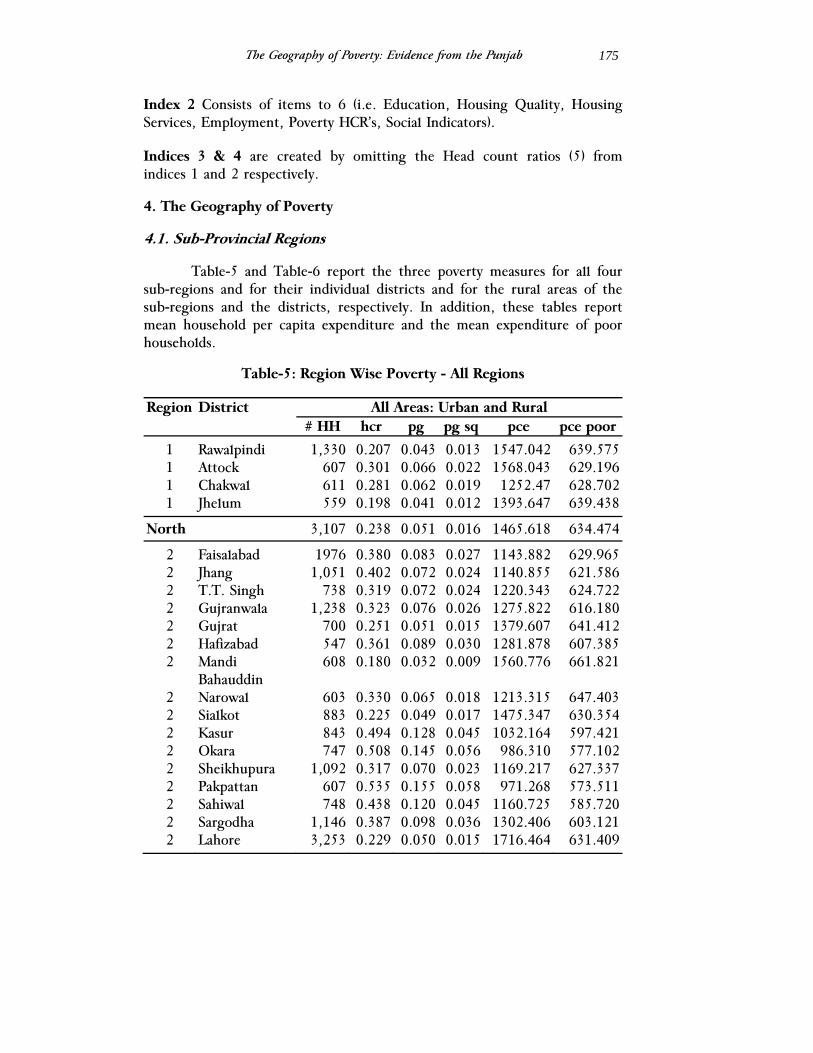
The Geography of Poverty: Evidence from the Punjab
175
Index 2 Consists of items to 6 (i.e. Education, Housing Quality, Housing Services, Employment, Poverty HCR’s, Social Indicators).
Indices 3 & 4 are created by omitting the Head count ratios (5) from indices 1 and 2 respectively.
4. The Geography of Poverty
4.1. Sub-Provincial Regions
Table-5 and Table-6 report the three poverty measures for all four sub-regions and for their individual districts and for the rural areas of the sub-regions and the districts, respectively. In addition, these tables report mean household per capita expenditure and the mean expenditure of poor households.
Table-5: Region Wise Poverty - All Regions
Region District All Areas: Urban and Rural# HH hcr pg pg sq pce pce poor
1 Rawalpindi 1,330 0.207 0.043 0.013 1547.042 639.575 1 Attock 607 0.301 0.066 0.022 1568.043 629.196 1 Chakwal 611 0.281 0.062 0.019 1252.47 628.702 1 Jhelum 559 0.198 0.041 0.012 1393.647 639.438
North 3,107 0.238 0.051 0.016 1465.618 634.474
2 Faisalabad 1976 0.380 0.083 0.027 1143.882 629.965 2 Jhang 1,051 0.402 0.072 0.024 1140.855 621.586 2 T.T. Singh 738 0.319 0.072 0.024 1220.343 624.722 2 Gujranwala 1,238 0.323 0.076 0.026 1275.822 616.180 2 Gujrat 700 0.251 0.051 0.015 1379.607 641.412 2 Hafizabad 547 0.361 0.089 0.030 1281.878 607.385 2 Mandi
Bahauddin 608 0.180 0.032 0.009 1560.776 661.821
2 Narowal 603 0.330 0.065 0.018 1213.315 647.403 2 Sialkot 883 0.225 0.049 0.017 1475.347 630.354 2 Kasur 843 0.494 0.128 0.045 1032.164 597.421 2 Okara 747 0.508 0.145 0.056 986.310 577.102 2 Sheikhupura 1,092 0.317 0.070 0.023 1169.217 627.337 2 Pakpattan 607 0.535 0.155 0.058 971.268 573.511 2 Sahiwal 748 0.438 0.120 0.045 1160.725 585.720 2 Sargodha 1,146 0.387 0.098 0.036 1302.406 603.121 2 Lahore 3,253 0.229 0.050 0.015 1716.464 631.409
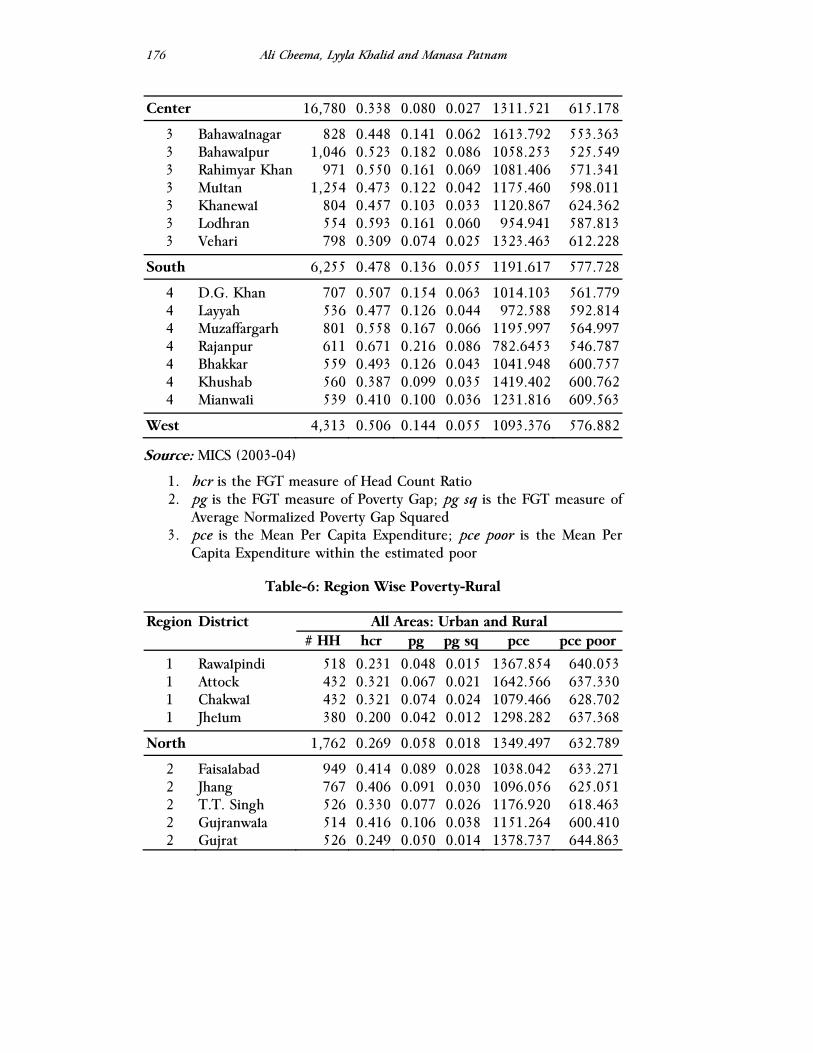
Ali Cheema, Lyyla Khalid and Manasa Patnam
176
Center 16,780 0.338 0.080 0.027 1311.521 615.178
3 Bahawalnagar 828 0.448 0.141 0.062 1613.792 553.363 3 Bahawalpur 1,046 0.523 0.182 0.086 1058.253 525.549 3 Rahimyar Khan 971 0.550 0.161 0.069 1081.406 571.341 3 Multan 1,254 0.473 0.122 0.042 1175.460 598.011 3 Khanewal 804 0.457 0.103 0.033 1120.867 624.362 3 Lodhran 554 0.593 0.161 0.060 954.941 587.813 3 Vehari 798 0.309 0.074 0.025 1323.463 612.228
South 6,255 0.478 0.136 0.055 1191.617 577.728
4 D.G. Khan 707 0.507 0.154 0.063 1014.103 561.779 4 Layyah 536 0.477 0.126 0.044 972.588 592.814 4 Muzaffargarh 801 0.558 0.167 0.066 1195.997 564.997 4 Rajanpur 611 0.671 0.216 0.086 782.6453 546.787 4 Bhakkar 559 0.493 0.126 0.043 1041.948 600.757 4 Khushab 560 0.387 0.099 0.035 1419.402 600.762 4 Mianwali 539 0.410 0.100 0.036 1231.816 609.563
West 4,313 0.506 0.144 0.055 1093.376 576.882
Source: MICS (2003-04)
1. hcr is the FGT measure of Head Count Ratio 2. pg is the FGT measure of Poverty Gap; pg sq is the FGT measure of
Average Normalized Poverty Gap Squared 3. pce is the Mean Per Capita Expenditure; pce poor is the Mean Per
Capita Expenditure within the estimated poor
Table-6: Region Wise Poverty-Rural
Region District All Areas: Urban and Rural# HH hcr pg pg sq pce pce poor
1 Rawalpindi 518 0.231 0.048 0.015 1367.854 640.053 1 Attock 432 0.321 0.067 0.021 1642.566 637.330 1 Chakwal 432 0.321 0.074 0.024 1079.466 628.702 1 Jhelum 380 0.200 0.042 0.012 1298.282 637.368
North 1,762 0.269 0.058 0.018 1349.497 632.789
2 Faisalabad 949 0.414 0.089 0.028 1038.042 633.271 2 Jhang 767 0.406 0.091 0.030 1096.056 625.051 2 T.T. Singh 526 0.330 0.077 0.026 1176.920 618.463 2 Gujranwala 514 0.416 0.106 0.038 1151.264 600.410 2 Gujrat 526 0.249 0.050 0.014 1378.737 644.863
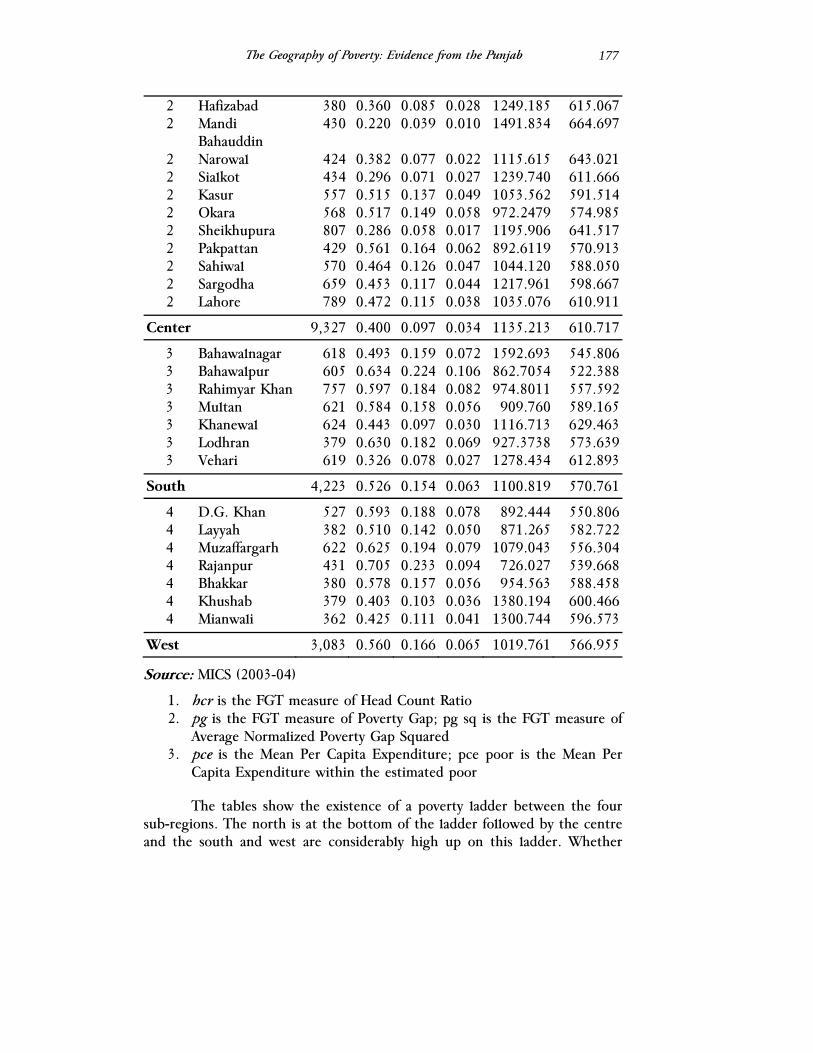
The Geography of Poverty: Evidence from the Punjab
177
2 Hafizabad 380 0.360 0.085 0.028 1249.185 615.067 2 Mandi
Bahauddin 430 0.220 0.039 0.010 1491.834 664.697
2 Narowal 424 0.382 0.077 0.022 1115.615 643.021 2 Sialkot 434 0.296 0.071 0.027 1239.740 611.666 2 Kasur 557 0.515 0.137 0.049 1053.562 591.514 2 Okara 568 0.517 0.149 0.058 972.2479 574.985 2 Sheikhupura 807 0.286 0.058 0.017 1195.906 641.517 2 Pakpattan 429 0.561 0.164 0.062 892.6119 570.913 2 Sahiwal 570 0.464 0.126 0.047 1044.120 588.050 2 Sargodha 659 0.453 0.117 0.044 1217.961 598.667 2 Lahore 789 0.472 0.115 0.038 1035.076 610.911
Center 9,327 0.400 0.097 0.034 1135.213 610.717
3 Bahawalnagar 618 0.493 0.159 0.072 1592.693 545.806 3 Bahawalpur 605 0.634 0.224 0.106 862.7054 522.388 3 Rahimyar Khan 757 0.597 0.184 0.082 974.8011 557.592 3 Multan 621 0.584 0.158 0.056 909.760 589.165 3 Khanewal 624 0.443 0.097 0.030 1116.713 629.463 3 Lodhran 379 0.630 0.182 0.069 927.3738 573.639 3 Vehari 619 0.326 0.078 0.027 1278.434 612.893
South 4,223 0.526 0.154 0.063 1100.819 570.761
4 D.G. Khan 527 0.593 0.188 0.078 892.444 550.806 4 Layyah 382 0.510 0.142 0.050 871.265 582.722 4 Muzaffargarh 622 0.625 0.194 0.079 1079.043 556.304 4 Rajanpur 431 0.705 0.233 0.094 726.027 539.668 4 Bhakkar 380 0.578 0.157 0.056 954.563 588.458 4 Khushab 379 0.403 0.103 0.036 1380.194 600.466 4 Mianwali 362 0.425 0.111 0.041 1300.744 596.573
West 3,083 0.560 0.166 0.065 1019.761 566.955
Source: MICS (2003-04)
1. hcr is the FGT measure of Head Count Ratio 2. pg is the FGT measure of Poverty Gap; pg sq is the FGT measure of
Average Normalized Poverty Gap Squared 3. pce is the Mean Per Capita Expenditure; pce poor is the Mean Per
Capita Expenditure within the estimated poor
The tables show the existence of a poverty ladder between the four sub-regions. The north is at the bottom of the ladder followed by the centre and the south and west are considerably high up on this ladder. Whether
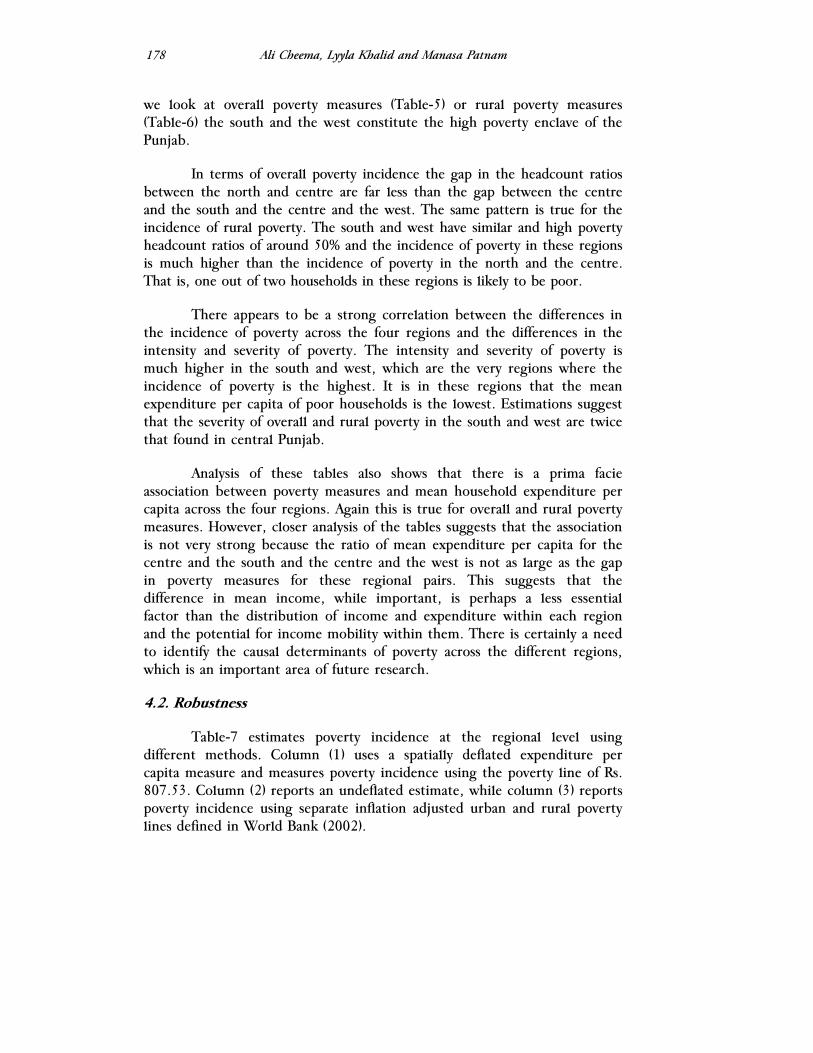
Ali Cheema, Lyyla Khalid and Manasa Patnam
178
we look at overall poverty measures (Table-5) or rural poverty measures (Table-6) the south and the west constitute the high poverty enclave of the Punjab.
In terms of overall poverty incidence the gap in the headcount ratios between the north and centre are far less than the gap between the centre and the south and the centre and the west. The same pattern is true for the incidence of rural poverty. The south and west have similar and high poverty headcount ratios of around 50% and the incidence of poverty in these regions is much higher than the incidence of poverty in the north and the centre. That is, one out of two households in these regions is likely to be poor.
There appears to be a strong correlation between the differences in the incidence of poverty across the four regions and the differences in the intensity and severity of poverty. The intensity and severity of poverty is much higher in the south and west, which are the very regions where the incidence of poverty is the highest. It is in these regions that the mean expenditure per capita of poor households is the lowest. Estimations suggest that the severity of overall and rural poverty in the south and west are twice that found in central Punjab.
Analysis of these tables also shows that there is a prima facie association between poverty measures and mean household expenditure per capita across the four regions. Again this is true for overall and rural poverty measures. However, closer analysis of the tables suggests that the association is not very strong because the ratio of mean expenditure per capita for the centre and the south and the centre and the west is not as large as the gap in poverty measures for these regional pairs. This suggests that the difference in mean income, while important, is perhaps a less essential factor than the distribution of income and expenditure within each region and the potential for income mobility within them. There is certainly a need to identify the causal determinants of poverty across the different regions, which is an important area of future research.
4.2. Robustness
Table-7 estimates poverty incidence at the regional level using different methods. Column (1) uses a spatially deflated expenditure per capita measure and measures poverty incidence using the poverty line of Rs. 807.53. Column (2) reports an undeflated estimate, while column (3) reports poverty incidence using separate inflation adjusted urban and rural poverty lines defined in World Bank (2002).
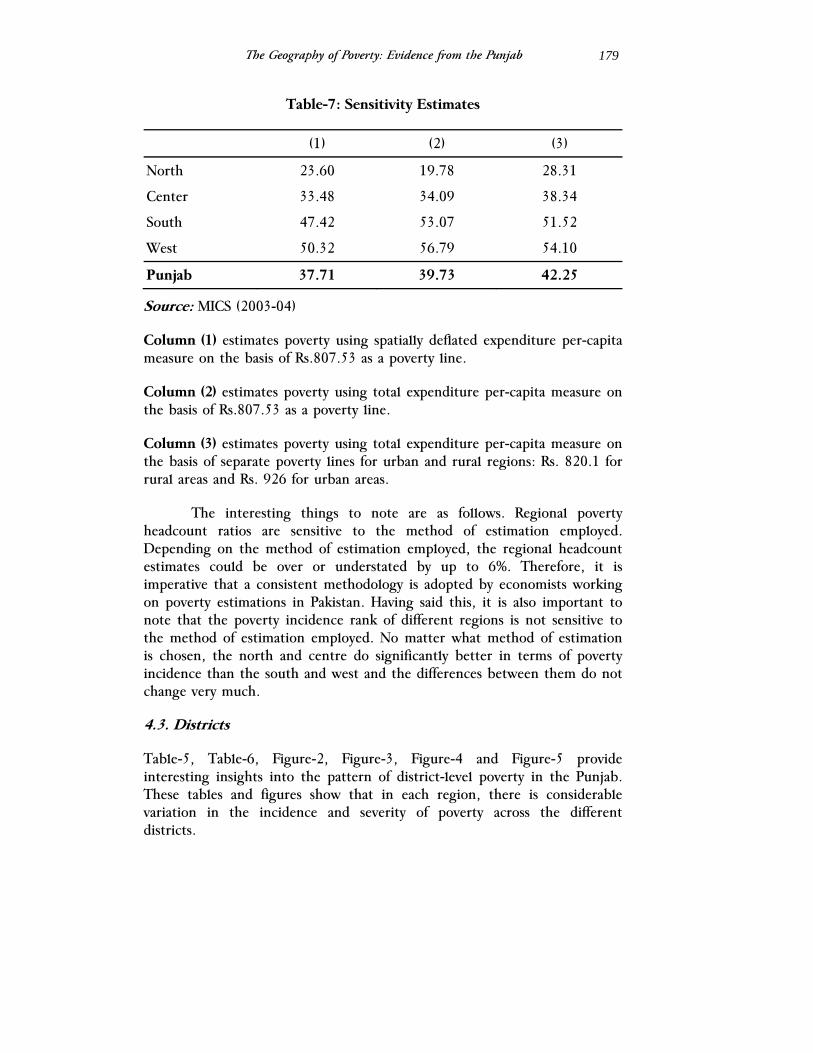
The Geography of Poverty: Evidence from the Punjab
179
Table-7: Sensitivity Estimates
(1) (2) (3)
North 23.60 19.78 28.31
Center 33.48 34.09 38.34
South 47.42 53.07 51.52
West 50.32 56.79 54.10
Punjab 37.71 39.73 42.25
Source: MICS (2003-04)
Column (1) estimates poverty using spatially deflated expenditure per-capita measure on the basis of Rs.807.53 as a poverty line.
Column (2) estimates poverty using total expenditure per-capita measure on the basis of Rs.807.53 as a poverty line.
Column (3) estimates poverty using total expenditure per-capita measure on the basis of separate poverty lines for urban and rural regions: Rs. 820.1 for rural areas and Rs. 926 for urban areas.
The interesting things to note are as follows. Regional poverty headcount ratios are sensitive to the method of estimation employed. Depending on the method of estimation employed, the regional headcount estimates could be over or understated by up to 6%. Therefore, it is imperative that a consistent methodology is adopted by economists working on poverty estimations in Pakistan. Having said this, it is also important to note that the poverty incidence rank of different regions is not sensitive to the method of estimation employed. No matter what method of estimation is chosen, the north and centre do significantly better in terms of poverty incidence than the south and west and the differences between them do not change very much.
4.3. Districts
Table-5, Table-6, Figure-2, Figure-3, Figure-4 and Figure-5 provide interesting insights into the pattern of district-level poverty in the Punjab. These tables and figures show that in each region, there is considerable variation in the incidence and severity of poverty across the different districts.
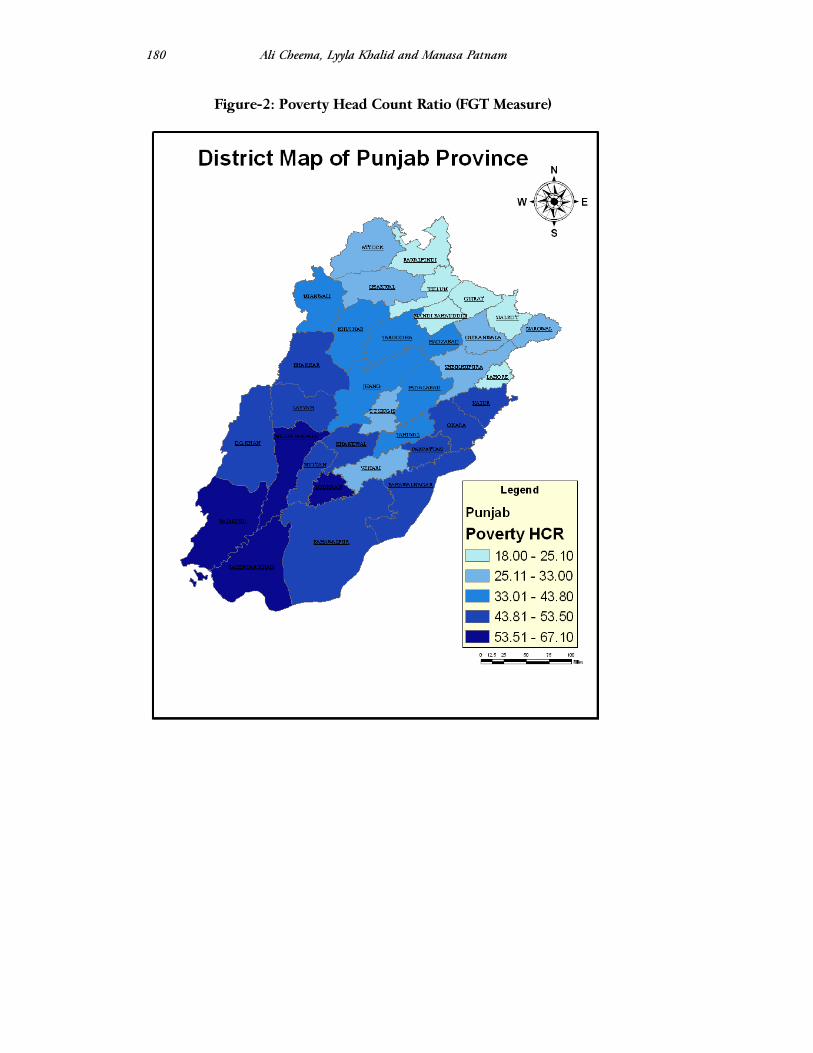
Ali Cheema, Lyyla Khalid and Manasa Patnam
180
Figure-2: Poverty Head Count Ratio (FGT Measure)

The Geography of Poverty: Evidence from the Punjab
181
Figure-3: Poverty Head Count Ratio (FGT Measure): Rural Areas
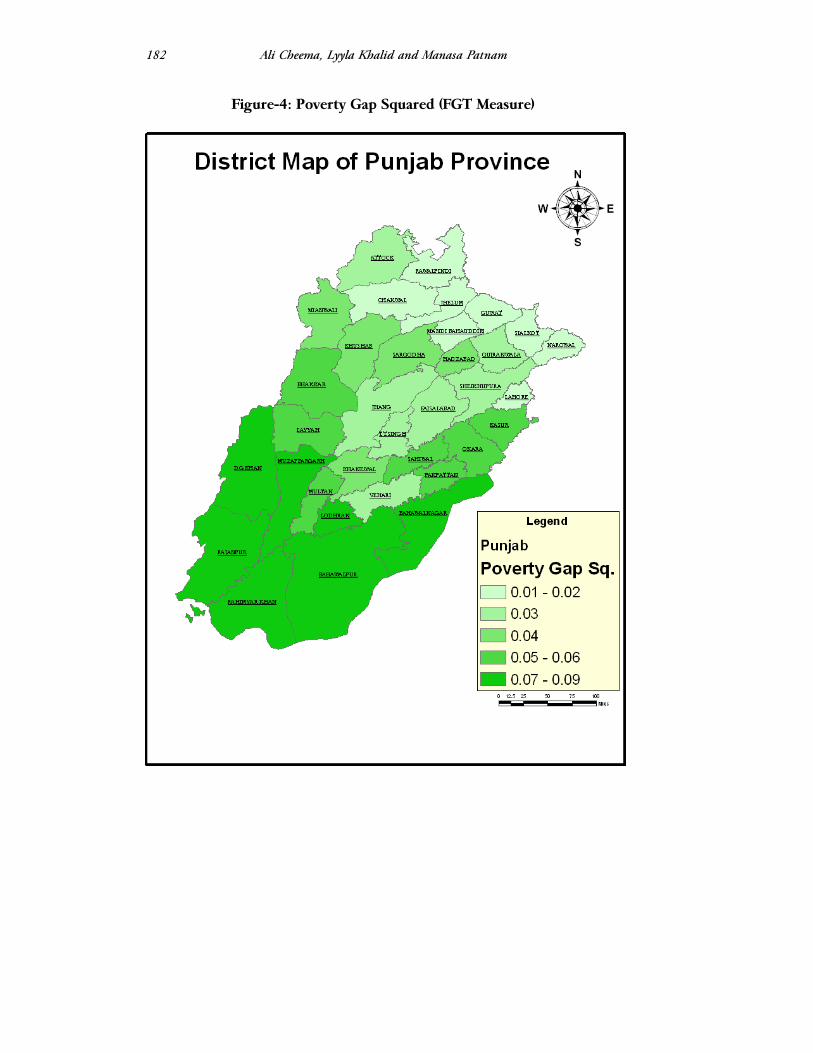
Ali Cheema, Lyyla Khalid and Manasa Patnam
182
Figure-4: Poverty Gap Squared (FGT Measure)
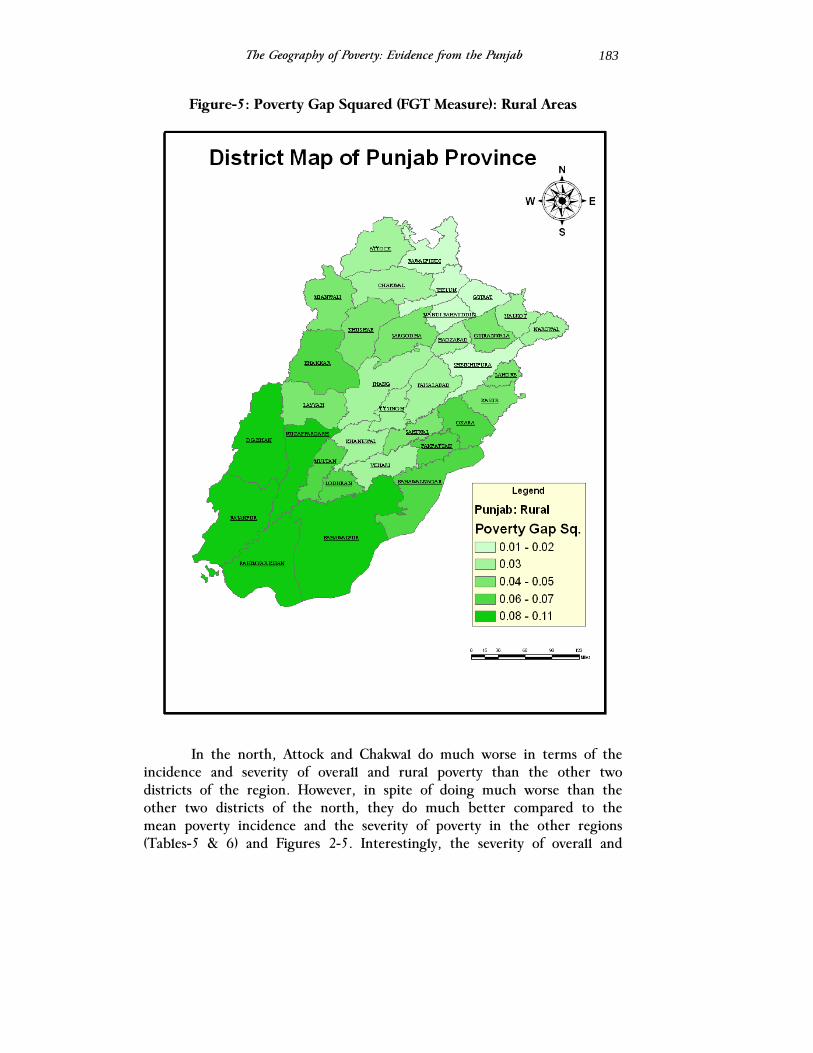
The Geography of Poverty: Evidence from the Punjab
183
Figure-5: Poverty Gap Squared (FGT Measure): Rural Areas
In the north, Attock and Chakwal do much worse in terms of the incidence and severity of overall and rural poverty than the other two districts of the region. However, in spite of doing much worse than the other two districts of the north, they do much better compared to the mean poverty incidence and the severity of poverty in the other regions (Tables-5 & 6) and Figures 2-5. Interestingly, the severity of overall and
Ali Cheema, Lyyla Khalid and Manasa Patnam
184
rural poverty in all the districts of the north is much lower than the severity found in the other districts of the province (Figure 4-5).
Central Punjabi districts have a tremendous variation in terms of the incidence and severity of poverty (Figures 2-5). In terms of overall poverty incidence and severity the northern and/or more urbanized and industrialized districts of Lahore, Sialkot, Mandi Bahauddin and Gujrat appear to be similar to the districts of north Punjab. These districts, with the exception of Lahore, perform similar to northern districts in terms of rural poverty incidence as well. At the other extreme, Kasur, Okara and Pakpattan have overall and rural poverty headcount ratios that are higher than the southern Punjab mean indicating the existence of a high poverty enclave within central Punjab. It appears that there is tremendous variation in the range of poverty experiences in central Punjabi districts and the causes of this variation need to be understood if policy is to make headway in terms of poverty reduction.
There is much more homogeneity in terms of poverty experiences in the south and west. Most districts have overall poverty headcount ratios that range around 50% and rural poverty incidence is higher than the incidence of overall poverty in most districts (Figures 2-3). Extreme incidence of overall poverty, more than 60%, is found in Rajanur and in terms of rural poverty it is found in Rajanpur, Muzzaffargarh, D.G. Khan, Lodhran, Rahimyar Khan and Bahawalpur.
In spite of this homogeneity there are clear outliers where poverty is similar to the central Punjab mean (Figures 2-5). The starkest outlier is Vehari in terms of both the incidence and severity of overall and rural poverty. Its incidence and severity are less than the central Punjab mean. In terms of the severity of poverty and the incidence of rural poverty, Khanewal’s experience is in line with the central Punjab mean. Finally, in the west Khushab and Mianwali have poverty headcount ratios and severity measures that are in line with the central Punjab mean. Again, future research must try and explain why these districts have different poverty reduction paths from their neighbors.
An important finding is that in nine districts of the Punjab, rural households do much worse in terms of the incidence of poverty in comparison to urban households in the same districts (Tables-5 & 6). These districts include: Gujranwala, Narowal, Sialkot, Sargodha, Lahore, Bahawalpur, Multan, D.G. Khan, Muzzaffargarh, and Bhakkar. This is evident if you calculate the difference in the incidence of rural and overall poverty for each of these districts. The gap between rural poverty and
The Geography of Poverty: Evidence from the Punjab
185
overall poverty is much higher indicating that rural households in these districts fare far worse in poverty incidence in comparison to their urban counterparts. As opposed to this we find that rural poverty is only marginally higher than overall poverty in the other districts. The gap between rural and overall poverty is highest in Lahore followed by Bahawalpur and Multan. The difference between rural and overall poverty incidence in Lahore is 25% and the severity of rural poverty is twice the severity of overall poverty. This suggests that the peri-urban areas of Lahore house a substantial proportion of poor households, which indicates that urbanization is co-exiting with significant poverty.
4.4. Development Deficits
To what extent is there an association between poverty in a region and the existence of development deficits in the region? Section 3.3 describes the construction of different deprivation indices that are used to rank the development deficit at the district-level. The results are presented in Table-8. A rank of one means the least deprived or the most developed.
The table shows that all four districts of the north are ranked in the top ten districts in terms of deprivation indices and they maintain their rank in the top ten no matter what index is used. Similarly, nine out of the fourteen districts of south and west Punjab are ranked in the bottom ten districts, which suggests that they are systemically the most deprived. Within central Punjab the high poverty districts of Okara and Pakpattan continue to get ranked in the bottom ten districts. This suggests that there is a negative association between regional poverty and regional development. Even though the direction of causality is unclear, what is clear is that household poverty and district development tend to move together and high poverty enclaves also tend to have high development deficits.

Ali Cheema, Lyyla Khalid and Manasa Patnam
186
Table-8: Deprivation Index
District Index 1 Rank Index 2 Rank Index 3 Rank Index 4 Rank
Rajanpur 34 34 31 32 Rahimyar Khan 33 32 34 33 Lodhran 32 33 33 34 Muzaffargarh 31 31 32 31 Bahawalpur 30 30 29 29 D.G. Khan 29 26 30 25 Okara 28 27 28 28 Pakpattan 27 28 24 26 Bhakkar 26 29 27 30 Bahawalnagar 25 25 25 27 Layyah 24 24 21 21 Khanewal 23 23 23 23 Kasur 22 22 20 20 Jhang 21 21 22 22 Vehari 20 20 26 24 Sahiwal 19 18 18 18 Multan 18 19 17 17 Sheikhupura 17 17 19 19 Hafizabad 16 16 15 16 Narowal 15 14 16 15 Khushab 14 15 13 14 Mianwali 13 13 12 12 T.T. Singh 12 12 14 13 Sargodha 11 11 10 11 Faisalabad 10 10 9 9 Mandi Bahauddin 9 9 11 10 Attock 8 8 6 8 Gujrat 7 7 8 7 Gujranwala 6 6 5 5 Jhelum 5 5 7 6 Sialkot 4 3 4 4 Lahore 3 2 3 2 Chakwal 2 4 2 3 Rawalpindi 1 1 1 1
Source: MICS (2003-04) (For methodology see section 3.3).

The Geography of Poverty: Evidence from the Punjab
187
5. Conclusion
This paper provides estimates regarding the incidence and severity of poverty at the regional and the district-level for the Punjab province. Estimates suggest the existence of a high poverty enclave in the south and west regions of the Punjab. The incidence and severity of poverty in a majority of districts in this enclave, with few exceptions, is extremely high with one out of every two households being poor on average. This enclave also does poorly in terms of district-level development indictors.
The high levels of poverty in this enclave contrast with the relatively low poverty in the more urbanized north, where households are well integrated into the national and international labor market. The north does better in spite of low levels of industrialization and dependence on rain-fed agriculture. The experience of the high poverty districts is also in contrast with the more urbanized and industrialized northern districts of the centre. Poverty targeting and development policy must focus its poverty reduction effort on this enclave where poverty appears to be endemic. Taking a Rawlsian perspective we would argue that future growth revival must aim to reduce the poverty gap between the high and low poverty districts and this means that effective redistribution policies and interventions that increase the poor’s access to critical assets, such as land and education, and public and collective goods need to be designed. An important area of future research is whether the high growth experience of the 2003-07 period, with its weak redistribution policies, was able to bridge the poverty gap between these regions or did it exacerbate it?
The paper also argues that there is tremendous variation in the poverty experience of the districts in the centre. Poverty incidence in the more urbanized and industrialized northern districts of the centre contrasts sharply with the experience of Kasur, Okara and Pakpattan, where the incidence and severity of poverty is extremely high. Future research must try and explain the reasons for this variation.
Finally, we find that in nine districts rural households do much worse in terms of poverty incidence than their urban counterparts. The gap between urban and rural poverty incidence and severity is highest within the district of Lahore suggesting that urbanization is co-existing with a large poor population that inhabits the peri-urban areas of the district. An important aim of development policy and poverty targeting must be to try and lower the gap between urban and rural poverty in these districts. This also suggests that future research must try and estimate the variation in the intra-district incidence, intensity and severity of poverty and try to identify causal mechanisms that can explain this variation.

Ali Cheema, Lyyla Khalid and Manasa Patnam
188
References
Ali, I., 1988, The Punjab under Imperialism, 1885-1947, Oxford University Press, Karachi.
Cheema, I., 2005, “A Profile of Poverty in Pakistan”, CRPRID Working Paper.
Darling, M., 1947, The Punjab Peasant in Prosperity and Debt, Manohar, New Delhi.
Deaton, & Zaidi, S., 2002, Guidelines for Constructing Consumption Aggregates for Welfare Analysis, World Bank Publications.
Gazdar, H., 1999, “Poverty in Pakistan: Review”, in Fifty Years of Economic Development in Pakistan, Shahrukh Rafi Khan (ed), Oxford University Press, Karachi.
Malik, S.J., 2005, Agricultural Growth and Rural Poverty: Review of the Evidence, Asian Development Bank.
Wilder, A., 1999, The Pakistani Voter, Electoral Politics and Voting Behaviour in the Punjab, Oxford University Press, Karachi.
World Bank, 2002, “Pakistan Poverty Assessment, Poverty in Pakistan: Vulnerabilities, Social Gaps, and Rural Dynamics,” Report No. 24296-PAK, South Asia Region. Washington DC.
The Lahore Journal of Economics Special Edition (September 2008): pp. 189-204
Rethinking Development Strategy –The Importance of the
Rural Non Farm Economy in Growth and Poverty Reduction in Pakistan
Sohail Jehangir Malik*
Abstract
The structural transformation of Pakistan’s economy has not been accompanied by a concomitant decline in the proportion of labor employed in agriculture. While this transformation has resulted in a non-farm sector that is large and growing it has not lead to the rapid absorption of the pool of relatively low productivity labor away from the agriculture sector, as predicted by conventional development theory embodied in the models of the 1960s. Despite the obvious importance of the role of a vibrant rural non-farm economy (RNFE), and in particular, a vibrant non-farm services sector to address the challenges of poverty, food security, agricultural growth and rural development, this sector has received inadequate attention in the debate in Pakistan. Based on a review of literature and data from two large surveys – the Rural Investment Climate Survey of Pakistan 2005 and the Surveys of Domestic Commerce 2007 – this paper attempts to analyze the factors underlying the low level of development of the rural non farm economy and the potential role it can play in Pakistan’s economic development. JEL Classification: R11, R23
Keywords: Pakistan, Poverty, Rural, Development
Background
The development community is increasingly coming to realize the potential contribution of the rural non-farm sector to economic growth, directly because of its size and its responsiveness to growing agricultural, urban, and export markets, and indirectly through provision of financing, processing, marketing and other support services that stimulate and accelerate agricultural growth.
* Chairman, Innovative Development Strategies (Pvt) Ltd. All the usual disclaimers apply.
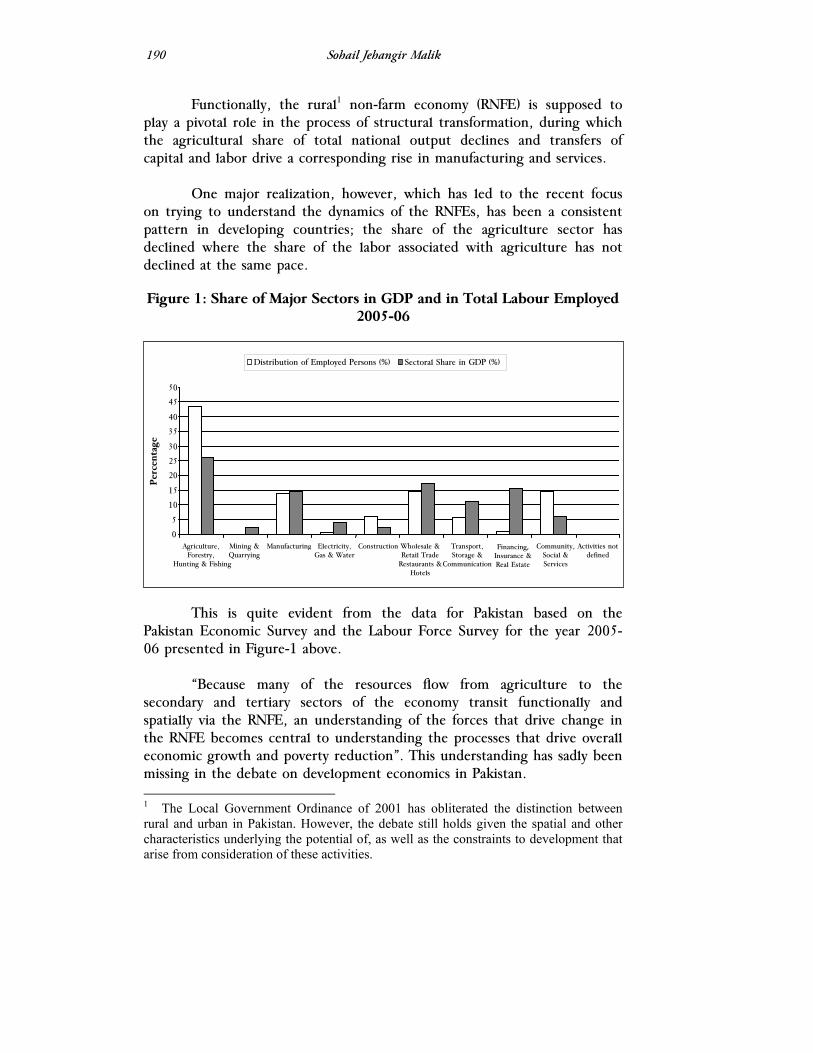
Sohail Jehangir Malik
190
Functionally, the rural1 non-farm economy (RNFE) is supposed to play a pivotal role in the process of structural transformation, during which the agricultural share of total national output declines and transfers of capital and labor drive a corresponding rise in manufacturing and services.
One major realization, however, which has led to the recent focus
on trying to understand the dynamics of the RNFEs, has been a consistent pattern in developing countries; the share of the agriculture sector has declined where the share of the labor associated with agriculture has not declined at the same pace.
Figure 1: Share of Major Sectors in GDP and in Total Labour Employed 2005-06
This is quite evident from the data for Pakistan based on the Pakistan Economic Survey and the Labour Force Survey for the year 2005-06 presented in Figure-1 above.
“Because many of the resources flow from agriculture to the
secondary and tertiary sectors of the economy transit functionally and spatially via the RNFE, an understanding of the forces that drive change in the RNFE becomes central to understanding the processes that drive overall economic growth and poverty reduction”. This understanding has sadly been missing in the debate on development economics in Pakistan. 1 The Local Government Ordinance of 2001 has obliterated the distinction between rural and urban in Pakistan. However, the debate still holds given the spatial and other characteristics underlying the potential of, as well as the constraints to development that arise from consideration of these activities.
0
5
10
15
20
25
30
35
40
45
50
Per
cent
age
Distribution of Employed Persons (%) Sectoral Share in GDP (%)
Agriculture, Forestry,
Hunting & Fishing
Manufacturing Electricity, Gas & Water
Construction Wholesale &Retail Trade
Restaurants &Hotels
Transport,Storage &
Communication
Financing, Insurance & Real Estate
Community,Social & Services
Activities not defined
Mining & Quarrying
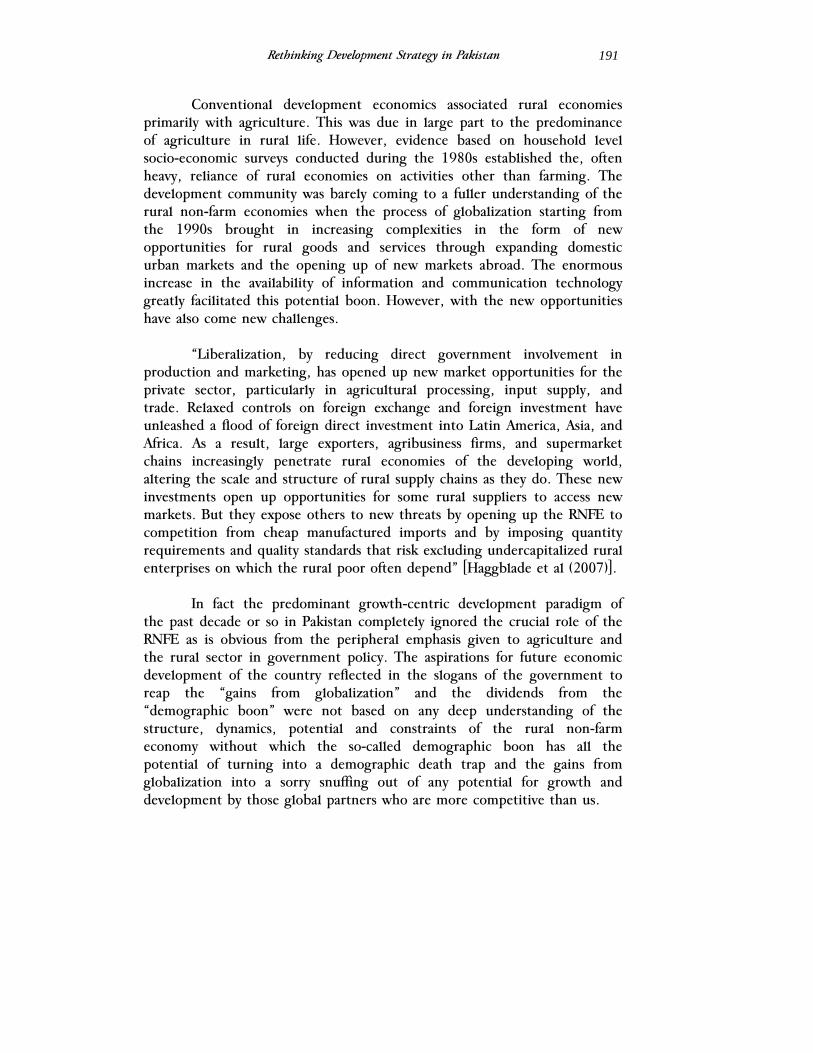
Rethinking Development Strategy in Pakistan
191
Conventional development economics associated rural economies primarily with agriculture. This was due in large part to the predominance of agriculture in rural life. However, evidence based on household level socio-economic surveys conducted during the 1980s established the, often heavy, reliance of rural economies on activities other than farming. The development community was barely coming to a fuller understanding of the rural non-farm economies when the process of globalization starting from the 1990s brought in increasing complexities in the form of new opportunities for rural goods and services through expanding domestic urban markets and the opening up of new markets abroad. The enormous increase in the availability of information and communication technology greatly facilitated this potential boon. However, with the new opportunities have also come new challenges.
“Liberalization, by reducing direct government involvement in
production and marketing, has opened up new market opportunities for the private sector, particularly in agricultural processing, input supply, and trade. Relaxed controls on foreign exchange and foreign investment have unleashed a flood of foreign direct investment into Latin America, Asia, and Africa. As a result, large exporters, agribusiness firms, and supermarket chains increasingly penetrate rural economies of the developing world, altering the scale and structure of rural supply chains as they do. These new investments open up opportunities for some rural suppliers to access new markets. But they expose others to new threats by opening up the RNFE to competition from cheap manufactured imports and by imposing quantity requirements and quality standards that risk excluding undercapitalized rural enterprises on which the rural poor often depend” [Haggblade et al (2007)].
In fact the predominant growth-centric development paradigm of
the past decade or so in Pakistan completely ignored the crucial role of the RNFE as is obvious from the peripheral emphasis given to agriculture and the rural sector in government policy. The aspirations for future economic development of the country reflected in the slogans of the government to reap the “gains from globalization” and the dividends from the “demographic boon” were not based on any deep understanding of the structure, dynamics, potential and constraints of the rural non-farm economy without which the so-called demographic boon has all the potential of turning into a demographic death trap and the gains from globalization into a sorry snuffing out of any potential for growth and development by those global partners who are more competitive than us.
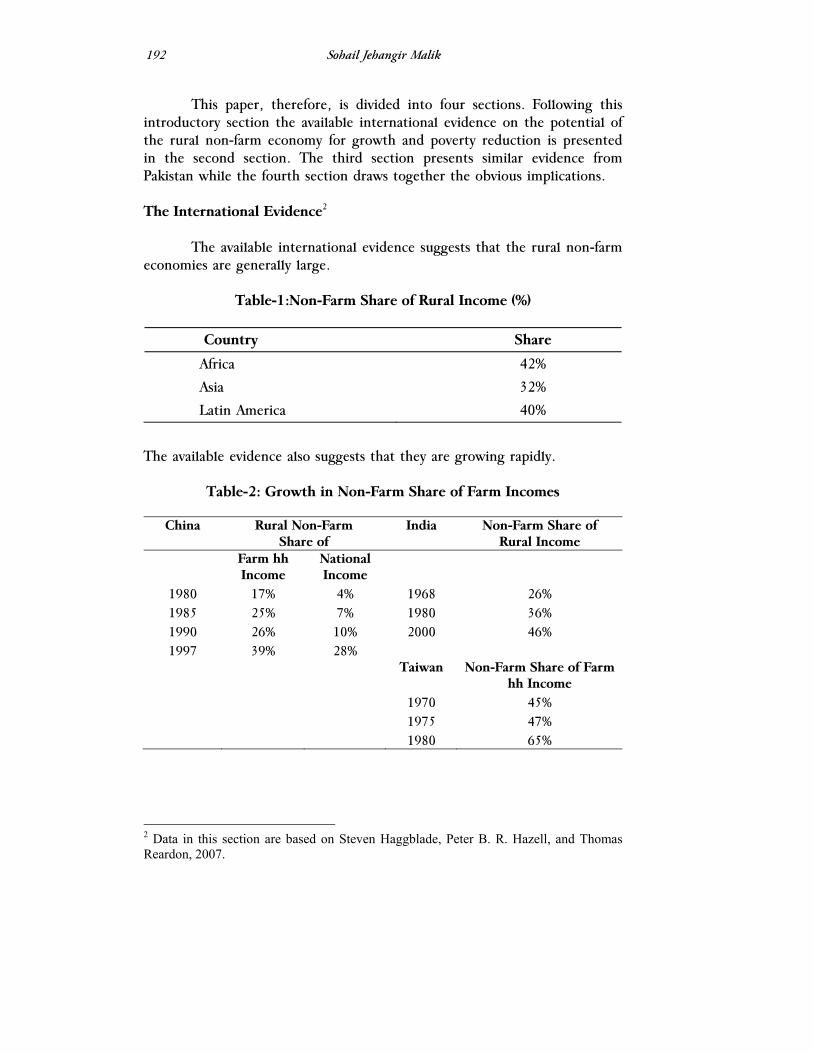
Sohail Jehangir Malik
192
This paper, therefore, is divided into four sections. Following this introductory section the available international evidence on the potential of the rural non-farm economy for growth and poverty reduction is presented in the second section. The third section presents similar evidence from Pakistan while the fourth section draws together the obvious implications.
The International Evidence2
The available international evidence suggests that the rural non-farm
economies are generally large.
Table-1:Non-Farm Share of Rural Income (%)
Country Share
Africa 42%
Asia 32%
Latin America 40%
The available evidence also suggests that they are growing rapidly.
Table-2: Growth in Non-Farm Share of Farm Incomes
China Rural Non-Farm Share of
India Non-Farm Share of Rural Income
Farm hh Income
National Income
1980 17% 4% 1968 26% 1985 25% 7% 1980 36% 1990 26% 10% 2000 46% 1997 39% 28%
Taiwan Non-Farm Share of Farm hh Income
1970 45% 1975 47% 1980 65%
2 Data in this section are based on Steven Haggblade, Peter B. R. Hazell, and Thomas Reardon, 2007.
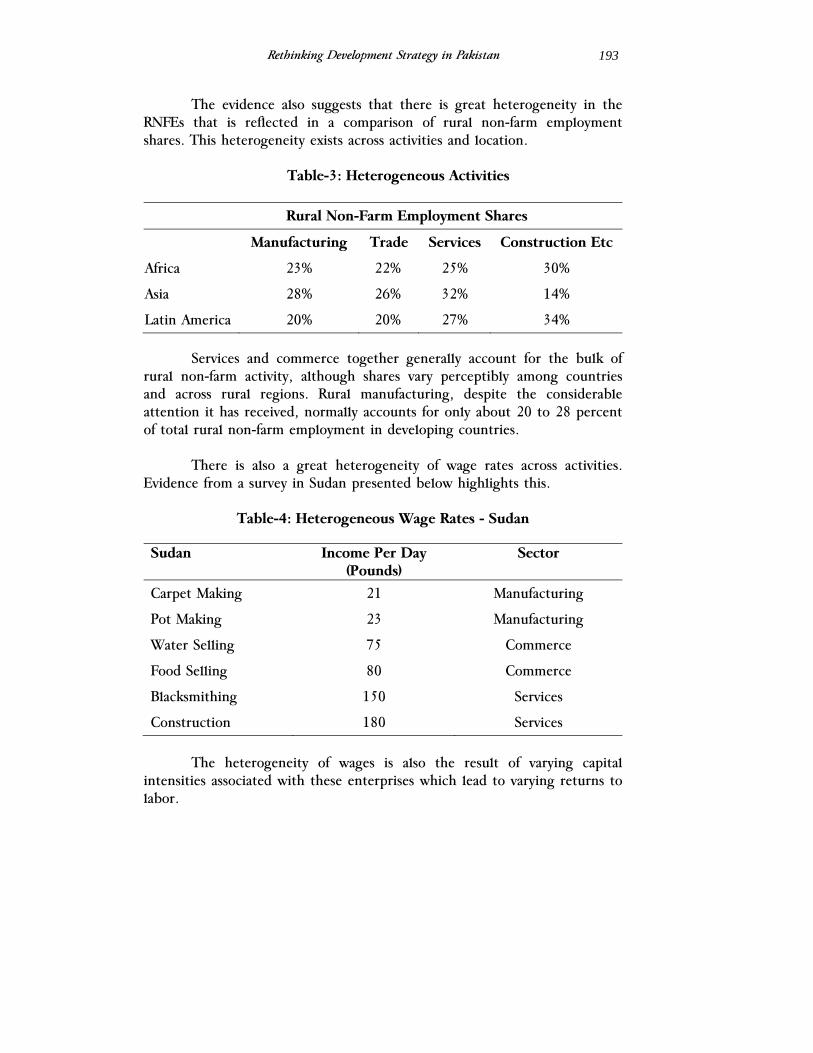
Rethinking Development Strategy in Pakistan
193
The evidence also suggests that there is great heterogeneity in the RNFEs that is reflected in a comparison of rural non-farm employment shares. This heterogeneity exists across activities and location.
Table-3: Heterogeneous Activities
Rural Non-Farm Employment Shares
Manufacturing Trade Services Construction Etc
Africa 23% 22% 25% 30%
Asia 28% 26% 32% 14%
Latin America 20% 20% 27% 34%
Services and commerce together generally account for the bulk of rural non-farm activity, although shares vary perceptibly among countries and across rural regions. Rural manufacturing, despite the considerable attention it has received, normally accounts for only about 20 to 28 percent of total rural non-farm employment in developing countries.
There is also a great heterogeneity of wage rates across activities.
Evidence from a survey in Sudan presented below highlights this.
Table-4: Heterogeneous Wage Rates - Sudan
Sudan Income Per Day (Pounds)
Sector
Carpet Making 21 Manufacturing
Pot Making 23 Manufacturing
Water Selling 75 Commerce
Food Selling 80 Commerce
Blacksmithing 150 Services
Construction 180 Services
The heterogeneity of wages is also the result of varying capital
intensities associated with these enterprises which lead to varying returns to labor.

Sohail Jehangir Malik
194
Table-5: Heterogeneity in Capital Intensities and Returns to Labor -Bangladesh
Activity K/Worker (Tk) VA/Worker (Tk/day) Female Workers
Tailoring 5,000 28 20%
Carpentry 3,010 20 4%
Handloom 1,600 15 38%
Pottery 800 12 47%
Paddy husking 300 7 56%
Bamboo products 310 5 49%
Coir rope 145 4 64%
This inherent heterogeneity highlights quite conclusively the need for more disaggregated and detailed analyses of the RNFE and a move away from the one size fits all approach to policy making. For Pakistan, it highlights the need for more scientific research based policymaking. This is especially so since the equity impact of the rural non-farm economy varies since the poor dominate certain segments and the rich dominate others. Available estimates indicate that non-farm incomes are equity enhancing in some countries, neutral in others and inequitable in still others.
Table-6: The Estimated Equity Impact of Non-Farm Incomes
Rural Non-Farm Income as Share of Total
Equity Enhancing Neutral Inequitable
Kenya Pakistan India Ethiopia Ecuador Vietnam
Poorest 82 75 32 32 22 40
Middle 45 36 38 30 37 50
Richest 40 21 31 31 64 82
The evidence reported in the table above indicates that non-farm
incomes in Pakistan are currently equity enhancing. Obviously the equity impact depends upon the linkages of the rural
non-farm economy and the employment potential in each. The growth linkages of the rural non-farm economy run in both directions. These include:
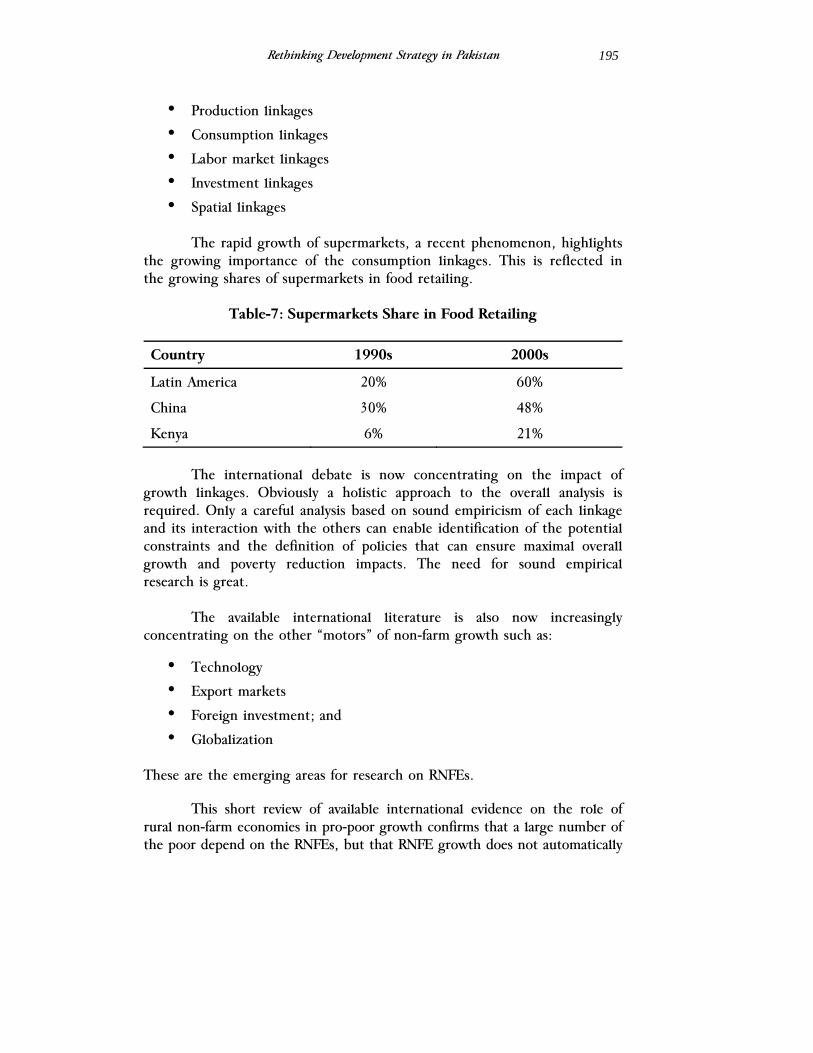
Rethinking Development Strategy in Pakistan
195
• Production linkages
• Consumption linkages
• Labor market linkages
• Investment linkages
• Spatial linkages The rapid growth of supermarkets, a recent phenomenon, highlights
the growing importance of the consumption linkages. This is reflected in the growing shares of supermarkets in food retailing.
Table-7: Supermarkets Share in Food Retailing
Country 1990s 2000s
Latin America 20% 60%
China 30% 48%
Kenya 6% 21%
The international debate is now concentrating on the impact of
growth linkages. Obviously a holistic approach to the overall analysis is required. Only a careful analysis based on sound empiricism of each linkage and its interaction with the others can enable identification of the potential constraints and the definition of policies that can ensure maximal overall growth and poverty reduction impacts. The need for sound empirical research is great.
The available international literature is also now increasingly
concentrating on the other “motors” of non-farm growth such as:
• Technology
• Export markets
• Foreign investment; and
• Globalization
These are the emerging areas for research on RNFEs.
This short review of available international evidence on the role of rural non-farm economies in pro-poor growth confirms that a large number of the poor depend on the RNFEs, but that RNFE growth does not automatically
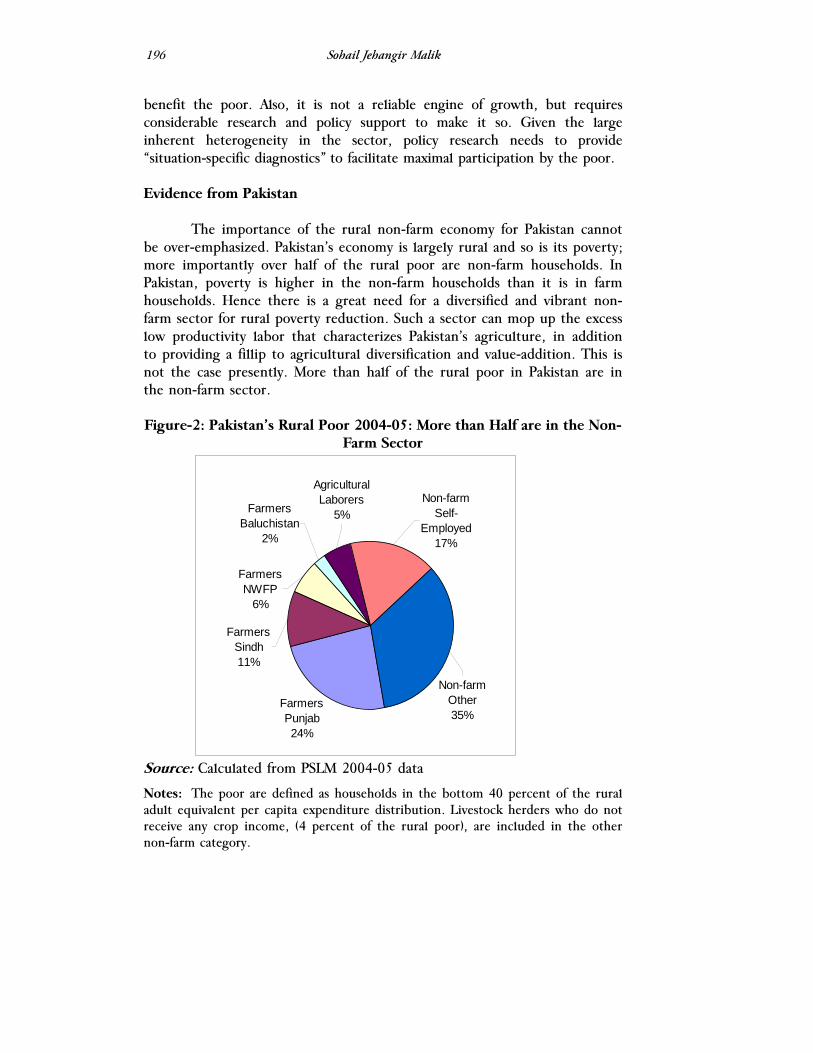
Sohail Jehangir Malik
196
benefit the poor. Also, it is not a reliable engine of growth, but requires considerable research and policy support to make it so. Given the large inherent heterogeneity in the sector, policy research needs to provide “situation-specific diagnostics” to facilitate maximal participation by the poor.
Evidence from Pakistan
The importance of the rural non-farm economy for Pakistan cannot
be over-emphasized. Pakistan’s economy is largely rural and so is its poverty; more importantly over half of the rural poor are non-farm households. In Pakistan, poverty is higher in the non-farm households than it is in farm households. Hence there is a great need for a diversified and vibrant non-farm sector for rural poverty reduction. Such a sector can mop up the excess low productivity labor that characterizes Pakistan’s agriculture, in addition to providing a fillip to agricultural diversification and value-addition. This is not the case presently. More than half of the rural poor in Pakistan are in the non-farm sector. Figure-2: Pakistan’s Rural Poor 2004-05: More than Half are in the Non-
Farm Sector
Non-farm Other35%
Non-farm Self-
Employed17%
Farmers NWFP
6%
Farmers Sindh11%
Farmers Punjab24%
Farmers Baluchistan
2%
Agricultural Laborers
5%
Source: Calculated from PSLM 2004-05 data
Notes: The poor are defined as households in the bottom 40 percent of the rural adult equivalent per capita expenditure distribution. Livestock herders who do not receive any crop income, (4 percent of the rural poor), are included in the other non-farm category.
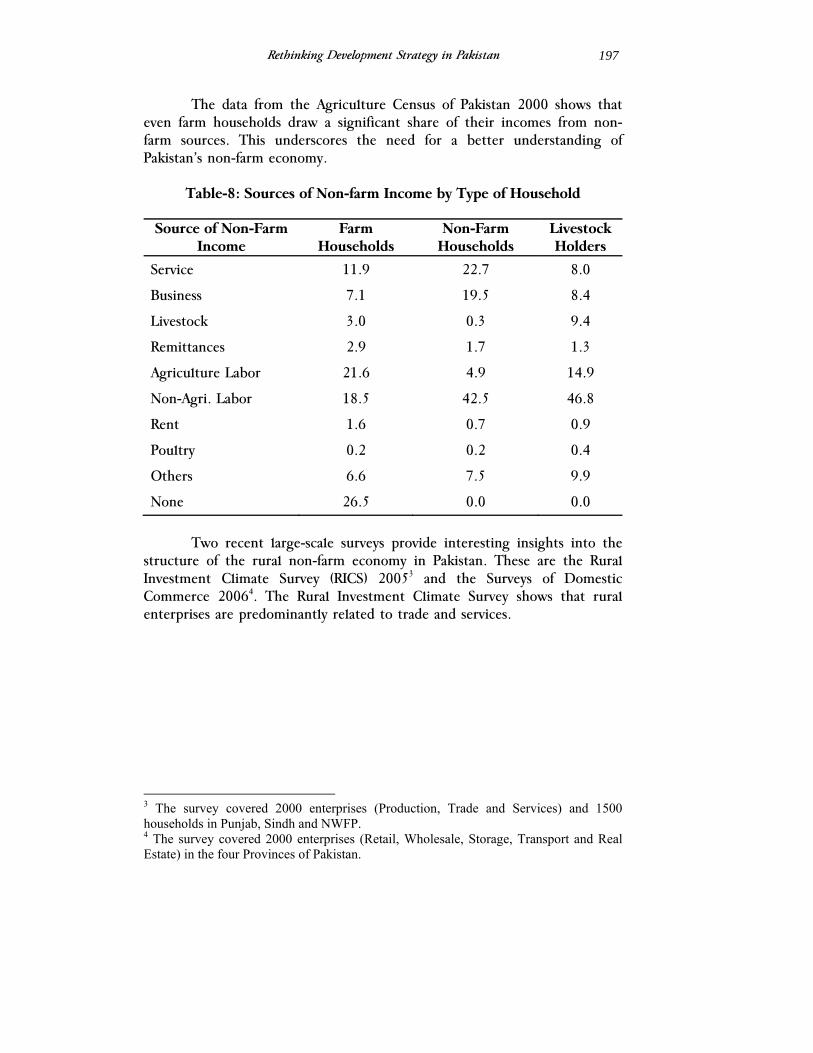
Rethinking Development Strategy in Pakistan
197
The data from the Agriculture Census of Pakistan 2000 shows that even farm households draw a significant share of their incomes from non-farm sources. This underscores the need for a better understanding of Pakistan’s non-farm economy.
Table-8: Sources of Non-farm Income by Type of Household
Source of Non-Farm Income
Farm Households
Non-Farm Households
Livestock Holders
Service 11.9 22.7 8.0
Business 7.1 19.5 8.4
Livestock 3.0 0.3 9.4
Remittances 2.9 1.7 1.3
Agriculture Labor 21.6 4.9 14.9
Non-Agri. Labor 18.5 42.5 46.8
Rent 1.6 0.7 0.9
Poultry 0.2 0.2 0.4
Others 6.6 7.5 9.9
None 26.5 0.0 0.0
Two recent large-scale surveys provide interesting insights into the
structure of the rural non-farm economy in Pakistan. These are the Rural Investment Climate Survey (RICS) 20053 and the Surveys of Domestic Commerce 20064. The Rural Investment Climate Survey shows that rural enterprises are predominantly related to trade and services.
3 The survey covered 2000 enterprises (Production, Trade and Services) and 1500 households in Punjab, Sindh and NWFP. 4 The survey covered 2000 enterprises (Retail, Wholesale, Storage, Transport and Real Estate) in the four Provinces of Pakistan.

1
F
S
seprlelitinofeqanas
A
N
N
A
S
S
S
98
Figure-3: Dis
Source: Rural Produ
ervices for 40roduction iness than the terature in tn terms of asf the enterpquipped to pnd poverty ressociated wit
Tab
Average No.
No. of Famil
No. of Hired
Average Age
Stand-Alone
Share of Firm
Sole Propriet
0
10
20
30
40
50
60
Perc
enta
ge
stribution of
l Pakistan Inv
ction enterp0 percent ann the total nshare of pro
the previous sset size, emrises presentprovide the ceducing roleh globalizati
ble-9: Profile
of Workers
ly Workers
d Workers
(Years)
Businesses (
ms Registered
torships (%)
Urban
12
44
Sohail Jeha
f Enterprisein Punja
vestment Cli
rises accountd trade for tnumber of eoduction repsection. Rur
mployment levted in the Tcatalytic grow required froon.
e of Rural E
(%)
d (%)
9
44
Production
angir Malik
s by Type foab, 2005
mate Survey
t for only 10the remainingenterprises isorted from tral enterprisevels and busi
Tables 9 to 1wth enhancinom the RNFE
Enterprises in
Rural S
1.97
1.29
0.68
9.17
94%
28%
95%
Rural
9
35
56
Service Trade
or Rural and
– World Ban
0 percent of ag 50 percents quite smallthe review oes are generainess turnove13 reveals thng, employmE or to cope
n Pakistan 2
mall Town
2.05
1.37
0.68
9.03
67%
20%
94%
Overall
10
40
e
d Small Town
nk 2005
all enterpriset. The share l and is muof internationally quite smaer. The profihat they are ent generatinwith the ris
2005
Total
2.01
1.33
0.68
9.10
80%
24%
94%
50
ns
es, of ch nal all file ill ng sks
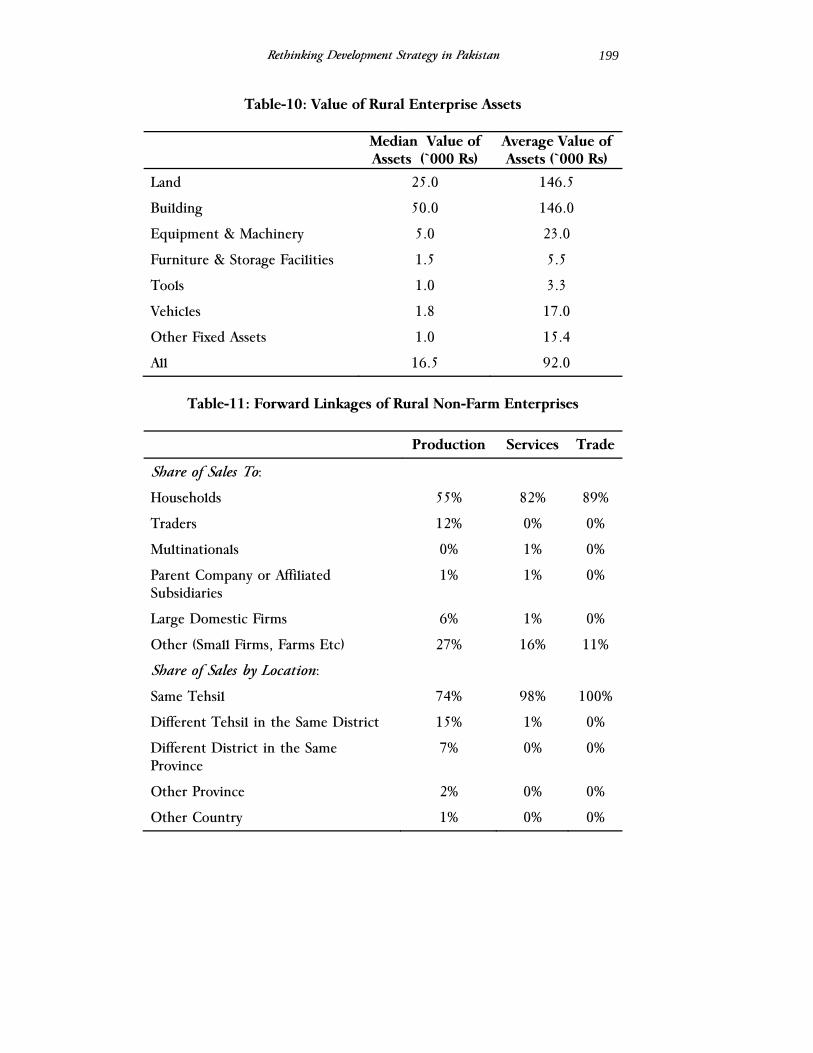
Rethinking Development Strategy in Pakistan
199
Table-10: Value of Rural Enterprise Assets
Median Value of Assets (`000 Rs)
Average Value of Assets (`000 Rs)
Land 25.0 146.5
Building 50.0 146.0
Equipment & Machinery 5.0 23.0
Furniture & Storage Facilities 1.5 5.5
Tools 1.0 3.3
Vehicles 1.8 17.0
Other Fixed Assets 1.0 15.4
All 16.5 92.0
Table-11: Forward Linkages of Rural Non-Farm Enterprises
Production Services Trade
Share of Sales To:
Households 55% 82% 89%
Traders 12% 0% 0%
Multinationals 0% 1% 0%
Parent Company or Affiliated Subsidiaries
1% 1% 0%
Large Domestic Firms 6% 1% 0%
Other (Small Firms, Farms Etc) 27% 16% 11%
Share of Sales by Location:
Same Tehsil 74% 98% 100%
Different Tehsil in the Same District 15% 1% 0%
Different District in the Same Province
7% 0% 0%
Other Province 2% 0% 0%
Other Country 1% 0% 0%

Sohail Jehangir Malik
200
Table-12: Backward Linkages of Rural Non-Farm Enterprises
Production Services Trade
Value of Inputs Originating From:
Households 6% 11% 3%
Traders 26%
Multinationals 0% 6% 8%
Parent Company or Affiliated Subsidiaries
3% 1% 2%
Large Domestic Firms 14% 12% 11%
Other (Small Firms, Farms Etc) 51% 69% 77%
Value of Inputs Originating From:
Same Tehsil 31% 22% 16%
Different Tehsil in the Same District 22% 16% 20%
Different District in the Same Province 31% 49% 47%
Other Province 10% 9% 11%
Other Country 6% 4% 5%
Table-13: Percent Using Some Form of Modern Practice/Service
Service Retail Wholesale Storage Transport Total
Engineering 13.4 11.8 33.2 42.4 16.7
Management 3.9 7.2 21.4 8.1 7.0
Marketing 15.5 21.0 26.5 23.2 18.7
Accounting 6.7 8.2 25.5 6.1 9.1
Legal 5.4 9.6 21.9 25.3 9.5
Insurance 3.6 3.4 12.2 21.2 5.5
Information Technology 5.1 5.2 15.3 2.0 6.1
While the relatively small number of production enterprises in
Pakistan is a cause for concern, it also highlights the missed potential for value-addition. Of particular concern, however, is the relative absence of
Rethinking Development Strategy in Pakistan
201
essential services so necessary for competing in the globalized environment. These is evident not only from the small number of enterprises reporting use of modern business services such as accounting and insurance, but also from the absence of the essential agricultural support services necessary to spur the low productivity agricultural activities required for agriculture to play its role as a driver of growth in the entire RNFE.
The surveys highlight several characteristics of the rural non-farm
economy of Pakistan that are indicative of the constraints to its potential for growth and poverty reduction. These include:
1. Small Size of Enterprises – lack of collateral and high moral hazard
2. Predominantly Sole proprietorship – unregistered and stand alone
3. Primitive business practices and attitudes
4. Lack of standards and quality in all aspects of transactions
5. Limited Information Flow
6. Low human capital - Inability to Assess Market -Inability to grow
7. Limited Forward and Backward Linkages outside of Geographic Area
8. Lack of Access to Finance
9. Lack of Contracts and Enforcement These characteristics signify the constraints to the development of
domestic commerce. “Domestic commerce is the most pro-poor growth possibility in the country. Currently, it employs about 40 percent of the labor force and contributes about 52 percent to GDP. If it can be provided with an enabling environment, our estimates suggest that it could help increase the growth rate by at least 2 percentage points. In addition, a pick up of activity in this area would increase in construction activity, strong development in hotelling, retail shops, transport, warehousing, storage, and other service industries. The employment impact of this would be far larger than through investment in any other sector” [Nadeem Ul Haque5 quoted in the Daily Nation August 2, 2006].
5 Nadeem Ul Haque first conceived of the idea of domestic commerce in Pakistan and the work that ensued emanates largely from his intellectual leadership.
Sohail Jehangir Malik
202
Rethinking Development Policy – The Road Ahead for Pakistan Proper development of the RNFE requires a vitalized and facilitating
role for institutions6 that govern agriculture, the rural factor markets especially land, domestic commerce and international trade and the inter-linkages between these. The rethinking of development strategy in Pakistan needs to be based on sound empirical research into the entire institutional environment. The role of government particularly needs to be re-examined and steps taken to ensure that such a role is facilitating and not constraining and distortionary. The government’s role should be focused clearly on maximizing the growth and employment generation potential of the rural non-farm economy. Only then will sustained poverty reduction take place. Moreover, such a rethinking should ensure competitiveness in the global environment. This is not an easy task given the prevailing inefficiencies in the system and the low levels of development of the essential elements of the RNFE.
Most of the barriers relating to the underdevelopment of rural
enterprise in Pakistan relate to the absence or inefficiency of institutions7. The institutional set up, which was the responsibility of the public sector, failed to deliver the goods and resulted in inefficient and mismatched systems. These in turn distorted the markets and constrained the development of the rural non-farm sector. The easy, smooth and equitable functioning of a market can be facilitated through supporting institutional mechanisms. For instance, legal and judicial institutions which eliminate the possibility of fraud or cheating and permit the enforcement of contracts coupled with a strong infrastructure will help to promote economic activity by reducing transaction costs. Similarly supportive legal, regulatory and
6 The WDR (2002) terms institutions more generally as “the rules and organizations including informal norms that coordinate human behavior”. Development experts are now increasingly taking a more institutional view of development policies. See for example the statement of the Nobel Laureate Douglass C. North that 'Neoclassical theory is simply an inappropriate tool to analyze and prescribe policies that will induce development' (p. 359) North, D. (1994), 'Economic Performance through Time', American Economic Review, 84. In Pakistan this view has been forcefully put forward in the work of Syed Akmal Hussain in recent years.. 7 Institutional failures can be classified into administrative or market related. Administrative failures arise due to the inefficiency of the bodies that are responsible for providing the facilities or services, which they have been established for. Market failures occur when a market fails to operate efficiently or does not exist at all. Such failures create an unjust distribution of resources within the population. However, market regulation through an institutional framework can only be successful if the institutional setup itself is impartial and unbiased and if the laws and rules formed by these institutions are applicable to everyone.
Rethinking Development Strategy in Pakistan
203
political institutions can further the development of RNFEs. Increasing competition in the world market requires institutions for quality control, capacity building, research and development, etc. as well as for information flow, reducing disputes, defining property rights and contracts, and increasing healthy competition in markets.
While highlighting the need of various institutional setups in
promoting the non-farm economy it is necessary to bear in mind that one institution cannot function in isolation and needs to be complemented by other institutions. Institutions for the non-farm economy require well functioning institutions in the farm sector. Similarly, a well-established credit institution, for instance, shall fail to work without an expansive information network; and, an illiterate and unskilled population shall not be able to reap the benefit of the latest technology and innovations and increased information without the ability to comprehend these. Re-thinking development, therefore, requires re-thinking the entire institutional architecture.
Sohail Jehangir Malik
204
References
Government of Pakistan (GoP), 2006, Household Integrated Economic Survey 2004-05. Federal Bureau of Statistics, Islamabad.
Government of Pakistan, 2006, Labour Force Survey 2005-06. Federal
Bureau of Statistics, Islamabad. Government of Pakistan, 2006, Pakistan Economic Survey 2005-06.
Islamabad: Finance Division, Economic Adviser’s Wing. Haggblade, Steven, Peter B. R. Hazell, and Thomas Reardon, 2007,
Transforming the Rural Nonfarm Economy Opportunities and Threats in the Developing World. Johns Hopkins University Press: Baltimore.
Haque, Nadeem Ul, 2006, The Daily Nation August 2, 2006 Innovative Development Strategies, 2005, Rural Investment Climate Survey
2005. Innovative Development Strategies, Islamabad and The World Bank, Washington D.C.
Innovative Development Strategies, 2006, Surveys of Domestic Commerce
2006. Innovative Development Strategies and Government of Pakistan.
World Bank, 2002, The World Development Report 2002. The World Bank,
Washington D. C.
The Lahore Journal of Economics Special Edition (September 2008): pp. 205-220
Trends in Regional Inequalities in Pakistan:
Evidence Since 1998
Sajjad Akhtar*
Abstract
Periodic research and documentation of the extent and nature of inter-regional and intra-regional inequalities is a pre-requisite for formulating cost effective interventions for the promotion of spatially balanced and sustainable development. These interventions can be in the shape of increased fiscal resource transfers and/or fiscal incentives to the private sector for promoting investments in lagging regions. The analysis of inter-regional and intra-regional consumption and non-consumption inequalities in this paper are a preliminary attempt at assessing their status.
JEL Classification: D31, E21
Keywords: Pakistan, Inequality, Consumption, Social Indicator
Introduction
In Pakistan, serious academic research and debate on regional economic and non-economic performance has lagged behind other topics partly because of its structure and division at the sub-national level. The province of Punjab roughly contains 50 percent of the population and the rest of 3 provinces, i.e., Sindh, North West Frontier Province (NWFP) and Baluchistan, the remaining 50 percent population, which has generated an inherent concentration in terms of political representation and translated into a “smaller provinces versus the bigger province” syndrome. The protection of ‘inverted pyramid’ social and economic interests has not only discouraged the timely release of quantity and quality of data from the Federal statistical agencies, but the quality of data generated by statistical departments at the regional level has also been called into question. Consequently under perceived ‘political expediency’ and in the interest of bridging the ‘provincial and north-south divide’ the research into regional inequities is generally
* Director of Center for Research on Poverty Reduction and Income Distribution, Planning Commission, Pakistan.

Sajjad Akhtar
206
discouraged and whatever is published (mostly in foreign journals) is mostly looked upon as politically motivated to further the interests of a particular province or region. Viewed against this backdrop, this empirical research hopes to make a modest contribution towards an understanding of the regional inequalities during the last decade.
Interregional inequalities can be traced to a complex set of historical and geographical factors, which can be labeled as “structural”. As discussed in the World Development Report (WDR) 2006, “Weak resource endowments and distance from markets can constrain development in lagging regions. In many cases, economic differences are linked with long-standing, unequal relations of power between advantaged and lagging regions, and institutional weaknesses within the latter.” Concentration of disadvantaged ethnic, racial, and social groups in particular regions cause group-based inequities and then lead to regional inequalities. In poor regions, where regional elites hijack power, decentralization may also deepen both intra- and inter-regional inequalities.
As a first step, balanced and sustainable development entails that attempts at the policy, planning and implementation level be geared towards minimizing the economic and social/human capital inequalities between the backward and more developed regions of the country. Pakistan, in spite of being a middle income country, shows considerable variation in development across sub-national levels. Two of its provinces i.e., Baluchistan and NWFP, are relatively less developed than Punjab and Sindh. Within Punjab, southern Punjab lags behind its northern part in socio-economic development. Within Sindh, rural-urban divide in development is more visible than in the case of Punjab. A limitation of interregional analysis using provinces as units is the fact that this may not be able to capture the significant intra-province disparities in economic and social development. After discussing inter-provincial disparities, we briefly analyze intra-Punjab disparities in social indicators between 1998 and 2005.
Inter-Provincial and Interregional Poverty Differentials
The spatial equilibrium school which has much in common with neo-classical theory claims that regional inequality is a ‘temporary phenomenon”. Over time, economic growth of different regions will converge. The “divergence” hypothesis holds that spatial distribution of economic development leans towards inequality and that market forces tend to increase regional inequality rather than decrease it. Thus, only public intervention is capable of reducing regional inequality. Empirically it may be

Regional Inequalities in Pakistan: Evidence Since 1998
207
difficult to separate these two phenomena, as most countries continue to intervene to develop the lagging regions.
In the absence of good quality and long-term data on economic growth rates for the 4 provinces of Pakistan, we rely on the outcome variables i.e., poverty levels and consumption inequalities for the last few years, to undertake a stylized assessment of the convergence or divergence hypothesis. Table-1 gives the poverty headcount based on consumption welfare for the years 98-99, 00-01 and 04-05 for Pakistan and for the provinces by rural/urban classification. As the government is still reluctant to release provincial poverty headcounts for the year 04-05, consistent estimates of the World Bank are reproduced here for the provinces for all the 3 years. While the percentage of poor have fallen from 31.1 percent in 98-99 to 23.9 percent in 2004-05, after rising marginally to 34.5 in 2000-01, the same trend is observed in the gap between urban and rural poverty at the national level. The difference between the rural and urban headcount fell to 13.2 percentage points in 2004-05 from 13.6 in 1998-99 after rising to 16.6 in 00-01. Assuming that the years 00-01 and 04-05 were both extreme points with regard to growth rates and agriculture performance, one can say very little about convergence or divergence on the basis of the single normal year of 98-99. Preliminary analysis of the 2005-06 data suggests a renewed widening of the rural-urban gap in headcounts at the national level.
Table-1: National and Provincial Trends in Headcount by Urban/Rural
1998-99 2000-01 2004-05
U R T U R T U R T
Pakistan 21.4 35.1 31.1 22.7 39.3 34.5 14.9 28.1 23.9
Punjab 23.70 32.20 29.80 23.00 33.80 30.70 21.20 33.4 29.5
Sindh 15.30 34.50 26.20 20.70 48.30 37.50 13.80 28.9 22.4
N.W.F.P 26.10 43.30 40.80 30.00 44.40 42.30 26.10 41.9 39.3
Baluchistan 25.20 21.60 22.10 27.40 39.30 37.20 21.50 35.8 32.9
Source: Author’s Calculation Before analyzing the provincial poverty trends, a caveat is in order for the province of Balochistan. Given its vast physical area and just 5 percent of total population, the sampling errors are likely to be greater than other provinces, even though the provincial sample is representative. The
Sajjad Akhtar
208
impressive growth in Punjab’s GDP since FY02-03, ranging from 5.8 percent in 02-03 to 9.35 percent in 04-05, as per estimates of its Bureau of Statistics, is reflected in estimates of poverty headcount. Its poverty headcount improved by approximately 8 percentage points from 32.2 percent in 00-01 to 24.3 percent in 04-05. A significant decline occurred in the province of Sindh where overall poverty nearly halved from 35.3 percent in 00-01 to 18.3 in 04-051.The next highest fall of 9.2 percentage points occurred in NWFP in line with the national decline. The provincial profile of poverty headcounts indicate that NWFP consistently has the highest number of people living below the poverty line. The ratio of the NWFP headcount and the province with lowest headcount fluctuated between 1.91 - 1.28, with no narrowing of the gap. The urban-rural gap in headcounts is the widest in the province of Sindh, where the rural headcount is almost twice that of those prevailing in urban areas. The poverty headcount differentials between NWFP and Balochistan continued to narrow during the period. Inter and Intra-Provincial Consumption Disparities
In Table-2, we give the national trends in consumption based Gini coefficients for the four years. Although disparities in consumption are lower than income based disparities, they have risen consistently since 00-01. At 0.3018 in 05-06, they are now at the same level as they were in 98-99. The provincial Ginis are given as a multiple of the national Gini coefficient. Consumption disparities in the province of Sindh and Punjab remain higher than the national ones in most of the years, with no discernible narrowing over the years under observation. Although consumption within NWFP and Baluchistan is more equal than within Pakistan, there is a tendency of ‘catching up’ or ‘emulating’ the national disparities in both provinces in recent years as compared to 98-99 and 00-01. Moreover, it is observed that disparities tend to narrow in times of poor economic growth and widen in times of above average economic performance. This relationship between consumption disparities, and specifically agricultural output, is understandable given the existence of a large number of subsistence farmers in the country and because a majority of the population remains close to the poverty line.
1 Using a different methodology to calculate the poverty headcount, World Bank estimates also show wide fluctuations for Sindh during the period. For overall Sindh their estimates are: 26.2% (1998-99), 37.5 % (2000-01) and 22.4% (2004-05).
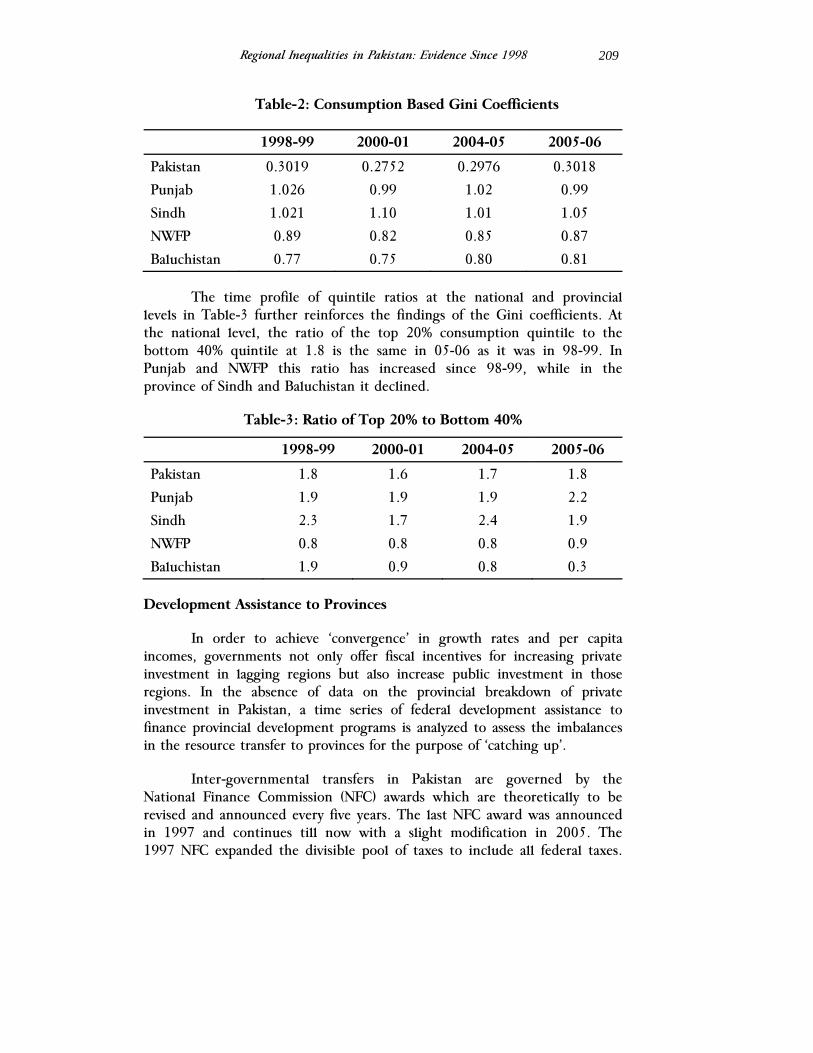
Regional Inequalities in Pakistan: Evidence Since 1998
209
Table-2: Consumption Based Gini Coefficients
1998-99 2000-01 2004-05 2005-06
Pakistan 0.3019 0.2752 0.2976 0.3018
Punjab 1.026 0.99 1.02 0.99
Sindh 1.021 1.10 1.01 1.05
NWFP 0.89 0.82 0.85 0.87
Baluchistan 0.77 0.75 0.80 0.81
The time profile of quintile ratios at the national and provincial levels in Table-3 further reinforces the findings of the Gini coefficients. At the national level, the ratio of the top 20% consumption quintile to the bottom 40% quintile at 1.8 is the same in 05-06 as it was in 98-99. In Punjab and NWFP this ratio has increased since 98-99, while in the province of Sindh and Baluchistan it declined.
Table-3: Ratio of Top 20% to Bottom 40%
1998-99 2000-01 2004-05 2005-06
Pakistan 1.8 1.6 1.7 1.8
Punjab 1.9 1.9 1.9 2.2
Sindh 2.3 1.7 2.4 1.9
NWFP 0.8 0.8 0.8 0.9
Baluchistan 1.9 0.9 0.8 0.3
Development Assistance to Provinces
In order to achieve ‘convergence’ in growth rates and per capita incomes, governments not only offer fiscal incentives for increasing private investment in lagging regions but also increase public investment in those regions. In the absence of data on the provincial breakdown of private investment in Pakistan, a time series of federal development assistance to finance provincial development programs is analyzed to assess the imbalances in the resource transfer to provinces for the purpose of ‘catching up’.
Inter-governmental transfers in Pakistan are governed by the National Finance Commission (NFC) awards which are theoretically to be revised and announced every five years. The last NFC award was announced in 1997 and continues till now with a slight modification in 2005. The 1997 NFC expanded the divisible pool of taxes to include all federal taxes.
Sajjad Akhtar
210
Prior to this, according to the 1991 NFC award, only revenues from the income tax, sales tax and excise duties on sugar, tobacco and tobacco manufactures were shared with the provinces. However, the expansion in the pool was accompanied by a contraction in the overall provincial share from 80 percent to 37.5%. Also, in recognition of relative backwardness and lack of taxable capacity, the NFC award of 1997 greatly increased the quantum of special grants to Baluchistan and NWFP. The divisible pool is shared on the basis of the population share of each province. Though resource transfers to provinces are theoretically governed by NFC awards, the federal assistance to development programs that are meant to increase the economic and social infrastructure of the provinces is not only sensitive to revenues of the Federal government but also to foreign project assistance.
Table-4 gives the shares of provinces in the Federal assistance towards provincial development expenditure from 96-97 to 06-07. Only in 03-04, the assistance to Punjab comes close to its population share of 55 percent. The lagging provinces, i.e., NWFP and Baluchistan have consistently received higher shares than their population share in the shape of grants from the Federal government, partly offsetting the interest of private investors, and in case of Baluchistan unit cost of investment in the social sector are higher due to the spread of 5% population over a very large area. Sindh’s share in assistance has been fluctuating around its population share for 6 out of 11 years. The share trends for each province indicate that variability is the highest for Sindh ranging from 8.5% in 01-02 to 35.6 percent in 96-97 followed by Baluchistan.
Development assistance by the federal government to provinces is closely linked with foreign project assistance and is thus partly a function of economic and non-economic interests (temporary as well permanent) of development partners in the development of each province. Table-5 shows that foreign project assistance in any year did not fall below 50% of the federal assistance. For 7 out of 11 years, the foreign project assistance hovered above 85 percent. Fortunately, the share pattern of foreign project assistance to the provinces closely mirrors the shares in Table-4, and is not sensitive to falls in foreign development aid.
Table-6 gives the federal assistance in terms of per capita population of the provinces. At the national level, the per capita development assistance fluctuated between Rs.86 to Rs.215 during the 11 years. Punjab’s per capita receipt is consistently below the national average while that of NWFP and Baluchistan has been at roughly twice of the national per capita receipt during the eleven years.
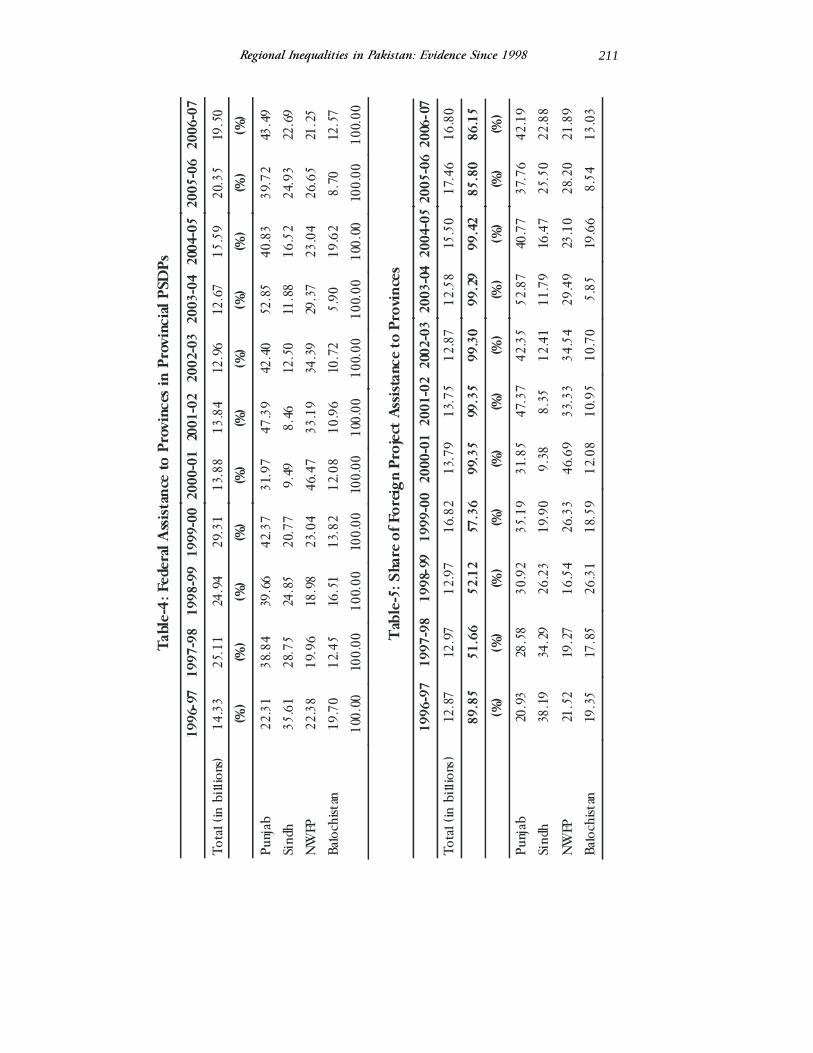
Regional Inequalities in Pakistan: Evidence Since 1998
211
Tabl
e-4:
Fed
eral
Ass
ista
nce
to P
rovi
nces
in P
rovi
ncia
l PSD
Ps
1996
-97
1997
-98
1998
-99
1999
-00
2000
-01
2001
-02
2002
-03
2003
-04
2004
-05
2005
-06
2006
-07
Tota
l (in
bill
ions
)14
.33
25.1
124
.94
29.3
113
.88
13.8
412
.96
12.6
715
.59
20.3
519
.50
(%)
(%)
(%)
(%)
(%)
(%)
(%)
(%)
(%)
(%)
(%)
Punj
ab22
.31
38.8
439
.66
42.3
731
.97
47.3
942
.40
52.8
540
.83
39.7
243
.49
Sind
h35
.61
28.7
524
.85
20.7
79.
498.
4612
.50
11.8
816
.52
24.9
322
.69
NW
FP22
.38
19.9
618
.98
23.0
446
.47
33.1
934
.39
29.3
723
.04
26.6
521
.25
Balo
chist
an19
.70
12.4
516
.51
13.8
212
.08
10.9
610
.72
5.90
19.6
28.
7012
.57
100.
0010
0.00
100.
0010
0.00
100.
0010
0.00
100.
0010
0.00
100.
0010
0.00
100.
00
Tab
le-5
: Sha
re o
f For
eign
Pro
ject
Ass
ista
nce
to P
rovi
nces
1996
-97
1997
-98
1998
-99
1999
-00
2000
-01
2001
-02
2002
-03
2003
-04
2004
-05
2005
-06
2006
-07
Tota
l (in
bill
ions
)12
.87
12.9
712
.97
16.8
213
.79
13.7
512
.87
12.5
815
.50
17.4
616
.80
89.8
551
.66
52.1
257
.36
99.3
599
.35
99.3
099
.29
99.4
285
.80
86.1
5
(%)
(%)
(%)
(%)
(%)
(%)
(%)
(%)
(%)
(%)
(%)
Punj
ab20
.93
28.5
830
.92
35.1
931
.85
47.3
742
.35
52.8
740
.77
37.7
642
.19
Sind
h38
.19
34.2
926
.23
19.9
09.
388.
3512
.41
11.7
916
.47
25.5
022
.88
NW
FP21
.52
19.2
716
.54
26.3
346
.69
33.3
334
.54
29.4
923
.10
28.2
021
.89
Balo
chist
an19
.35
17.8
526
.31
18.5
912
.08
10.9
510
.70
5.85
19.6
68.
5413
.03
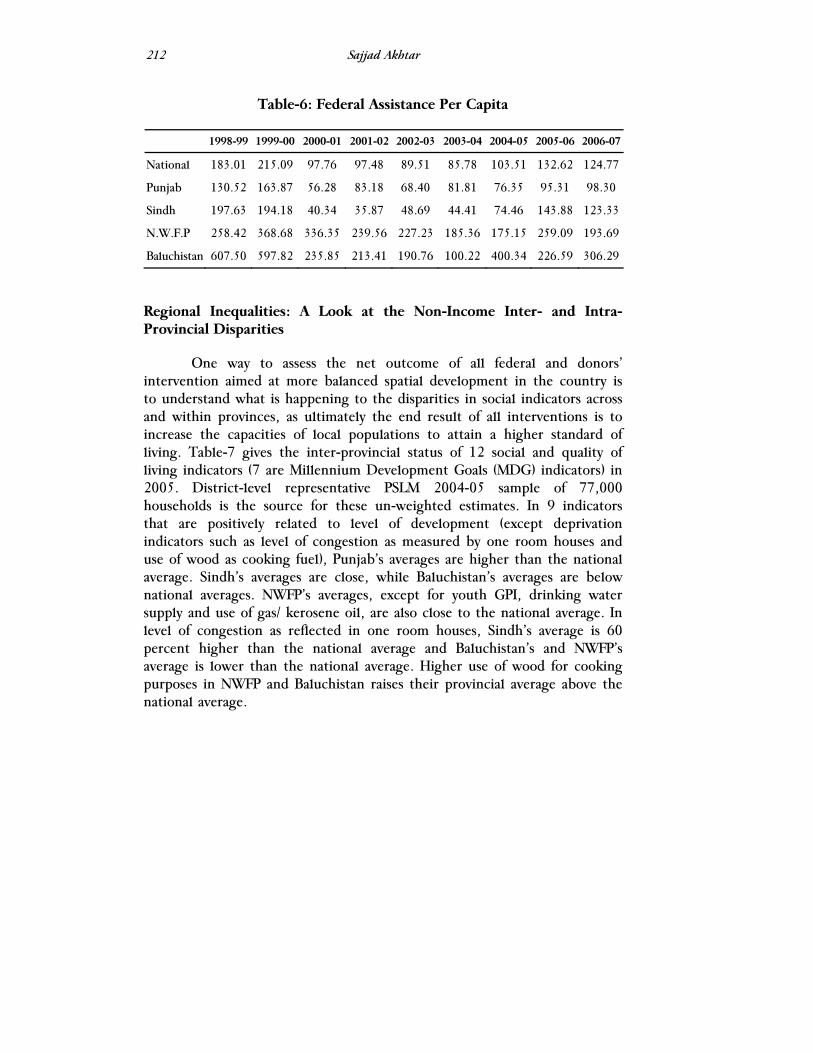
Sajjad Akhtar
212
Table-6: Federal Assistance Per Capita
1998-99 1999-00 2000-01 2001-02 2002-03 2003-04 2004-05 2005-06 2006-07
National 183.01 215.09 97.76 97.48 89.51 85.78 103.51 132.62 124.77
Punjab 130.52 163.87 56.28 83.18 68.40 81.81 76.35 95.31 98.30
Sindh 197.63 194.18 40.34 35.87 48.69 44.41 74.46 143.88 123.33
N.W.F.P 258.42 368.68 336.35 239.56 227.23 185.36 175.15 259.09 193.69
Baluchistan 607.50 597.82 235.85 213.41 190.76 100.22 400.34 226.59 306.29
Regional Inequalities: A Look at the Non-Income Inter- and Intra- Provincial Disparities
One way to assess the net outcome of all federal and donors’ intervention aimed at more balanced spatial development in the country is to understand what is happening to the disparities in social indicators across and within provinces, as ultimately the end result of all interventions is to increase the capacities of local populations to attain a higher standard of living. Table-7 gives the inter-provincial status of 12 social and quality of living indicators (7 are Millennium Development Goals (MDG) indicators) in 2005. District-level representative PSLM 2004-05 sample of 77,000 households is the source for these un-weighted estimates. In 9 indicators that are positively related to level of development (except deprivation indicators such as level of congestion as measured by one room houses and use of wood as cooking fuel), Punjab’s averages are higher than the national average. Sindh’s averages are close, while Baluchistan’s averages are below national averages. NWFP’s averages, except for youth GPI, drinking water supply and use of gas/ kerosene oil, are also close to the national average. In level of congestion as reflected in one room houses, Sindh’s average is 60 percent higher than the national average and Baluchistan’s and NWFP’s average is lower than the national average. Higher use of wood for cooking purposes in NWFP and Baluchistan raises their provincial average above the national average.
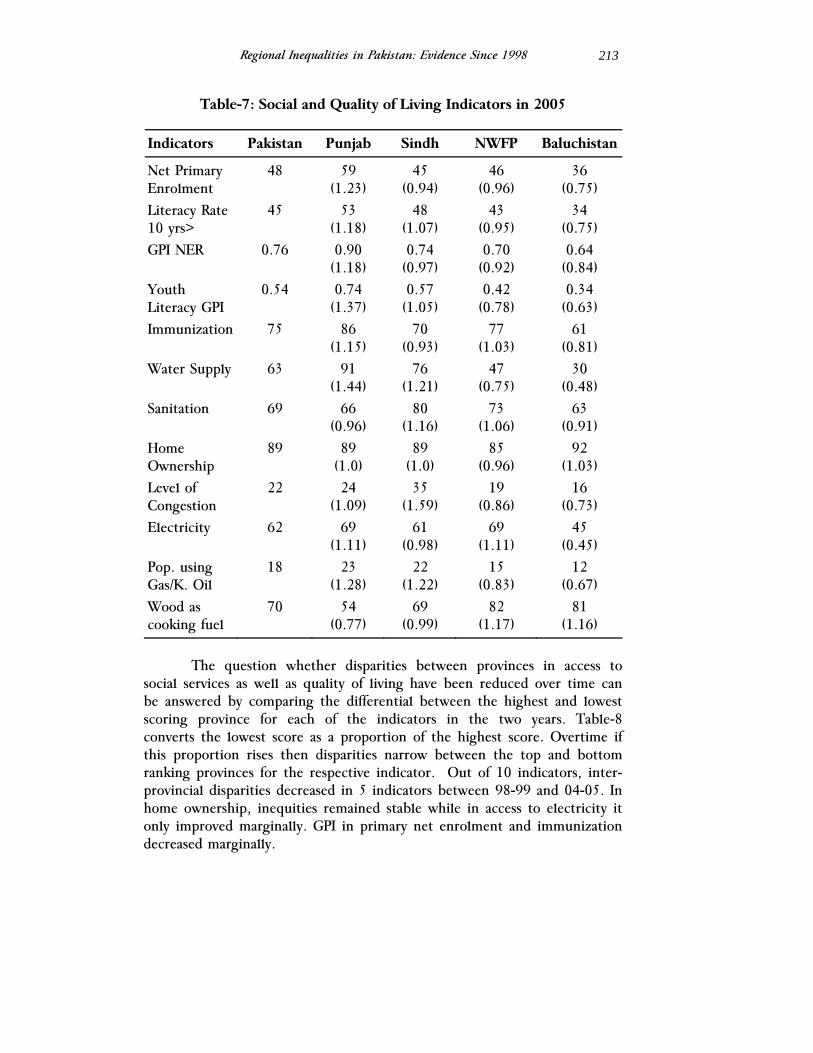
Regional Inequalities in Pakistan: Evidence Since 1998
213
Table-7: Social and Quality of Living Indicators in 2005
Indicators Pakistan Punjab Sindh NWFP Baluchistan
Net Primary Enrolment
48 59 (1.23)
45 (0.94)
46 (0.96)
36 (0.75)
Literacy Rate 10 yrs>
45 53 (1.18)
48 (1.07)
43 (0.95)
34 (0.75)
GPI NER 0.76 0.90 (1.18)
0.74 (0.97)
0.70 (0.92)
0.64 (0.84)
Youth Literacy GPI
0.54 0.74 (1.37)
0.57 (1.05)
0.42 (0.78)
0.34 (0.63)
Immunization 75 86 (1.15)
70 (0.93)
77 (1.03)
61 (0.81)
Water Supply 63
91 (1.44)
76 (1.21)
47 (0.75)
30 (0.48)
Sanitation 69 66 (0.96)
80 (1.16)
73 (1.06)
63 (0.91)
Home Ownership
89
89 (1.0)
89 (1.0)
85 (0.96)
92 (1.03)
Level of Congestion
22 24 (1.09)
35 (1.59)
19 (0.86)
16 (0.73)
Electricity 62 69 (1.11)
61 (0.98)
69 (1.11)
45 (0.45)
Pop. using Gas/K. Oil
18 23 (1.28)
22 (1.22)
15 (0.83)
12 (0.67)
Wood as cooking fuel
70 54 (0.77)
69 (0.99)
82 (1.17)
81 (1.16)
The question whether disparities between provinces in access to social services as well as quality of living have been reduced over time can be answered by comparing the differential between the highest and lowest scoring province for each of the indicators in the two years. Table-8 converts the lowest score as a proportion of the highest score. Overtime if this proportion rises then disparities narrow between the top and bottom ranking provinces for the respective indicator. Out of 10 indicators, inter-provincial disparities decreased in 5 indicators between 98-99 and 04-05. In home ownership, inequities remained stable while in access to electricity it only improved marginally. GPI in primary net enrolment and immunization decreased marginally.
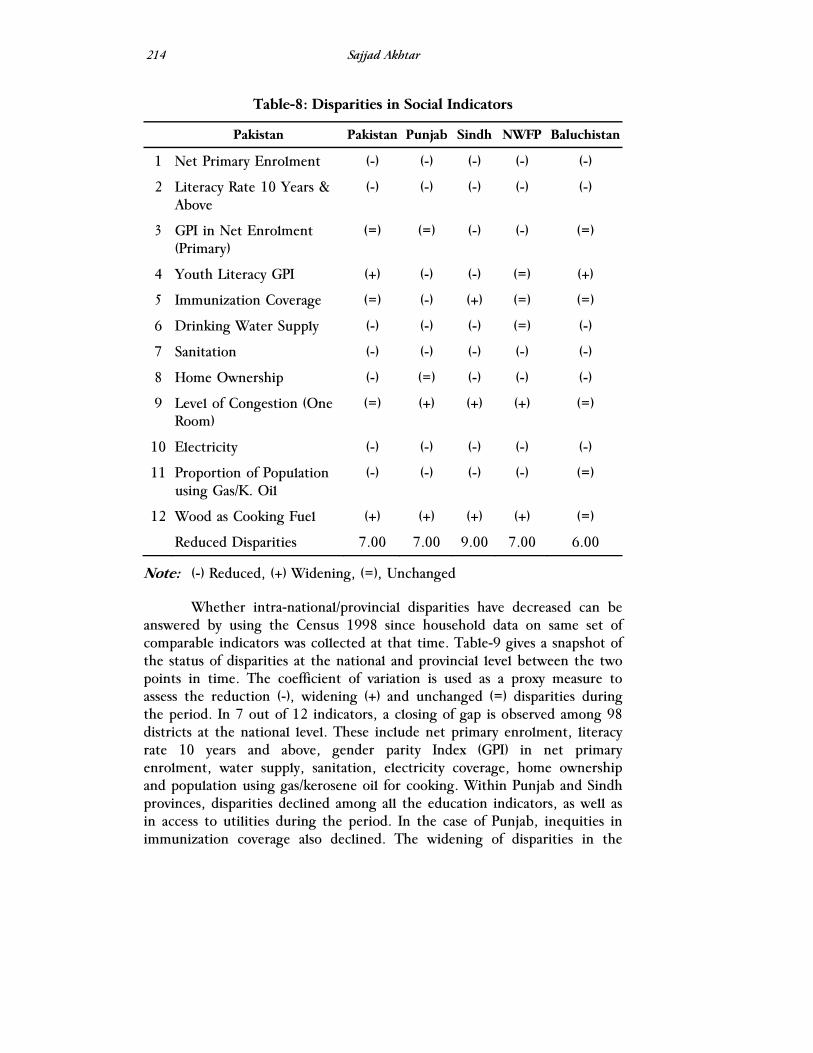
Sajjad Akhtar
214
Table-8: Disparities in Social Indicators
Pakistan Pakistan Punjab Sindh NWFP Baluchistan
1 Net Primary Enrolment (-) (-) (-) (-) (-)
2 Literacy Rate 10 Years & Above
(-) (-) (-) (-) (-)
3 GPI in Net Enrolment (Primary)
(=) (=) (-) (-) (=)
4 Youth Literacy GPI (+) (-) (-) (=) (+)
5 Immunization Coverage (=) (-) (+) (=) (=)
6 Drinking Water Supply (-) (-) (-) (=) (-)
7 Sanitation (-) (-) (-) (-) (-)
8 Home Ownership (-) (=) (-) (-) (-)
9 Level of Congestion (One Room)
(=) (+) (+) (+) (=)
10 Electricity (-) (-) (-) (-) (-)
11 Proportion of Population using Gas/K. Oil
(-) (-) (-) (-) (=)
12 Wood as Cooking Fuel (+) (+) (+) (+) (=)
Reduced Disparities 7.00 7.00 9.00 7.00 6.00
Note: (-) Reduced, (+) Widening, (=), Unchanged
Whether intra-national/provincial disparities have decreased can be answered by using the Census 1998 since household data on same set of comparable indicators was collected at that time. Table-9 gives a snapshot of the status of disparities at the national and provincial level between the two points in time. The coefficient of variation is used as a proxy measure to assess the reduction (-), widening (+) and unchanged (=) disparities during the period. In 7 out of 12 indicators, a closing of gap is observed among 98 districts at the national level. These include net primary enrolment, literacy rate 10 years and above, gender parity Index (GPI) in net primary enrolment, water supply, sanitation, electricity coverage, home ownership and population using gas/kerosene oil for cooking. Within Punjab and Sindh provinces, disparities declined among all the education indicators, as well as in access to utilities during the period. In the case of Punjab, inequities in immunization coverage also declined. The widening of disparities in the

Regional Inequalities in Pakistan: Evidence Since 1998
215
deprivation indicators in the provinces can reflect: a) reduced number of areas with poor access to social and utilities access or b) continued existence of pockets of extreme poverty.
Table-9: Share of Allocations to (Punjab) Region’s Districts
FY 2001-02
FY 2002-03
FY 2003-04
FY 2004-05
FY 2005-06
FY 2006-07
Northwest Punjab
24.05% 18.09% 17.21% 18.13% 17.49% 17.93%
Central Punjab 49.37% 56.88% 57.44% 56.60% 56.52% 55.63%
South Punjab 26.58% 25.02% 25.35% 25.26% 25.98% 26.44%
Some of the major findings from the district-wise analysis contained in MDG Report (2006) are as follows:-
• District-wise analysis of seven MDG indicators reveals that in six indicators, the majority of districts in the top-ten districts are from Punjab in 2005. In comparison to 1998, there are fewer districts of Punjab now among the top ten elite groups in three out of seven indicators.
• Districts in Baluchistan and NWFP dominate the bottom ten rankings. However comparing the 1998 with the 2005 rankings, many districts of NWFP made remarkable improvements in GPI primary enrolment, youth literacy and sanitation and districts in Baluchistan took their place in 2005 by default or slow improvements.
• In four indicators, districts of Baluchistan dominate the ranking of the fastest growing districts during the period. In the remaining three indicators, districts of NWFP dominate the ranking of fastest growing districts. Ranking of districts by absolute improvement in indicators also yields very similar results.
• A study by CRPRID (2007) constructed a composite index of the twelve indicators using the technique of factor analysis. A comparative ranking of districts by weighted factor scores for the years 1998 and 2005 revealed that in 1998, eight districts from Punjab were among the top ten scoring districts. By 2005 none of the districts from the other three provinces were in the list of top ten scorers.
Sajjad Akhtar
216
• In 1998, among the ten lowest scores, five belonged to Baluchistan and four to NWFP. By 2005, the number of districts from Baluchistan increased to seven, and number of districts in NWFP reduced to two.
Intra-Punjab Inequalities
In the absence of district level GDP and growth data, we assess the intra-Punjab inequities from two different angles. The 34 districts of Punjab are categorized into three regions, North West (8 districts), South (9 districts) and Central (17 districts)2. We first examine the shares of these three regions in the allocation of expenditures to district councils for the period 01-02 to 06-07 in Table-10. The districts belonging to the Northwest region received between 17-24 percent of total allocations, while those in Central Punjab received between 50-60 percent. The Southern region receiving the remaining 25 percent share. One can only conjecture, given small variability in these shares over the last 6 years, that they are strictly based on population shares. No deliberate attempts were made by the provincial government via grants or other fiscal resource transfers to increase public investments to compensate for the ‘backwardness’ of southern Punjab. No doubt, estimates of per capita allocations or a breakup of expenditures into current and development would give a more informed picture of the inequities in intra-Punjab allocations.
Table-10 summarizes the status of disparities in non-income dimensions for the three regions. The last column gives the status of inter-regional disparities within Punjab. Out of 12 indicators, the coefficient of variation was smaller for seven indicators in 2005 compared to 1998. Disparities in youth literacy, immunization coverage and one room houses remained unchanged. For eight indicators, the F-test for equality of means for the regions is significant. In other words, the means reflect different underlying population characteristics. The remaining columns indicate that intra-regional disparities in a majority of the indicators declined during the 1998-2005 period in Punjab.
2 The list of districts in each of these categories is given in the Appendix.
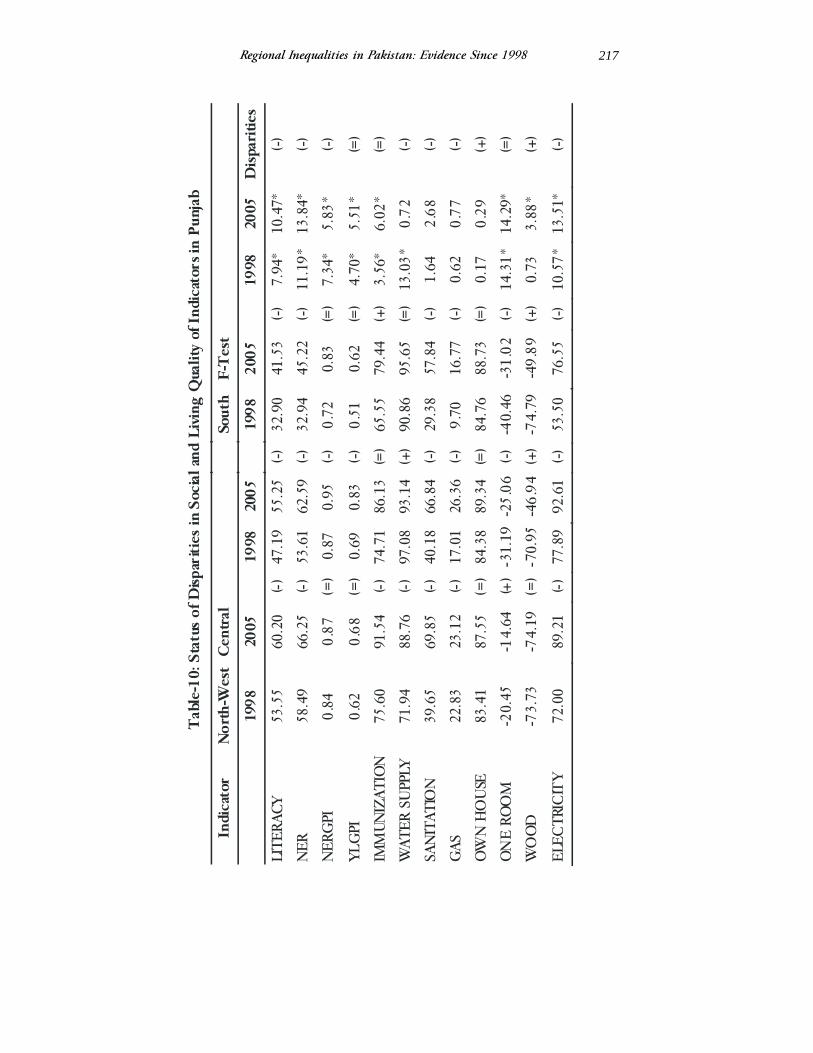
Regional Inequalities in Pakistan: Evidence Since 1998
217
Tab
le-1
0:St
atus
of D
ispar
ities
in S
ocia
l and
Liv
ing
Qua
lity
of I
ndic
ator
s in
Punj
ab
Indi
cato
rN
orth
-Wes
tC
entr
alSo
uth
F-T
est
1998
2005
1998
2005
1998
2005
1998
2005
Dis
pari
ties
LITE
RACY
53.5
560
.20
(-)47
.19
55.2
5(-)
32.9
041
.53
(-)7.
94*
10.4
7*(-)
NER
58.4
966
.25
(-)53
.61
62.5
9(-)
32.9
445
.22
(-)11
.19*
13.8
4*(-)
NER
GPI
0.84
0.87
(=)
0.87
0.95
(-)0.
720.
83(=
)7.
34*
5.83
*(-)
YLGPI
0.62
0.68
(=)
0.69
0.83
(-)0.
510.
62(=
)4.
70*
5.51
*(=
)
IMM
UNIZ
ATIO
N75
.60
91.5
4(-)
74.7
186
.13
(=)
65.5
579
.44
(+)
3.56
*6.
02*
(=)
WAT
ER S
UPP
LY71
.94
88.7
6(-)
97.0
893
.14
(+)
90.8
695
.65
(=)
13.0
3*0.
72(-)
SANIT
ATIO
N39
.65
69.8
5(-)
40.1
866
.84
(-)29
.38
57.8
4(-)
1.64
2.68
(-)
GAS
22.8
323
.12
(-)17
.01
26.3
6(-)
9.70
16.7
7(-)
0.62
0.77
(-)
OW
N H
OUSE
83.4
187
.55
(=)
84.3
889
.34
(=)
84.7
688
.73
(=)
0.17
0.29
(+)
ON
E RO
OM
-20.
45-1
4.64
(+)
-31.
19-2
5.06
(-)-4
0.46
-31.
02(-)
14.3
1*14
.29*
(=)
WO
OD
-73.
73-7
4.19
(=)
-70.
95-4
6.94
(+)
-74.
79-4
9.89
(+)
0.73
3.88
*(+
)
ELEC
TRIC
ITY
72.0
089
.21
(-)77
.89
92.6
1(-)
53.5
076
.55
(-)10
.57*
13.5
1*(-)
Sajjad Akhtar
218
Summary and Conclusions
During the last few years, economic performance at the national level has reduced absolute poverty levels significantly from 1998-99 levels as per official statistics. The reduction has also filtered down to the urban and rural areas of the four provinces, although in varying degrees. However at the same time, it is accepted that income and consumption inequalities increased during the same period and they stand at the same level as in 1998-99. The rise in consumption inequalities during 1998-99 and 2004-05 are empirically documented, while documentation of rising income inequalities awaits data analysis. The status of intra-regional inequalities is another inquiry that needs to be undertaken. Relying on official statistics and data, this study is a modest attempt at providing a snap-shot of consumption and non-consumption based inequalities from the period 1998-99 onwards. The main findings can be summarized as follows:
a) Improved economic performance at the national level during the last few years is reflected in a decline in poverty levels at the national level and provincial level. Punjab’s poverty levels improved by 7 percentage points during 2000-01 and 2004-05 as compared to an improvement of 10 percentage points at the national level. Dramatic reductions in the poverty levels in a span of 5 years in Sindh is more an outcome of the comparison of two extreme points in terms of economic performance of the province. In 2000-01, Sindh was experiencing the second year of a severe drought and 2004-05 was an exceptional year for cotton output. One can safely infer that it is the reduction in poverty levels in Sindh and NWFP provinces that contributed to the reduction at the national levels. Whether this relationship is structural and sustainable or temporary due to the fluctuating performance of agriculture in these two provinces, can only be determined with a longer provincial time series and more in-depth study.
b) The analysis of consumption based Gini coefficients at four points in
time since 98-99 reveal that inequalities within Punjab and Sindh are marginally higher than the national estimate, and are significantly lower in NWFP and Balochistan, but have come closer to national estimates in the last few years. A similar scenario emerges when one estimates the ratio of the top 20% to the bottom 40% consumption quintile.
Regional Inequalities in Pakistan: Evidence Since 1998
219
c) A study of the shares of federal assistance to provincial PSDPs indicate that there is in-built bias in federal allocations toward NWFP and Balochistan. Punjab has consistently received less than its population share, Sindh almost equal or slightly less than its population share while NWFP and Balochistan have consistently received a higher share.
d) The ultimate aim of any development effort is to increase the
capacities of its population in order to achieve a higher standard of living. The provision of higher human capital and economic and social capital reduces chronic poverty and improves income distribution in the long run. An assessment of non-consumption inequalities was carried out by a comparative analysis of 7 MDG and 5 non-MDG indicators between 1998 and 2005. The analysis suggests reduced disparities in the provision of 7 out of 12 indicators, specifically education, water supply, sanitation, electricity and population using gas/kerosene oil at the national, provincial and intra-provincial level.
e) Intra-Punjab inequalities were also examined by dividing the 34
districts into the regions of north-west, south and central. Provincial allocations to these three regions strictly follow the population share formula, and apparently no attempt has been made to deliberately increase resource transfer to the lagging regions. However, non-consumption disparities in most of the social and quality of living indicators have decreased during the period since 1998 across regions and within regions. However the absolute levels of disparities across regions are still high and are statistically significant.

Sajjad Akhtar
220
References
Center for Research on Poverty Reduction and Income Distribution (CRPRID), 2006, Millennium Development Goals Report, Islamabad.
World Bank, 2006, World Development Report, Washington D.C.
Notes for Authors
1. Manuscripts will be accepted for consideration on the understanding that they are original contributions to the existing knowledge in the fields of Economics, Banking, Current Affairs, Finance, Political Economy and Economic History.
2. Manuscripts of research articles, research notes, review articles, comments, rejoinders and book reviews – in English only – should be sent in duplicate to the Editor, The Lahore Journal of Economics, 105, C-2, Gulberg-III, Lahore-54660 – Pakistan. Electronic copies of the article in Microsoft word format should also be submitted as an email attachment to: [email protected].
3. The first page of the manuscript should have the title of the paper, the names(s) of author(s), and a footnote giving the current affiliation of the author(s) and any acknowledgments.
4. Articles submitted to the Lahore Journal must include an abstract of about 100 words that summarizes the contents.
5. The Lahore Journal will publish empirical papers only if the data used in the analyses are clearly and precisely documented and are readily available to the journal reviewer for purposes of replication. At the time of submission of papers that have empirical work, authors must provide to the Lahore Journal, the data in Microsoft EXCEL format required for the replication of results.
6. Detailed derivations of any main mathematical results reported in the text should be submitted separately along with the articles.
7. Each manuscript should be typed and should carry a margin of an inch and a half on the left-hand side and an inch on the right hand side of the typed page.
8. The graphic format for each mathematical formula, diagram, figure or chart should be in text mode for further editing.
9. Tables for the main text and each of its appendices should be numbered sequentially and separately. The title of each table should clearly describe the contents. The source of the table should be given in a footnote immediately below the line at the bottom of the table.
10. Footnotes should be numbered sequentially.
11. All references used in the text should be listed in alphabetical order of the authors’ surnames at the end of the text. References in the text should include the name(s) of author(s) with the year of publication in parentheses, and all references should conform to the style of the Journal. Further information on questions of style may be obtained from the Associate Editor, The Lahore Journal of Economics, Lahore – Pakistan.
12. Book Reviews should give a description of the contents and a critical evaluation of the book. It should not exceed 5 or 6 typewritten pages.
13. Each author will receive two complimentary copies of The Lahore Journal of Economics.

THE LAHORE JOURNAL
OF
ECONOMICS
Lahore School of Economics 105-C-2, GULBERG III LAHORE, PAKISTAN. TEL: 5714936 FAX: 5714936
SUBSCRIPTION FOR PUBLICATIONS
1. Kindly enter a subscription for the following publication of the Lahore School of Economics:
Publication Yearly subscription Yearly subscription Period Total (within Pakistan) (outside Pakistan) (No. of years) Payment
1. The Lahore Journal Rs. 600.00 US $ 50 …......... ………….
of Economics
2. The subscription is to be in the following name and address:
Name: ----------------------------------------
Address: ----------------------------------------
----------------------------------------
----------------------------------------
3. A crossed cheque/demand draft for the sum of Pakistan Rupees/US $________ is enclosed made out in the name of The Lahore School of Economics to cover the above subscription.
4. Please address your order to: Nina Gera, Publications, Lahore School of Economics, 105-C-2, Gulberg III, Lahore 54660, Pakistan.
Signature:------------------------------------
Name:-----------------------------------------
Date:------------------------------------------

The Lahore School of Economics
The Lahore School of Economics (established 1993) is one of Pakistan’s leading centres of learning for teaching and research in economics, finance and business administration. The Lahore School of Economics’ objectives include: (i). The training of young Pakistanis as professional economists, finance managers, accountants, financial analysts, bankers and business executives, and (ii). Undertaking research in economics, management, finance and banking to further deepen understanding of major economic facts, issues and policies.
The Lahore School was granted a Charter in January, 1997 by an Act of the Provincial Assembly of the Punjab: The Lahore School of Economics Act 1997 (Act II of 1997). The Charter vests the powers of an independent degree granting institution to The Lahore School.
The Lahore School has both undergraduate and graduate programs in economics, business information systems and finance. Its postgraduate program leading to the MPhil and PhD degree is administered through the Lahore School’s Centre for Research in Economics and Business (CREB). The student body and faculty comprise both national and expatriate Pakistanis and The Lahore School encourages expatriate Pakistanis to join as students or as faculty.
The Lahore School’s publication program comprises The Lahore Journal of Economics (a bi-annual publication), Lahore Journal of Policy Studies, a Seminar Paper Series and a Text Book Series. The Program encourages both in-house and external contributors.
For further information, please call (Pakistan 92-42-) 5714936 or 5874385 or visit the Web page: www.lahoreschoolofeconomics.edu.pk
Printed by Lahore School of Economics Press