
Speaking the Language: Using assessment data with different audiences
31
Speaking the Language: Using Assessment Data with Different Audiences Stan Dura #OAC2014 9/5/14
Transcript of Speaking the Language: Using assessment data with different audiences

Speaking the Language:Using Assessment Data with Different Audiences
Stan Dura#OAC2014
9/5/14
Agenda
• Introduction and Agenda• How we got started• How we evolved• What we learned• Q & A
[email protected] 9/5/14

How we got started
• Housing needed a new residence hall and was requesting a live-on requirement– Age and deferred maintenance of buildings– New hall needed to offset the loss in capacity due
to renovations– Opportunity to increase classroom space– Divisional goal to become a “residential campus”
[email protected] 9/5/14

How we got started
• Multiple audiences– First Audience was the VPSL – Not too hard of a sell:• Age and deferred maintenance of buildings• Opportunity to increase classroom space• Opportunity to increase capacity while still closing halls
annually for renovation • Striving for the “residential campus” vision
[email protected] 9/5/14

How we got started
• Multiple audiences– Second Audience was the President and the ELT– Much more difficult to sell• Limited bonding capacity• Several academic building proposals• No desire or capital to increase tuition and fees• Most institutional goals tied to AAU benchmarks, not
housing or Student Life aspects
[email protected] 9/5/14

How we got started
• Multiple audiences– Other audiences included:• Undergraduate Studies• Other Student Life offices• Office of Enrollment Management• Institutional Research
[email protected] 9/5/14

How we got started
• Needed a common reference– Landed on Retention• Percentages of on/off campus retention• Literature review– Housing not always implicated in retention– It is implicated when it» Connects students meaningfully» Engages them academically» Facilitates belonging
[email protected] 9/5/14

How we got started
• Focusing on retention– Here is where we began to pause• Our President and ELT are savvy data consumers• As are OEM and IR• Much of the literature inferred the benefit of housing• Housing does not always contribute to retention• National trends do not always replicate on a campus
[email protected] 9/5/14

How we got started
• Focusing on retention– We decided we needed our own data• We conducted a retention study on our data
– FYFTFT Cohorts 2006-2012 living on and off campus
• Controlled for major, but didn’t have time to pull more• Used logistic regression instead of descriptive stats
[email protected] 9/5/14

How we got started
• Focusing on retention– Here is what we found:• FY living on campus compared to living off
– 1.59 times more likely to be retained to sophomore year– 1.33 times more likely to be retained to Junior year– 1.16 times more likely to be retained to Senior year– 1.16 time more likely to graduate
– What does that mean to y’all?
[email protected] 9/5/14

How we evolved
• Interpreting logistic regression is not straightforward– We began to recognize the different languages• Some staff more used to percentages and inferring
meaning from them• Some offices used to probability and odds ratios• The Executive Leadership team wouldn’t trust the first
and wouldn’t get the second
[email protected] 9/5/14
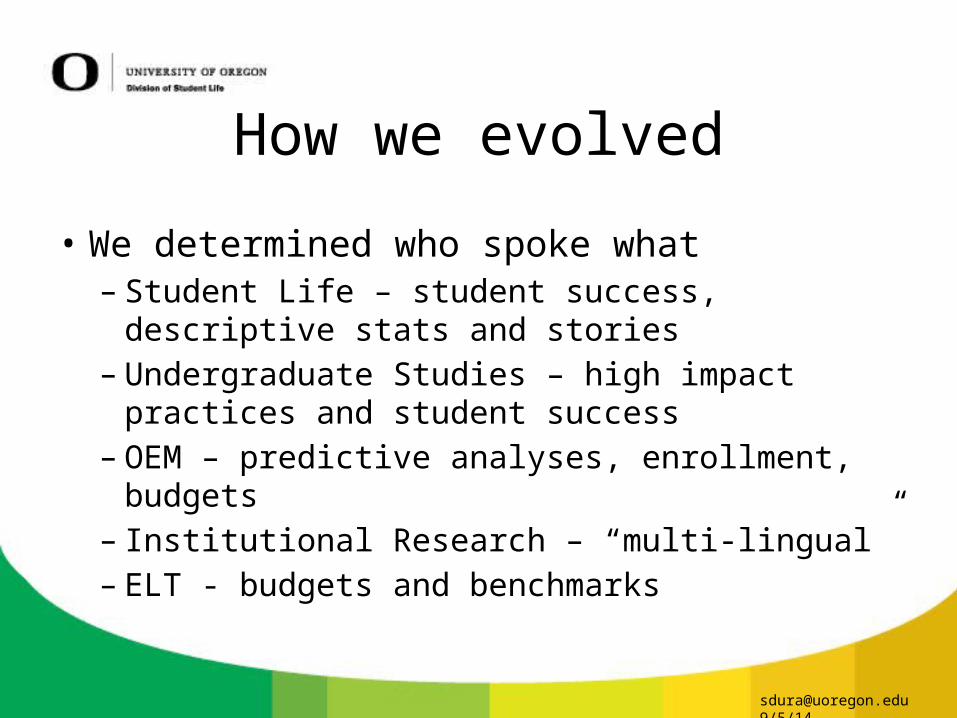
How we evolved
• We determined who spoke what– Student Life – student success, descriptive stats
and stories– Undergraduate Studies – high impact practices
and student success– OEM – predictive analyses, enrollment, budgets– Institutional Research – “multi-lingual”– ELT - budgets and benchmarks
[email protected] 9/5/14

How we evolved
• Within Student Life– Used descriptives and introduced the odds ratio– Focused on the experiences that housing provides• FIGs, Honors, special communities, 1:1 RA
programming, etc.
– Also introduced the budget information
[email protected] 9/5/14

How we evolved
• OEM and Institutional Research– Discussed variables, probability, regression– We were upfront with weaknesses of our data and
assumptions– Sought their advice and critique– Bolstered their confidence in our competence
[email protected] 9/5/14

How we evolved
• Undergraduate Studies– Discussed the benefit of LLC’s and FIG’s as high
impact practices– Their impact on student success
[email protected] 9/5/14

How we evolved
• Executive Leadership Team– Focused on the increased revenue from retention• Converted predicted retention each year to $• Used conservative assumptions and estimations to:
– Calculate revenue from resident and non-resident students– Estimate housing occupancy– Estimate increases in tuition, fees, and enrollment
[email protected] 9/5/14

How we evolved
• Live on Requirement– The increase in students retained • Would constitute a 2% increase in our overall retention • Would result in an additional $62M over 4 years• Would result in an additional $29M from each cohort
– Increasing occupancy would increase these
[email protected] 9/5/14

How we evolved
• Live on Requirement– We broke it down by year and totals
[email protected] 9/5/14
2016 Cohort 2017 Cohort 2018 Cohort 2019 Cohort 4yr Total2017 Budget $6,063,660 $6,063,6602018 Budget $7,550,372 $6,154,615 $13,704,9872019 Budget $7,070,379 $7,663,627 $6,246,934 $20,980,9412020 Budget $7,176,435 $7,778,582 $6,340,638 $21,295,655
Total $20,684,411 $20,994,677 $14,025,516 $6,340,638 $62,045,2436 Year Grad $8,553,284
1 Cohort total $29,237,695

How we evolved
• We then replicated to look at LLC’s– Here’s what we found:• Students who lived on campus but did not live in an LLC
had about the same retention rate to their 2nd year as the overall university (85%).• LLC members were retained at 90%
[email protected] 9/5/14

How we evolved
• We then replicated to look at LLC’s– Here’s what we found:• The benefit of living in LLCs appeared more consistent
across years
[email protected] 9/5/14
Retention to 2nd Year
Retention to 3rd year
Retention to 4th year
6 Year Graduation
Off Campus 80% 77% 75% 66%
On Campus/ NoLLC
85% 80% 77% 70%
On Campus/ LLC 90% 85% 84% 80%

How we evolved
• We then replicated to look at LLC’s– Given 100% LLC participation, the impact would be:
[email protected] 9/5/14
2016 Cohort 2017 Cohort 2018 Cohort
2017 Budget $8,106,099
2018 Budget $8,227,690 $10,123,286
2019 Budget $8,351,106 $10,275,135 $10,324,945
Total $24,684,895 $20,398,420 $10,324,945 $55,408,260

How we evolved
• Connected to UO goals and AAU benchmarks* – Boosted retention*– Fund more tenured faculty*– Increased classroom space– Funds to build or renovate for classroom space– Ability to fund more research*– Increase student aid and expenditures per student*– Fund additional retention programs & efforts
[email protected] 9/5/14

How we evolved
• What happened?– ELT approved everything our VP asked for– ELT members praised our VP for the approach and
level of rigor – Developed trust in our VP and our use of data
[email protected] 9/5/14

How we evolved
• What happened?– VP is now asked for data related to institutional
efforts– That credibility bolstered our VP’s influence in
other politically sensitive issues– Academic partnership to expand LLCs
[email protected] 9/5/14

What we learned
• Deeper, thoughtful approaches take longer but yield much better results
• Tailoring the representation of data to audiences takes time, but is very helpful
• Credibility in this area can transfer over to other politically sensitive issues
[email protected] 9/5/14
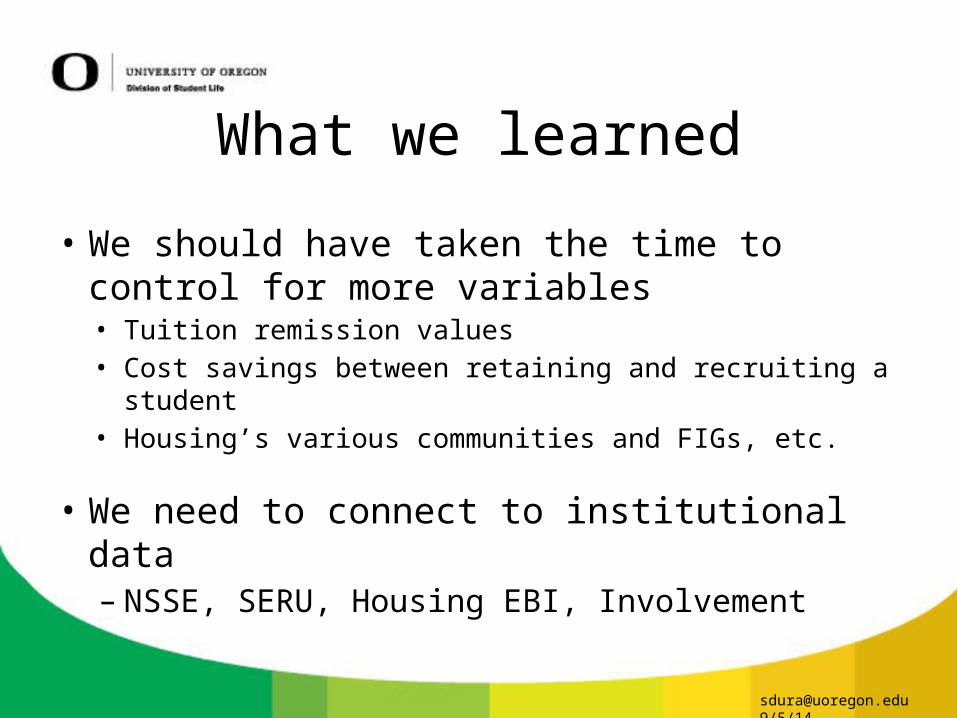
What we learned
• We should have taken the time to control for more variables• Tuition remission values• Cost savings between retaining and recruiting a student• Housing’s various communities and FIGs, etc.
• We need to connect to institutional data– NSSE, SERU, Housing EBI, Involvement
[email protected] 9/5/14

Annotated References• Asher, S. R. and Weeks, M. S. (2014). Loneliness and belongingness in the college years. In The Handbook of solitude: Psychological
perspectives on social isolation, social withdrawal, and being alone. 1st Ed. Coplan, R.J. and Bowker, J. C. Editors. John Wiley & Sons.• Examine the factors of loneliness and belongingness within the student experience and their relationship to social relationships,
academic engagement, etc.• • Astin, A. W. (1977). Four critical years: Effects of college on beliefs, attitudes, and knowledge. San Francisco: Jossey-Bass.• Student academic and co-curricular involvement is a critical predictor of persistence and success. • • Chickering, A. W. (1974). Commuting versus resident students: Overcoming the educational inequities of living off campus. San
Francisco: Jossey-Bass.• Commuter students face numerous additional barriers to success than residential students• • Dura, S. (2010). Residential Education Reconsidered. Presented at the Association of College and University Housing Officers
International’s Living and Learning Programs conference, Charlotte, NC. October 23, 2010.• • Englin, P. & Kuester, D. (2006). Residence hall living leads to higher graduation rates, study shows. Retrieved on January 28, 2013
from http://www.public.iastate.edu/~nscentral/news/2006/jan/residencehall.shtml• Looked at housing’s impact on retention at Iowa State University over several years. Found that High School Rank was the only
consistent predictor, but found in most years, LLC’s and other specially focused residential environments were significant predictors of retention.
•
[email protected] 9/5/14

Annotated References• Hanover Research (2011). Improving student retention and graduation rates. Retrieved on January 28, 2014, from
http://www.mybrcc.edu/intranet/attachments/article/110/Improving%20Student%20Retention%20and%20Graduation%20Rates.pdf• Surveyed 13 public and private universities specifically working to improve retention about their efforts and reviews aspects of those initiatives.
It identifies the initiatives that were most and least prevalent as well as their perceived value and contribution to retention. Living and Learning Communities was one of the most impactful initiatives reviewed.
• • • Higher Education Research Institute, (2011). Completing college: Assessing graduation rates at four-year institutions. HERI Research Brief, HERI.
Retrieved on January 28, 2013 from http://heri.ucla.edu/DARCU/CCResearchBrief.pdf.• Drawing from the largest database on entering student characteristics (CIRP) and the National Student Clearinghouse data, examines the most
effective predictors of student retention. Living off-campus was shown to reduce the likelihood of retention by up to 30%. Involvement in the life of the university was shown to increase retention by 6%.
• • Iowa State University (n.d.) Student retention comparison by where students live their first year. Retrieved from:
http://www.housing.iastate.edu/data/research/retention• Looked at housing’s impact on retention at Iowa State University over several years. Found that High School Rank was the only consistent
predictor, but found in most years, LLC’s and other specially focused residential environments were significant predictors of retention.• • Pascarella, E. T. (1985). The influence of on-campus living versus commuting to college on intellectual and interpersonal self-concept. Journal of
College Student Personnel, 26(4), 292-299.• Proposed a causal model to examine the impact of resident living on student developmentand found that the influence of on-campus living was
indirect and mediated through interactions with faculty and peers.•
[email protected] 9/5/14

Annotated References• Skahill, M.P. (2002). The role of social support network in college persistence among freshmen students. Journal of College Student
Retention, 4(1), 39-52.• Found that retention differences between resident students and commuter students was explained by the students’ sense of social
connectedness more so than by resident status . Commuters with high social connectedness were retained at the same rate as resident students reporting high social connectedness.
• • Swail, Watson (2004). The Art of Student Retention. Education Policy Institute. Retrieved on January 28, 2014 from
http://studentretention.org/pdf/ART_OF_STUDENT_RETENTION.pdf• Summarizes the history and current literature around retention and identifies key institutional, social and cognitive factors that
consistently influence retention. Identifies learning communities and faculty-student interaction as highly important across academic and student services.
• • Tinto, Vincent (2002). Taking Student Retention Seriously: Rethinking the First Year of College. Presentation, AACRAO 2002.
Retrieved on January 28, 2014 from http://advisortrainingmanual.pbworks.com/f/Tinto_TakingRetentionSeriously.pdf• Tinto speaks about what research shows student need to persist. He summarizes it into five things. Students are more likely to
persist and graduate in settings that:• expect them to succeed,• provide clear and consistent information and academic/career advising• provide academic, social, and personal support,• engage students in frequent and quality interactions with faculty, staff and other students. • engage students in learning both inside and outside the classroom
[email protected] 9/5/14

Annotated References• Tinto, Vincent (2005). Student Retention: What Next? Presentation, 2005 National Conference on Student Recruitment,
Marketing, and Retention.• Tinto, one of the pioneers of retention research, discusses how the retention conversation has evolved over thirty years,
and makes three key observations: – Identifying effective action is not as difficult as implementing it fully and making sure it endures. Too frequently programs do not go
as far as they should, and often effective programs fade away when institution priorities shift. One solution is constant assessment on the effectiveness and reach of programs.
– Established programs are not integrated in the fabric of institutional life. Faculty and staff do not involve themselves in activities that would help retention. Faculty believe retention is based on student abilities/motivation. One solution is to speak not of retaining students but of effectively educating and including students.
– The gap between low-income and high-income students is growing, even after accounting for academic preparation. • • UO Retention Subcommittee (n.d.). 2006-7 Report to the Enrollment Management Council. University of Oregon.• Participation in FIGs at UO significantly and positively impacts retention, even after controlling for H.S. GPA.• Resident status was positively correlated with Sophomore to Junior retention.• • Yu, Lin, Chen, Kaufman (2011). Determinants and Probability Predictions of College Student Retention: New Evidence
from the Probit Model. Retrieved on January 28, 2014 from http://course1.winona.edu/wyu/research/p18.pdf• Examines different models for studying retention and identifies pertinent variables. Notes that on campus jobs and on
campus housing positively impact retention.
[email protected] 9/5/14