Speaking Performance Measures of Fluency, …koizumi/JABAET_Speaking_Performance...Koizumi, R....
31
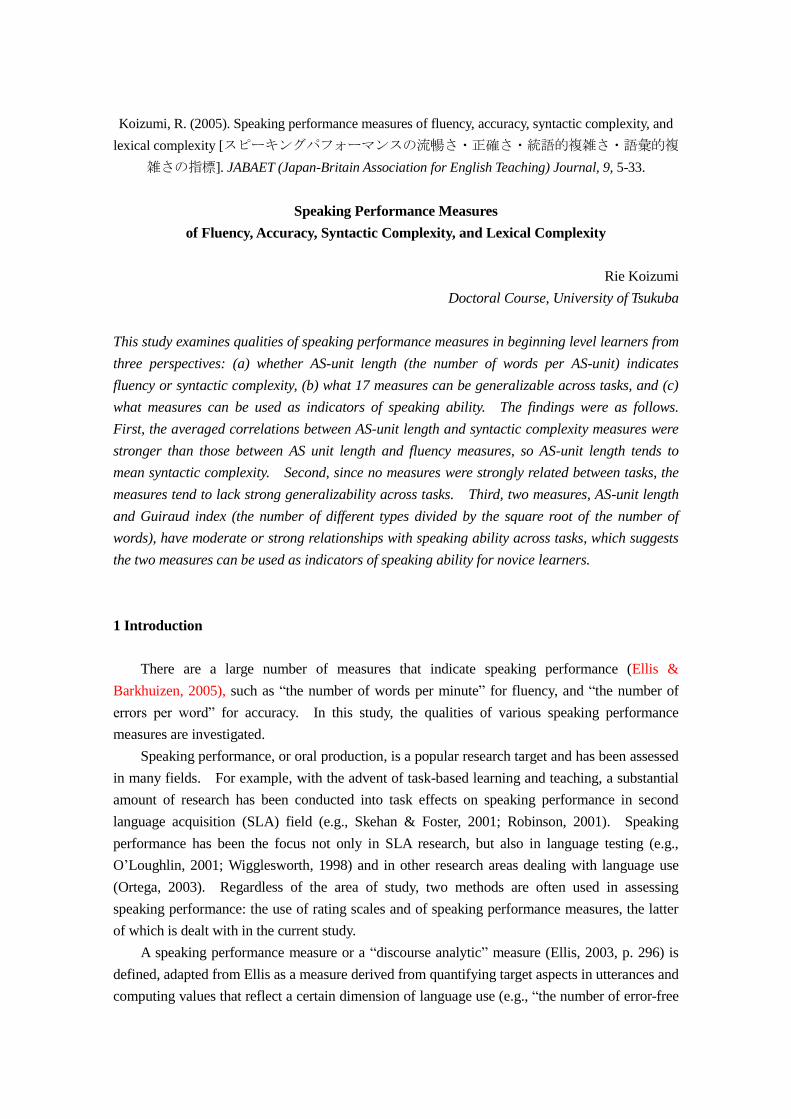
Koizumi, R. (2005). Speaking performance measures of fluency, accuracy, syntactic complexity, and lexical complexity [スピーキングパフォーマンスの流暢さ・正確さ・統語的複雑さ・語彙的複 雑さの指標]. JABAET (Japan-Britain Association for English Teaching) Journal, 9, 5-33. Speaking Performance Measures of Fluency, Accuracy, Syntactic Complexity, and Lexical Complexity Rie Koizumi Doctoral Course, University of Tsukuba This study examines qualities of speaking performance measures in beginning level learners from three perspectives: (a) whether AS-unit length (the number of words per AS-unit) indicates fluency or syntactic complexity, (b) what 17 measures can be generalizable across tasks, and (c) what measures can be used as indicators of speaking ability. The findings were as follows. First, the averaged correlations between AS-unit length and syntactic complexity measures were stronger than those between AS unit length and fluency measures, so AS-unit length tends to mean syntactic complexity. Second, since no measures were strongly related between tasks, the measures tend to lack strong generalizability across tasks. Third, two measures, AS-unit length and Guiraud index (the number of different types divided by the square root of the number of words), have moderate or strong relationships with speaking ability across tasks, which suggests the two measures can be used as indicators of speaking ability for novice learners. 1 Introduction There are a large number of measures that indicate speaking performance (Ellis & Barkhuizen, 2005), such as “the number of words per minute” for fluency, and “the number of errors per word” for accuracy. In this study, the qualities of various speaking performance measures are investigated. Speaking performance, or oral production, is a popular research target and has been assessed in many fields. For example, with the advent of task-based learning and teaching, a substantial amount of research has been conducted into task effects on speaking performance in second language acquisition (SLA) field (e.g., Skehan & Foster, 2001; Robinson, 2001). Speaking performance has been the focus not only in SLA research, but also in language testing (e.g., O’Loughlin, 2001; Wigglesworth, 1998) and in other research areas dealing with language use (Ortega, 2003). Regardless of the area of study, two methods are often used in assessing speaking performance: the use of rating scales and of speaking performance measures, the latter of which is dealt with in the current study. A speaking performance measure or a “discourse analytic” measure (Ellis, 2003, p. 296) is defined, adapted from Ellis as a measure derived from quantifying target aspects in utterances and computing values that reflect a certain dimension of language use (e.g., “the number of error-free
Transcript of Speaking Performance Measures of Fluency, …koizumi/JABAET_Speaking_Performance...Koizumi, R....
Koizumi, R. (2005). Speaking performance measures of fluency, accuracy, syntactic complexity, and
lexical complexity [スピーキングパフォーマンスの流暢さ・正確さ・統語的複雑さ・語彙的複
雑さの指標]. JABAET (Japan-Britain Association for English Teaching) Journal, 9, 5-33.
Speaking Performance Measures
of Fluency, Accuracy, Syntactic Complexity, and Lexical Complexity
Rie Koizumi
Doctoral Course, University of Tsukuba
This study examines qualities of speaking performance measures in beginning level learners from
three perspectives: (a) whether AS-unit length (the number of words per AS-unit) indicates
fluency or syntactic complexity, (b) what 17 measures can be generalizable across tasks, and (c)
what measures can be used as indicators of speaking ability. The findings were as follows.
First, the averaged correlations between AS-unit length and syntactic complexity measures were
stronger than those between AS unit length and fluency measures, so AS-unit length tends to
mean syntactic complexity. Second, since no measures were strongly related between tasks, the
measures tend to lack strong generalizability across tasks. Third, two measures, AS-unit length
and Guiraud index (the number of different types divided by the square root of the number of
words), have moderate or strong relationships with speaking ability across tasks, which suggests
the two measures can be used as indicators of speaking ability for novice learners.
1 Introduction
There are a large number of measures that indicate speaking performance (Ellis &
Barkhuizen, 2005), such as “the number of words per minute” for fluency, and “the number of
errors per word” for accuracy. In this study, the qualities of various speaking performance
measures are investigated.
Speaking performance, or oral production, is a popular research target and has been assessed
in many fields. For example, with the advent of task-based learning and teaching, a substantial
amount of research has been conducted into task effects on speaking performance in second
language acquisition (SLA) field (e.g., Skehan & Foster, 2001; Robinson, 2001). Speaking
performance has been the focus not only in SLA research, but also in language testing (e.g.,
O’Loughlin, 2001; Wigglesworth, 1998) and in other research areas dealing with language use
(Ortega, 2003). Regardless of the area of study, two methods are often used in assessing
speaking performance: the use of rating scales and of speaking performance measures, the latter
of which is dealt with in the current study.
A speaking performance measure or a “discourse analytic” measure (Ellis, 2003, p. 296) is
defined, adapted from Ellis as a measure derived from quantifying target aspects in utterances and
computing values that reflect a certain dimension of language use (e.g., “the number of error-free
clauses divided by the number of clauses” for accuracy). According to Ellis and Barkhuizen
(2005), while this method needs laborious work to transcribe utterances and these measures may
represent something distant from “how we judge communicative behaviour in the real world”
(Ellis, 2003, p. 298), it has the advantage that the measures are obtained more objectively than by
rating scales.
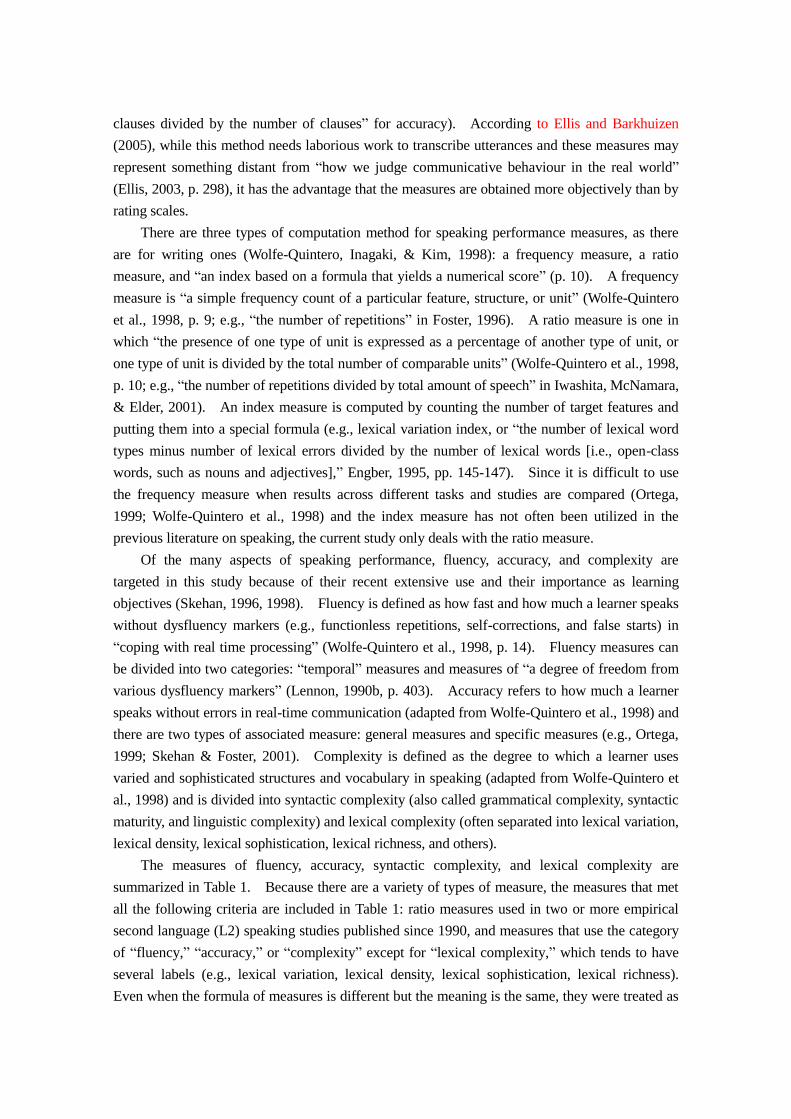
There are three types of computation method for speaking performance measures, as there
are for writing ones (Wolfe-Quintero, Inagaki, & Kim, 1998): a frequency measure, a ratio
measure, and “an index based on a formula that yields a numerical score” (p. 10). A frequency
measure is “a simple frequency count of a particular feature, structure, or unit” (Wolfe-Quintero
et al., 1998, p. 9; e.g., “the number of repetitions” in Foster, 1996). A ratio measure is one in
which “the presence of one type of unit is expressed as a percentage of another type of unit, or
one type of unit is divided by the total number of comparable units” (Wolfe-Quintero et al., 1998,
p. 10; e.g., “the number of repetitions divided by total amount of speech” in Iwashita, McNamara,
& Elder, 2001). An index measure is computed by counting the number of target features and
putting them into a special formula (e.g., lexical variation index, or “the number of lexical word
types minus number of lexical errors divided by the number of lexical words [i.e., open-class
words, such as nouns and adjectives],” Engber, 1995, pp. 145-147). Since it is difficult to use
the frequency measure when results across different tasks and studies are compared (Ortega,
1999; Wolfe-Quintero et al., 1998) and the index measure has not often been utilized in the
previous literature on speaking, the current study only deals with the ratio measure.
Of the many aspects of speaking performance, fluency, accuracy, and complexity are
targeted in this study because of their recent extensive use and their importance as learning
objectives (Skehan, 1996, 1998). Fluency is defined as how fast and how much a learner speaks
without dysfluency markers (e.g., functionless repetitions, self-corrections, and false starts) in
“coping with real time processing” (Wolfe-Quintero et al., 1998, p. 14). Fluency measures can
be divided into two categories: “temporal” measures and measures of “a degree of freedom from
various dysfluency markers” (Lennon, 1990b, p. 403). Accuracy refers to how much a learner
speaks without errors in real-time communication (adapted from Wolfe-Quintero et al., 1998) and
there are two types of associated measure: general measures and specific measures (e.g., Ortega,
1999; Skehan & Foster, 2001). Complexity is defined as the degree to which a learner uses
varied and sophisticated structures and vocabulary in speaking (adapted from Wolfe-Quintero et
al., 1998) and is divided into syntactic complexity (also called grammatical complexity, syntactic
maturity, and linguistic complexity) and lexical complexity (often separated into lexical variation,
lexical density, lexical sophistication, lexical richness, and others).
The measures of fluency, accuracy, syntactic complexity, and lexical complexity are
summarized in Table 1. Because there are a variety of types of measure, the measures that met
all the following criteria are included in Table 1: ratio measures used in two or more empirical
second language (L2) speaking studies published since 1990, and measures that use the category
of “fluency,” “accuracy,” or “complexity” except for “lexical complexity,” which tends to have
several labels (e.g., lexical variation, lexical density, lexical sophistication, lexical richness).
Even when the formula of measures is different but the meaning is the same, they were treated as
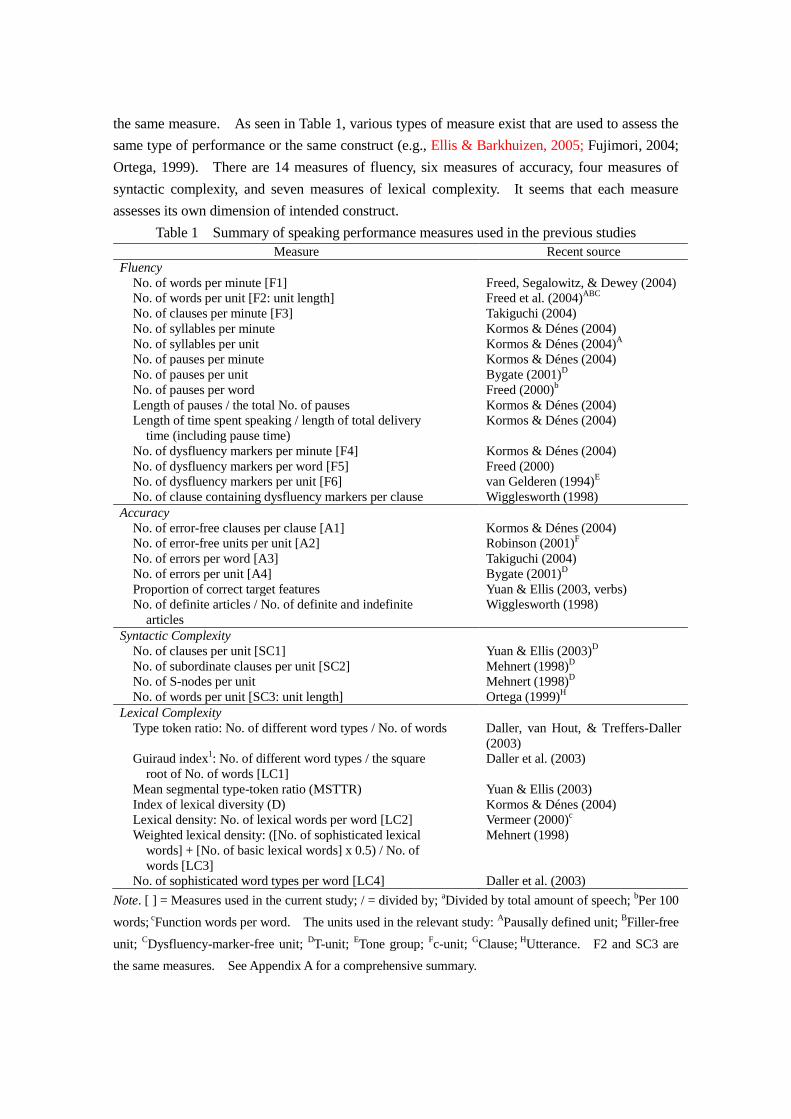
the same measure. As seen in Table 1, various types of measure exist that are used to assess the
same type of performance or the same construct (e.g., Ellis & Barkhuizen, 2005; Fujimori, 2004;
Ortega, 1999). There are 14 measures of fluency, six measures of accuracy, four measures of
syntactic complexity, and seven measures of lexical complexity. It seems that each measure
assesses its own dimension of intended construct.
Table 1 Summary of speaking performance measures used in the previous studies
Measure Recent source
Fluency
No. of words per minute [F1]
Freed, Segalowitz, & Dewey (2004)
No. of words per unit [F2: unit length] Freed et al. (2004)ABC
No. of clauses per minute [F3] Takiguchi (2004)
No. of syllables per minute Kormos & Dénes (2004)
No. of syllables per unit Kormos & Dénes (2004)A
No. of pauses per minute Kormos & Dénes (2004)
No. of pauses per unit Bygate (2001)D
No. of pauses per word Freed (2000)b
Length of pauses / the total No. of pauses Kormos & Dénes (2004)
Length of time spent speaking / length of total delivery
time (including pause time)
Kormos & Dénes (2004)
No. of dysfluency markers per minute [F4] Kormos & Dénes (2004)
No. of dysfluency markers per word [F5] Freed (2000)
No. of dysfluency markers per unit [F6] van Gelderen (1994)E
No. of clause containing dysfluency markers per clause Wigglesworth (1998)
Accuracy
No. of error-free clauses per clause [A1]
Kormos & Dénes (2004)
No. of error-free units per unit [A2] Robinson (2001)F
No. of errors per word [A3] Takiguchi (2004)
No. of errors per unit [A4] Bygate (2001)D
Proportion of correct target features Yuan & Ellis (2003, verbs)
No. of definite articles / No. of definite and indefinite
articles
Wigglesworth (1998)
Syntactic Complexity
No. of clauses per unit [SC1]
Yuan & Ellis (2003)D
No. of subordinate clauses per unit [SC2] Mehnert (1998)D
No. of S-nodes per unit Mehnert (1998)D
No. of words per unit [SC3: unit length] Ortega (1999)H
Lexical Complexity
Type token ratio: No. of different word types / No. of words
Daller, van Hout, & Treffers-Daller
(2003)
Guiraud index1: No. of different word types / the square
root of No. of words [LC1]
Daller et al. (2003)
Mean segmental type-token ratio (MSTTR) Yuan & Ellis (2003)
Index of lexical diversity (D) Kormos & Dénes (2004)
Lexical density: No. of lexical words per word [LC2] Vermeer (2000)c
Weighted lexical density: ([No. of sophisticated lexical
words] + [No. of basic lexical words] x 0.5) / No. of
words [LC3]
Mehnert (1998)
No. of sophisticated word types per word [LC4] Daller et al. (2003)
Note. [ ] = Measures used in the current study; / = divided by; aDivided by total amount of speech;
bPer 100
words; cFunction words per word. The units used in the relevant study:
APausally defined unit;
BFiller-free
unit; CDysfluency-marker-free unit;
DT-unit;
ETone group;
Fc-unit;
GClause;
HUtterance. F2 and SC3 are
the same measures. See Appendix A for a comprehensive summary.
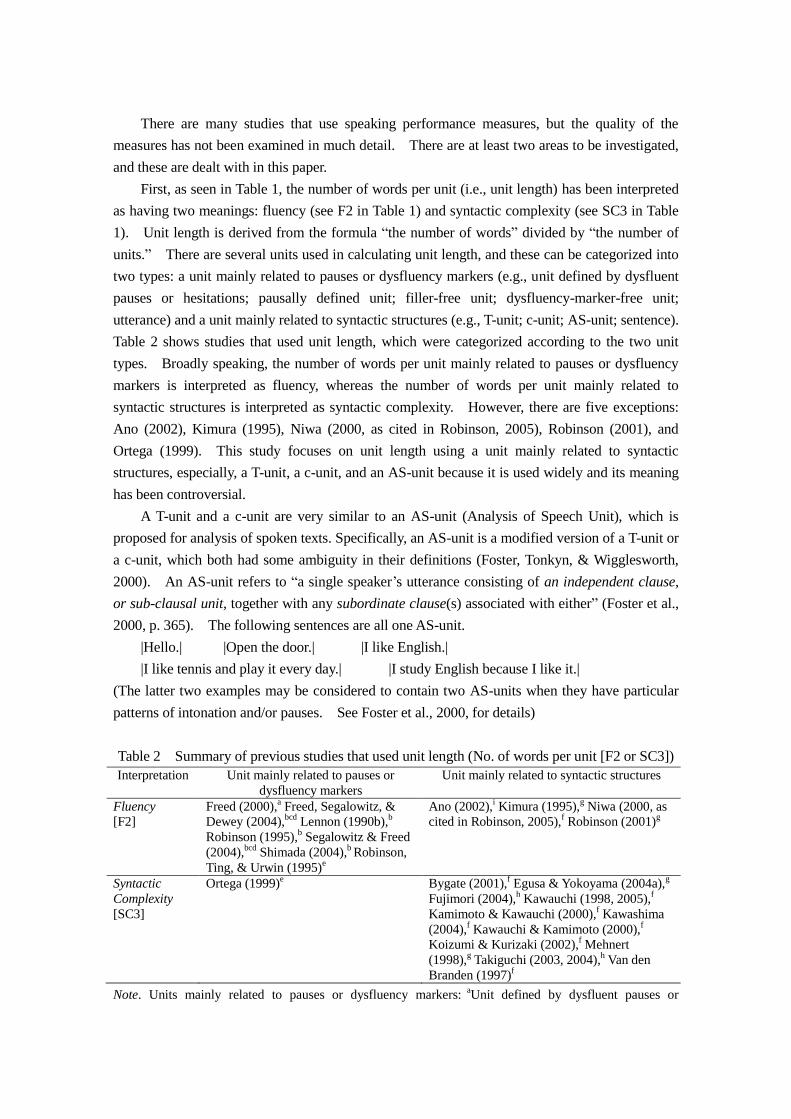
There are many studies that use speaking performance measures, but the quality of the
measures has not been examined in much detail. There are at least two areas to be investigated,
and these are dealt with in this paper.
First, as seen in Table 1, the number of words per unit (i.e., unit length) has been interpreted
as having two meanings: fluency (see F2 in Table 1) and syntactic complexity (see SC3 in Table
1). Unit length is derived from the formula “the number of words” divided by “the number of
units.” There are several units used in calculating unit length, and these can be categorized into
two types: a unit mainly related to pauses or dysfluency markers (e.g., unit defined by dysfluent
pauses or hesitations; pausally defined unit; filler-free unit; dysfluency-marker-free unit;
utterance) and a unit mainly related to syntactic structures (e.g., T-unit; c-unit; AS-unit; sentence).
Table 2 shows studies that used unit length, which were categorized according to the two unit
types. Broadly speaking, the number of words per unit mainly related to pauses or dysfluency
markers is interpreted as fluency, whereas the number of words per unit mainly related to
syntactic structures is interpreted as syntactic complexity. However, there are five exceptions:
Ano (2002), Kimura (1995), Niwa (2000, as cited in Robinson, 2005), Robinson (2001), and
Ortega (1999). This study focuses on unit length using a unit mainly related to syntactic
structures, especially, a T-unit, a c-unit, and an AS-unit because it is used widely and its meaning
has been controversial.
A T-unit and a c-unit are very similar to an AS-unit (Analysis of Speech Unit), which is
proposed for analysis of spoken texts. Specifically, an AS-unit is a modified version of a T-unit or
a c-unit, which both had some ambiguity in their definitions (Foster, Tonkyn, & Wigglesworth,
2000). An AS-unit refers to “a single speaker’s utterance consisting of an independent clause,
or sub-clausal unit, together with any subordinate clause(s) associated with either” (Foster et al.,
2000, p. 365). The following sentences are all one AS-unit.
|Hello.| |Open the door.| |I like English.|
|I like tennis and play it every day.| |I study English because I like it.|
(The latter two examples may be considered to contain two AS-units when they have particular
patterns of intonation and/or pauses. See Foster et al., 2000, for details)
Table 2 Summary of previous studies that used unit length (No. of words per unit [F2 or SC3])
Interpretation Unit mainly related to pauses or
dysfluency markers
Unit mainly related to syntactic structures
Fluency
[F2]
Freed (2000),a Freed, Segalowitz, &
Dewey (2004),bcd
Lennon (1990b),b
Robinson (1995),b Segalowitz & Freed
(2004),bcd
Shimada (2004),b Robinson,
Ting, & Urwin (1995)e
Ano (2002),i Kimura (1995),
g Niwa (2000, as
cited in Robinson, 2005),f Robinson (2001)
g
Syntactic
Complexity
[SC3]
Ortega (1999)e Bygate (2001),
f Egusa & Yokoyama (2004a),
g
Fujimori (2004),h Kawauchi (1998, 2005),
f
Kamimoto & Kawauchi (2000),f Kawashima
(2004),f Kawauchi & Kamimoto (2000),
f
Koizumi & Kurizaki (2002),f Mehnert
(1998),g Takiguchi (2003, 2004),
h Van den
Branden (1997)f
Note. Units mainly related to pauses or dysfluency markers: a
Unit defined by dysfluent pauses or
hesitations; bPausally defined unit;
cFiller-free unit;
dDysfluency-marker-free unit;
eUtterance (unit defined
by intonation and pauses, Ortega, 1999). Units mainly related to syntactic structures: fT-unit;
gc-unit;
hAS-unit,
iSentence.
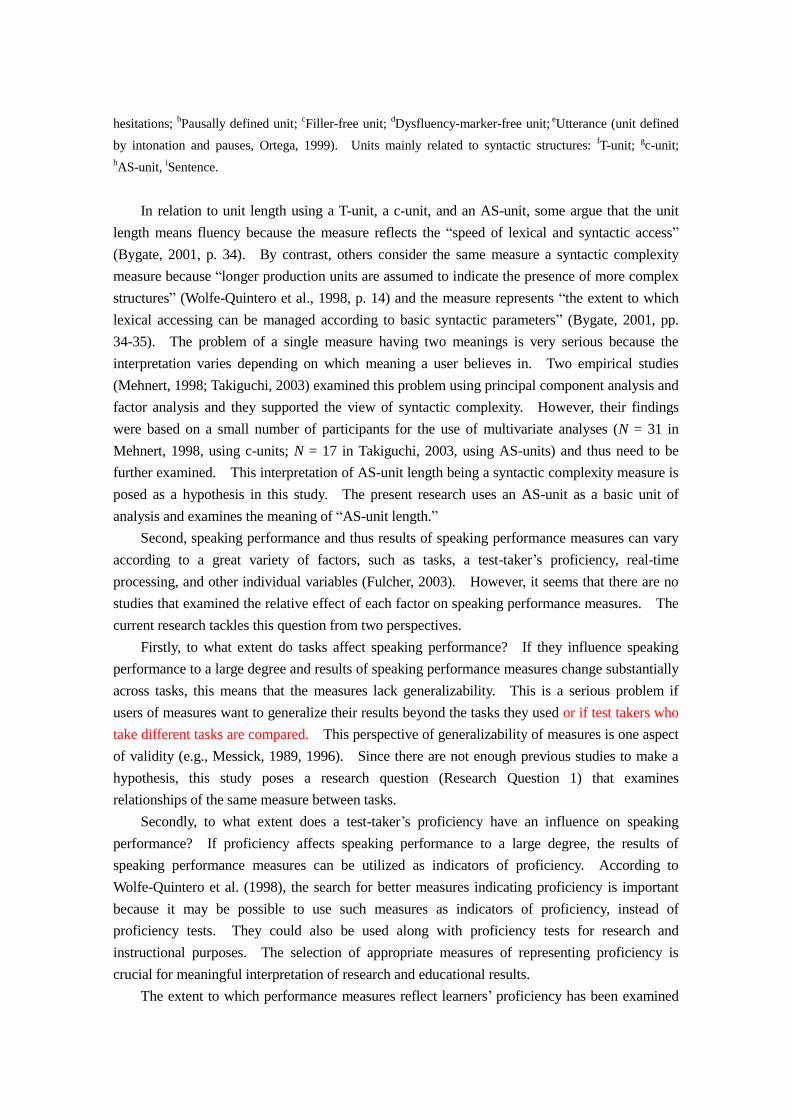
In relation to unit length using a T-unit, a c-unit, and an AS-unit, some argue that the unit
length means fluency because the measure reflects the “speed of lexical and syntactic access”
(Bygate, 2001, p. 34). By contrast, others consider the same measure a syntactic complexity
measure because “longer production units are assumed to indicate the presence of more complex
structures” (Wolfe-Quintero et al., 1998, p. 14) and the measure represents “the extent to which
lexical accessing can be managed according to basic syntactic parameters” (Bygate, 2001, pp.
34-35). The problem of a single measure having two meanings is very serious because the
interpretation varies depending on which meaning a user believes in. Two empirical studies
(Mehnert, 1998; Takiguchi, 2003) examined this problem using principal component analysis and
factor analysis and they supported the view of syntactic complexity. However, their findings
were based on a small number of participants for the use of multivariate analyses (N = 31 in
Mehnert, 1998, using c-units; N = 17 in Takiguchi, 2003, using AS-units) and thus need to be
further examined. This interpretation of AS-unit length being a syntactic complexity measure is
posed as a hypothesis in this study. The present research uses an AS-unit as a basic unit of
analysis and examines the meaning of “AS-unit length.”
Second, speaking performance and thus results of speaking performance measures can vary
according to a great variety of factors, such as tasks, a test-taker’s proficiency, real-time
processing, and other individual variables (Fulcher, 2003). However, it seems that there are no
studies that examined the relative effect of each factor on speaking performance measures. The
current research tackles this question from two perspectives.
Firstly, to what extent do tasks affect speaking performance? If they influence speaking
performance to a large degree and results of speaking performance measures change substantially
across tasks, this means that the measures lack generalizability. This is a serious problem if
users of measures want to generalize their results beyond the tasks they used or if test takers who
take different tasks are compared. This perspective of generalizability of measures is one aspect
of validity (e.g., Messick, 1989, 1996). Since there are not enough previous studies to make a
hypothesis, this study poses a research question (Research Question 1) that examines
relationships of the same measure between tasks.
Secondly, to what extent does a test-taker’s proficiency have an influence on speaking
performance? If proficiency affects speaking performance to a large degree, the results of
speaking performance measures can be utilized as indicators of proficiency. According to
Wolfe-Quintero et al. (1998), the search for better measures indicating proficiency is important
because it may be possible to use such measures as indicators of proficiency, instead of
proficiency tests. They could also be used along with proficiency tests for research and
instructional purposes. The selection of appropriate measures of representing proficiency is
crucial for meaningful interpretation of research and educational results.
The extent to which performance measures reflect learners’ proficiency has been examined
in developmental index studies in SLA, which “attempt to gauge the development of learners at
known proficiency levels through the use of fluency, accuracy, and complexity measures that are
not necessarily tied to particular structures” (Wolfe-Quintero et al., 1998, p. 2). In writing
studies, Wolfe-Quintero et al. (1998) summarized previous studies in L2 writing in order to
search for measures that show consistent strong relationships with proficiency. Ortega (2003, p.
495) investigated relationships between writing performance measures of syntactic complexity
and overall proficiency, by “focusing on magnitude of observed effects,” or effect sizes.
Previous studies of speaking also have investigated measures associated with learners’ L2
development though some studies do not specifically mention such an intention. Some studies
used correlations between a measure and an external criterion (e.g., c-test in Daller, van Hout, &
Treffers-Daller, 2003; receptive vocabulary in Vermeer, 2000), whereas others utilized
comparisons between the means of two or more groups (e.g., groups with different receptive
vocabulary size) through t-tests or analysis of variance (ANOVA; e.g., Cucchiarini, Strik, &
Boves, 2000; Daller et al., 2003; Kimura, 1995; Kormos & Dénes, 2004; Vermeer, 2000) or by
observing descriptive statistics (Vermeer, 2000).
Despite these determined efforts to investigate developmental indices, the previous studies,
apart from Wolfe-Quintero et al. (1998), dealt with a very limited number of measures of fluency,
accuracy, and complexity, while Wolfe-Quintero et al. (1998) were only concerned with writing
performance measures. Therefore, a study that compares more types of speaking measures is
necessary so that more comprehensive information on the relationship with proficiency can be
gained. This aspect is explored in the second research question (Research Question 2).
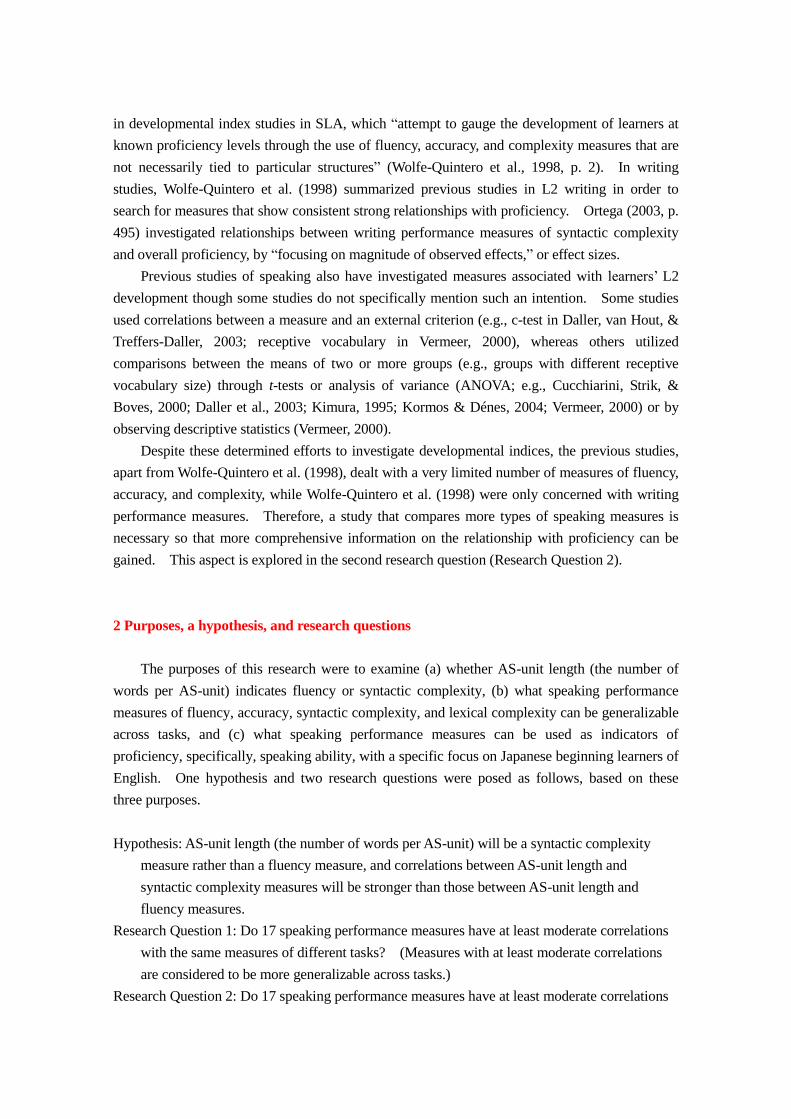
2 Purposes, a hypothesis, and research questions
The purposes of this research were to examine (a) whether AS-unit length (the number of
words per AS-unit) indicates fluency or syntactic complexity, (b) what speaking performance
measures of fluency, accuracy, syntactic complexity, and lexical complexity can be generalizable
across tasks, and (c) what speaking performance measures can be used as indicators of
proficiency, specifically, speaking ability, with a specific focus on Japanese beginning learners of
English. One hypothesis and two research questions were posed as follows, based on these
three purposes.
Hypothesis: AS-unit length (the number of words per AS-unit) will be a syntactic complexity
measure rather than a fluency measure, and correlations between AS-unit length and
syntactic complexity measures will be stronger than those between AS-unit length and
fluency measures.
Research Question 1: Do 17 speaking performance measures have at least moderate correlations
with the same measures of different tasks? (Measures with at least moderate correlations
are considered to be more generalizable across tasks.)
Research Question 2: Do 17 speaking performance measures have at least moderate correlations
with speaking ability? (Measures with at least moderate correlations with speaking ability
are considered to be indicators of speaking ability.)
It should be noted that Research Questions 1 and 2 do not overlap. Research Question 1
investigates the relationships between “one measure of one task” and “the same measure of one
of the other tasks” (e.g., a correlation between “F1 (the number of words per minute) of Task 1”
and “F1 of Task 3”). On the other hand, Research Question 2 examines the relationships
between “speaking ability” and “one measure of one task.” For example, a correlation between
“speaking ability” and “F1 of Task 1” is checked.
In this study, the criteria of correlations were set as follows: moderate: r = | .45| to | .64|;
strong: r = | .65| or more (Wolfe-Quintero et al., 1998). Speaking performance or “actual
instances of language use in real time” (McNamara, 1996, p. 54) was regarded as including
aspects of fluency, accuracy, syntactic complexity, and lexical complexity. Speaking ability was
considered to be part of proficiency, which includes writing, listening, and reading ability as well
as speaking ability. Compared to previous studies, this study used a larger number of speaking
performance measures with more tasks and with more participants, focusing on the quality of the
measures.
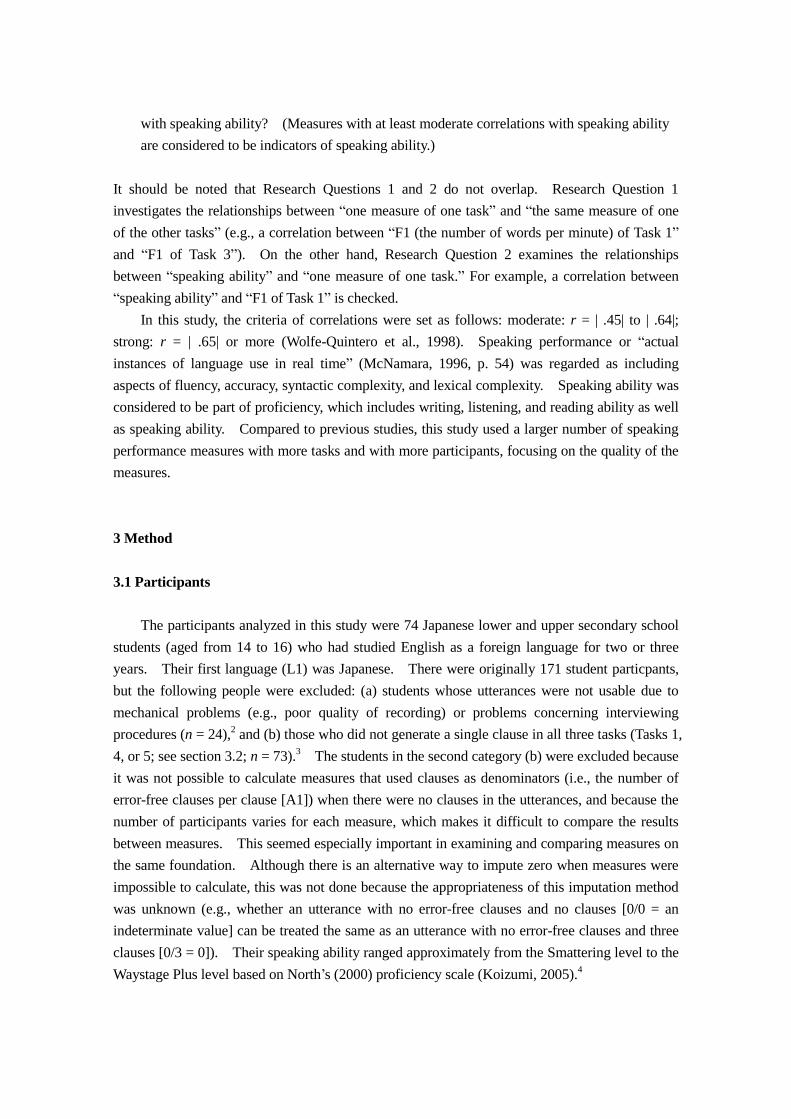
3 Method
3.1 Participants
The participants analyzed in this study were 74 Japanese lower and upper secondary school
students (aged from 14 to 16) who had studied English as a foreign language for two or three
years. Their first language (L1) was Japanese. There were originally 171 student particpants,
but the following people were excluded: (a) students whose utterances were not usable due to
mechanical problems (e.g., poor quality of recording) or problems concerning interviewing
procedures (n = 24),2 and (b) those who did not generate a single clause in all three tasks (Tasks 1,
4, or 5; see section 3.2; n = 73).3 The students in the second category (b) were excluded because
it was not possible to calculate measures that used clauses as denominators (i.e., the number of
error-free clauses per clause [A1]) when there were no clauses in the utterances, and because the
number of participants varies for each measure, which makes it difficult to compare the results
between measures. This seemed especially important in examining and comparing measures on
the same foundation. Although there is an alternative way to impute zero when measures were
impossible to calculate, this was not done because the appropriateness of this imputation method
was unknown (e.g., whether an utterance with no error-free clauses and no clauses [0/0 = an
indeterminate value] can be treated the same as an utterance with no error-free clauses and three
clauses [0/3 = 0]). Their speaking ability ranged approximately from the Smattering level to the
Waystage Plus level based on North’s (2000) proficiency scale (Koizumi, 2005).4
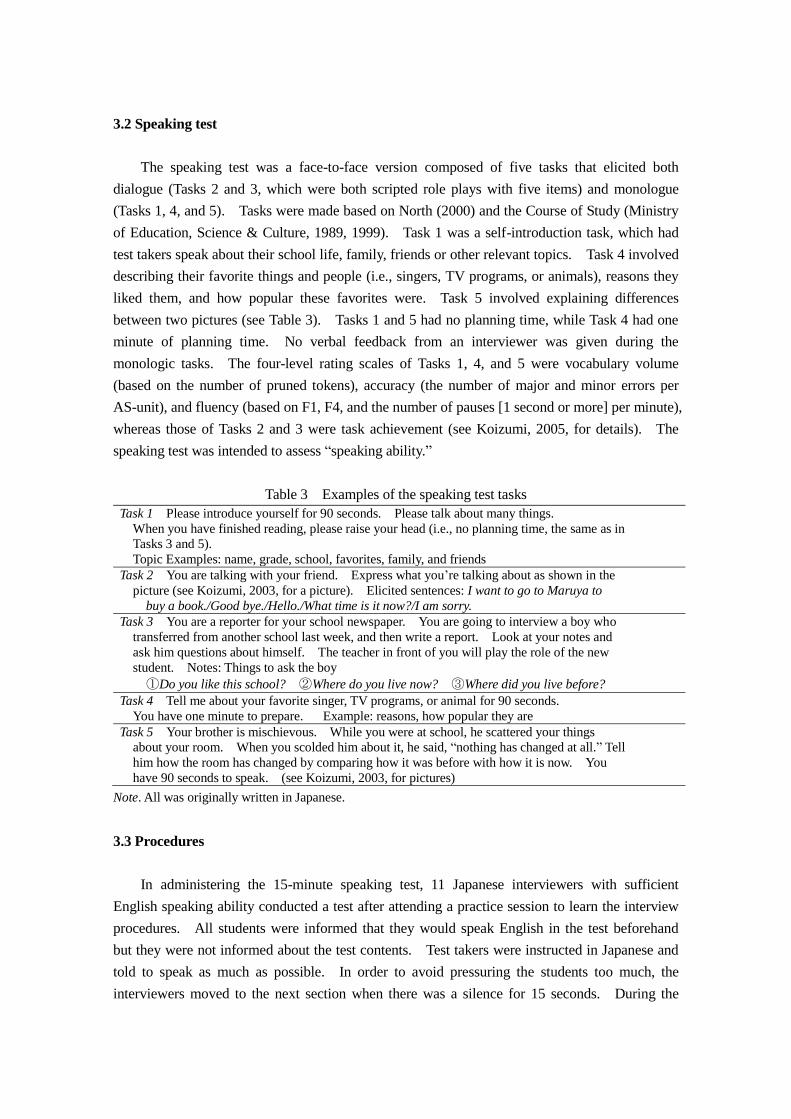
3.2 Speaking test
The speaking test was a face-to-face version composed of five tasks that elicited both
dialogue (Tasks 2 and 3, which were both scripted role plays with five items) and monologue
(Tasks 1, 4, and 5). Tasks were made based on North (2000) and the Course of Study (Ministry
of Education, Science & Culture, 1989, 1999). Task 1 was a self-introduction task, which had
test takers speak about their school life, family, friends or other relevant topics. Task 4 involved
describing their favorite things and people (i.e., singers, TV programs, or animals), reasons they
liked them, and how popular these favorites were. Task 5 involved explaining differences
between two pictures (see Table 3). Tasks 1 and 5 had no planning time, while Task 4 had one
minute of planning time. No verbal feedback from an interviewer was given during the
monologic tasks. The four-level rating scales of Tasks 1, 4, and 5 were vocabulary volume
(based on the number of pruned tokens), accuracy (the number of major and minor errors per
AS-unit), and fluency (based on F1, F4, and the number of pauses [1 second or more] per minute),
whereas those of Tasks 2 and 3 were task achievement (see Koizumi, 2005, for details). The
speaking test was intended to assess “speaking ability.”
Table 3 Examples of the speaking test tasks
Task 1 Please introduce yourself for 90 seconds. Please talk about many things.
When you have finished reading, please raise your head (i.e., no planning time, the same as in
Tasks 3 and 5).
Topic Examples: name, grade, school, favorites, family, and friends
Task 2 You are talking with your friend. Express what you’re talking about as shown in the
picture (see Koizumi, 2003, for a picture). Elicited sentences: I want to go to Maruya to
buy a book./Good bye./Hello./What time is it now?/I am sorry.
Task 3 You are a reporter for your school newspaper. You are going to interview a boy who
transferred from another school last week, and then write a report. Look at your notes and
ask him questions about himself. The teacher in front of you will play the role of the new
student. Notes: Things to ask the boy
①Do you like this school? ②Where do you live now? ③Where did you live before?
Task 4 Tell me about your favorite singer, TV programs, or animal for 90 seconds.
You have one minute to prepare. Example: reasons, how popular they are
Task 5 Your brother is mischievous. While you were at school, he scattered your things
about your room. When you scolded him about it, he said, “nothing has changed at all.” Tell
him how the room has changed by comparing how it was before with how it is now. You
have 90 seconds to speak. (see Koizumi, 2003, for pictures)
Note. All was originally written in Japanese.
3.3 Procedures
In administering the 15-minute speaking test, 11 Japanese interviewers with sufficient
English speaking ability conducted a test after attending a practice session to learn the interview
procedures. All students were informed that they would speak English in the test beforehand
but they were not informed about the test contents. Test takers were instructed in Japanese and
told to speak as much as possible. In order to avoid pressuring the students too much, the
interviewers moved to the next section when there was a silence for 15 seconds. During the
speaking test, all the utterances were tape-recorded.
3.4 Analyses
This section consisted of four phases: transcription of utterances, coding to compute
speaking performance measures, scoring of the speaking test, and procedure for hypothesis
testing.
3.4.1 Transcription of utterances
Utterances from the speaking test were transcribed. When there was a 15 second-silence,
the utterances produced after the silence, if any, were not transcribed. When there was a
conversation between a student and an interviewer in the monologue tasks, the utterances were
not used for analysis. The transcription was done with a policy of listening to the talk
sympathetically by taking the context into consideration. After the utterances were transcribed
by the author, two graduate students who were majoring in applied linguistics checked them,
taking half each, and then the author checked them a second time. All words were used for
analysis rather than selecting a certain amount of text (e.g., the shortest text) because the volume
of the data was rather small. This study analyzed the data for each task separately because the
information from each task seemed more beneficial for future selection of measures.
3.4.2 Coding to compute speaking performance measures
For analysis using speaking performance measures, three monologic tasks (Tasks 1, 4, and 5)
designed to elicit long utterances were utilized. The other two tasks only elicited
one-sentence-level utterances (e.g., Good bye., What time is it now?; see Table 3, for all the
elicited responses) and it was not common to use speaking performance measures for such short
utterances.
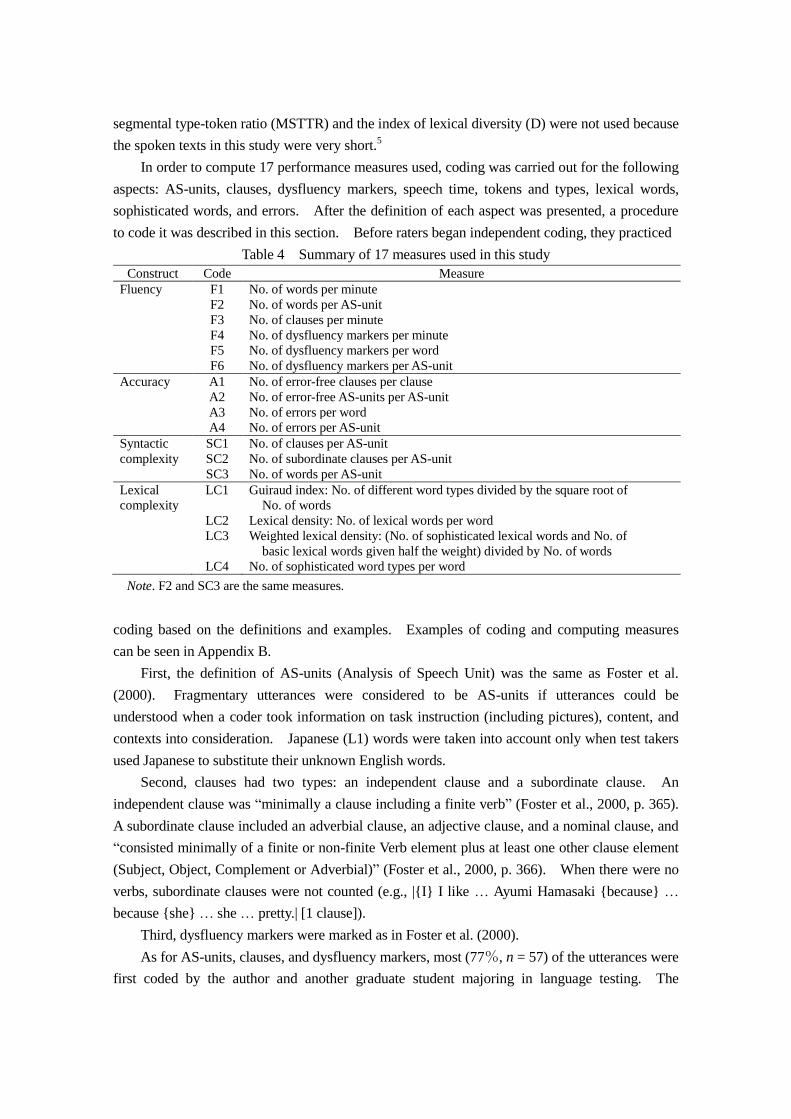
As in Table 4, 17 measures (six for fluency, four for accuracy, three for syntactic complexity,
and four for lexical complexity) were used in this study. The criteria for selecting measures
were as follows. The fluency measures using pauses were not used because a specialized tool
was necessary for strict measurement (Griffiths, 1991). Three types of dysfluency markers (i.e.,
functionless repetitions, self-corrections, and false starts) for F4, F5, and F6 were combined and
used as in Takiguchi (2003) because they were considered to assess similar aspects of fluency
since there were relatively strong associations (r = .60- .87; Skehan & Foster, 1999) between
different types of dyfluency markers (i.e., repetitions, false-starts, reformulations, and
replacement). The reason specific measures of accuracy were not examined was that three tasks
did not have target language structures as in Takiguchi (2003) and that Fujimori (2004) showed
that there were high correlations between specific measures and general measures of accuracy (r
= .73- .74). LC1 was selected rather than type token ratio (TTR) because LC1 was devised to
reduce the problem of type token ratio being influenced by text length (e.g., Daller et al., 2003;
Wolfe-Quintero et al., 1998) by “rewarding the presence of many types in a longer composition,
despite the increased repetition of those types” (Wolfe-Quintero et al., 1998, p. 107). Mean
segmental type-token ratio (MSTTR) and the index of lexical diversity (D) were not used because
the spoken texts in this study were very short.5
In order to compute 17 performance measures used, coding was carried out for the following
aspects: AS-units, clauses, dysfluency markers, speech time, tokens and types, lexical words,
sophisticated words, and errors. After the definition of each aspect was presented, a procedure
to code it was described in this section. Before raters began independent coding, they practiced
Table 4 Summary of 17 measures used in this study
Construct Code Measure
Fluency F1 No. of words per minute
F2 No. of words per AS-unit
F3 No. of clauses per minute
F4 No. of dysfluency markers per minute
F5 No. of dysfluency markers per word
F6 No. of dysfluency markers per AS-unit
Accuracy A1 No. of error-free clauses per clause
A2 No. of error-free AS-units per AS-unit
A3 No. of errors per word
A4 No. of errors per AS-unit
Syntactic SC1 No. of clauses per AS-unit
complexity SC2 No. of subordinate clauses per AS-unit
SC3 No. of words per AS-unit
Lexical
complexity
LC1 Guiraud index: No. of different word types divided by the square root of
No. of words
LC2 Lexical density: No. of lexical words per word
LC3 Weighted lexical density: (No. of sophisticated lexical words and No. of
basic lexical words given half the weight) divided by No. of words
LC4 No. of sophisticated word types per word
Note. F2 and SC3 are the same measures.
coding based on the definitions and examples. Examples of coding and computing measures
can be seen in Appendix B.
First, the definition of AS-units (Analysis of Speech Unit) was the same as Foster et al.
(2000). Fragmentary utterances were considered to be AS-units if utterances could be
understood when a coder took information on task instruction (including pictures), content, and
contexts into consideration. Japanese (L1) words were taken into account only when test takers
used Japanese to substitute their unknown English words.
Second, clauses had two types: an independent clause and a subordinate clause. An
independent clause was “minimally a clause including a finite verb” (Foster et al., 2000, p. 365).
A subordinate clause included an adverbial clause, an adjective clause, and a nominal clause, and
“consisted minimally of a finite or non-finite Verb element plus at least one other clause element
(Subject, Object, Complement or Adverbial)” (Foster et al., 2000, p. 366). When there were no
verbs, subordinate clauses were not counted (e.g., |{I} I like … Ayumi Hamasaki {because} …
because {she} … she … pretty.| [1 clause]).
Third, dysfluency markers were marked as in Foster et al. (2000).
As for AS-units, clauses, and dysfluency markers, most (77%, n = 57) of the utterances were
first coded by the author and another graduate student majoring in language testing. The
interrater reliability of AS-units was very high (r = .99, p < .01). When there were
disagreements, they discussed the differences until they reached an agreement, and the result was
used as the final coding. There were no inconsistent codings regarding clauses and dysfluency
markers between the author and the other rater. Since the definitions and coding systems were
considered to be established, the rest of the utterances were judged by the author.
Fourth, speech time was calculated twice by the author with a stopwatch. Time was
calculated from when students started speaking to when they stopped speaking (i.e., to the last
word before they produced a silence of 15 seconds) or until 90 seconds had passed. The
intrarater reliability was very high for all tasks (r = .99, p < .01).
Fifth, tokens, which are called “words” in this study, were pruned tokens after dysfluency
markers were excluded. Types were counted based on lemma as in Daller et al. (2003). That
is, base form and inflected forms were considered to be the same type. For example, the
following were considered to one type: play, plays, playing; be, is, am, are, was, were, been; Taro,
Taro’s.
Sixth, the definitions of lexical words and grammatical words were based on O’Loughlin
(2001). Lexical words were content words and grammatical words were function words (e.g.,
all forms of be, do, have and auxiliaries). However, some modifications were made from
O’Loughlin (2001) as follows. Firstly, O’Loughlin (2001) used “an item” as a unit whereas this
study used “one word” as a basic unit in order to be consistent with counting methods of types
and tokens. Therefore, lexicalized clauses (e.g., I mean), meta-talk (e.g., the point is) were
counted individually. Secondly, while contractions were counted as two items in O’Loughlin
(2001; e.g., they’re was counted as two items), this study counted the contractions as one word
and judged whether they were lexical or grammatical based on the words before the apostrophe
(e.g., they’re as grammatical and let’s as lexical). Third, O’Loughlin (2001, p. 107) counted
“repetition of low frequency lexical items … including alternate word forms of the same items
(e.g., study, student)” as high frequency words a second time. In contrast, this study took lemma
count and examined the words independently and individually without considering repetitions.
The judgment of lexical and grammatical words from all the three tasks was conducted by
the author and another rater who were majoring in applied linguistics. The interrater reliability
was very high (r = .99, p < .01). When there were disagreements, they discussed and came to an
agreement, which was utilized as the final coding.
Seventh, sophisticated words in this study were words not in the list of 1250 words in the
JACET List of 8000 Basic Words (JACET Basic Words Revision Committee, 2003), which uses
lemma count. Proper nouns and Japanese words were excluded from the list of sophisticated
words.6 The criterion of beyond 1250 words was used because lower secondary school students
were supposed to learn about 900 or 1000 words (Ministry of Education, Science & Culture,
1989, 1999). JACET 8000 Level Marker (Shimizu, 2005) was used for coding.
Eighth, errors included both major and minor errors and they were judged by a targetlike
criterion. Discourse errors in terms of coherence were not considered because the tasks were
not intended to elicit such aspects. Errors from all the three tasks were coded by the author, and
two graduate students who were majoring in applied linguistics examined the transcription, each
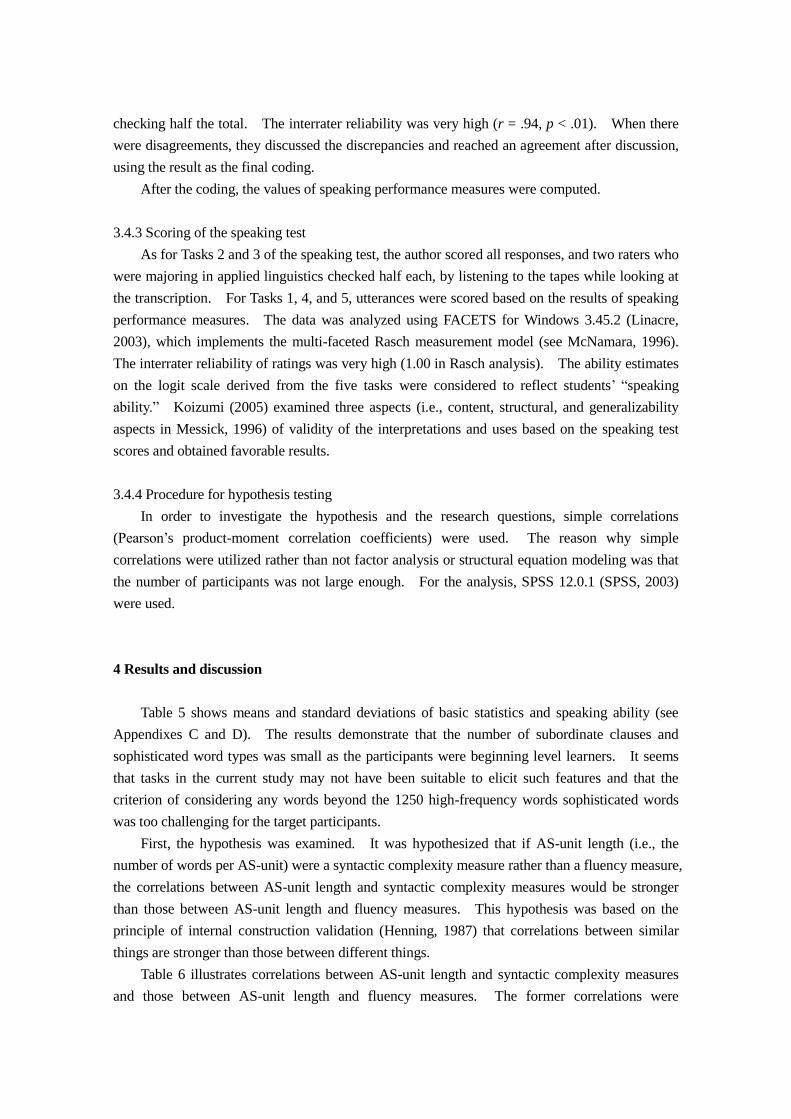
checking half the total. The interrater reliability was very high (r = .94, p < .01). When there
were disagreements, they discussed the discrepancies and reached an agreement after discussion,
using the result as the final coding.
After the coding, the values of speaking performance measures were computed.
3.4.3 Scoring of the speaking test
As for Tasks 2 and 3 of the speaking test, the author scored all responses, and two raters who
were majoring in applied linguistics checked half each, by listening to the tapes while looking at
the transcription. For Tasks 1, 4, and 5, utterances were scored based on the results of speaking
performance measures. The data was analyzed using FACETS for Windows 3.45.2 (Linacre,
2003), which implements the multi-faceted Rasch measurement model (see McNamara, 1996).
The interrater reliability of ratings was very high (1.00 in Rasch analysis). The ability estimates
on the logit scale derived from the five tasks were considered to reflect students’ “speaking
ability.” Koizumi (2005) examined three aspects (i.e., content, structural, and generalizability
aspects in Messick, 1996) of validity of the interpretations and uses based on the speaking test
scores and obtained favorable results.
3.4.4 Procedure for hypothesis testing
In order to investigate the hypothesis and the research questions, simple correlations
(Pearson’s product-moment correlation coefficients) were used. The reason why simple
correlations were utilized rather than not factor analysis or structural equation modeling was that
the number of participants was not large enough. For the analysis, SPSS 12.0.1 (SPSS, 2003)
were used.
4 Results and discussion
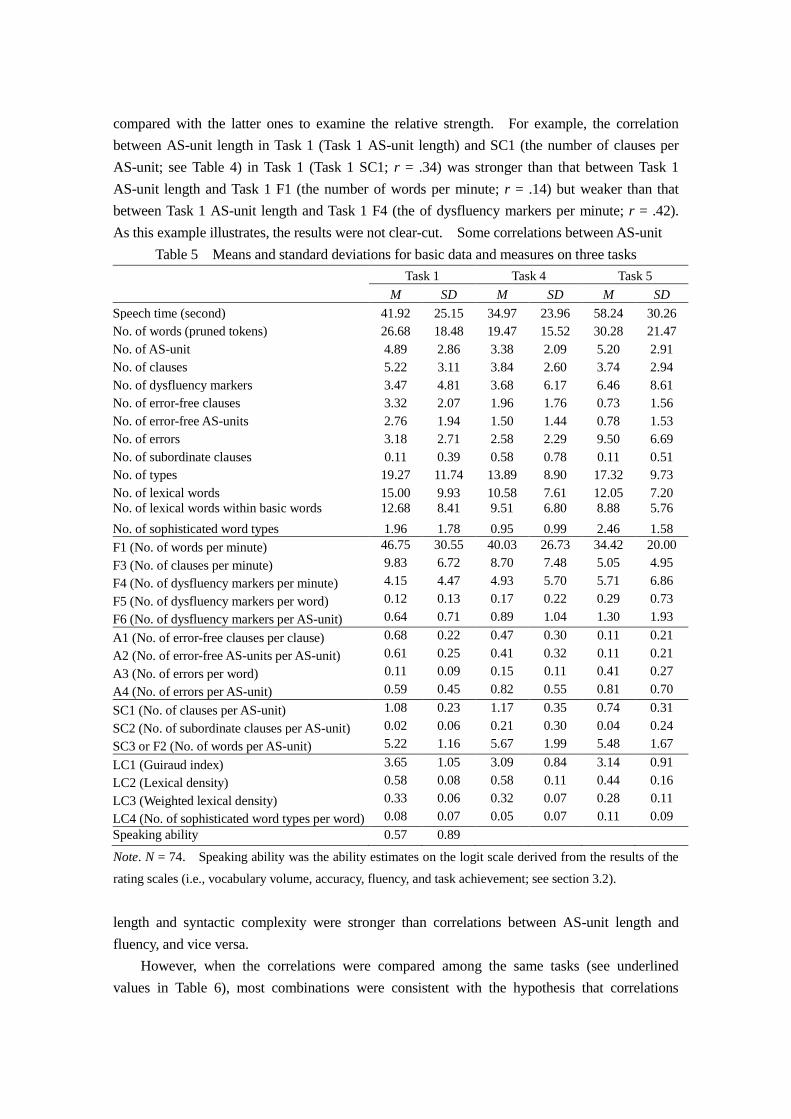
Table 5 shows means and standard deviations of basic statistics and speaking ability (see
Appendixes C and D). The results demonstrate that the number of subordinate clauses and
sophisticated word types was small as the participants were beginning level learners. It seems
that tasks in the current study may not have been suitable to elicit such features and that the
criterion of considering any words beyond the 1250 high-frequency words sophisticated words
was too challenging for the target participants.
First, the hypothesis was examined. It was hypothesized that if AS-unit length (i.e., the
number of words per AS-unit) were a syntactic complexity measure rather than a fluency measure,
the correlations between AS-unit length and syntactic complexity measures would be stronger
than those between AS-unit length and fluency measures. This hypothesis was based on the
principle of internal construction validation (Henning, 1987) that correlations between similar
things are stronger than those between different things.
Table 6 illustrates correlations between AS-unit length and syntactic complexity measures
and those between AS-unit length and fluency measures. The former correlations were
compared with the latter ones to examine the relative strength. For example, the correlation
between AS-unit length in Task 1 (Task 1 AS-unit length) and SC1 (the number of clauses per
AS-unit; see Table 4) in Task 1 (Task 1 SC1; r = .34) was stronger than that between Task 1
AS-unit length and Task 1 F1 (the number of words per minute; r = .14) but weaker than that
between Task 1 AS-unit length and Task 1 F4 (the of dysfluency markers per minute; r = .42).
As this example illustrates, the results were not clear-cut. Some correlations between AS-unit
Table 5 Means and standard deviations for basic data and measures on three tasks
Task 1 Task 4 Task 5
M SD M SD M SD
Speech time (second) 41.92 25.15 34.97 23.96 58.24 30.26
No. of words (pruned tokens) 26.68 18.48 19.47 15.52 30.28 21.47
No. of AS-unit 4.89 2.86 3.38 2.09 5.20 2.91
No. of clauses 5.22 3.11 3.84 2.60 3.74 2.94
No. of dysfluency markers 3.47 4.81 3.68 6.17 6.46 8.61
No. of error-free clauses 3.32 2.07 1.96 1.76 0.73 1.56
No. of error-free AS-units 2.76 1.94 1.50 1.44 0.78 1.53
No. of errors 3.18 2.71 2.58 2.29 9.50 6.69
No. of subordinate clauses 0.11 0.39 0.58 0.78 0.11 0.51
No. of types 19.27 11.74 13.89 8.90 17.32 9.73
No. of lexical words 15.00 9.93 10.58 7.61 12.05 7.20
No. of lexical words within basic words 12.68 8.41 9.51 6.80 8.88 5.76
No. of sophisticated word types 1.96 1.78 0.95 0.99 2.46 1.58
F1 (No. of words per minute) 46.75 30.55 40.03 26.73 34.42 20.00
F3 (No. of clauses per minute) 9.83 6.72 8.70 7.48 5.05 4.95
F4 (No. of dysfluency markers per minute) 4.15 4.47 4.93 5.70 5.71 6.86
F5 (No. of dysfluency markers per word) 0.12 0.13 0.17 0.22 0.29 0.73
F6 (No. of dysfluency markers per AS-unit) 0.64 0.71 0.89 1.04 1.30 1.93
A1 (No. of error-free clauses per clause) 0.68 0.22 0.47 0.30 0.11 0.21
A2 (No. of error-free AS-units per AS-unit) 0.61 0.25 0.41 0.32 0.11 0.21
A3 (No. of errors per word) 0.11 0.09 0.15 0.11 0.41 0.27
A4 (No. of errors per AS-unit) 0.59 0.45 0.82 0.55 0.81 0.70
SC1 (No. of clauses per AS-unit) 1.08 0.23 1.17 0.35 0.74 0.31
SC2 (No. of subordinate clauses per AS-unit) 0.02 0.06 0.21 0.30 0.04 0.24
SC3 or F2 (No. of words per AS-unit) 5.22 1.16 5.67 1.99 5.48 1.67
LC1 (Guiraud index) 3.65 1.05 3.09 0.84 3.14 0.91
LC2 (Lexical density) 0.58 0.08 0.58 0.11 0.44 0.16
LC3 (Weighted lexical density) 0.33 0.06 0.32 0.07 0.28 0.11
LC4 (No. of sophisticated word types per word) 0.08 0.07 0.05 0.07 0.11 0.09
Speaking ability 0.57 0.89
Note. N = 74. Speaking ability was the ability estimates on the logit scale derived from the results of the
rating scales (i.e., vocabulary volume, accuracy, fluency, and task achievement; see section 3.2).
length and syntactic complexity were stronger than correlations between AS-unit length and
fluency, and vice versa.
However, when the correlations were compared among the same tasks (see underlined
values in Table 6), most combinations were consistent with the hypothesis that correlations
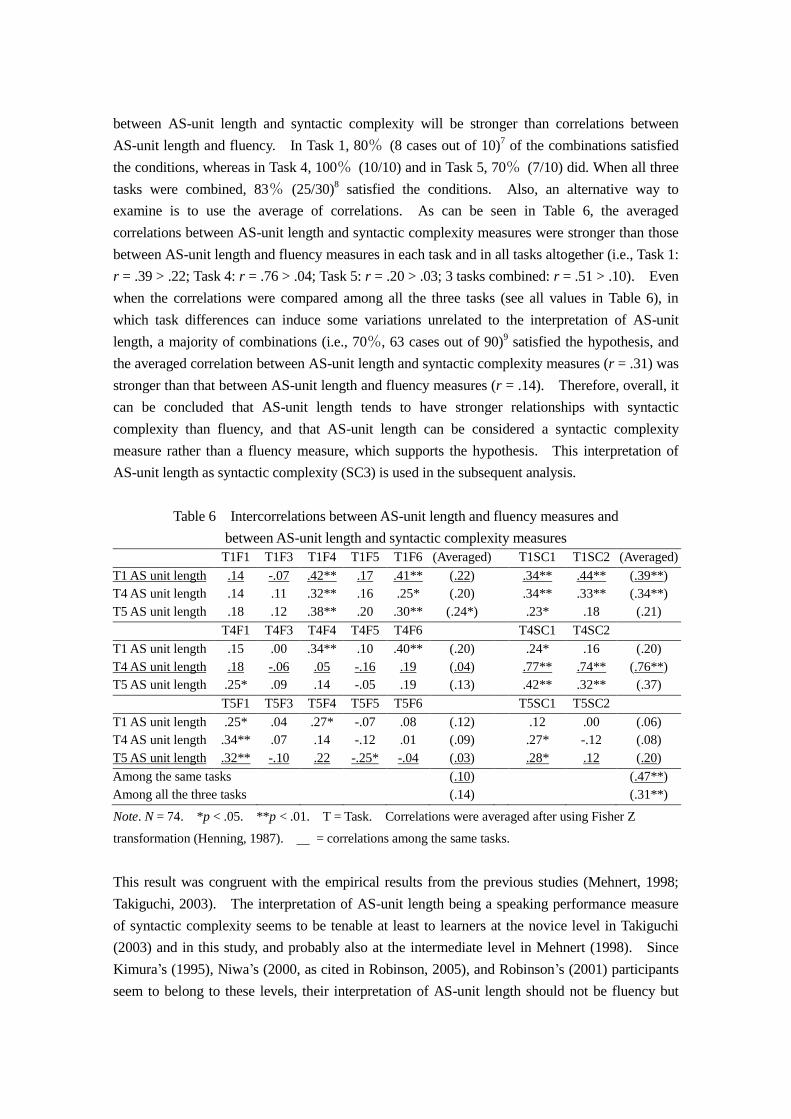
between AS-unit length and syntactic complexity will be stronger than correlations between
AS-unit length and fluency. In Task 1, 80% (8 cases out of 10)7 of the combinations satisfied
the conditions, whereas in Task 4, 100% (10/10) and in Task 5, 70% (7/10) did. When all three
tasks were combined, 83% (25/30)8 satisfied the conditions. Also, an alternative way to
examine is to use the average of correlations. As can be seen in Table 6, the averaged
correlations between AS-unit length and syntactic complexity measures were stronger than those
between AS-unit length and fluency measures in each task and in all tasks altogether (i.e., Task 1:
r = .39 > .22; Task 4: r = .76 > .04; Task 5: r = .20 > .03; 3 tasks combined: r = .51 > .10). Even
when the correlations were compared among all the three tasks (see all values in Table 6), in
which task differences can induce some variations unrelated to the interpretation of AS-unit
length, a majority of combinations (i.e., 70%, 63 cases out of 90)9 satisfied the hypothesis, and
the averaged correlation between AS-unit length and syntactic complexity measures (r = .31) was
stronger than that between AS-unit length and fluency measures (r = .14). Therefore, overall, it
can be concluded that AS-unit length tends to have stronger relationships with syntactic
complexity than fluency, and that AS-unit length can be considered a syntactic complexity
measure rather than a fluency measure, which supports the hypothesis. This interpretation of
AS-unit length as syntactic complexity (SC3) is used in the subsequent analysis.
Table 6 Intercorrelations between AS-unit length and fluency measures and
between AS-unit length and syntactic complexity measures
T1F1 T1F3 T1F4 T1F5 T1F6 (Averaged) T1SC1 T1SC2 (Averaged)
T1 AS unit length .14 -.07 .42** .17 .41** (.22) .34** .44** (.39**)
T4 AS unit length .14 .11 .32** .16 .25* (.20) .34** .33** (.34**)
T5 AS unit length .18 .12 .38** .20 .30** (.24*) .23* .18 (.21)
T4F1 T4F3 T4F4 T4F5 T4F6 T4SC1 T4SC2
T1 AS unit length .15 .00 .34** .10 .40** (.20) .24* .16 (.20)
T4 AS unit length .18 -.06 .05 -.16 .19 (.04) .77** .74** (.76**)
T5 AS unit length .25* .09 .14 -.05 .19 (.13) .42** .32** (.37)
T5F1 T5F3 T5F4 T5F5 T5F6 T5SC1 T5SC2
T1 AS unit length .25* .04 .27* -.07 .08 (.12) .12 .00 (.06)
T4 AS unit length .34** .07 .14 -.12 .01 (.09) .27* -.12 (.08)
T5 AS unit length .32** -.10 .22 -.25* -.04 (.03) .28* .12 (.20)
Among the same tasks (.10) (.47**)
Among all the three tasks (.14) (.31**)
Note. N = 74. *p < .05. **p < .01. T = Task. Correlations were averaged after using Fisher Z
transformation (Henning, 1987). = correlations among the same tasks.
This result was congruent with the empirical results from the previous studies (Mehnert, 1998;
Takiguchi, 2003). The interpretation of AS-unit length being a speaking performance measure
of syntactic complexity seems to be tenable at least to learners at the novice level in Takiguchi
(2003) and in this study, and probably also at the intermediate level in Mehnert (1998). Since
Kimura’s (1995), Niwa’s (2000, as cited in Robinson, 2005), and Robinson’s (2001) participants
seem to belong to these levels, their interpretation of AS-unit length should not be fluency but
syntactic complexity. One caution should be made that the present result only concerns the
interpretation of AS-unit length and probably this result can be extended to T-unit length or c-unit
length because these units are very similar to AS-units. However, this result may not be
applicable to the length of other units, especially units mainly related to pauses or dysfluency
markers, such as pausally defined units (e.g., Lennon, 1990b). There is a possibility that “the
number of words per pausally defined unit” reflects fluency because in Mehnert (1998), “the
number of syllables per pausally defined unit” loaded on the general fluency factor. In addition,
the meaning of T-unit length in writing as in Wolfe-Quintero et al. (1998) also needs to be
investigated in future research. What should be emphasized at this point is that the argument by
Wolfe-Quintero et al. (1998, p. 15) that a measure belongs to a certain construct that is reflected
in the numerator of the measure and that the denominator “indicates only the context for the
measure …, not the type of measure it is” is not tenable at least for beginning level learners’
speaking. The interpretation of AS-unit length (i.e., “the number of words” divided by “the
number of AS-units”) as syntactic complexity implies that the denominator “the number of
AS-units” affects the interpretation of syntactic complexity more than the numerator “the number
of words.”
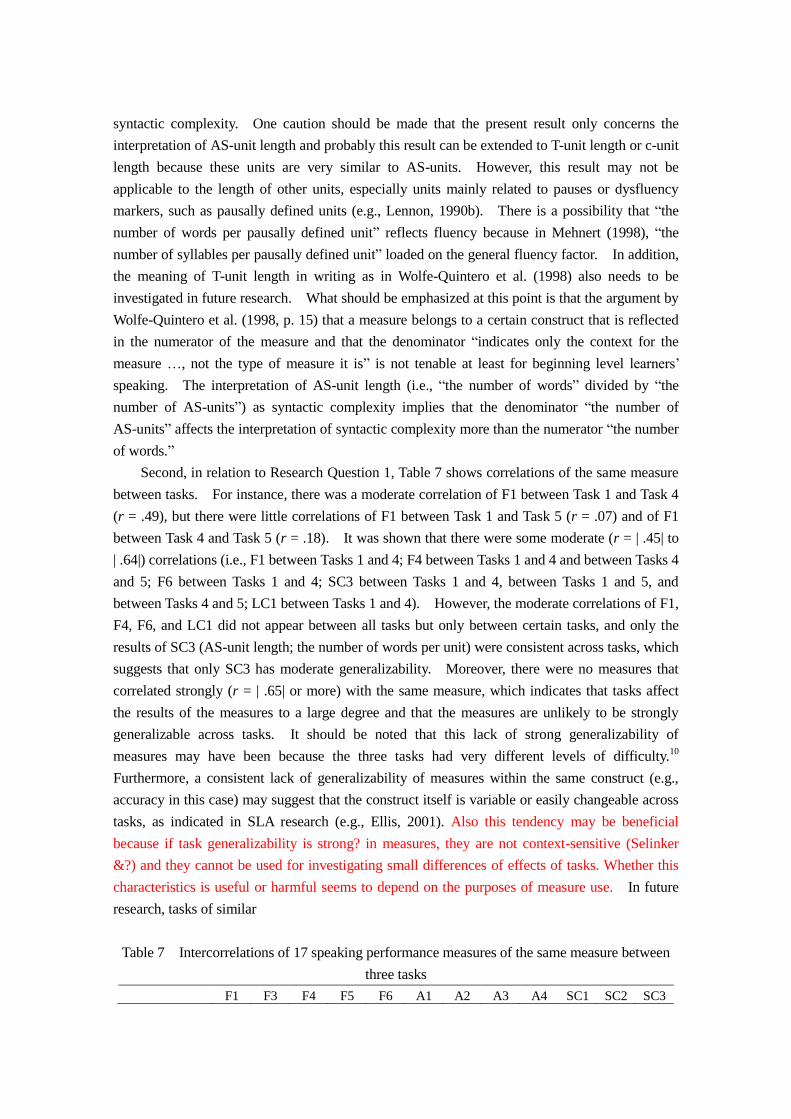
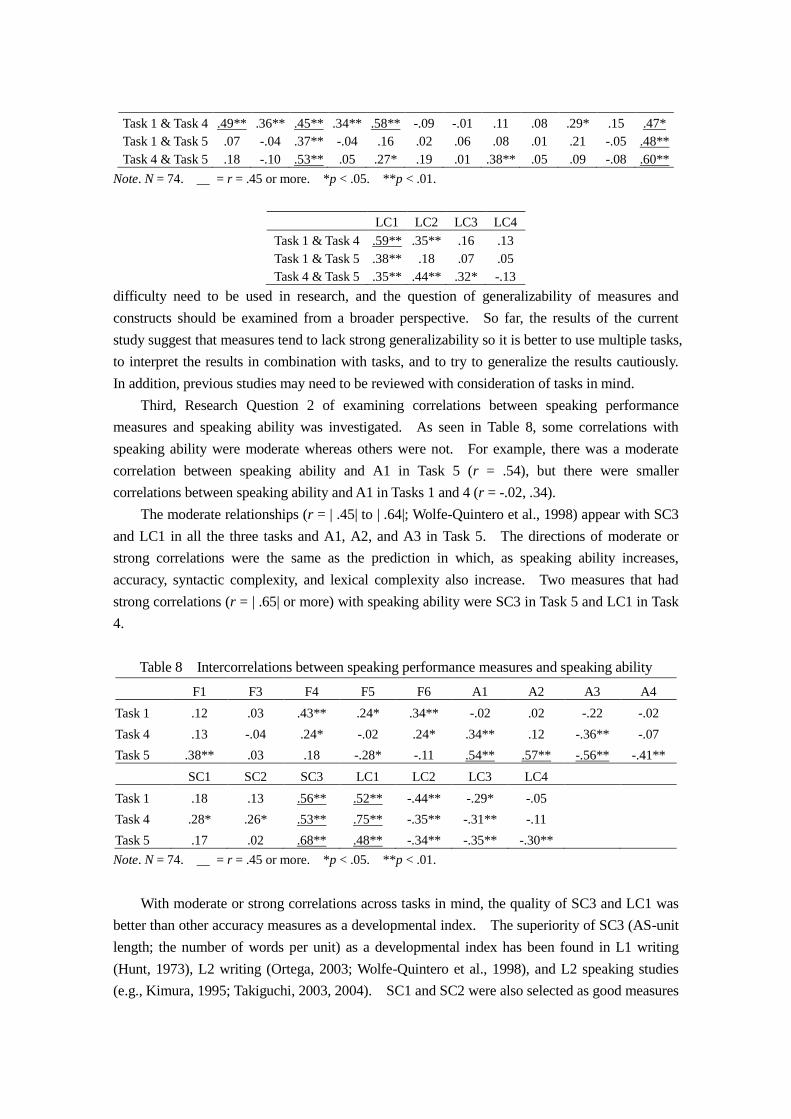
Second, in relation to Research Question 1, Table 7 shows correlations of the same measure
between tasks. For instance, there was a moderate correlation of F1 between Task 1 and Task 4
(r = .49), but there were little correlations of F1 between Task 1 and Task 5 (r = .07) and of F1
between Task 4 and Task 5 (r = .18). It was shown that there were some moderate (r = | .45| to
| .64|) correlations (i.e., F1 between Tasks 1 and 4; F4 between Tasks 1 and 4 and between Tasks 4
and 5; F6 between Tasks 1 and 4; SC3 between Tasks 1 and 4, between Tasks 1 and 5, and
between Tasks 4 and 5; LC1 between Tasks 1 and 4). However, the moderate correlations of F1,
F4, F6, and LC1 did not appear between all tasks but only between certain tasks, and only the
results of SC3 (AS-unit length; the number of words per unit) were consistent across tasks, which
suggests that only SC3 has moderate generalizability. Moreover, there were no measures that
correlated strongly (r = | .65| or more) with the same measure, which indicates that tasks affect
the results of the measures to a large degree and that the measures are unlikely to be strongly
generalizable across tasks. It should be noted that this lack of strong generalizability of
measures may have been because the three tasks had very different levels of difficulty.10
Furthermore, a consistent lack of generalizability of measures within the same construct (e.g.,
accuracy in this case) may suggest that the construct itself is variable or easily changeable across
tasks, as indicated in SLA research (e.g., Ellis, 2001). Also this tendency may be beneficial
because if task generalizability is strong? in measures, they are not context-sensitive (Selinker
&?) and they cannot be used for investigating small differences of effects of tasks. Whether this
characteristics is useful or harmful seems to depend on the purposes of measure use. In future
research, tasks of similar
Table 7 Intercorrelations of 17 speaking performance measures of the same measure between
three tasks
F1 F3 F4 F5 F6 A1 A2 A3 A4 SC1 SC2 SC3
Task 1 & Task 4 .49** .36** .45** .34** .58** -.09 -.01 .11 .08 .29* .15 .47*
Task 1 & Task 5 .07 -.04 .37** -.04 .16 .02 .06 .08 .01 .21 -.05 .48**
Task 4 & Task 5 .18 -.10 .53** .05 .27* .19 .01 .38** .05 .09 -.08 .60**
Note. N = 74. = r = .45 or more. *p < .05. **p < .01.
LC1 LC2 LC3 LC4
Task 1 & Task 4 .59** .35** .16 .13
Task 1 & Task 5 .38** .18 .07 .05
Task 4 & Task 5 .35** .44** .32* -.13
difficulty need to be used in research, and the question of generalizability of measures and
constructs should be examined from a broader perspective. So far, the results of the current
study suggest that measures tend to lack strong generalizability so it is better to use multiple tasks,
to interpret the results in combination with tasks, and to try to generalize the results cautiously.
In addition, previous studies may need to be reviewed with consideration of tasks in mind.
Third, Research Question 2 of examining correlations between speaking performance
measures and speaking ability was investigated. As seen in Table 8, some correlations with
speaking ability were moderate whereas others were not. For example, there was a moderate
correlation between speaking ability and A1 in Task 5 (r = .54), but there were smaller
correlations between speaking ability and A1 in Tasks 1 and 4 (r = -.02, .34).
The moderate relationships (r = | .45| to | .64|; Wolfe-Quintero et al., 1998) appear with SC3
and LC1 in all the three tasks and A1, A2, and A3 in Task 5. The directions of moderate or
strong correlations were the same as the prediction in which, as speaking ability increases,
accuracy, syntactic complexity, and lexical complexity also increase. Two measures that had
strong correlations (r = | .65| or more) with speaking ability were SC3 in Task 5 and LC1 in Task
4.
Table 8 Intercorrelations between speaking performance measures and speaking ability
F1 F3 F4 F5 F6 A1 A2 A3 A4
Task 1 .12 .03 .43** .24* .34** -.02 .02 -.22 -.02
Task 4 .13 -.04 .24* -.02 .24* .34** .12 -.36** -.07
Task 5 .38** .03 .18 -.28* -.11 .54** .57** -.56** -.41**
SC1 SC2 SC3 LC1 LC2 LC3 LC4
Task 1 .18 .13 .56** .52** -.44** -.29* -.05
Task 4 .28* .26* .53** .75** -.35** -.31** -.11
Task 5 .17 .02 .68** .48** -.34** -.35** -.30**
Note. N = 74. = r = .45 or more. *p < .05. **p < .01.
With moderate or strong correlations across tasks in mind, the quality of SC3 and LC1 was
better than other accuracy measures as a developmental index. The superiority of SC3 (AS-unit
length; the number of words per unit) as a developmental index has been found in L1 writing
(Hunt, 1973), L2 writing (Ortega, 2003; Wolfe-Quintero et al., 1998), and L2 speaking studies
(e.g., Kimura, 1995; Takiguchi, 2003, 2004). SC1 and SC2 were also selected as good measures
of writing development in Wolfe-Quintero et al. (1998), but limited evidence was found in the
current study. This may come from the fact that the learners in this study only produced a
limited number of clauses (Task 1: M = 5.22, SD = 3.11; Task 4: M = 3.84, SD = 2.60; Task 5: M
= 3.74, SD = 2.94) and subordinate clauses (Task 1: M = 0.11, SD = 0.39; Task 4: M = 0.58, SD =
0.78; Task 5: M = 0.11, SD = 0.51). This is in line with the argument in Fujimori (2002) that
when beginners or pre-intermediate learners who do not use clauses and subordinate clauses are
the targets, the use of clauses and subordinate clauses as measures is not appropriate.
LC1 (Guiraud index; the number of different word types divided by the square root of the
number of words) satisfied the criteria as a developmental index, which is consistent with other
studies in L2 writing (Wolfe-Quintero et al., 1998) and L1 and L2 speaking (Daller et al., 2003;
Vermeer, 2000).
A1 (the number of error-free clauses per clause) and A2 (the number of error-free units per
unit), and A3 (the number of errors per word) were associated with speaking ability moderately
only in Task 5. In previous studies, after the comparison with other accuracy measures, Mehnert
(1998, p. 105) argues that the “number of errors [A3] seems to be an … more sensitive measure
than error-free clauses [A1], at least for learners of German at the early-intermediate level,” but
the current results indicate that A1 and A3 are similar in terms of relationships with speaking
ability. The reason why only Task 5 revealed relationships between accuracy and speaking
ability might be that the content of the speech was not provided in Tasks 1 and 4 whereas it was
provided in Task 5, and/or that Task 5 was the most difficult, whereas Task 4 was of average
difficulty and Task 1 was the easiest.10
For these reasons, Task 5 seems to have elicited
diversified performance and gave varied results of speaking performance measures of accuracy.
The results of this study may suggest that A1, A2, and A3 derived from some tasks can be used as
indicators of speaking ability.
On the whole, the measures consistently selected as appropriate developmental indices for
beginning level learners of English were syntactic complexity (SC3) and lexical complexity
(LC1), which are consistently associated with speaking ability. In other words, those who can
speak longer AS-units (more words per AS-unit) and use more word types (more word types
divided by the square root of the number of words) are likely to have higher speaking ability or
proficiency.11
Fluency and accuracy, on the other hand, seem to be more affected by factors
other than speaking ability, such as task characteristics, where attention is directed, and how
utterances are produced. The relative effects of many factors on fluency, accuracy, syntactic
complexity, and lexical complexity are a very interesting topic to be pursued in the future.
5 Conclusions
The purposes of this study were to investigate, among beginning level learners of English,
(a) whether AS-unit length (the number of words per AS-unit) indicates fluency or syntactic
complexity, and (b) what speaking performance measures of fluency, accuracy, syntactic
complexity, and lexical complexity can be generalizable across tasks, and (c) what speaking
performance measures can be used as indicators of speaking ability. The result of the first
question (Hypothesis) suggests that the averaged correlations between AS-unit length and
syntactic complexity measures were stronger than those between AS unit length and fluency
measures, so AS-unit length tends to mean syntactic complexity.
As for the second question (Research Question 1), this study found some moderate (r = | .45|
to | .64|) correlations (i.e., F1 between Tasks 1 and 4; F4 between Tasks 1 and 4 and between
Tasks 4 and 5; F6 between Tasks 1 and 4; SC3 between Tasks 1 and 4, between Tasks 1 and 5,
and between Tasks 4 and 5; LC1 between Tasks 1 and 4) and that SC3 (AS-unit length; the
number of words per AS-unit) is moderately generalizable across tasks. However, there were no
measures that correlated strongly (r = | .65| or more) with the same measure, so all measures were
found to lack strong generalizability across tasks. Therefore, the use of multiple tasks and the
interpretation of results in combination with tasks are recommended.
Concerning the third question (Research Question 2), it was found that two measures,
AS-unit length (SC3) and Guiraud index (LC1; the number of different word types divided by the
square root of the number of words), consistently have moderate or strong relationships with
speaking ability across tasks, which suggests that the two measures can be used as developmental
indices in L2 speaking studies, at least for beginners. Additionally, A1 (the number of error-free
clauses per clause), A2 (the number of error-free AS-units per AS-unit), and A3 (the number of
errors per word) derived from some tasks may be used as indicators of speaking ability. It
should be noted that since the correlations between these measures and speaking ability are not
perfect, they can only be used as indicators of speaking ability. This result can be used in
selecting appropriate measures to assess development in speaking ability for beginning level
learners for research and educational purposes. For the former purpose, the selection of
appropriate measures can enhance the interpretations of the results and advance relevant research.
For the latter purpose, the measures can also be used for giving feedback on progress in
proficiency to students and teachers.
In order to extend the findings of this study for generalization, further research needs to be
conducted as follows. First, longitudinal studies with learners with a wider variety of
proficiency should be conducted using more types of task (e.g., dialogues) because this study
dealt only with beginning level learners with the data collected cross-sectionally using three tasks.
Second, measures that were not investigated in the current study need to be researched (e.g.,
Index of lexical diversity [D] for the lexical complexity) from more perspectives (e.g.,
correlations with a proficiency test score; generalizability theory, Shavelson & Webb, 1991).
Although meta-analysis was not attempted in this study because the number of previous studies is
rather limited, it will be of value in the future.
Acknowledgements
This research was supported in part by a grant from the Japan Language Testing Association
(JLTA). An earlier version of this paper was presented at the 26th Language Testing Research
Colloquium on March 26, 2004, at Temecula, CA and at the Japan Society of English Language
Education on August 7, 2004 at Nagano, Japan. I am grateful to Professor Akihiko Mochizuki,
Professor Miyoko Kobayashi, Professor Hidetoshi Saito, Ms. Chihiro Fujimori, Mr. Hitoshi
Takiguchi, Mr. Yo In’nami, and four anonymous reviewers for their valuable comments.
Notes
1Guiraud index, which was proposed by Guiraud (1960), is “essentially” identical to the
number of different word types divided by the square root of two times the number of words
(Malvern, Richards, Chipere, & Durán, 2004, p. 26). 2
M (speaking ability of the excluded pariticipants) = -0.07 (on the average), SD = 1.66. 3
M (speaking ability of the excluded pariticipants) = -0.55 (below the average), SD = 0.75.
Their mean was very low and lower than the mean of speaking ability of Smattering or below (M
= -0.28). 4
An example of proficiency descriptors at the Smattering level is “Can use some basic
greetings; can say thank you, sorry” and an example at the Waystage Plus level is “Can interact
with reasonable ease in structured situations and short conversations, provided the other person
helps if necessary” (North, 2000, pp. 274-275). North’s proficiency scale was used as the basis
of the Common Reference Levels of Common European Framework (Council of Europe, 2001).
In the Common Reference Levels, most of the participants in this study belonged to the level of
basic users or below. 5
The software requires at least 50 words to compute D (Malvern & Richards, 2002). 6
The correlation was very high between sophisticated words with proper nouns and Japanese
words and ones without (r = .93, p < .01).
7For each task, there are ten combinations: (a) “AS-unit length [ASL] and F1” and “ASL and
SC1,” (b) “ASL and F1” and “ASL and SC2,” (c) “ASL and F3” and “ASL and SC1,” (d) “ASL
and F3” and “ASL and SC2,” (e) “ASL and F4” and “ASL and SC1,” (f) “ASL and F4” and
“ASL and SC2,” (g) “ASL and F5” and “ASL and SC1,” (h) “ASL and F5” and “ASL and SC2,”
(i) “ASL and F6” and “ASL and SC1,” (j) “ASL and F6” and “ASL and SC2.”
810 (for each task) x 3 = 30.
910 (for each task) x 3 x 3 = 90.
10
Task 5 was the most difficult (1.11 on the logit scale with a mean of 0), with Task 4 being
of average difficulty (-0.06) and Task 1 being the easiest (-1.16; see Koizumi, 2005, for details).
11
As Wolfe-Quintero et al. (1998) and one reviewer point out, there is controversy over
whether “proficiency” and “development” are the same construct and whether differences in
proficiency between similar proficiency levels can be considered to be differences in
developmental stages. Although the present study assumes that proficiency and development
are the same construct, this pivotal issue should be explored further.
References
Albert, Á., & Kormos, J. (2004). Creativity and narrative task performance: An exploratory
study. Language Learning, 54, 277-310.
Ano, K. (2002). Koukousei eigo gakushuusha no hatsuwa ni okeru ryuuchousa to seikakusa no
kankei [Relationship between fluency and accuracy in speaking of high school students
learning English]. STEP Bulletin, 14, 39-49.
Arevart, S., & Nation, P. (1991). Fluency improvement in a second language. RELC Journal,
84, 84-94.
Bygate, M. (1996). Effects of task repetition: Appraising the developing language of learners. In
J. Willis & D. Willis (Eds.), Challenge and change in language teaching (pp. 136-146).
Oxford, U.K.: Heinemann.
Bygate, M. (2001). Effects of task repetition on the structure and control of oral language. In M.
Bygate, P. Skehan, & M. Swain (Eds.), Researching pedagogic tasks: Second language
learning, teaching and testing (pp. 23-48). Essex, U.K.: Pearson Education Limited.
Council of Europe. (2001). Common European Framework of Reference for Languages:
Learning, teaching, assessment. Cambridge University Press.
Cucchiarini, C., Strik, H., & Boves, L. (2000). Quantitative assessment of second language
learners’ fluency by means of automatic speech recognition technology. Journal of the
Acoustical Society of America, 107, 989-999.
Daller, H., van Hout, R., & Treffers-Daller, J. (2003). Lexical richness in the spontaneous speech
of bilinguals. Applied Linguistics, 24, 197-222.
Dörnyei, Z. (1995). On the teachability of communication strategies. TESOL Quarterly, 29,
55-85.
Douglas, D. (1994). Quantity and quality in speaking test performance. Language Testing, 11,
125-144.
Egusa, C., & Yokoyama, Y. (2004a). Communication task ni okeru fukuzatsusa no sokutei
houhou ni tsuite: Tougoteki fukuzatusa to goiteki fukuzatusa no kousatsu [Measures of
complexity in communication tasks: Syntactic complexity and lexical complexity]. HELES
(The Hokkaido English Language Education Society) Journal, 4, 53-63.
Egusa, C., & Yokoyama, Y. (2004b). The effects of task types on second language speech
production among Japanese university students: Fluency, accuracy, complexity, and
trade-off effects. Annual Review of English Language Education in Japan, 15, 129-138.
Ellis, R. (2001). Some thoughts on testing grammar: An SLA perspective. In C. Elder, A. Brown,
E. Grove, K. Hill, N. Iwashita, T. Lumley, T. McNamara, & K. O’Loughlin (Eds.), Studies in
language testing 11: Experimenting with uncertainty: Essays in honour of Alan Davies (pp.
251-263). Cambridge University Press.
Ellis, R. (2003). Task-based language learning and teaching. Oxford University Press.
Ellis, R., & Barkhuizen, G. (2005). Analyzing learner language. Oxford University Press.
Engber, C. A. (1995). The relationship of lexical proficiency to the quality of ESL compositions.
Journal of Second Language Writing, 4, 139-155.
Foster, P. (1996). Doing the task better: How planning time influences students’ performance. In
J. Willis & D. Willis (Eds.), Challenge and change in language teaching (pp. 126-135).
Oxford, U.K.: Heinemann.
Foster, P. (2001). Rules and routines: A consideration of their role in the task-based language
production of native and non-native speakers. In M. Bygate, P. Skehan, & M. Swain (Eds.),
Researching pedagogic tasks: Second language learning, teaching and testing (pp. 75-93).
Essex, U.K.: Pearson Education Limited.
Foster, P., & Skehan, P. (1996). The influence of planning and task type on second language
performance. Studies in Second Language Acquisition, 18, 299-323.
Foster, P., Tonkyn, A., & Wigglesworth, G. (2000). Measuring spoken language: A unit for all
reasons. Applied Linguistics, 21, 354-375.
Freed, B. F. (2000). Is fluency, like beauty, in the eyes (and ears) of the beholder? In H.
Riggenbach (Ed.), Perspectives on fluency (pp. 243-265). Ann Arbor, MI: The University of
Michigan Press.
Freed, B. F., Segalowitz, N., & Dewey, D. P. (2004). Context of learning and second language
fluency in French: Comparing regular classroom, study abroad, and intensive domestic
immersion programs. Studies in Second Language Acquisition, 26, 275-301.
Fujimori, C. (2002). The effects of form-focused and meaning-focused pre-task activities on
accuracy, fluency and complexity in communicative tasks among Japanese senior high
school students. Unpublished master’s thesis, Joetsu University of Education.
Fujimori, C. (2004). Speech production no sokutei houhou: Seikakusa, ryuuchousa, fukuzatsusa
[Measures of speech production: Accuracy, fluency and complexity]. KATE
(Kanto-koshinetsu Association of Teachers of English) Bulletin, 18, 41-52.
Fulcher, G. (2003). Testing second language speaking. Essex, U.K.: Pearson Education Limited.
Gass, S., Mackey, A., Alvarez-Torres, M. J., & Fernández-García, M. (1999). The effects of task
repetition on linguisitic output. Language Learning, 49, 549-581.
Griffiths, R. (1991). Pausological research in an L2 context: A rationale, and review of selected
studies. Applied Linguistics, 12, 345-364.
Guiraud, P. (1960). Problèmes et méthodes de la statistique linguistique. Paris: Presses
Universitaires de France.
Henning, G. (1987). A guide to language testing. Boston, MA: Heinle Heinle.
Hunt, K. W. (1973). Recent measures in syntactic development. In M. Lester (Ed.), Readings in
applied transformational grammar (2nd ed., pp. 179-192). New York: Holt, Rinehart and
Winston.
Iwashita, N., McNamara, T., & Elder, C. (2001). Can we predict task difficulty in an oral
proficiency test? Exploring the potential of an information-processing approach to task
design. Language Learning, 51, 401-436.
Japan Association of College English Teachers (JACET) Basic Words Revision Committee
(Ed.). (2003). JACET List of 8000 Basic Words. Tokyo: JACET.
Kamimoto, T., & Kawauchi, C. (2000). The effects of repetition on EFL oral fluency: A
quantitative approach. Kumamoto Gakuen University Journal of Language and Literature,
13, 1-24.
Kawashima, T. (2004). Mensetsu houhou ga hatsuwa ni ataeru eikyou: Role play wo mochiita
kobetsu mensetsu houshiki to pair mensetsu houshiki no hikaku [Effects of Interview Types
on Utterances: Comparison between One-On-One Interview and Pair Interview Using Role
Plays]. STEP Bulletin, 16, 43-57.
Kawauchi, C. (1998). Cued/uncued oral narrative tasks in foreign language fluency. JACET
Bulletin, 29, 83-96.
Kawauchi, C. (2005). Pre-task planning in L2 oral performance: Quantitative and qualitative
approaches. Tokyo: Kinseido.
Kawauchi, C., & Kamimoto, T. (2000). Distinctive features of oral production by fluent and
nonfluent EFL learners. Language Laboratory, 37, 21-36.
Kawauchi, C., & Nagasawa, S. (2000). Developing second language proficiency in a study
abroad context. Bulletin of the Institute of Foreign Language Education Kurume University,
7, 49-79.
Kimura, Y. (1995). An analysis of English communicative competence of high school returnees
and non-returnees. Annual Review of English Language Education in Japan, 6, 123-133.
Koizumi, R. (2003). Development of a speaking test for Japanese junior high school students.
Unpublished master's thesis, University of Tsukuba.
Koizumi, R. (2005). Attainment levels of speaking ability of Japanese junior high school
students. Manuscript submitted for publication.
Koizumi, R., & Kurizaki, I. (2002). Nihonjin chuugakusei no monologue niokeru speaking no
tokuchou [Speaking characteristics of monologues given by Japanese junior high school
students]. Bulletin of the Kanto-Koshin-Etsu English Language Education Society, 16,
17-28.
Koizumi, R., & Yamanouchi, I. (2003). Nihonjin chuugakusei no speaking ability no hattatsu
[Development in speaking ability among Japanese junior high school students: Using
self-introduction task]. Bulletin of the Kanto-Koshin-Etsu English Language Education
Society, 17, 33-44.
Kormos, J. (2000). The timing of self-repairs in second language speech production. Studies in
Second Language Acquisition, 22, 145-167.
Kormos, J., & Dénes, M. (2004). Exploring measures and perceptions of fluency in the speech of
second language learners. System, 32, 145-164.
Kosuge, A. (2003). A longitudinal study of development in spoken performance by Japanese
junior high school students. Unpublished master's thesis, Tokyo Gakugei University, Japan.
Lennon, P. (1990a). The advanced learner at large in the L2 community: Developments in
spoken performance. IRAL (International Review of Applied Linguistics in Language
Teaching), 28, 309-324.
Lennon, P. (1990b). Investigating fluency in EFL: A qualitative approach. Language Learning,
40, 387-417.
Linacre, J. M. (2003). Facets: Rasch-measurement computer program (Version 3.45.2)
[Computer software]. Chicago: MESA Press.
Malvern, D., & Richards, B. (1997). A new measure of lexical diversity. In A. Ryan & A. Wray
(Eds.), Evolving models of language: Papers from the annual meeting of the British
Association for Applied Linguistics held at the University of Wales, Swansea, September
1996 (pp. 58-71). Clevedon, England: Multilingual Matters.
Malvern, D., & Richards, B. (2002). Investigating accommodation in language proficiency
interviews using a new measure of lexical diversity. Language Testing, 19, 85-104.
Malvern, D. D., Richards, B. J., Chipere, N., & Durán, P. (2004). Lexical diversity and language
development: Quantification and assessment. Hampshire, England: Palgrave Macmillan.
Matsubara, M. (2004). Sanshutsu no gap wo hakaru shihyou to shiteno Cover Rate [Cover Rate
as a measurement of the gap between what was to be produced and what actually was].
Bulletin of Chubu English Language Education Society, 34, 361-366.
McNamara, T. (1996). Measuring second language performance. Essex, U.K.: Addison Wesley
Longman.
Mehnert, U. (1998). The effects of different length of time for planning on second language
performance. Studies in Second Language Acquisition, 20, 83-108.
Messick, S. A. (1989). Validity. In R. L. Linn (Ed.). Educational Measurement (3rd ed., pp.
13-103). New York: National Council on Measurement in Education/American Council on
Education.
Messick, S. (1996). Validity and washback in language testing. Language Testing, 13, 241-256.
Ministry of Education, Science & Culture. (1989). Chuugakkou shidousho gaikokugo hen
[Instruction guidelines for junior high school]. Tokyo: Kairyudo.
Ministry of Education, Science & Culture. (1999). Chuugakkou gakushuu shidou youryo (heisei
10 nen 12 gatsu) kaisetsu—gaikokugo hen-- [Explanation of the Course of Study for junior
high school concerning foreign languages]. Tokyo: Tokyo shoseki.
Murphy, J. (2003). Task-based learning: The interaction between tasks and learners. ELT Journal,
57, 352-360.
Nikolov, M. & Krashen, S. (1997). Need we sacrifice accuracy for fluency? System, 25, 197-201.
North, B. (2000). The development of a common framework scale of language proficiency. New
York: Peter Lang.
O’Loughlin, K. (1995). Lexical density in candidate output on direct and semi-direct versions of
an oral proficiency test. Language Testing, 12, 217-237.
O’Loughlin, K. (2001). Studies in language testing 13: The equivalence of direct and semi-direct
speaking tests. Cambridge University Press.
Ortega, L. (1999). Planning and focus on form in L2 oral performance. Studies in Second
Language Acquisition, 21, 109-148.
Ortega, L. (2003). Syntactic complexity measures and their relationship to L2 proficiency: A
research synthesis of college-level L2 writing. Applied Linguistics, 24, 492-518.
O’Sullivan, B. (2000). Exploring gender and oral proficiency interview performance. System, 28,
373-386.
O’Sullivan, B. (2002). Learner acquaintanceship and oral proficiency test pair-task performance.
Language Testing, 19, 277-295.
Ota, H. (2002). Oral language development of Japanese EFL learners: A longitudinal study of
spoken performance by 101 junior high school students. Unpublished master’s thesis, Tokyo
Gakugei University, Japan.
Read, J. (2004, March). The lexical component of speaking test performance. Presented at the
26th Language Testing Research Colloquium, Temecula, CA.
Riggenbach, H. (1991). Toward an understanding of fluency: A microanalysis of nonnative
speaker conversations. Discourse Processes, 14, 423-441.
Robinson, P. (1995). Task complexity and second language narrative discourse. Language
Learning, 45, 99-140.
Robinson, P. (2001). Task complexity, task difficulty, and task production: Exploring interactions
in a componential framework. Applied Linguistics, 22, 27-57.
Robinson, P. (2005). Cognitive complexity and task sequencing: Studies in a componential
framework for second language task design. IRAL (International Review of Applied
Linguistics in Language Teaching), 43, 1-32.
Robinson, P., Ting, S. C., Urwin, J. J. (1995). Investigating second language task complexity.
RELC Journal, 26, 62-79.
Segalowitz, N., & Freed, B. F. (2004). Context, contact, and cognition in oral fluency acquisition.
Studies in Second Language Acquisition, 26, 173-199.
Shavelson, R. J., & Webb, N. M. (1991). Generalizability theory: A primer. Thousand Oaks, CA:
Sage Publications.
Shimada, K. (2004). Chinmoku wa kin narazu: Speech kunren no ryuuchousa ni taisuru kouka
[Silence is not golden—The effect of speech training on fluency]. Bulletin of Chubu English
Language Education Society, 34, 9-14.
Shimizu, S. (2005). JACET 8000 Level Marker. Retrieved March 13, 2005, from
http://www01.tcp-ip.or.jp/~shin/J8LevelMarker/j8lm.cgi
Skehan, P. (1996). A framework for the implementation of task-based instruction. Applied
Linguistics, 17, 38-62.
Skehan, P. (1998). A cognitive approach to language learning. Oxford University Press.
Skehan, P. (2001). Tasks and language performance assessment. In M. Bygate, P. Skehan, & M.
Swain (Eds.), Researching pedagogic tasks: Second language learning, teaching and testing
(pp. 167-185). Essex, U.K.: Pearson Education Limited.
Skehan, P., & Foster, P. (1997). Task type and task processing conditions as influences on foreign
language performance. Language Teaching Research, 1, 185-211.
Skehan, P., & Foster, P. (1999). The influence of task structure and processing conditions on
narrative retellings. Language Learning, 49, 93-120.
Skehan, P., & Foster, P. (2001). Cognition and tasks. In P. Robinson (Ed.), Cognition and second
language instruction (pp. 183-205). Cambridge University Press.
Statistical Package for the Social Sciences (SPSS). (2003). SPSS (Version 12.0.1) [Computer
software]. Chicago: SPSS Inc.
Takiguchi, H. (2003). A study of the development of speaking skills within the framework of
fluency, accuracy and complexity among Japanese EFL junior high school students.
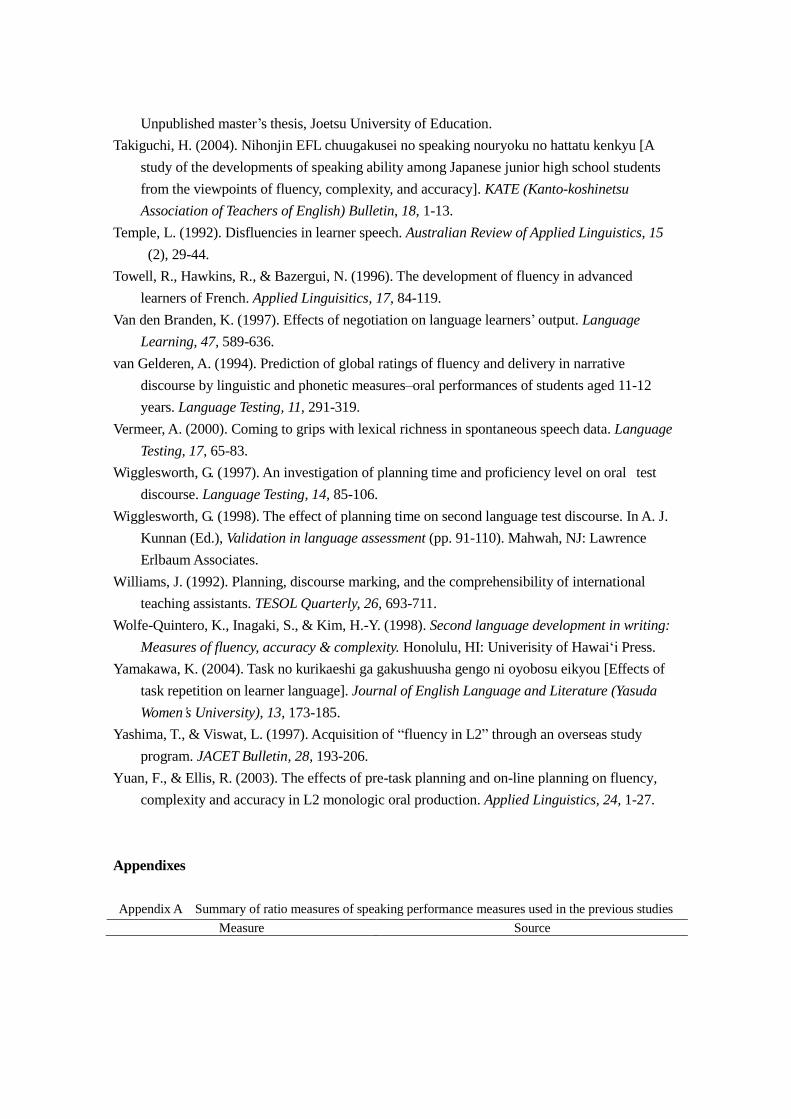
Unpublished master’s thesis, Joetsu University of Education.
Takiguchi, H. (2004). Nihonjin EFL chuugakusei no speaking nouryoku no hattatu kenkyu [A
study of the developments of speaking ability among Japanese junior high school students
from the viewpoints of fluency, complexity, and accuracy]. KATE (Kanto-koshinetsu
Association of Teachers of English) Bulletin, 18, 1-13.
Temple, L. (1992). Disfluencies in learner speech. Australian Review of Applied Linguistics, 15
(2), 29-44.
Towell, R., Hawkins, R., & Bazergui, N. (1996). The development of fluency in advanced
learners of French. Applied Linguisitics, 17, 84-119.
Van den Branden, K. (1997). Effects of negotiation on language learners’ output. Language
Learning, 47, 589-636.
van Gelderen, A. (1994). Prediction of global ratings of fluency and delivery in narrative
discourse by linguistic and phonetic measures–oral performances of students aged 11-12
years. Language Testing, 11, 291-319.
Vermeer, A. (2000). Coming to grips with lexical richness in spontaneous speech data. Language
Testing, 17, 65-83.
Wigglesworth, G. (1997). An investigation of planning time and proficiency level on oral test
discourse. Language Testing, 14, 85-106.
Wigglesworth, G. (1998). The effect of planning time on second language test discourse. In A. J.
Kunnan (Ed.), Validation in language assessment (pp. 91-110). Mahwah, NJ: Lawrence
Erlbaum Associates.
Williams, J. (1992). Planning, discourse marking, and the comprehensibility of international
teaching assistants. TESOL Quarterly, 26, 693-711.
Wolfe-Quintero, K., Inagaki, S., & Kim, H.-Y. (1998). Second language development in writing:
Measures of fluency, accuracy & complexity. Honolulu, HI: Univerisity of Hawai‘i Press.
Yamakawa, K. (2004). Task no kurikaeshi ga gakushuusha gengo ni oyobosu eikyou [Effects of
task repetition on learner language]. Journal of English Language and Literature (Yasuda
Women’s University), 13, 173-185.
Yashima, T., & Viswat, L. (1997). Acquisition of “fluency in L2” through an overseas study
program. JACET Bulletin, 28, 193-206.
Yuan, F., & Ellis, R. (2003). The effects of pre-task planning and on-line planning on fluency,
complexity and accuracy in L2 monologic oral production. Applied Linguistics, 24, 1-27.
Appendixes
Appendix A Summary of ratio measures of speaking performance measures used in the previous studies
Measure Source
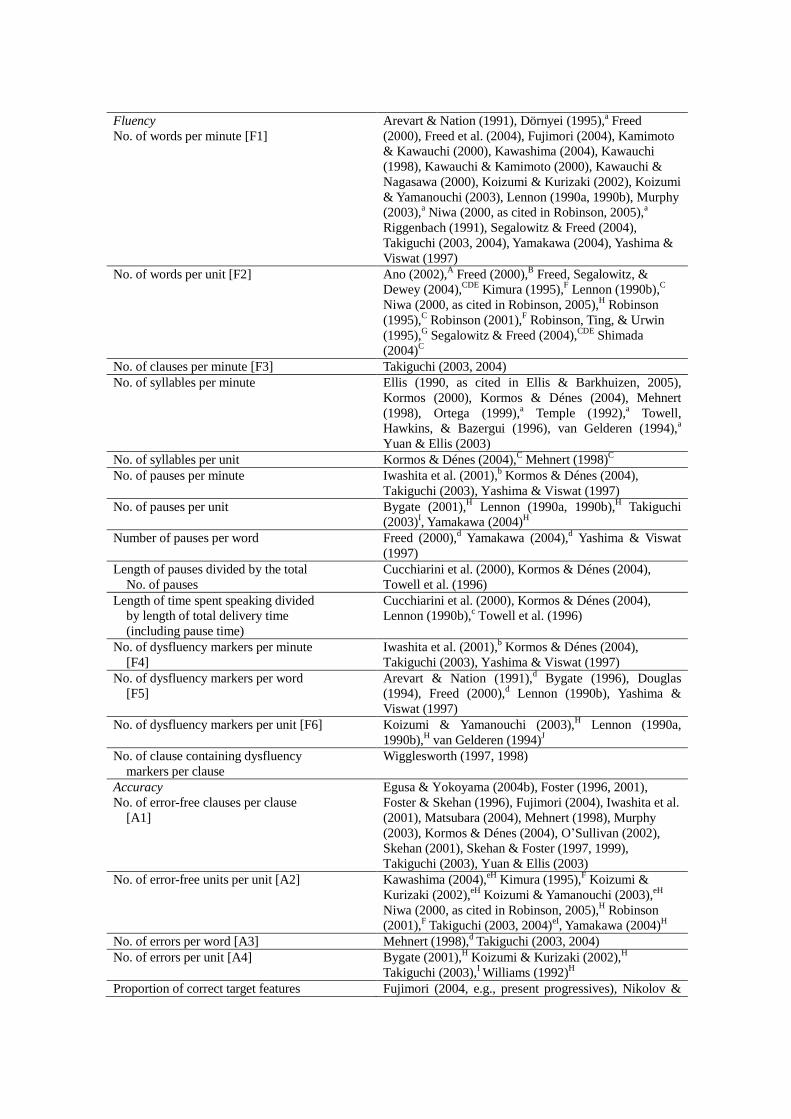
Fluency
No. of words per minute [F1]
Arevart & Nation (1991), Dörnyei (1995),a Freed
(2000), Freed et al. (2004), Fujimori (2004), Kamimoto
& Kawauchi (2000), Kawashima (2004), Kawauchi
(1998), Kawauchi & Kamimoto (2000), Kawauchi &
Nagasawa (2000), Koizumi & Kurizaki (2002), Koizumi
& Yamanouchi (2003), Lennon (1990a, 1990b), Murphy
(2003),a Niwa (2000, as cited in Robinson, 2005),
a
Riggenbach (1991), Segalowitz & Freed (2004),
Takiguchi (2003, 2004), Yamakawa (2004), Yashima &
Viswat (1997)
No. of words per unit [F2] Ano (2002),A Freed (2000),
B Freed, Segalowitz, &
Dewey (2004),CDE
Kimura (1995),F Lennon (1990b),
C
Niwa (2000, as cited in Robinson, 2005),H Robinson
(1995),C Robinson (2001),
F Robinson, Ting, & Urwin
(1995),G Segalowitz & Freed (2004),
CDE Shimada
(2004)C
No. of clauses per minute [F3] Takiguchi (2003, 2004)
No. of syllables per minute Ellis (1990, as cited in Ellis & Barkhuizen, 2005),
Kormos (2000), Kormos & Dénes (2004), Mehnert
(1998), Ortega (1999),a Temple (1992),
a Towell,
Hawkins, & Bazergui (1996), van Gelderen (1994),a
Yuan & Ellis (2003)
No. of syllables per unit Kormos & Dénes (2004),C Mehnert (1998)
C
No. of pauses per minute Iwashita et al. (2001),b Kormos & Dénes (2004),
Takiguchi (2003), Yashima & Viswat (1997)
No. of pauses per unit Bygate (2001),H Lennon (1990a, 1990b),
H Takiguchi
(2003)I, Yamakawa (2004)
H
Number of pauses per word Freed (2000),d Yamakawa (2004),
d Yashima & Viswat
(1997)
Length of pauses divided by the total
No. of pauses
Cucchiarini et al. (2000), Kormos & Dénes (2004),
Towell et al. (1996)
Length of time spent speaking divided
by length of total delivery time
(including pause time)
Cucchiarini et al. (2000), Kormos & Dénes (2004),
Lennon (1990b),c Towell et al. (1996)
No. of dysfluency markers per minute
[F4]
Iwashita et al. (2001),b Kormos & Dénes (2004),
Takiguchi (2003), Yashima & Viswat (1997)
No. of dysfluency markers per word
[F5]
Arevart & Nation (1991),d Bygate (1996), Douglas
(1994), Freed (2000),d Lennon (1990b), Yashima &
Viswat (1997)
No. of dysfluency markers per unit [F6] Koizumi & Yamanouchi (2003),H Lennon (1990a,
1990b),H van Gelderen (1994)
J
No. of clause containing dysfluency
markers per clause
Wigglesworth (1997, 1998)
Accuracy
No. of error-free clauses per clause
[A1]
Egusa & Yokoyama (2004b), Foster (1996, 2001),
Foster & Skehan (1996), Fujimori (2004), Iwashita et al.
(2001), Matsubara (2004), Mehnert (1998), Murphy
(2003), Kormos & Dénes (2004), O’Sullivan (2002),
Skehan (2001), Skehan & Foster (1997, 1999),
Takiguchi (2003), Yuan & Ellis (2003)
No. of error-free units per unit [A2] Kawashima (2004),eH
Kimura (1995),F Koizumi &
Kurizaki (2002),eH
Koizumi & Yamanouchi (2003),eH
Niwa (2000, as cited in Robinson, 2005),H Robinson
(2001),F Takiguchi (2003, 2004)
eI, Yamakawa (2004)
H
No. of errors per word [A3] Mehnert (1998),d Takiguchi (2003, 2004)
No. of errors per unit [A4] Bygate (2001),H Koizumi & Kurizaki (2002),
H
Takiguchi (2003),I Williams (1992)
H
Proportion of correct target features Fujimori (2004, e.g., present progressives), Nikolov &
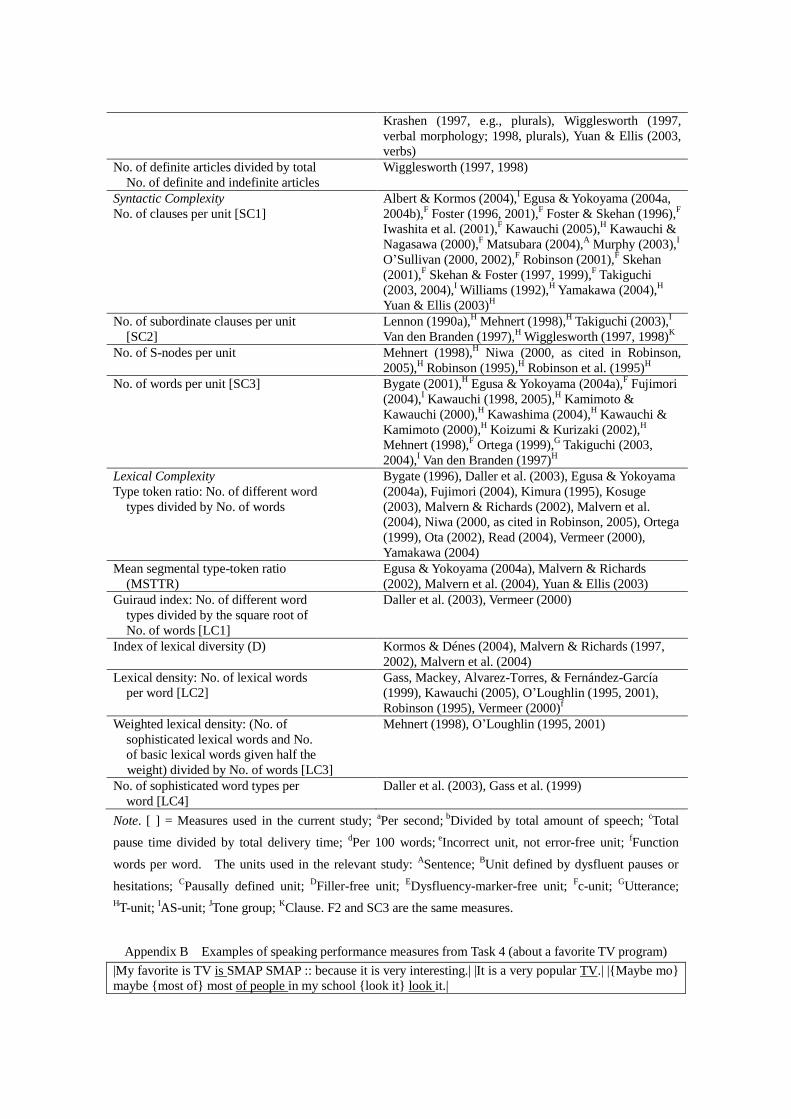
Krashen (1997, e.g., plurals), Wigglesworth (1997,
verbal morphology; 1998, plurals), Yuan & Ellis (2003,
verbs)
No. of definite articles divided by total
No. of definite and indefinite articles
Wigglesworth (1997, 1998)
Syntactic Complexity
No. of clauses per unit [SC1]
Albert & Kormos (2004),I Egusa & Yokoyama (2004a,
2004b),F Foster (1996, 2001),
F Foster & Skehan (1996),
F
Iwashita et al. (2001),F Kawauchi (2005),
H Kawauchi &
Nagasawa (2000),F Matsubara (2004),
A Murphy (2003),
I
O’Sullivan (2000, 2002),F Robinson (2001),
F Skehan
(2001),F Skehan & Foster (1997, 1999),
F Takiguchi
(2003, 2004),I Williams (1992),
H Yamakawa (2004),
H
Yuan & Ellis (2003)H
No. of subordinate clauses per unit
[SC2]
Lennon (1990a),H Mehnert (1998),
H Takiguchi (2003),
I
Van den Branden (1997),H Wigglesworth (1997, 1998)
K
No. of S-nodes per unit Mehnert (1998),H Niwa (2000, as cited in Robinson,
2005),H Robinson (1995),
H Robinson et al. (1995)
H
No. of words per unit [SC3] Bygate (2001),H Egusa & Yokoyama (2004a),
F Fujimori
(2004),I Kawauchi (1998, 2005),
H Kamimoto &
Kawauchi (2000),H Kawashima (2004),
H Kawauchi &
Kamimoto (2000),H Koizumi & Kurizaki (2002),
H
Mehnert (1998),F Ortega (1999),
G Takiguchi (2003,
2004),I Van den Branden (1997)
H
Lexical Complexity
Type token ratio: No. of different word
types divided by No. of words
Bygate (1996), Daller et al. (2003), Egusa & Yokoyama
(2004a), Fujimori (2004), Kimura (1995), Kosuge
(2003), Malvern & Richards (2002), Malvern et al.
(2004), Niwa (2000, as cited in Robinson, 2005), Ortega
(1999), Ota (2002), Read (2004), Vermeer (2000),
Yamakawa (2004)
Mean segmental type-token ratio
(MSTTR)
Egusa & Yokoyama (2004a), Malvern & Richards
(2002), Malvern et al. (2004), Yuan & Ellis (2003)
Guiraud index: No. of different word
types divided by the square root of
No. of words [LC1]
Daller et al. (2003), Vermeer (2000)
Index of lexical diversity (D) Kormos & Dénes (2004), Malvern & Richards (1997,
2002), Malvern et al. (2004)
Lexical density: No. of lexical words
per word [LC2]
Gass, Mackey, Alvarez-Torres, & Fernández-García
(1999), Kawauchi (2005), O’Loughlin (1995, 2001),
Robinson (1995), Vermeer (2000)f
Weighted lexical density: (No. of
sophisticated lexical words and No.
of basic lexical words given half the
weight) divided by No. of words [LC3]
Mehnert (1998), O’Loughlin (1995, 2001)
No. of sophisticated word types per
word [LC4]
Daller et al. (2003), Gass et al. (1999)
Note. [ ] = Measures used in the current study; aPer second;
bDivided by total amount of speech;
cTotal
pause time divided by total delivery time; dPer 100 words;
eIncorrect unit, not error-free unit;
fFunction
words per word. The units used in the relevant study: ASentence;
BUnit defined by dysfluent pauses or
hesitations; CPausally defined unit;
DFiller-free unit;
EDysfluency-marker-free unit;
Fc-unit;
GUtterance;
HT-unit;
IAS-unit;
JTone group;
KClause. F2 and SC3 are the same measures.
Appendix B Examples of speaking performance measures from Task 4 (about a favorite TV program)
|My favorite is TV is SMAP SMAP :: because it is very interesting.| |It is a very popular TV.| |{Maybe mo}
maybe {most of} most of people in my school {look it} look it.|
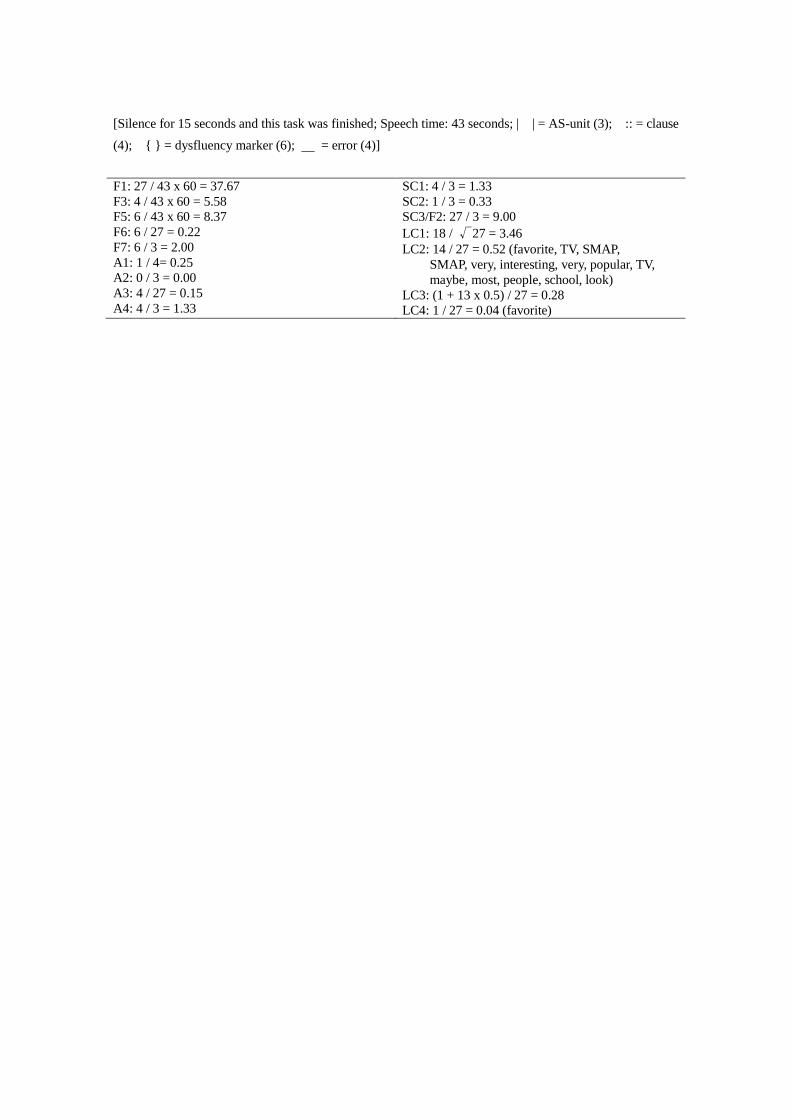
[Silence for 15 seconds and this task was finished; Speech time: 43 seconds; | | = AS-unit (3); :: = clause
(4); { } = dysfluency marker (6); = error (4)]
F1: 27 / 43 x 60 = 37.67
F3: 4 / 43 x 60 = 5.58
F5: 6 / 43 x 60 = 8.37
F6: 6 / 27 = 0.22
F7: 6 / 3 = 2.00
A1: 1 / 4= 0.25
A2: 0 / 3 = 0.00
A3: 4 / 27 = 0.15
A4: 4 / 3 = 1.33
SC1: 4 / 3 = 1.33
SC2: 1 / 3 = 0.33
SC3/F2: 27 / 3 = 9.00
LC1: 18 / √27 = 3.46
LC2: 14 / 27 = 0.52 (favorite, TV, SMAP,
SMAP, very, interesting, very, popular, TV,
maybe, most, people, school, look)
LC3: (1 + 13 x 0.5) / 27 = 0.28
LC4: 1 / 27 = 0.04 (favorite)
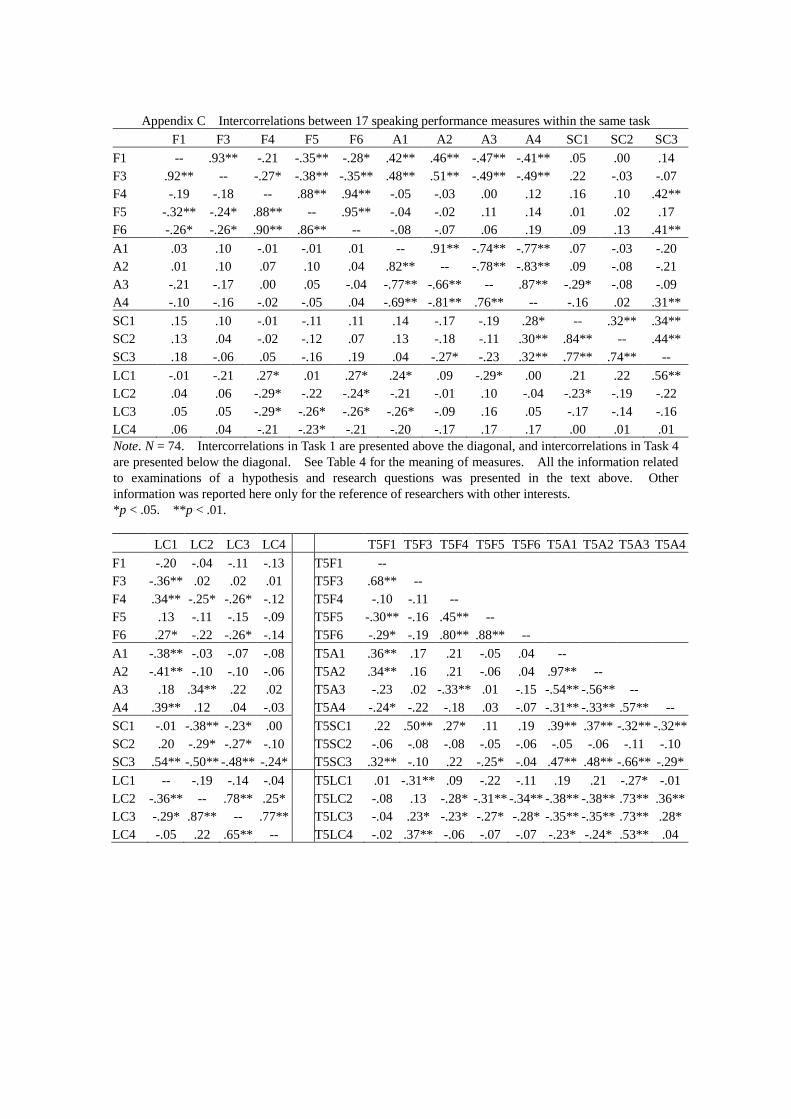
Appendix C Intercorrelations between 17 speaking performance measures within the same task
F1 F3 F4 F5 F6 A1 A2 A3 A4 SC1 SC2 SC3
F1 -- .93** -.21 -.35** -.28* .42** .46** -.47** -.41** .05 .00 .14
F3 .92** -- -.27* -.38** -.35** .48** .51** -.49** -.49** .22 -.03 -.07
F4 -.19 -.18 -- .88** .94** -.05 -.03 .00 .12 .16 .10 .42**
F5 -.32** -.24* .88** -- .95** -.04 -.02 .11 .14 .01 .02 .17
F6 -.26* -.26* .90** .86** -- -.08 -.07 .06 .19 .09 .13 .41**
A1 .03 .10 -.01 -.01 .01 -- .91** -.74** -.77** .07 -.03 -.20
A2 .01 .10 .07 .10 .04 .82** -- -.78** -.83** .09 -.08 -.21
A3 -.21 -.17 .00 .05 -.04 -.77** -.66** -- .87** -.29* -.08 -.09
A4 -.10 -.16 -.02 -.05 .04 -.69** -.81** .76** -- -.16 .02 .31**
SC1 .15 .10 -.01 -.11 .11 .14 -.17 -.19 .28* -- .32** .34**
SC2 .13 .04 -.02 -.12 .07 .13 -.18 -.11 .30** .84** -- .44**
SC3 .18 -.06 .05 -.16 .19 .04 -.27* -.23 .32** .77** .74** --
LC1 -.01 -.21 .27* .01 .27* .24* .09 -.29* .00 .21 .22 .56**
LC2 .04 .06 -.29* -.22 -.24* -.21 -.01 .10 -.04 -.23* -.19 -.22
LC3 .05 .05 -.29* -.26* -.26* -.26* -.09 .16 .05 -.17 -.14 -.16
LC4 .06 .04 -.21 -.23* -.21 -.20 -.17 .17 .17 .00 .01 .01
Note. N = 74. Intercorrelations in Task 1 are presented above the diagonal, and intercorrelations in Task 4
are presented below the diagonal. See Table 4 for the meaning of measures. All the information related
to examinations of a hypothesis and research questions was presented in the text above. Other
information was reported here only for the reference of researchers with other interests.
*p < .05. **p < .01.
LC1 LC2 LC3 LC4 T5F1 T5F3 T5F4 T5F5 T5F6 T5A1 T5A2 T5A3 T5A4
F1 -.20 -.04 -.11 -.13 T5F1 --
F3 -.36** .02 .02 .01 T5F3 .68** --
F4 .34** -.25* -.26* -.12 T5F4 -.10 -.11 --
F5 .13 -.11 -.15 -.09 T5F5 -.30** -.16 .45** --
F6 .27* -.22 -.26* -.14 T5F6 -.29* -.19 .80** .88** --
A1 -.38** -.03 -.07 -.08 T5A1 .36** .17 .21 -.05 .04 --
A2 -.41** -.10 -.10 -.06 T5A2 .34** .16 .21 -.06 .04 .97** --
A3 .18 .34** .22 .02 T5A3 -.23 .02 -.33** .01 -.15 -.54** -.56** --
A4 .39** .12 .04 -.03 T5A4 -.24* -.22 -.18 .03 -.07 -.31** -.33** .57** --
SC1 -.01 -.38** -.23* .00 T5SC1 .22 .50** .27* .11 .19 .39** .37** -.32** -.32**
SC2 .20 -.29* -.27* -.10 T5SC2 -.06 -.08 -.08 -.05 -.06 -.05 -.06 -.11 -.10
SC3 .54** -.50** -.48** -.24* T5SC3 .32** -.10 .22 -.25* -.04 .47** .48** -.66** -.29*
LC1 -- -.19 -.14 -.04 T5LC1 .01 -.31** .09 -.22 -.11 .19 .21 -.27* -.01
LC2 -.36** -- .78** .25* T5LC2 -.08 .13 -.28* -.31** -.34** -.38** -.38** .73** .36**
LC3 -.29* .87** -- .77** T5LC3 -.04 .23* -.23* -.27* -.28* -.35** -.35** .73** .28*
LC4 -.05 .22 .65** -- T5LC4 -.02 .37** -.06 -.07 -.07 -.23* -.24* .53** .04
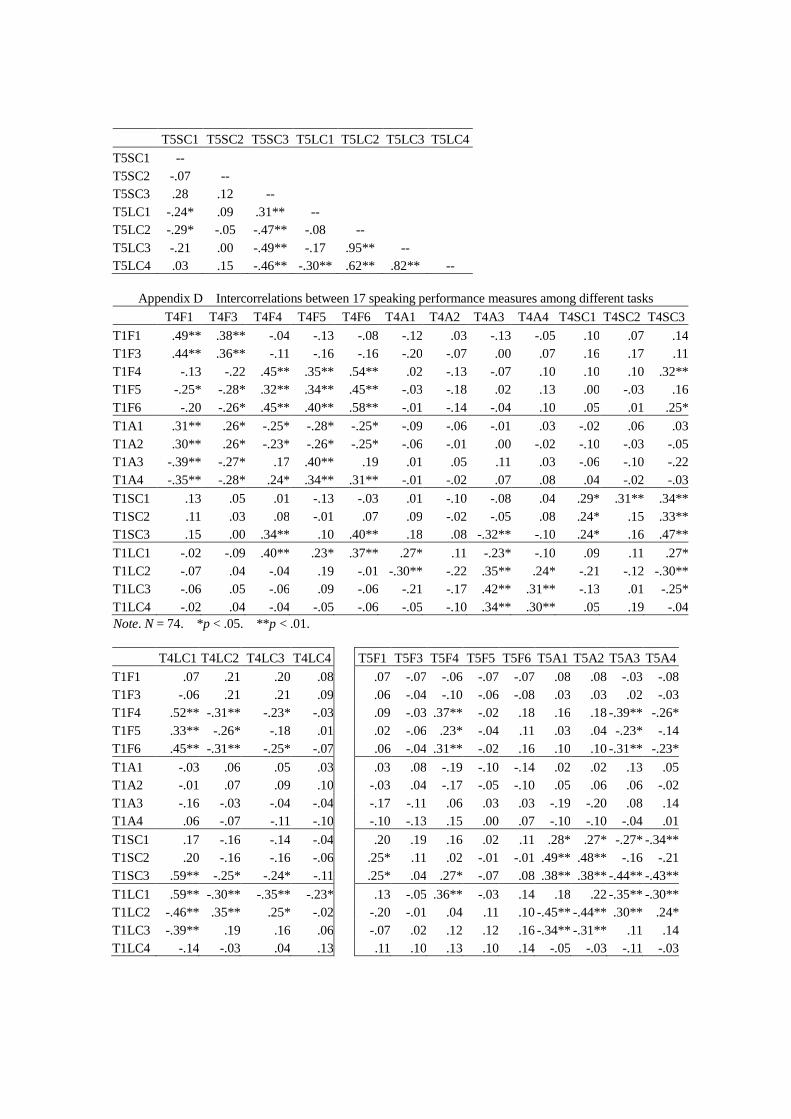
T5SC1 T5SC2 T5SC3 T5LC1 T5LC2 T5LC3 T5LC4
T5SC1 --
T5SC2 -.07 --
T5SC3 .28 .12 --
T5LC1 -.24* .09 .31** --
T5LC2 -.29* -.05 -.47** -.08 --
T5LC3 -.21 .00 -.49** -.17 .95** --
T5LC4 .03 .15 -.46** -.30** .62** .82** --
Appendix D Intercorrelations between 17 speaking performance measures among different tasks
T4F1 T4F3 T4F4 T4F5 T4F6 T4A1 T4A2 T4A3 T4A4 T4SC1 T4SC2 T4SC3
T1F1 .49** .38** -.04 -.13 -.08 -.12 .03 -.13 -.05 .10 .07 .14
T1F3 .44** .36** -.11 -.16 -.16 -.20 -.07 .00 .07 .16 .17 .11
T1F4 -.13 -.22 .45** .35** .54** .02 -.13 -.07 .10 .10 .10 .32**
T1F5 -.25* -.28* .32** .34** .45** -.03 -.18 .02 .13 .00 -.03 .16
T1F6 -.20 -.26* .45** .40** .58** -.01 -.14 -.04 .10 .05 .01 .25*
T1A1 .31** .26* -.25* -.28* -.25* -.09 -.06 -.01 .03 -.02 .06 .03
T1A2 .30** .26* -.23* -.26* -.25* -.06 -.01 .00 -.02 -.10 -.03 -.05
T1A3 -.39** -.27* .17 .40** .19 .01 .05 .11 .03 -.06 -.10 -.22
T1A4 -.35** -.28* .24* .34** .31** -.01 -.02 .07 .08 .04 -.02 -.03
T1SC1 .13 .05 .01 -.13 -.03 .01 -.10 -.08 .04 .29* .31** .34**
T1SC2 .11 .03 .08 -.01 .07 .09 -.02 -.05 .08 .24* .15 .33**
T1SC3 .15 .00 .34** .10 .40** .18 .08 -.32** -.10 .24* .16 .47**
T1LC1 -.02 -.09 .40** .23* .37** .27* .11 -.23* -.10 .09 .11 .27*
T1LC2 -.07 .04 -.04 .19 -.01 -.30** -.22 .35** .24* -.21 -.12 -.30**
T1LC3 -.06 .05 -.06 .09 -.06 -.21 -.17 .42** .31** -.13 .01 -.25*
T1LC4 -.02 .04 -.04 -.05 -.06 -.05 -.10 .34** .30** .05 .19 -.04
Note. N = 74. *p < .05. **p < .01.
T4LC1 T4LC2 T4LC3 T4LC4 T5F1 T5F3 T5F4 T5F5 T5F6 T5A1 T5A2 T5A3 T5A4
T1F1 .07 .21 .20 .08 .07 -.07 -.06 -.07 -.07 .08 .08 -.03 -.08
T1F3 -.06 .21 .21 .09 .06 -.04 -.10 -.06 -.08 .03 .03 .02 -.03
T1F4 .52** -.31** -.23* -.03 .09 -.03 .37** -.02 .18 .16 .18 -.39** -.26*
T1F5 .33** -.26* -.18 .01 .02 -.06 .23* -.04 .11 .03 .04 -.23* -.14
T1F6 .45** -.31** -.25* -.07 .06 -.04 .31** -.02 .16 .10 .10 -.31** -.23*
T1A1 -.03 .06 .05 .03 .03 .08 -.19 -.10 -.14 .02 .02 .13 .05
T1A2 -.01 .07 .09 .10 -.03 .04 -.17 -.05 -.10 .05 .06 .06 -.02
T1A3 -.16 -.03 -.04 -.04 -.17 -.11 .06 .03 .03 -.19 -.20 .08 .14
T1A4 .06 -.07 -.11 -.10 -.10 -.13 .15 .00 .07 -.10 -.10 -.04 .01
T1SC1 .17 -.16 -.14 -.04 .20 .19 .16 .02 .11 .28* .27* -.27* -.34**
T1SC2 .20 -.16 -.16 -.06 .25* .11 .02 -.01 -.01 .49** .48** -.16 -.21
T1SC3 .59** -.25* -.24* -.11 .25* .04 .27* -.07 .08 .38** .38** -.44** -.43**
T1LC1 .59** -.30** -.35** -.23* .13 -.05 .36** -.03 .14 .18 .22 -.35** -.30**
T1LC2 -.46** .35** .25* -.02 -.20 -.01 .04 .11 .10 -.45** -.44** .30** .24*
T1LC3 -.39** .19 .16 .06 -.07 .02 .12 .12 .16 -.34** -.31** .11 .14
T1LC4 -.14 -.03 .04 .13 .11 .10 .13 .10 .14 -.05 -.03 -.11 -.03
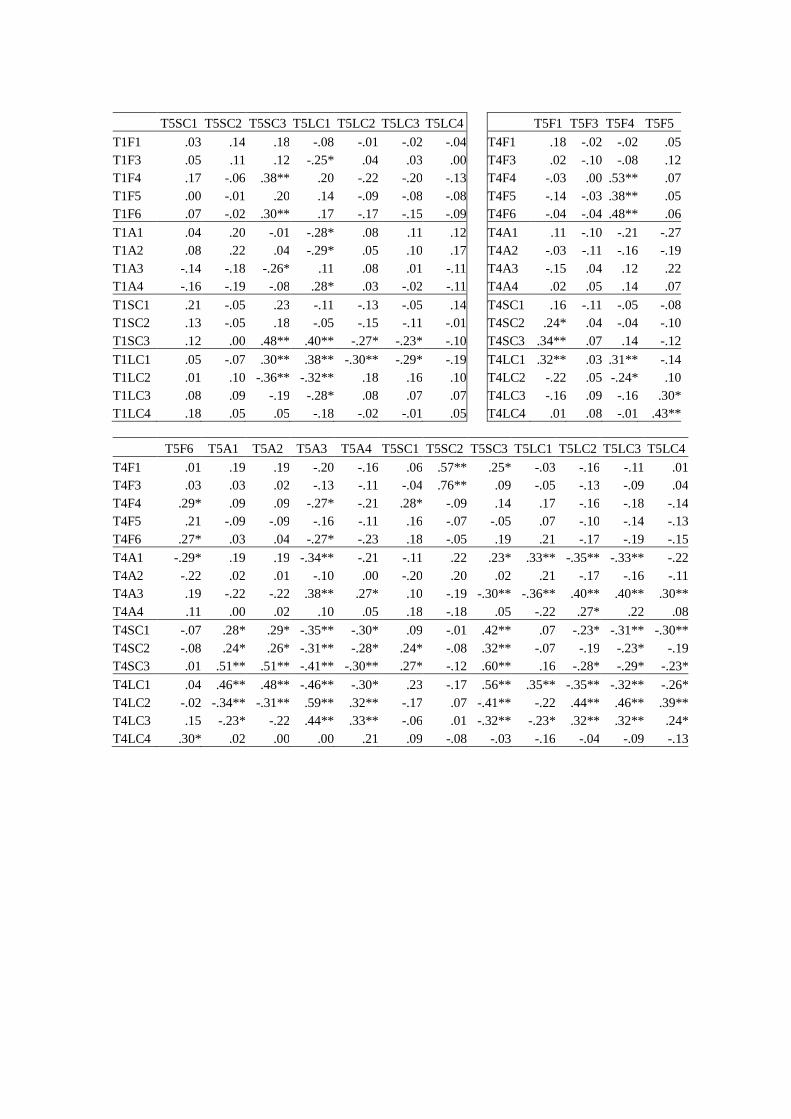
T5SC1 T5SC2 T5SC3 T5LC1 T5LC2 T5LC3 T5LC4 T5F1 T5F3 T5F4 T5F5
T1F1 .03 .14 .18 -.08 -.01 -.02 -.04 T4F1 .18 -.02 -.02 .05
T1F3 .05 .11 .12 -.25* .04 .03 .00 T4F3 .02 -.10 -.08 .12
T1F4 .17 -.06 .38** .20 -.22 -.20 -.13 T4F4 -.03 .00 .53** .07
T1F5 .00 -.01 .20 .14 -.09 -.08 -.08 T4F5 -.14 -.03 .38** .05
T1F6 .07 -.02 .30** .17 -.17 -.15 -.09 T4F6 -.04 -.04 .48** .06
T1A1 .04 .20 -.01 -.28* .08 .11 .12 T4A1 .11 -.10 -.21 -.27
T1A2 .08 .22 .04 -.29* .05 .10 .17 T4A2 -.03 -.11 -.16 -.19
T1A3 -.14 -.18 -.26* .11 .08 .01 -.11 T4A3 -.15 .04 .12 .22
T1A4 -.16 -.19 -.08 .28* .03 -.02 -.11 T4A4 .02 .05 .14 .07
T1SC1 .21 -.05 .23 -.11 -.13 -.05 .14 T4SC1 .16 -.11 -.05 -.08
T1SC2 .13 -.05 .18 -.05 -.15 -.11 -.01 T4SC2 .24* .04 -.04 -.10
T1SC3 .12 .00 .48** .40** -.27* -.23* -.10 T4SC3 .34** .07 .14 -.12
T1LC1 .05 -.07 .30** .38** -.30** -.29* -.19 T4LC1 .32** .03 .31** -.14
T1LC2 .01 .10 -.36** -.32** .18 .16 .10 T4LC2 -.22 .05 -.24* .10
T1LC3 .08 .09 -.19 -.28* .08 .07 .07 T4LC3 -.16 .09 -.16 .30*
T1LC4 .18 .05 .05 -.18 -.02 -.01 .05 T4LC4 .01 .08 -.01 .43**
T5F6 T5A1 T5A2 T5A3 T5A4 T5SC1 T5SC2 T5SC3 T5LC1 T5LC2 T5LC3 T5LC4
T4F1 .01 .19 .19 -.20 -.16 .06 .57** .25* -.03 -.16 -.11 .01
T4F3 .03 .03 .02 -.13 -.11 -.04 .76** .09 -.05 -.13 -.09 .04
T4F4 .29* .09 .09 -.27* -.21 .28* -.09 .14 .17 -.16 -.18 -.14
T4F5 .21 -.09 -.09 -.16 -.11 .16 -.07 -.05 .07 -.10 -.14 -.13
T4F6 .27* .03 .04 -.27* -.23 .18 -.05 .19 .21 -.17 -.19 -.15
T4A1 -.29* .19 .19 -.34** -.21 -.11 .22 .23* .33** -.35** -.33** -.22
T4A2 -.22 .02 .01 -.10 .00 -.20 .20 .02 .21 -.17 -.16 -.11
T4A3 .19 -.22 -.22 .38** .27* .10 -.19 -.30** -.36** .40** .40** .30**
T4A4 .11 .00 .02 .10 .05 .18 -.18 .05 -.22 .27* .22 .08
T4SC1 -.07 .28* .29* -.35** -.30* .09 -.01 .42** .07 -.23* -.31** -.30**
T4SC2 -.08 .24* .26* -.31** -.28* .24* -.08 .32** -.07 -.19 -.23* -.19
T4SC3 .01 .51** .51** -.41** -.30** .27* -.12 .60** .16 -.28* -.29* -.23*
T4LC1 .04 .46** .48** -.46** -.30* .23 -.17 .56** .35** -.35** -.32** -.26*
T4LC2 -.02 -.34** -.31** .59** .32** -.17 .07 -.41** -.22 .44** .46** .39**
T4LC3 .15 -.23* -.22 .44** .33** -.06 .01 -.32** -.23* .32** .32** .24*
T4LC4 .30* .02 .00 .00 .21 .09 -.08 -.03 -.16 -.04 -.09 -.13