Speakers - WealthEngine | Wealth Data and Solutions for...
22
1
Transcript of Speakers - WealthEngine | Wealth Data and Solutions for...
1
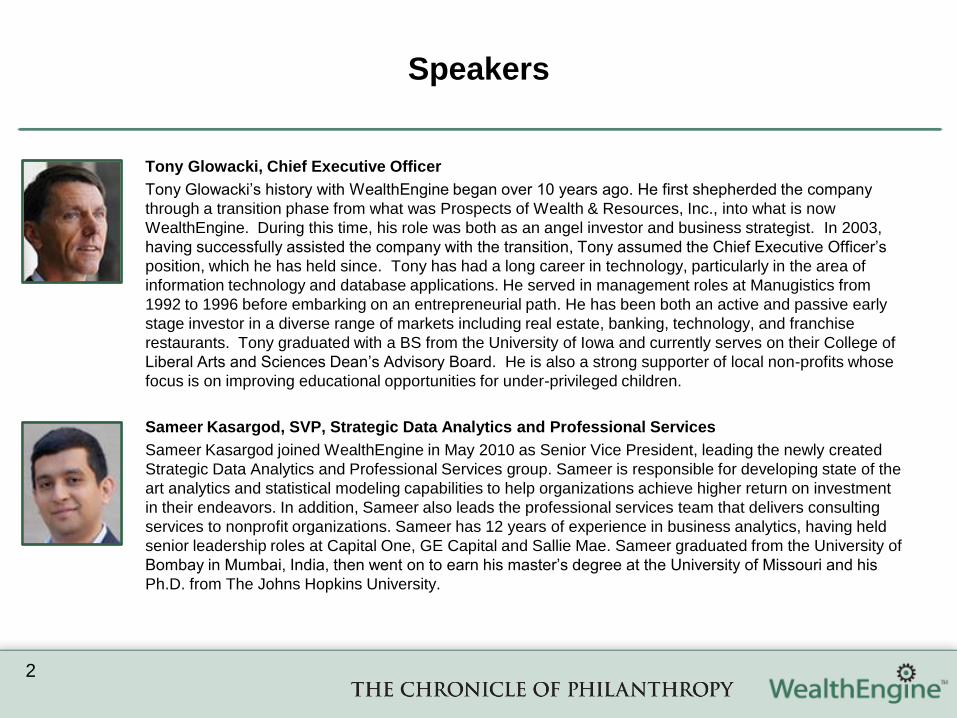
Speakers
Tony Glowacki, Chief Executive Officer
Tony Glowacki‟s history with WealthEngine began over 10 years ago. He first shepherded the company
through a transition phase from what was Prospects of Wealth & Resources, Inc., into what is now
WealthEngine. During this time, his role was both as an angel investor and business strategist. In 2003,
having successfully assisted the company with the transition, Tony assumed the Chief Executive Officer‟s
position, which he has held since. Tony has had a long career in technology, particularly in the area of
information technology and database applications. He served in management roles at Manugistics from
1992 to 1996 before embarking on an entrepreneurial path. He has been both an active and passive early
stage investor in a diverse range of markets including real estate, banking, technology, and franchise
restaurants. Tony graduated with a BS from the University of Iowa and currently serves on their College of
Liberal Arts and Sciences Dean‟s Advisory Board. He is also a strong supporter of local non-profits whose
focus is on improving educational opportunities for under-privileged children.
Sameer Kasargod, SVP, Strategic Data Analytics and Professional Services
Sameer Kasargod joined WealthEngine in May 2010 as Senior Vice President, leading the newly created
Strategic Data Analytics and Professional Services group. Sameer is responsible for developing state of the
art analytics and statistical modeling capabilities to help organizations achieve higher return on investment
in their endeavors. In addition, Sameer also leads the professional services team that delivers consulting
services to nonprofit organizations. Sameer has 12 years of experience in business analytics, having held
senior leadership roles at Capital One, GE Capital and Sallie Mae. Sameer graduated from the University of
Bombay in Mumbai, India, then went on to earn his master‟s degree at the University of Missouri and his
Ph.D. from The Johns Hopkins University.
2
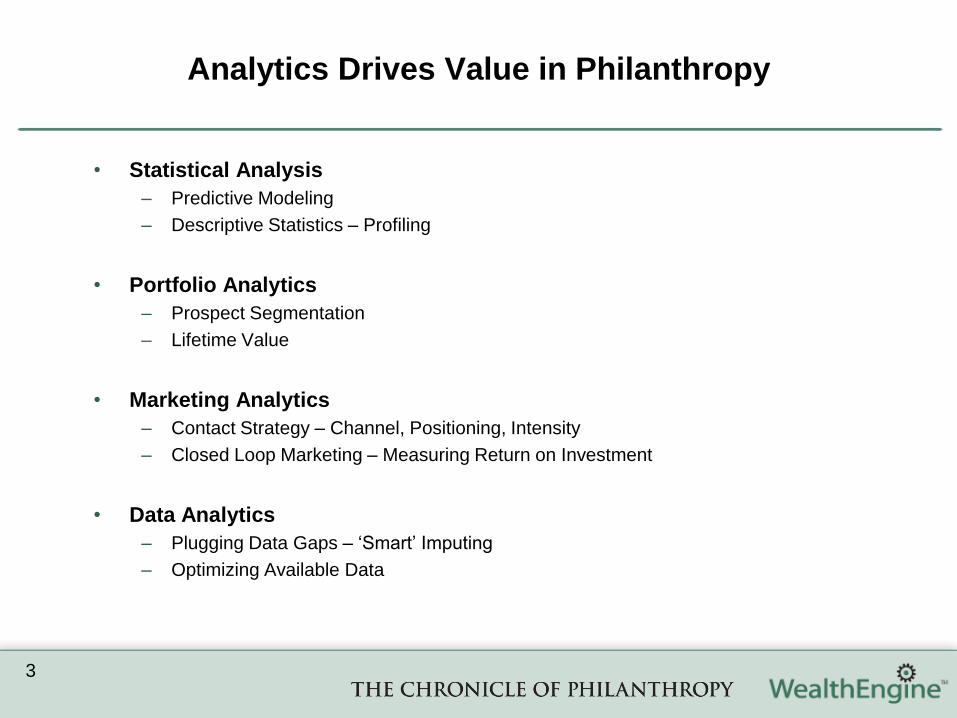
Analytics Drives Value in Philanthropy
3
• Statistical Analysis
– Predictive Modeling
– Descriptive Statistics – Profiling
• Portfolio Analytics
– Prospect Segmentation
– Lifetime Value
• Marketing Analytics
– Contact Strategy – Channel, Positioning, Intensity
– Closed Loop Marketing – Measuring Return on Investment
• Data Analytics
– Plugging Data Gaps – „Smart‟ Imputing
– Optimizing Available Data

Concentration of Wealth in the United States
4
• Wealth is highly concentrated in
the United States
– Top 1% of households own 43% of
total financial wealth
– Next 19% own 50%
– Bottom 80% own only 7%
• The recent recession has further
polarized this distribution
– 36% drop in marketable assets of
the median household compared to
11% for the top 1%
• In this environment, it is more
important than ever for fundraisers
to find wealth
43%
50%
7%
Top 1%
Next 19%
Bottom 80%
1%
19%
80%
Distribution of US Households*
Distribution of Financial Wealth
*Distributions as of 2007
Source: Wealth, Income, & Power by G. William Domhoff, July 2010
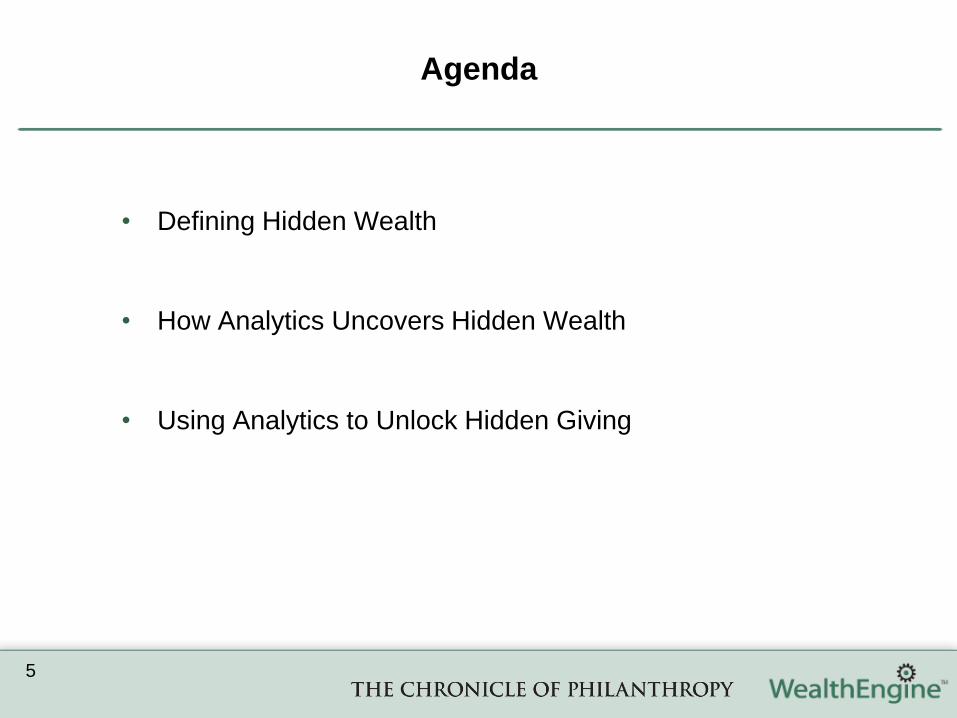
Agenda
• Defining Hidden Wealth
• How Analytics Uncovers Hidden Wealth
• Using Analytics to Unlock Hidden Giving
5
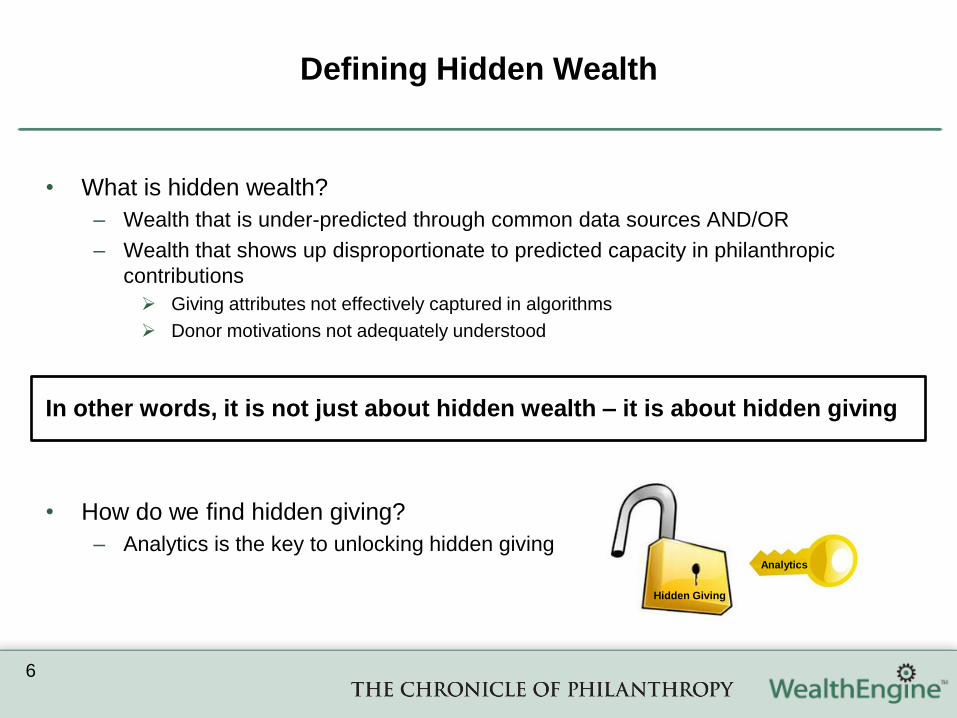
Defining Hidden Wealth
6
• What is hidden wealth?
– Wealth that is under-predicted through common data sources AND/OR
– Wealth that shows up disproportionate to predicted capacity in philanthropic
contributions
Giving attributes not effectively captured in algorithms
Donor motivations not adequately understood
In other words, it is not just about hidden wealth – it is about hidden giving
• How do we find hidden giving?
– Analytics is the key to unlocking hidden givingAnalytics
Hidden Giving
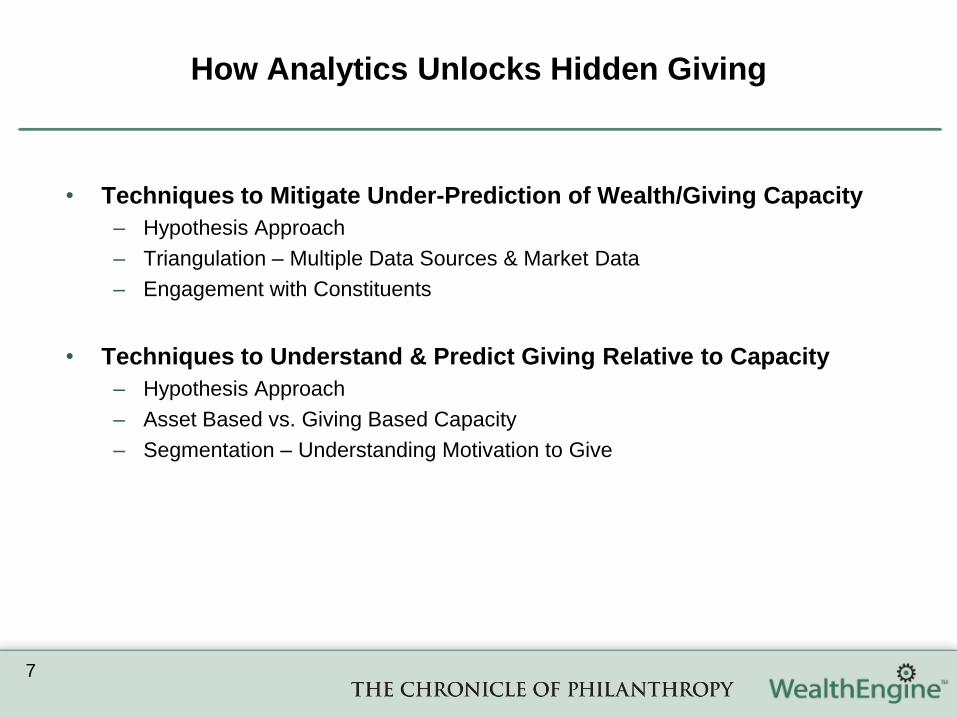
How Analytics Unlocks Hidden Giving
7
• Techniques to Mitigate Under-Prediction of Wealth/Giving Capacity
– Hypothesis Approach
– Triangulation – Multiple Data Sources & Market Data
– Engagement with Constituents
• Techniques to Understand & Predict Giving Relative to Capacity
– Hypothesis Approach
– Asset Based vs. Giving Based Capacity
– Segmentation – Understanding Motivation to Give
Finding Hidden Wealth – Hypothesis Approach
8
Hypothesis ApproachExample 1: Business Owners
as a group have hidden wealth
• Leverages free form thinking (“I
wonder if…”)
• Develop intuitive theories around
specific segments
• Validate theories using analysis
• Analysis compares capacity
distributions (and averages) between
segments
• Hidden Wealth is indicated when there
is a difference in distributions
0%
5%
10%
15%
20%
25%
30%
35%
40%
<$25K $25K - $100K $100K -$250K
$250K - $1 MM
$1 MM+
Business Owner
Non-Owner
Giving Capacity Ranges
% o
f P
op
ula
tion
Hypothesis Validated
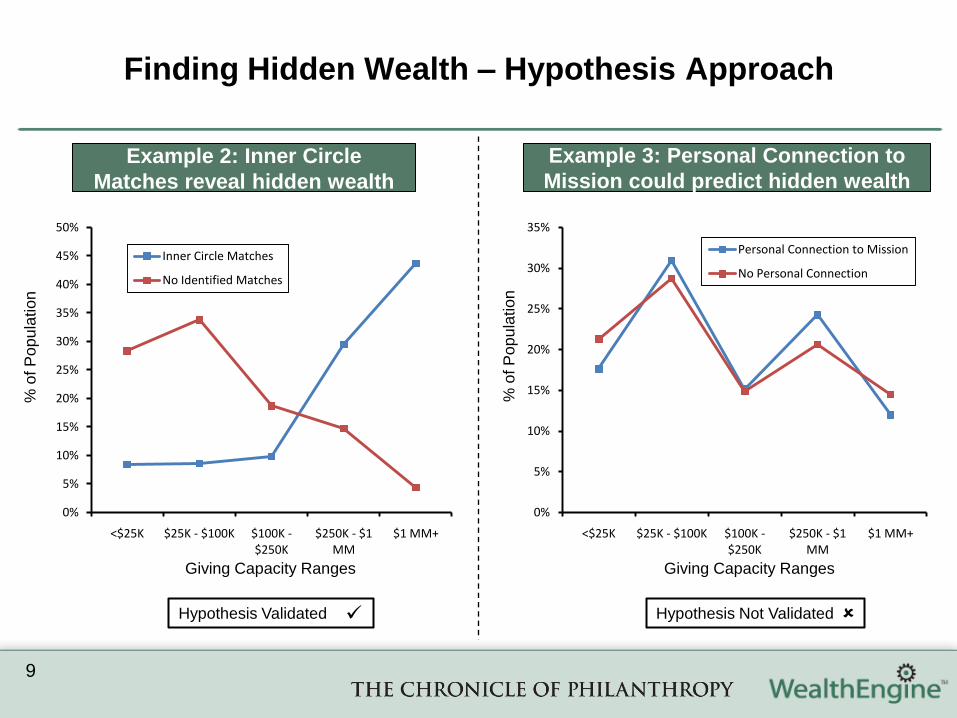
Finding Hidden Wealth – Hypothesis Approach
9
Example 2: Inner Circle
Matches reveal hidden wealth
Example 3: Personal Connection to
Mission could predict hidden wealth
% o
f P
op
ula
tion
0%
5%
10%
15%
20%
25%
30%
35%
40%
45%
50%
<$25K $25K - $100K $100K -$250K
$250K - $1 MM
$1 MM+
Inner Circle Matches
No Identified Matches
0%
5%
10%
15%
20%
25%
30%
35%
<$25K $25K - $100K $100K -$250K
$250K - $1 MM
$1 MM+
Personal Connection to Mission
No Personal Connection
% o
f P
op
ula
tion
Giving Capacity Ranges Giving Capacity Ranges
Hypothesis Validated Hypothesis Not Validated
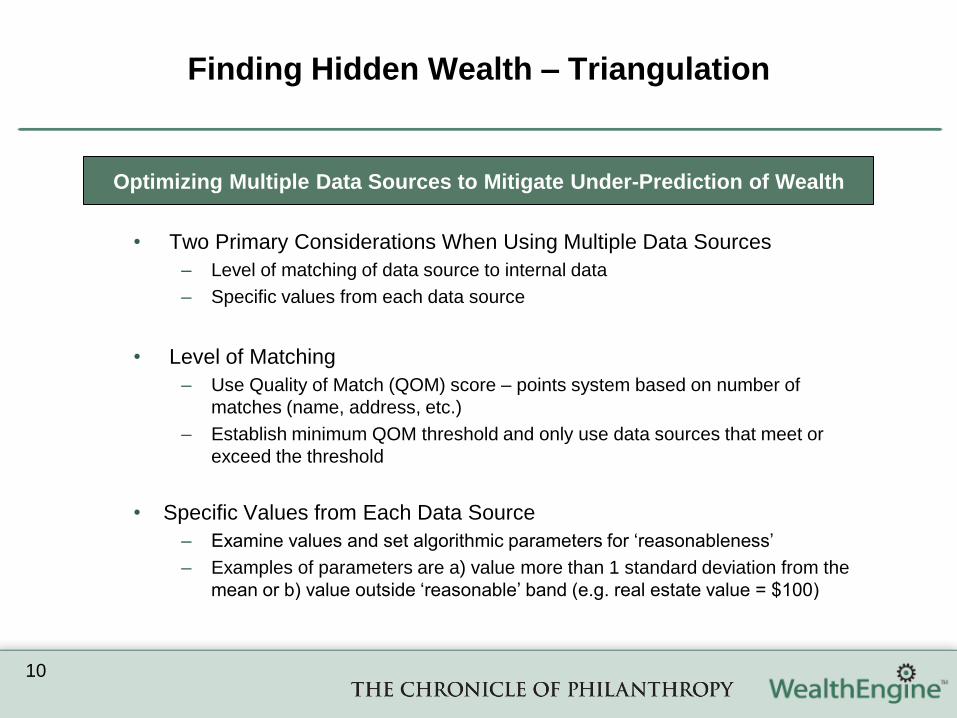
Finding Hidden Wealth – Triangulation
10
Optimizing Multiple Data Sources to Mitigate Under-Prediction of Wealth
• Two Primary Considerations When Using Multiple Data Sources
– Level of matching of data source to internal data
– Specific values from each data source
• Level of Matching
– Use Quality of Match (QOM) score – points system based on number of
matches (name, address, etc.)
– Establish minimum QOM threshold and only use data sources that meet or
exceed the threshold
• Specific Values from Each Data Source
– Examine values and set algorithmic parameters for „reasonableness‟
– Examples of parameters are a) value more than 1 standard deviation from the
mean or b) value outside „reasonable‟ band (e.g. real estate value = $100)
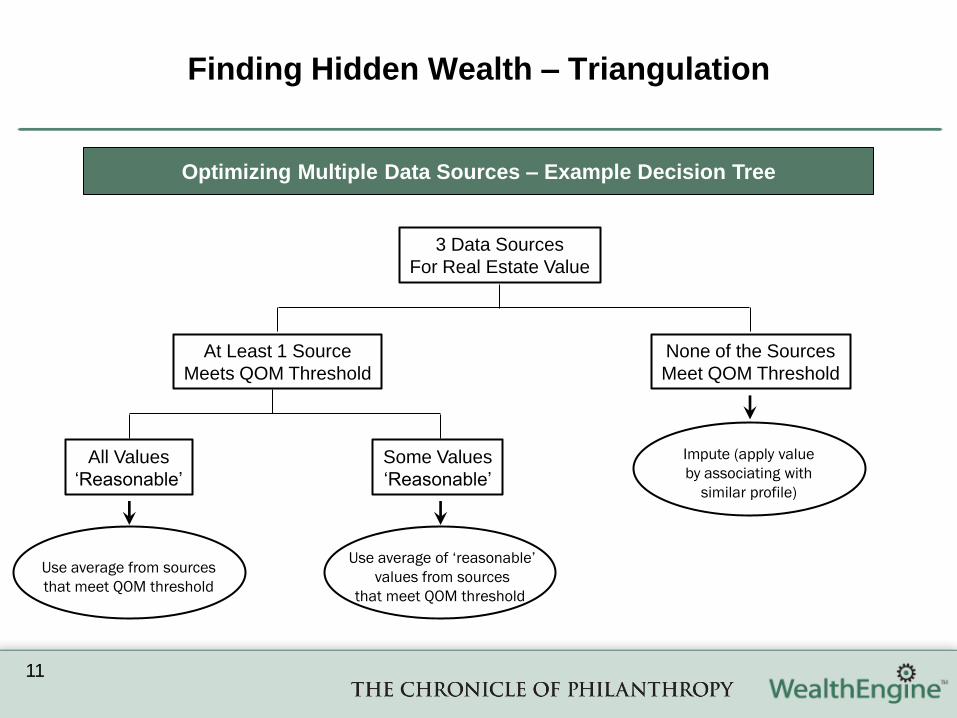
Finding Hidden Wealth – Triangulation
11
Optimizing Multiple Data Sources – Example Decision Tree
3 Data Sources
For Real Estate Value
At Least 1 Source
Meets QOM Threshold
None of the Sources
Meet QOM Threshold
All Values
„Reasonable‟
Some Values
„Reasonable‟
Use average from sources
that meet QOM threshold
Use average of ‘reasonable’
values from sources
that meet QOM threshold
Impute (apply value
by associating with
similar profile)

Finding Hidden Wealth – Triangulation
12
Size of net worth
Total assetsDebts and
mortgagesNet worth Personal residence Other real estate
Number Amount Number Amount Number Amount Number Amount Number Amount
(1) (2) (3) (4) (5) (6) (7) (8) (9) (10)
Total 2,728 11,076,759 2,099 850,622 2,728 10,201,246 2,062 1,185,941 1,5311,402,029
Under $1.5 million 531 736,039 468 231,035 531 480,113 410 176,105 255 134,674
$1.5 million under $2.0 million 746 1,386,077 544 98,187 746 1,287,890 549 229,369 406 206,626
$2.0 million under $3.5 million 846 2,316,701 614 147,370 846 2,169,331 639 342,206 475 329,893
$3.5 million under $5.0 million 247 1,082,889 192 58,950 247 1,023,939 194 127,444 153 152,634
$5.0 million under $10.0 million 231 1,668,002 176 104,811 231 1,563,191 173 148,543 149 230,146
$10.0 million under $20.0 million 79 1,155,326 64 69,849 79 1,085,477 61 76,472 58 137,770
$20.0 million or more 47 2,731,726 40 140,421 47 2,591,305 36 85,802 35 210,286
Using Market Data for Enhancement of Wealth Estimates
• Published market data can be used to confirm internal estimates and/or refine asset calculations
• Reconciling internal asset data with market statistics solidifies estimates (i.e. ensuring that asset
breakouts are aligned with market distributions)
• Market data can also be used to refine asset calculations (i.e. extrapolating individual asset
components using market factors)
Subset of IRS Statistics of Income Data
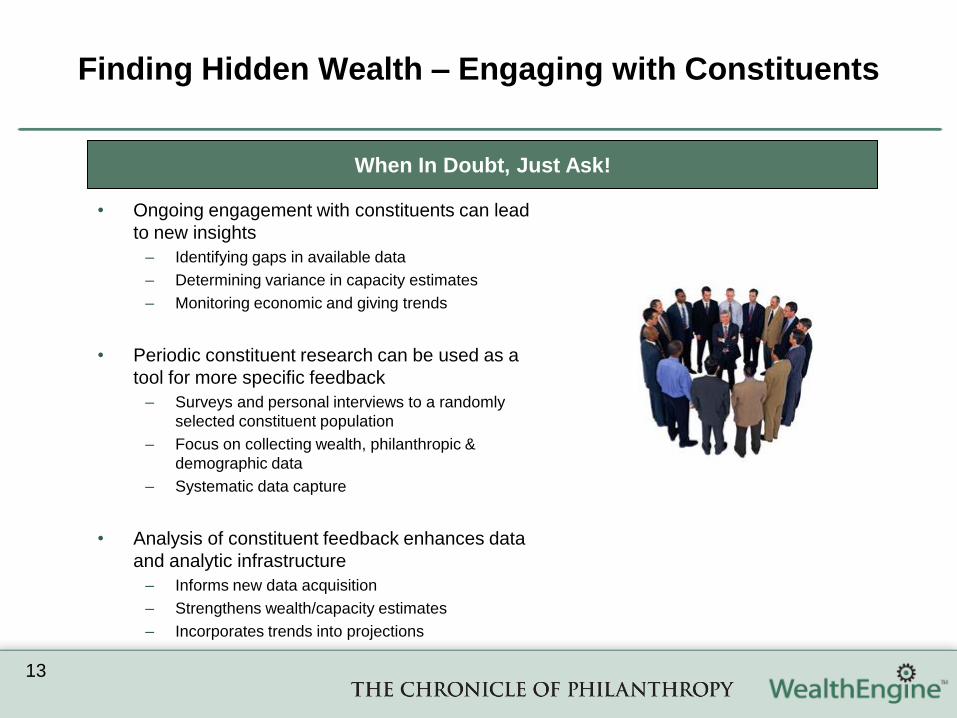
Finding Hidden Wealth – Engaging with Constituents
13
• Ongoing engagement with constituents can lead
to new insights
– Identifying gaps in available data
– Determining variance in capacity estimates
– Monitoring economic and giving trends
• Periodic constituent research can be used as a
tool for more specific feedback
– Surveys and personal interviews to a randomly
selected constituent population
– Focus on collecting wealth, philanthropic &
demographic data
– Systematic data capture
• Analysis of constituent feedback enhances data
and analytic infrastructure
– Informs new data acquisition
– Strengthens wealth/capacity estimates
– Incorporates trends into projections
When In Doubt, Just Ask!

Integration of Various Approaches – Hidden Wealth
14
Analytics Drives
Continuous
Capacity Rating
Enhancement
New
Hypotheses
Constituent
Research
New
DataMarket
Data
Hidden Wealth

Finding Hidden Giving – Hypothesis Approach
15
Hypothesis ApproachExample 1: Business Owners
practice hidden giving
• Analysis compares percent of capacity
given between segments
• Comparisons are made within capacity
ranges
• Hidden Giving is indicated when there
is a difference in giving between
segments within capacity ranges
Giving Capacity Ranges
% o
f C
ap
acity G
ive
n
Hypothesis Validated
0%
10%
20%
30%
40%
50%
60%
70%
$1+ $100K+ $250K+ $1MM+ $5MM+
Business Owner
Non-Owner

Finding Hidden Giving – Hypothesis Approach
16
Example 2: Inner Circle
Matches reveal hidden giving
Example 3: Personal Connection to
Mission could predict hidden giving
% o
f C
ap
acity G
ive
n
% o
f C
ap
acity G
ive
n
Giving Capacity Ranges Giving Capacity Ranges
Hypothesis Validated Hypothesis Validated
0%
20%
40%
60%
80%
100%
120%
$1+ $100K+ $250K+ $1MM+ $5MM+
Inner Circle Matches
No Identified Matches
0%
10%
20%
30%
40%
50%
60%
70%
80%
$1+ $100K+ $250K+ $1MM+ $5MM+
Personal Connection to Mission
No Personal Connection
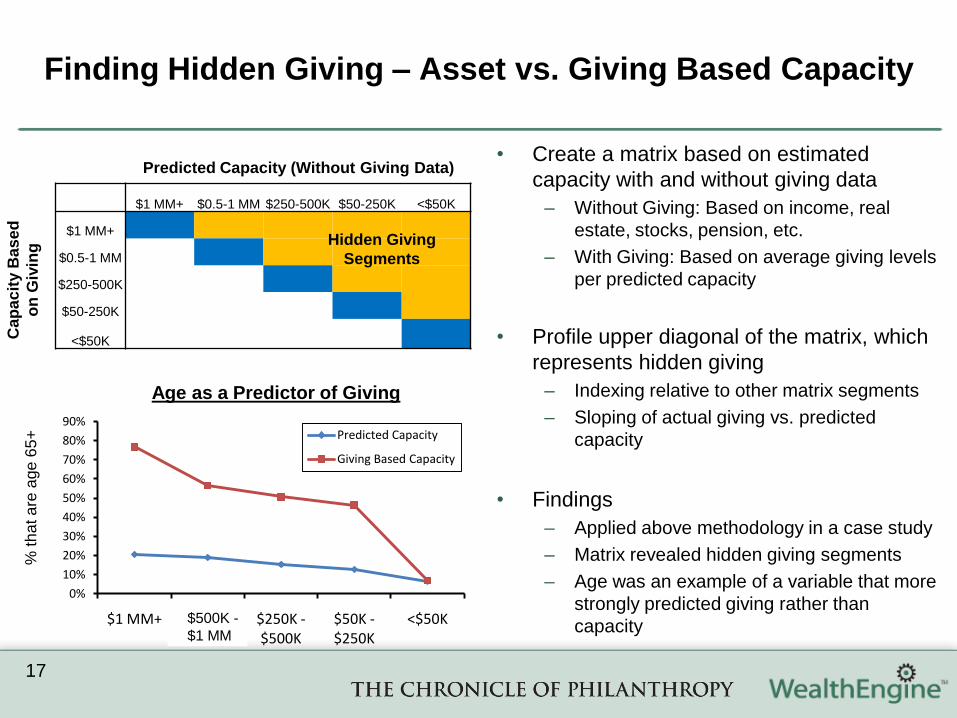
• Create a matrix based on estimated
capacity with and without giving data
– Without Giving: Based on income, real
estate, stocks, pension, etc.
– With Giving: Based on average giving levels
per predicted capacity
• Profile upper diagonal of the matrix, which
represents hidden giving
– Indexing relative to other matrix segments
– Sloping of actual giving vs. predicted
capacity
• Findings
– Applied above methodology in a case study
– Matrix revealed hidden giving segments
– Age was an example of a variable that more
strongly predicted giving rather than
capacity
$1 MM+ $0.5-1 MM $250-500K $50-250K <$50K
$1 MM+
$0.5-1 MM
$250-500K
$50-250K
<$50K
Hidden Giving
Segments
Predicted Capacity (Without Giving Data)
Cap
ac
ity B
as
ed
on
Giv
ing
0%
10%
20%
30%
40%
50%
60%
70%
80%
90%
$1 MM+ $500K - $1 MM
$250K -$500K
$50K -$250K
<$50K
Predicted Capacity
Giving Based Capacity
$500K -
$1 MM
Age as a Predictor of Giving
% th
at a
re a
ge
65
+
Finding Hidden Giving – Asset vs. Giving Based Capacity
17
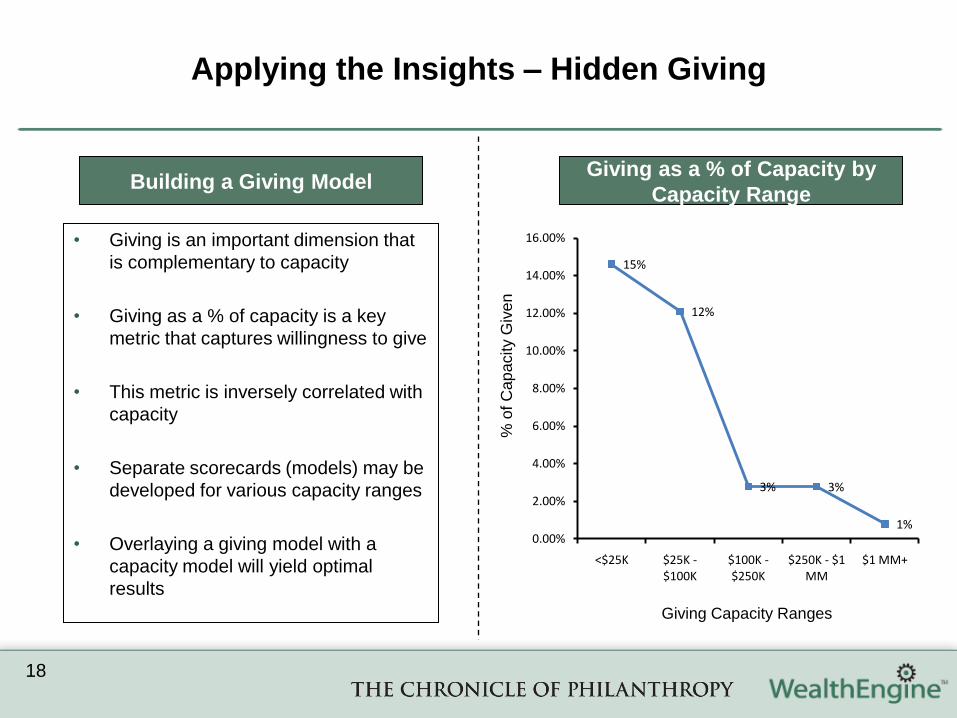
Applying the Insights – Hidden Giving
18
Building a Giving ModelGiving as a % of Capacity by
Capacity Range
• Giving is an important dimension that
is complementary to capacity
• Giving as a % of capacity is a key
metric that captures willingness to give
• This metric is inversely correlated with
capacity
• Separate scorecards (models) may be
developed for various capacity ranges
• Overlaying a giving model with a
capacity model will yield optimal
results
15%
12%
3% 3%
1%0.00%
2.00%
4.00%
6.00%
8.00%
10.00%
12.00%
14.00%
16.00%
<$25K $25K -$100K
$100K -$250K
$250K - $1 MM
$1 MM+
% o
f C
ap
acity G
ive
n
Giving Capacity Ranges
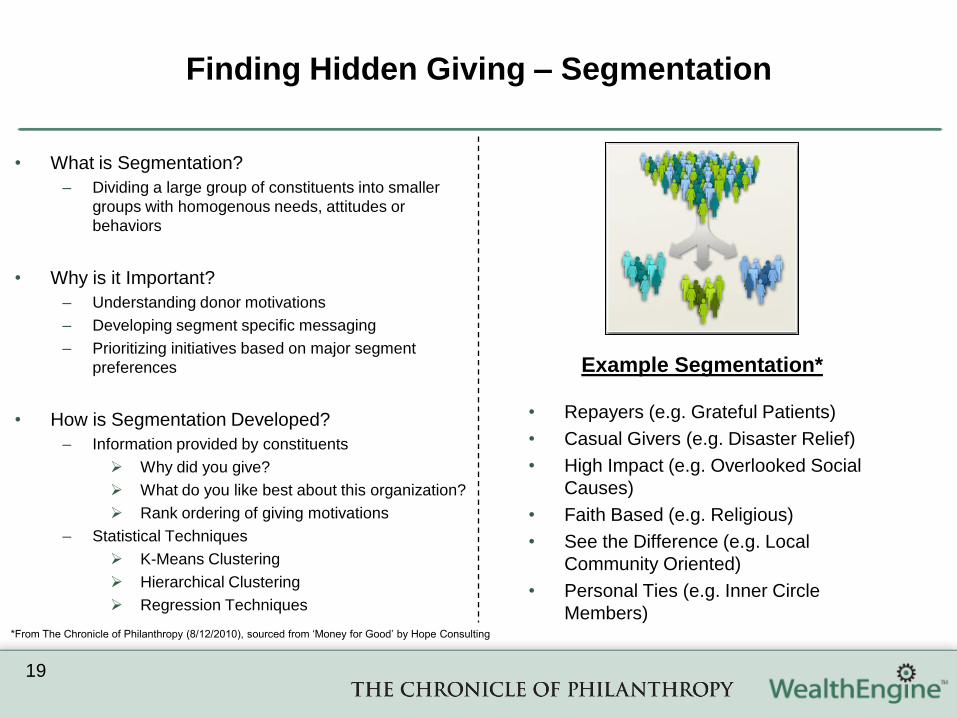
Finding Hidden Giving – Segmentation
19
• Repayers (e.g. Grateful Patients)
• Casual Givers (e.g. Disaster Relief)
• High Impact (e.g. Overlooked Social
Causes)
• Faith Based (e.g. Religious)
• See the Difference (e.g. Local
Community Oriented)
• Personal Ties (e.g. Inner Circle
Members)*From The Chronicle of Philanthropy (8/12/2010), sourced from „Money for Good‟ by Hope Consulting
• What is Segmentation?
– Dividing a large group of constituents into smaller
groups with homogenous needs, attitudes or
behaviors
• Why is it Important?
– Understanding donor motivations
– Developing segment specific messaging
– Prioritizing initiatives based on major segment
preferences
• How is Segmentation Developed?
– Information provided by constituents
Why did you give?
What do you like best about this organization?
Rank ordering of giving motivations
– Statistical Techniques
K-Means Clustering
Hierarchical Clustering
Regression Techniques
Example Segmentation*
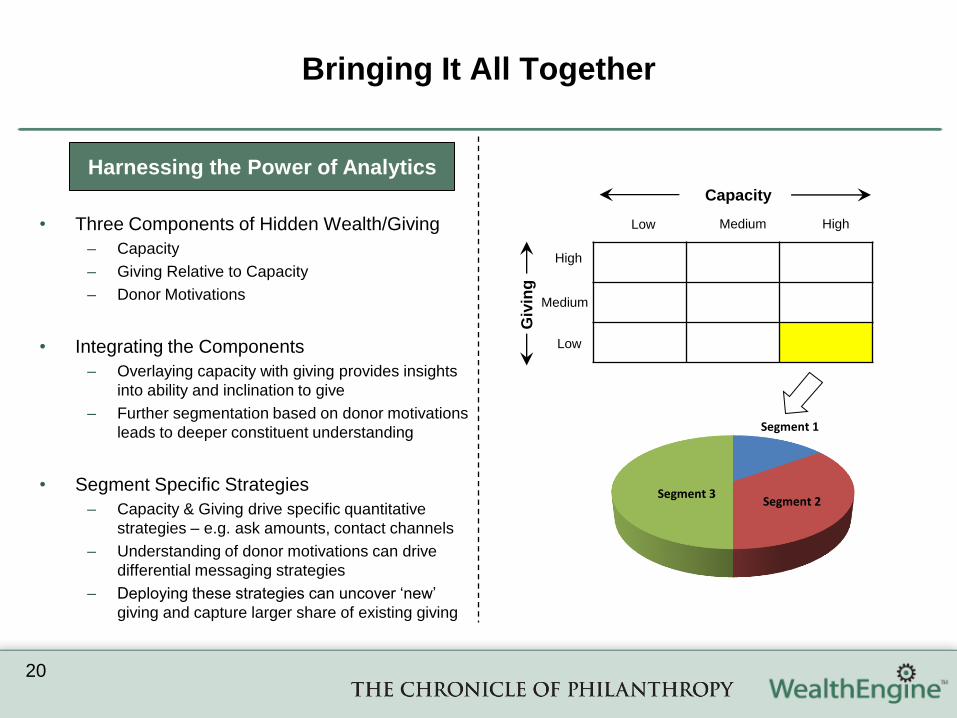
Bringing It All Together
20
Capacity
Giv
ing
Low Medium High
Low
Medium
High
Segment 1
Segment 2Segment 3
• Three Components of Hidden Wealth/Giving
– Capacity
– Giving Relative to Capacity
– Donor Motivations
• Integrating the Components
– Overlaying capacity with giving provides insights
into ability and inclination to give
– Further segmentation based on donor motivations
leads to deeper constituent understanding
• Segment Specific Strategies
– Capacity & Giving drive specific quantitative
strategies – e.g. ask amounts, contact channels
– Understanding of donor motivations can drive
differential messaging strategies
– Deploying these strategies can uncover „new‟
giving and capture larger share of existing giving
Harnessing the Power of Analytics

• We have explored several analytical techniques to find hidden wealth/giving
– Hypothesis Approach
– Triangulation
– Engagement with Constituents
– Asset Based vs. Giving Based Capacity
– Segmentation
• The techniques emphasize independent analysis of the three key aspects of giving
– Ability to Give – Related to Financial Capacity
– Inclination to Give – Related to Giving
– Organization Specific Giving – Related to Donor Motivation
• Integrating these aspects into strategy development can maximize fundraising success
– Uncover New Giving
– Capture Larger Share of Existing Giving
• It is not just about hidden wealth – it is about hidden giving
Key Takeaways
21

Questions?
22