Speaker System - The Menlo...
37
Speaker System Ben Adler 1 Abstract is paper describes the design and construction of an active filter circuit and speaker enclosure to form a speaker system. e speaker system was comprised of three speakers for three components: an Au- diotech (AT301) tweeter for the high-frequency component, a Visonik V525CS midrange speaker for the midrange-frequency component, and a Kicker 07CVR12 subwoofer for the low-frequency component. A fourth-order Linkwitz-Riley filter was constructed for the speaker system. e filter had three outputs—a high-frequency output, a mid- range-frequency output, and a low-frequency output—each wired to its corresponding speaker component. e high-frequency output for the filter was comprised of a high-pass active filter with a 3 dB point of 3100 Hz. e midrange-frequency output for the filter was comprised of a high-pass active filter with a 3 dB point at 310 Hz and a low-pass active filter with a 3 dB point at 3100 Hz. Each speaker component also had its own individual volume within the enclosure and walls lined with 1 inch-thick Polyfill. e high-frequency speaker component had a volume of .039 cubic feet, the midrange-frequency speaker component a volume of .149 cubic feet, and the low-frequency speaker component a volume of 2.029 cubic feet. 2 e Big Idea e big idea for this project was to construct a speaker system. Speaker systems are comprised of multiple components including a filtration system, speaker boxes, and speaker cones. I began with speaker shells (speaker still in cone, unwired, not in a box) of different sizes (for high- er, midrange, and low frequencies). en I created a filtration system, is paper was written for Dr. James Dann’s Applied Science Research class in the spring of 2010.
Transcript of Speaker System - The Menlo...

Speaker System
Ben Adler
1 Abstract
This paper describes the design and construction of an active filter circuit and speaker enclosure to form a speaker system. The speaker system was comprised of three speakers for three components: an Au-diotech (AT301) tweeter for the high-frequency component, a Visonik V525CS midrange speaker for the midrange-frequency component, and a Kicker 07CVR12 subwoofer for the low-frequency component.
A fourth-order Linkwitz-Riley filter was constructed for the speaker system. The filter had three outputs—a high-frequency output, a mid-range-frequency output, and a low-frequency output—each wired to its corresponding speaker component. The high-frequency output for the filter was comprised of a high-pass active filter with a 3 dB point of 3100 Hz. The midrange-frequency output for the filter was comprised of a high-pass active filter with a 3 dB point at 310 Hz and a low-pass active filter with a 3 dB point at 3100 Hz. Each speaker component also had its own individual volume within the enclosure and walls lined with 1 inch-thick Polyfill. The high-frequency speaker component had a volume of .039 cubic feet, the midrange-frequency speaker component a volume of .149 cubic feet, and the low-frequency speaker component a volume of 2.029 cubic feet. 2 The Big Idea
The big idea for this project was to construct a speaker system. Speaker systems are comprised of multiple components including a filtration system, speaker boxes, and speaker cones. I began with speaker shells (speaker still in cone, unwired, not in a box) of different sizes (for high-er, midrange, and low frequencies). Then I created a filtration system,
This paper was written for Dr. James Dann’s Applied Science Research class in the spring of 2010.

that is, a circuit that splits up an electric signal output (music from an iPod, for example) into different speakers based on their ranges of frequencies. The system was designed so that one could play an iPod or any signal-emitting device through the system and obtain high-quality sound. Due to the filtration system, the larger woofer speak-ers primarily play low frequencies while the smaller tweeter speakers primarily play high frequencies. The speaker boxes are designed such that the sound emitted by each speaker box resonates appropriately and sounds clean to a listener’s ears. Construction of the system required an understanding of sound and how it works, as well as the application of principles of circuitry.
3 Introduction
I undertook this project because I was interested in sound engineer-ing and sound design, and had been since seventh grade, when I took apart my first set of headphones. I’ve always loved music. There are many other people who enjoy listening to music for entertainment and would enjoy listening to high-quality sound. Speaker systems are used not only in cars but also in home theaters, clubs, and concert halls. There are a wide variety of places where speaker systems are utilized, so building a speaker system is very useful for a lot of people.
However, there is also significant benefit to creating one’s own speaker system instead of buying a new, factory-made system because it is on the whole much cheaper to create your own system. [1] Creating your own system would provide more bang for the buck. The speaker system created for this project can be transferred into a car as well as used in the home. 4 Theory
In general, there are four components to any speaker system of quality: the speaker box, the speaker cone itself, an amplifier, and a filtration system (otherwise known as a crossover).
42 Ben Adler

4.1 Filter
The filtration system primarily serves one purpose: to pass or not pass a signal based on the signal’s frequency. Depending on how the circuit is designed, it can pass either higher (high-pass filter) or lower (low-pass filter) frequencies based on a cutoff number determined by the arrangement and values of the capacitors, resistors, and/or inductors in the circuit.
Depending on the values of these elements (to be explained later in this section) a cutoff frequency is determined, where a cutoff frequency is the frequency at which the signal is not passed completely or “cut off.” Designing a filter with a specified cutoff frequency is a difficult process involving not only topology but also component values. If a high-pass filter and a low-pass filter have different cutoff frequencies and are wired correctly, a band-pass filter can be created, passing a range of frequencies in between the two cutoff frequencies. However, a given filter doesn’t block out all frequencies higher than the cut-off frequency. It actually passes them, but at an intensity that decays exponentially once the cutoff frequency is exceeded. The rate at which the maximum intensity drops as the frequency moves farther past the cutoff frequency is called “fall off.” Depending on the “order,” or how many different circuit elements are used in a filter, the fall off is steeper for higher orders. These relationships can all be shown through a graph called a Response Curve. [2]
There are two classes of analog electronic filters: passive and active. Both classes can have modified cutoff frequencies, orders, and passes (high, low, or band). There are two primary differences between a passive filter and an active filter, however. One of these fundamental differences is the circuit element they employ. Both circuits utilize capacitors in order to filter out the low frequencies. Since capacitors function by storing charge, they tend to block out currents that are closer to DC current as opposed to high-frequency AC current. By equation, capacitors have an impedance of 1/(wC), where w=2πf. [3] As one can tell from the equation, the impedance of the element drops as the frequency
THE MENLO ROUNDTABLE 43

rises and rises as the frequency falls. The other main component of filters varies between passive and active filters. Passive filters primarily utilize inductors to filter out the higher frequencies, whereas active filters primarily utilize resistors to do this. Inductors filter out higher frequencies according to Faraday’s Law:
When the current through an inductor changes, a force is created to oppose the change. Higher frequencies of sound have faster oscillating currents. When any current is run through an inductor, a change in magnetic flux is produced. In contrast to a lower frequency (where the oscillations are less frequent), an equal change in magnetic flux due to high-frequency oscillation occurs in a much shorter time, creating a stronger opposing electromotive force and therefore higher equivalent resistance, than a lower frequency would produce. As such, inductors have higher impedance for high frequencies than for low frequencies. [3] The equivalent impedance of an inductor is Z=wL, where w=2πf. [4] However, in active filters, resistors are used instead of inductors, and their impedance is Z=R. [4] While the impedance of a resistor does not depend on the frequency, the topology of a filter circuit directs current to go either through a resistor with impedance of R or through an element with frequency-dependent impedance. Active filters also utilize an operational amplifier, an active device that requires a voltage supply. [2] The second, and more apparent, distinction between passive and active analog filters concerns where the filtration system is located in the circuit leading to the speaker.
44 Ben Adler

Figure 1: Placement of passive filter.
In a passive filter the filtration system is located after the amplifier, before the speaker. [5]
Figure 2: Placement of active filter. [5]
THE MENLO ROUNDTABLE 45

However, in an active filter the signal is sent directly into the filter, processed, then sent to the amplifier, and that amplified signal is then sent to the speaker. The important consequence of this difference is that in a passive filter only one amplifier is needed, whereas a separate amplifier will be needed for every filter component in the active filtration system. [5]
4.2 Enclosure
Speaker enclosures serve the following purposes: to “control” the sound wave produced by the back end of the speaker, to separate the individual speakers [6], to increase the efficiency of the system (how loud the speaker reproduces sound given an input signal) [7], and to provide a place for the speaker to be located.
There are many ways engineers control the sound wave produced by the rear end of the speaker. The first choice an engineer constructing a speaker enclosure has to make is whether to make a ported or a sealed enclosure.
[8] [8]
Figure 3: Diagrams of the basic outline of a sealed enclosure (left) and a ported enclosure (right). In a sealed enclosure the air is sealed inside the box, while in a ported enclosure it is allowed to move in and out of the box through the port.
In a ported enclosure the front wave is not the only wave used to produce sound for the listener. The rear sound wave travels back and out of the port to the listener. In a sealed enclosure the front sound wave coming from the speaker hits the listener, but the rear wave dissipates inside
46 Ben Adler

the box. Engineers face a trade-off when choosing between these two designs. Ported designs tend to have louder bass output and are more efficient (more loudness per power input), especially at lower frequencies [8], although that comes at the cost of space, quality of sound, and ease of construction. Sealed enclosures tend to be more compact and emit better quality sound, but tend to be less efficient than their ported counterparts. [9] In the interests of quality and clarity of sound, the enclosure designed for this paper is a sealed one, and the rest of this section will address those types only.
In the case of a sealed enclosure the listener hears only the front wave emitted by the speaker, because the back wave must be dissipated within the enclosure. Otherwise, standing waves are created within the enclosure, and these can (if preventative measures are not taken) “approach the output of the [speaker] itself.” [10] There are various ways of preventing standing waves from occurring inside the enclosure. One is by using synthetic fiber sheets such as Polyfill. The fibers in the sheet dissipate the energy by absorbing bits of it, dampening the standing waves [10], as well as making the box act as if it were a larger volume. [6] Another important step to take is to make sure that the walls of the enclosure are dense and rigid by using materials such as ¾” MDF, preventing standing waves from occurring. [6] [10] Another method for preventing standing waves and resonance is the use of internal bracing. Braces that hold multiple walls of the box together make it more difficult for standing waves to form. [11]
While they are not discussed or utilized in this paper, the next step to constructing a speaker enclosure would in theory be to understand and utilize Thiele-Small parameters. Thiele-Small parameters are a series of variables used to describe a speaker. These parameters would then influence the exact internal volume, dimensions, and port size in order to create an enclosure perfectly designed for the individual speaker. [12] [13]
5 Circuit Diagrams/Sketchups
The filter used was a Linkwitz-Riley active filter. This filter design was chosen after running experiments on previous prototypes (see Appendix
THE MENLO ROUNDTABLE 47

B). These experiments showed that active filters are more practical for this speaker system, and that higher-order filters have a steeper cutoff than lower-order filters. The previous active filter was a first-order filter, while the Linkwitz-Riley filter was a fourth-order filter. This model has three components: high-pass, band-pass, and low-pass sections, which will go to tweeters, midrange speakers, and woofers respectively. This is the filter diagram:
Figure 4: Fourth-order Linkwitz-Riley crossover. [16]
Unlike my prototype filters (see Appendix B), this circuit utilizes many operational amplifiers and is a fourth-order filter. Moreover, this circuit is an entire crossover network and has a high-frequency, middle-frequency, and low-frequency output. If two of the circuits are used, these circuits could function as stereo components gener-ating both right and left sound outputs. [16] The accepted values for
48 Ben Adler

the circuit’s cutoff frequencies are as follows. The high-frequency out-put utilizes a high-pass filter with a cutoff frequency of 3100 Hz. The midrange-frequency output utilizes a band-pass filter comprised of a low-pass filter with a cutoff frequency of 3100 Hz and a high-pass filter with a cutoff frequency of 310 Hz. The low-frequency output is comprised of two low-pass filters, one with a cutoff frequency of 3100 Hz and another with a cutoff frequency of 310 Hz. Here is a simpler layout of the circuit:
Figure 5: Block diagram of fourth-order Linkwitz-Riley filter. [16]
As seen in Figure 5, the circuit can be divided into multiple sections. The input buffer ensures that the signal is coming from a low-imped-ance source. [16] The output gain and buffers are just repetitions of the previous “block.” However, since these components wouldn’t be filtered much, the signal is then amplified slightly. The amount of amplification is dependent on the operational amplifier.
When this Linkwitz-Riley filter was tested, each filter component appeared to be a success.
6 Enclosure
The system designed is a three-way speaker system, and therefore has three different speaker components: tweeters for the highest frequencies,
THE MENLO ROUNDTABLE 49

midranges for the midrange frequencies, and woofers for the lowest frequencies. A three-way system has the potential of having more than one speaker for each range of frequencies, although this particular speaker system uses only one speaker for each range. A sealed speaker enclosure was designed out of .75” MDF:
Figure 6: Designed three-way speaker system enclosure.
The general shape of the external speaker enclosure was chosen on purely aesthetic grounds. The enclosure itself is sealed and all air is kept within it. The woofer compartment is somewhere between infinite baffle and acoustic suspension design. The internal enclosures separated from the main subwoofer enclosure were created to ensure that the tweeter and midrange speakers’ outputs would not be affected or harmed by the sound waves produced by the woofer speaker, which if it did occur could heavily damage the midrange and tweeter speakers. The dimensions of the designed enclosure can be seen in Figures 7 and 8:
50 Ben Adler

Figure 7: Dimensions of the external speaker enclosure.
Figure 8: Dimensions of the tweeter and midrange enclosures.
THE MENLO ROUNDTABLE 51

Figure 9: Orientation of the speakers on the front panel.
The dimensions of the enclosures were based on the suggested vol-ume and dimensions of the speakers. The most important volume consideration was the woofer’s suggested volume, since as the largest driver it requires the most space. The driver used for the woofer was a 2007 model CVR12, and the suggested volume for the enclosure was from 1 cubic foot to 4.6 cubic feet, where the 1 cubic foot bound rep-resented maximum compactness and the 4.6 cubic feet bound repre-sented maximum sound quality. [17] The other relevant factors were the dimensions of the speakers themselves. The speakers were a 3” Audio Tech AT301 for the tweeter, a 5.25” Visonik (V525CS) speaker for the midrange, and a 12” Kicker (07CVR12) speaker for the woofer. Dimensions integral to the design of the enclosure were measured and recorded as follows:
Speaker Outer Frame Diameter
Hole Cut Out Diameter
Mounting Depth
BottomDiameter
AT301 3.75” 2.75” 1.5” 2.75”V525CS 5.5” 5” 2” 3”07CVR12 [17] 12.5” 11. 125” 6.3125”
Figure 10: Chart of specifications of the speakers used.
52 Ben Adler

The dimensions of each enclosure were designed based on this data. Each speaker was to be centered along the y-axis of the front panel. The width of each enclosure was designed to be slightly greater than the outer frame diameter of each enclosure’s respective speaker. The depth of each enclosure was designed to be greater than the mounting depth of each driver. The distance between speakers was designed to be around 4” so the magnetic flux created by one speaker would be unlikely to interfere with an adjacent driver. These dimensions were calculated on the assumption that the subwoofer enclosure volume would be somewhere between 1 and 4.6 cubic feet. The midrange and tweeter enclosure volumes were empirically designed, although the volumes were designed to be significantly smaller than that of the subwoofer enclosure. The calculations were as follows:
Tweeter Enclosure Volume: (4-1.5)(5.5)(6 7/16 - 1.5)/1728 = .039 cubic feet (1.104 L)
Midrange Enclosure Volume: (7.75)(9 13/16 - 1.5)(4)/1728 = .149 cubic feet (4.219 L)
Woofer Enclosure Volume: (14.5 – 1.5)(30.5-1.5)(11)/1728 - .039 - .149 = 2.029 cubic feet (57.455 L)
Several things about these calculations are important to note. The vol-ume for each enclosure was calculated from the internal dimensions of enclosure. Since .75” MDF was used, for some dimensions 1.5” was subtracted in order to compensate. Also, each volume was divided by 1728 to convert cubic inches to cubic feet. Although the woofer enclo-sure’s volume does not include the Polyfill, the volume is well above the 1 cubic foot minimum, and unlikely to fall beneath it when the Polyfill is installed.
7 Results 7.1 Filter Experiment 1: Low-pass Passive Crossover Comparisons
(For more information concerning the crossovers in this section, see Appendix B.)
THE MENLO ROUNDTABLE 53

In this experiment, two low-pass passive crossovers were built and qualitatively compared. The two passive filters were more specifically first- and second-order low-pass passive Butterworth crossovers (see Figure 11). A third- or higher-order crossover was not used due to lack of component values.
Figure 11: This diagram details the low-pass filters that were built. The upper diagram was the first-order filter, while the middle diagram was the second-order filter. [14]
Instead of inductors, resistors with a value of 100 mΩ were used in place of L1 and L2. The C2 value for the second-order passive filter was 7 µF. Values were determined by those found in a low-pass passive filter diagram. [5] Both circuits were then wired to an amplifier in par-allel and an input signal (a BK Precision 4012A frequency generator) was sent through the amplifier. The output intensity was qualitatively
54 Ben Adler

compared. Also, the frequency output was varied and the attenuation was qualitatively compared.
It was found that both systems produced similar sound intensity at low frequencies. Once the frequency rose past a certain point (the cutoff frequency), both filters began to attenuate the frequency. However, the second-order filter’s output faded faster than the first-order filter. The attenuation on the dB-frequency graph must have been steeper in the second-order than the first-order filter. Nonetheless, these results were expected, as almost by definition higher-order crossovers attenuate faster than lower orders.
Since it is beneficial for speaker systems to have faster attenuating crossovers, the second-order passive crossover is more suitable for a speaker system. Therefore a second-order or higher filtration system was utilized for later prototypes.
7.2 Filter Experiment 2: Passive Crossover Experiment
(For more information concerning the crossovers in this section, see Appendix B.)
In this experiment a filtration system was constructed and wired to an amplified input frequency (music from an iPhone) containing high-, medium-, and low-frequency components. The filtration system was comprised of three second-order passive filters, one high pass, one band pass, and one low pass.
THE MENLO ROUNDTABLE 55
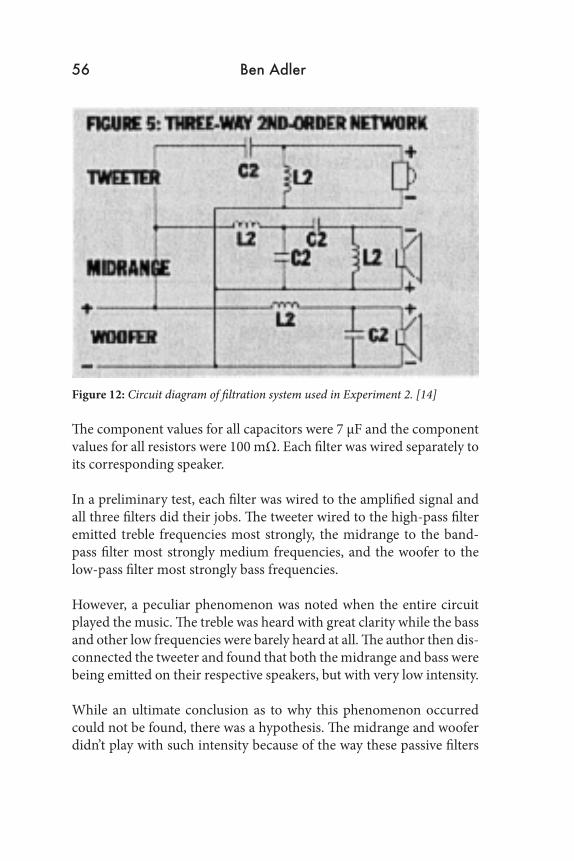
Figure 12: Circuit diagram of filtration system used in Experiment 2. [14]
The component values for all capacitors were 7 µF and the component values for all resistors were 100 mΩ. Each filter was wired separately to its corresponding speaker.
In a preliminary test, each filter was wired to the amplified signal and all three filters did their jobs. The tweeter wired to the high-pass filter emitted treble frequencies most strongly, the midrange to the band-pass filter most strongly medium frequencies, and the woofer to the low-pass filter most strongly bass frequencies.
However, a peculiar phenomenon was noted when the entire circuit played the music. The treble was heard with great clarity while the bass and other low frequencies were barely heard at all. The author then dis-connected the tweeter and found that both the midrange and bass were being emitted on their respective speakers, but with very low intensity.
While an ultimate conclusion as to why this phenomenon occurred could not be found, there was a hypothesis. The midrange and woofer didn’t play with such intensity because of the way these passive filters
56 Ben Adler

were constructed. As seen in Figure 12, the parts required were both inductors and capacitors, but resistors and capacitors were used instead. This inadequate substitution likely led to inadequate results in filtra-tion. While the passive high-pass filter played well, the low- and band-pass filters didn’t as they depended on resistors to do the job of the inductors for filtering.
This problem could likely be avoided by utilizing inductors as opposed to resistors. However, inductors are not only clunky but also expensive and would need to be specially ordered in bulk. Due to both monetary and practicality constraints, I decided to use filters that did not require inductors. The ideal filter for this type of system would be an active one.
7.3 Filter Experiment 3: Low-pass Active Crossover
(For more information concerning the crossovers in this section, see Appendix B.)
A quantitative experiment was run in order to discover the cutoff frequency and fall off of the low-pass active filter on the left:
Figure 13: Circuit diagram of an active low-pass filter (on left) and active high-pass filter (on right). [16]
A BK Precision 4012 A-frequency generator supplied the input frequency and an oscilloscope measured the output frequency. The frequency generator was also wired into a separate input on the oscil-loscope. The operational amplifier was powered by a separate power
THE MENLO ROUNDTABLE 57

supply. Four criteria were measured at intervals of 10-20 Hz from 10 to 600 Hz: maximum input voltage, maximum output voltage, frequency in, and frequency out. For the raw data chart, see Appendix C. These raw data points were plugged into the equation: dB=-20log(Vout/Vin). [18] This equation was used to generate the following data.
Frequency (Hz) Decibels (dB) Frequency (Hz) Decibels (dB)10 1.8684 260 -17.233920 0.5793 280 -18.976930 0 300 -2040 -0.5793 320 -21.159850 -1.2734 340 -22.498860 -1.7845 360 -24.759670 -2.7368 380 -26.020680 -3.5218 400 -27.496390 -4.3611 420 -28.5194100 -4.0329 440 -29.7623110 -5.3063 460 -31.0181120 -5.5241 480 -32.34867140 -7.4477 500 -33.4528160 -8.7867 520 -35.2957180 -10.3703 540 -36.8478200 -12.3085 560 -38.5073220 -13.8447 580 -40.5606240 -15.7829 600 -44.0824
Figure 14: Experiment 3 data for dB at frequencies.
This data was then transformed into a response curve from which the attenuation and the cutoff frequency could be determined.
58 Ben Adler
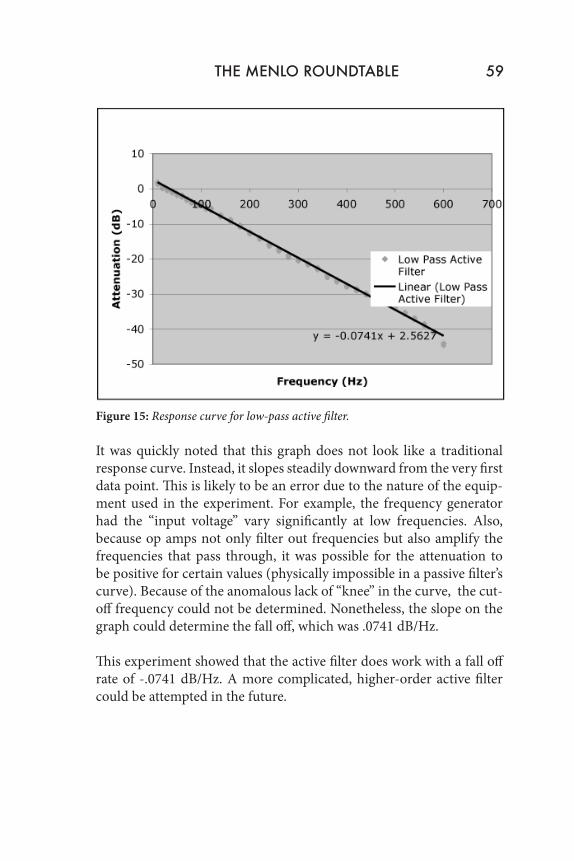
Figure 15: Response curve for low-pass active filter.
It was quickly noted that this graph does not look like a traditional response curve. Instead, it slopes steadily downward from the very first data point. This is likely to be an error due to the nature of the equip-ment used in the experiment. For example, the frequency generator had the “input voltage” vary significantly at low frequencies. Also, because op amps not only filter out frequencies but also amplify the frequencies that pass through, it was possible for the attenuation to be positive for certain values (physically impossible in a passive filter’s curve). Because of the anomalous lack of “knee” in the curve, the cut-off frequency could not be determined. Nonetheless, the slope on the graph could determine the fall off, which was .0741 dB/Hz.
This experiment showed that the active filter does work with a fall off rate of -.0741 dB/Hz. A more complicated, higher-order active filter could be attempted in the future.
THE MENLO ROUNDTABLE 59

7.4 Experiment 4: Testing the Linkwitz-Riley Filter
In this experiment, the effectiveness of the final Linkwitz-Riley filter circuit was tested. As noted above, this filter is a fourth-order, three-component filter. Each component represented a range of frequencies to be sent to its respective speaker.
Figure 16: The final Linkwitz-Riley filter tested in Experiment 4. [16]
This experiment was run to test the effectiveness of each of the filter components in the circuit. There were four tests to be run: the frequency response of the high-pass filter, the frequency response of the band-pass filter, the frequency response of the low-pass filter, and the range of frequencies exhibited without a filter. In each test, a specific sound sample was run through the circuit and ultimately out of the V525CS
60 Ben Adler

speaker. The speaker’s output was measured by a microphone attached to a LabQuest, which recorded the sound intensity (in dB) at 10000 samples per second for a time of .1 seconds. The results were graphed and underwent a Fast Fourier Transform (FFT). FFT is a technique utilized in many areas of research that takes a complex wave signal (a sound wave comprised of multiple frequencies) recorded by the micro-phone and converts it from a time-based graph to a frequency-based graph. The graph displays the frequencies and their relative intensities that the sound wave is comprised of instead of the overall wave. The graph was then analyzed to determine whether or not the filter circuit components were effective.
A sound sample that played as many different frequencies as possi-ble at similar intensities had to be used in order to adequately assess the effectiveness of the filter components. That way each component could not only pass and amplify specific frequencies but also filter out other frequencies, proving the filter’s effectiveness. A ten-second clip of white noise [19] was used as this sound sample. White noise was used because it is the signal where hypothetically every single frequency is played simultaneously at the same intensity. While true white noise can only exist in theory (as one cannot truly synthesize an infinitely high frequency), the range in which this divergence would take place was well outside the range being tested. [20]
Before proceeding to the data, a few things must be noted. One is that on the FFT graphs there is a grey line at 0 Hz. This represents the lower bound for frequency that could be played. Another thing to note is that one aspect of the experimental design that was not controlled was the distance between the speaker and the microphone. However, this distance was held constant during each recording, so distance was con-stant for any individual FFT but the absolute intensity value (in dB) cannot be compared between FFT graphs. A final thing that should be noted before proceeding to the data is that this data (without sufficient statistics techniques) cannot be used to determine the 3 dB point of the respective filters. Instead, the data can be used to verify whether or not the accepted value of the filters is even remotely accurate.
THE MENLO ROUNDTABLE 61

Before data for any of the filter components could be taken, an FFT for the sample of white noise had to be taken as a negative control. For this data, the speaker was connected directly to the signal, and therefore no filtration occurred. When the data was analyzed, the following FFT was produced:
Figure 17: Fast Fourier Transform of white noise through the V525CS.
This FFT shows that while multiple spikes and troughs do exist within the range of expressed frequencies, the white noise signal proved to be an adequate representation of white noise. The signal adequately expressed every frequency between 0 Hz and 4800 Hz. Moreover, the signal appeared to express this range of frequencies with relatively similar intensity. The highest intensity frequency differed from the lowest intensity frequency by only around .0007 dB, allowing for error in background noise, creation of white noise, or the particular .1 seconds the sample was taken in. Since the sample proved to be adequate white noise, each filter should have a higher average intensity within the range it passed and a lower one in the ranges it filtered out.
62 Ben Adler

In order to obtain data for the high-pass filter, the signal was wired up to the input of the circuit while the speaker was connected to the high-frequency output. This allowed the signal to run through the high-pass filter. When the data was analyzed the following FFT resulted:
Figure 18: Fast Fourier Transform of white noise through the high-pass filter and then through the V525CS.
This FFT shows that the high-pass filter was successful in only passing highest frequencies. As displayed in Figure 17, the white noise signal consisted of a spectrum of frequencies with relatively consistent intensity from 0 Hz to 5000 Hz. However, as seen in Figure 18, when the signal was run through the high-pass filter, lower frequencies were only passed at relatively low intensities and higher frequencies passed at relative-ly high intensities. In other words, the high-pass component of the Linkwitz-Riley circuit was successful. The accepted value for the 3 dB point of the high-pass filter was 3100 Hz. While it is difficult to assess whether or not the frequency begins to attenuate at higher frequencies, the frequency does appear to be attenuating at frequencies higher than 3100 Hz. The 3 dB point does appear to be relatively close to 3100 Hz.
THE MENLO ROUNDTABLE 63

In order to obtain data for the band-pass filter, the signal was wired up to the input of the circuit while the speaker was connected to the midrange-frequency output. This allowed the signal to run through the band-pass filter. When the data was analyzed the following FFT resulted:
Figure 19: Fast Fourier Transform of white noise through the band pass filter and then through the V525CS.
This FFT shows that the band-pass filter was successful in passing only midrange frequencies. As displayed in Figure 17, the white noise signal consisted of a spectrum of frequencies with relatively consistent intensity from 0 Hz to 5000 Hz. However, as seen in Figure 19, when the signal was run through the band-pass filter, the lowest and highest frequencies were only passed at relatively low intensities and the middle range of frequencies (500-3000) passed at relatively high intensities. In other words, the band-pass component of the Linkwitz-Riley circuit was effective. The band-pass filter was designed to pass frequencies 310 Hz through 3100 Hz and dampen the signal outside of these frequencies. These particular values are not completely supported by Figure 19, as the figure shows the signal beginning to dampen the signal before the 310 Hz and 3100 Hz cutoff frequencies. Despite these inconsistencies,
64 Ben Adler

the band-pass filter was successful overall, as it passed a midrange band of frequencies and attenuated anything outside this range.
In order to obtain data for the low-pass filter, the signal was wired up to the input of the circuit while the speaker was connected to the low-frequency output. This allowed the signal to run through the low-pass filter. When the data was analyzed the following FFT resulted:
Figure 20: Fast Fourier Transform of white noise through the low-pass filter and then through the V525CS.
This FFT shows that the low-pass filter was successful in passing only the lowest frequencies. As displayed in Figure 17, the white noise signal consisted of a spectrum of frequencies with relatively consistent inten-sity from 0 Hz to 5000 Hz. However, as seen in Figure 20, when the sig-nal was run through the low-pass filter, higher frequencies were only passed at relatively low intensities and the lowest frequencies passed at relatively high intensities. In other words, the high-pass component of the Linkwitz-Riley circuit functioned successfully. The accepted value for the 3 dB point of the high-pass filter was 310 Hz. This graph appears to clearly support the 3 dB point being at 310 Hz. Frequencies
THE MENLO ROUNDTABLE 65

below 310 Hz are passed at relatively strong intensities, and beginning at 310 Hz the frequency quickly begins to attenuate in intensity. This graph clearly supports the 3 dB point being at 310 Hz.
While this data cannot be used to determine the 3 dB point precisely, the 3 dB points in the band-pass filter and high-pass filter appear to be significantly different than the accepted value provided with the circuit. This is most likely because capacitors and resistors are not made with perfect accuracy. Capacitors are manufactured with an error range of ±10% and resistors are made with an error range of ±5%. These differences in values likely have contributed to less than ideal imped-ance matching, causing the 3 dB point to diverge from ideal as well.
In conclusion, while this experiment does not give the exact values of the 3 dB points, it does prove that each component of the Linkwitz-Riley circuit works well.
8 History
Speaker systems have gone through profound transformations since the early 1900s. The following is a little history on how speaker systems have developed over the years.
8.1 Enclosures
Before the 1930s, speaker cabinets weren’t used in speaker systems. Instead speakers were horns that stood by themselves. However, in 1929, engineers Rice and Kellogg invented the modern loudspeaker, allowing for an enclosure beneficial to accurate sound reproduction. [21] Soon after this innovation, Albert L. Thuras patented the bass- reflex enclosure, which proved to be a widespread success. [22] Vented, or bass-reflex suspension, enclosures were the only speaker enclosure design until 1954, when engineer Edgar Villchur invented the closed or acoustic suspension enclosure. Unlike the previous designs of enclosures, this one was capable of accurate reproduction of bass frequencies without taking up nearly as much space. [23] Since then multiple other enclosure designs have been created.
66 Ben Adler

[8] [8] [24] [8]
Figure 21: Some other speaker enclosure designs. From left to right they are band-pass, horn-loaded, isobaric, and transmission line enclosures. Each enclosure has its own advantages and disadvantages. See citations [8] and [24] (isobaric).
8.2 Crossovers
In 1903 scientist George A. Campbell discovered a direct correlation between frequency and the dampening effect of a Pupin line (a wire with equal coils of wire spaced at even intervals in order to simulate a wire of different diameter). He noted that for frequencies below a particular frequency, the dampening effects of the Pupin line also decreased. Following this discovery, in 1915 Campbell created the first filter (passive) by using a ladder of inductors and capacitors (already known to dampen low frequencies). This discovery was also made independently in Germany by Karl Wagner. [25]
Figure 22: Diagram of an early low-pass filter. [27]
From 1915 to 1930, electronic filter designs were modified to become more precise and more complex. One of the biggest innovations in filter designs during this time was Sydney Darlington’s image-parameter theory, which allowed for filters to be designed with multiple sections.
THE MENLO ROUNDTABLE 67

This design had noticeable flaws, however, particularly as to the cutoff frequencies. These flaws were soon fixed by Samuel Butterworth and William Bennett around 1930. Between 1930 and 1940, Wilhelm Cauer came up with a series of equations for designing filters with specialized attenuation. Probably the biggest advance in passive filters was made in 1939, when Darlington published his insertion-loss theory, offer-ing a fully mathematical representation of a filter. Despite this break-through, his theory wasn’t well exploited at the time due to the large amount of computing needed. In 1955, R. P. Sallen and E. L. Key came up with the earliest design for an active filter, which wasn’t utilized much until later due to the expensive nature of active components.
Figure 23: Diagram of a Sallen-Key active filter. [27]
Ultimately, however, active filters grew popular because of the bulki-ness and low-quality factor of inductors, which are used in passive but not active filters, as well as the falling cost of active components. [27] But passive filters do remain in use. The most popular filter for audio purposes is the Linkwitz-Riley filter, designed in 1976, and widely available commercially by 1983. The main innovation in the Linkwitz design was the placement of the cutoff frequencies, which were designed to give a completely flat response. [26] Digital filter systems are com-monplace today, generally in two designs: infinite impulse response (IIR) and finite impulse response (FIR). [27]
68 Ben Adler

9 Acknowledgements
I would like to thank a few people for helping me out with this project, starting with the guys at Car Audio Blowout on Industrial Road in San Carlos for selling me some really cheap speakers. I’d also like to thank everyone who came into the ASR room at odd hours to either hear my speakers bust some beats or talk about their home speaker systems. Thank you Will Stark for bringing in your broken speaker that I have now fixed (which plays amazing bass now). Also, thank you Jack for DJing using my speakers as a way to present my system (and thank you Tripp Robbins for supplying me the plugs to make that happen). And most importantly, thank you Dr. Dann for supplying me with elec-tronics books ranging from the Evil Genius series to electric engineer graduate-level books, for supplying me with endless amounts of resis-tors, capacitors, op amps, and so forth, for letting me use the classroom kicker speakers, for supplying me with amps and a voltage supply, and for getting the specially made protoboards for this and other projects. Thank you all; without your help my life would have been 20 million times more difficult!
10 Citations
[1] http://www.diyaudioandvideo.com/FAQ/Speaker/
[2] Practical Electronics for Inventors
[3] http://www.swarthmore.edu/NatSci/echeeve1/Ref/FilterBkgrnd/Filters.html
[4] http://hyperphysics.phy-astr.gsu.edu/hbase/electric/impl.html
[5] http://sound.westhost.com/biamp-vs-passive.htm
THE MENLO ROUNDTABLE 69

[6] http://www.silcom.com/~aludwig/Loudspeaker_construction.html
[7] http://www.hometheaterhifi.com/technical-articles/170-a-big-dig-into-bass-reflex.html
[8] http://www.lautsprechershop.de/hifi/index_en.htm? /hifi/aka_geh_en.htm
[9] http://www.hifisoundconnection.com/Shop/Control/fp/SFV/30046/view_page/Sealed_VS_Ported_Subwoofer_Boxes
[10] http://www.members.shaw.ca/LoudspeakerBuilder.ca/enclosures.html
[11] http://mobile.jlaudio.com/support_pages.php?page_id=166
[12] http://www.members.shaw.ca/LoudspeakerBuilder.ca/thiele-small.html
[13] http://www.eminence-speaker.com/resources/data.asp
[14] http://www.termpro.com/articles/xover2.html
[15] http://sound.westhost.com/articles/active-filters.htm
[16] http://sound.westhost.com/project09.htm
[17] Kicker CVR 2007 Manual
[18] http://www.net-comber.com/decibel.html
[19] http://www.audiocheck.net/testtones_whitenoise.php
[20] http://en.wikipedia.org/wiki/White_noise
[21] http://www.quadesl.org/History/Actual_Speakers/actual_speakers.html
70 Ben Adler

[22] http://history.sandiego.edu/GEN/recording/loudspeaker.html
[23] http://history.sandiego.edu/GEN/recording/villchur.html
[24] http://www.turbobass.co.uk/muchmoreon.htm
[25] http://www.quadrivium.nl/history/history.html#sk1
[26] http://www.rane.com/note160.html
[27] An Introduction to Digital Filters (PDF)
11 Appendices
11.1 Appendix A: Needed Parts List
Part Description What Needed for Cost Where Buy11 kΩ resistors Linkwitz-Riley
CircuitSchool covered Electronics
website22 kΩ resistors Linkwitz-Riley
CircuitSchool covered Electronics
website3.3 nF capacitors Linkwitz-Riley
CircuitSchool covered Electronics
website6.6 nF capacitors Linkwitz-Riley
CircuitSchool covered Electronics
website33 nF capacitors Linkwitz-Riley
CircuitSchool covered Electronics
website2 Tweeter speakers Speaker $20 Car Audio Shop2 midrange speakers
Speaker $30 Car Audio Shop
Woofer Speaker $10 Car Audio ShopMaterial for Speaker box (.75” MDF)
Speaker Boxes $40 Home Depot
Filler/Padding (ex Polyfill)
Speaker Box $10 Car Audio Shop
Figure 24: Items bought.
THE MENLO ROUNDTABLE 71

11.2 Appendix B: Prototype Filters
Passive filters were initially chosen for the speaker system for two reasons. The first was that passive filters don’t require post-filtration amplifying. The signal used would be amplified before being sent into the filter. The signal would then be filtered and played through the corresponding speakers. In contrast, active filters require amplification post filtration. Therefore a separate amplifier would be needed in order to amplify every individual output. This is a potentially expensive bur-den. Passive filters were also decided upon because they are indeed passive and do not contain active elements. They do not require a sup-ply voltage to run, as would operational amplifiers in an active filter.
As of February 28, 2010 three filters were created and one filtration system created. The rationale behind each one will briefly be explained here, but for more detail see the Results section.
Also important to note is the fact that although all passive-filter circuits call for the use of inductors, there were no inductors in the workspace, so resistors were used instead. It was later found that resistors used in passive filters were likely to be a poor substitute (see Results, Experiment 2).
The first two circuits created were low-pass passive filters:
72 Ben Adler

Figure 25: Low-pass passive filters of varying order. [14]
Both the top and middle circuits were created, a first-order low-pass and second-order low-pass filter respectively. The resistor values were both 100 mΩ (labeled as inductor values on the graph) and the ca-pacitor values 7 µF. A qualitative experiment was run and it was deter-mined that second-order passive filters were better suited for a speaker system than first-order passive filters (see Results, Experiment 1).
Following these two filters, a second-order passive filtration system was created:
THE MENLO ROUNDTABLE 73

Figure 26: A second-order passive filtration system. High-frequency components are at the top, midrange-frequency component in the middle, and low-frequency component at the bottom. [14]
This filtration system was three-way, or in other words had three out-puts: high, midrange, and low frequencies going from top to bottom on the diagram respectively. Once again resistors with a value of 100 mΩ were used in lieu of inductors and 7µF capacitors were also used. A second qualitative experiment was run and it was found that there was an inherent problem with the low- and band-pass filters when wired with the high-pass filters that could not be fixed without induc-tors (see Results, Experiment 2).
74 Ben Adler

The next filter prototype was a low-pass active filter:
Figure 27: Sallen-Key low pass active filter (on the left). [15]
Unlike the previous two filters, the filter shown in Figure 27 is an active filter. That is, it operated using an operational amplifier and therefore required not only an input signal but also an input voltage just to run. As labeled on the diagram, two 10 kΩ resistors were used as well as two 10 μF capacitors.
THE MENLO ROUNDTABLE 75

76 Ben Adler
11.3 Appendix C: Raw Data for Experiment 3
Maximum Voltage In
Maximum Voltage Out
Frequency In
Frequency Out
- - 0 05 6.2 10 105.8 6.2 20 206 6 30 306.2 5.8 40 396.6 5.7 50 507 5.7 60 617.4 5.4 70 707.5 5 80 817.6 4.6 90 907 4.4 100 1007 3.8 110 1106.8 3.6 120 1226.6 2.8 140 1396.6 2.4 160 1596.6 2 180 1786.6 1.6 200 2006.4 1.3 220 2186.4 1.04 240 2386.4 0.88 260 2596.4 0.72 280 2786.4 0.64 300 3006.4 0.56 320 3206.4 0.48 340 3386.4 0.37 360 3586.4 0.32 380 3796.4 0.27 400 3986.4 0.24 420 4206.4 0.208 440 4396.4 0.18 460 458

Maximum Voltage In
Maximum Voltage Out
Frequency In
Frequency Out
6.4 0.152 480 4806.4 0.136 500 5006.4 0.11 520 5216.4 0.092 540 5406.4 0.076 560 566.4 0.06 580 5816.4 0.04 600 598
Figure 28: Raw data results for Experiment 3.
THE MENLO ROUNDTABLE 77
(table continued)