
SPE 90822 Improved Reservoir Simulation With...
11
Copyright 2004, Society of Petroleum Engineers Inc. This paper was prepared for presentation at the SPE Annual Technical Conference and Exhibition held in Houston, Texas, U.S.A., 26–29 September 2004. This paper was selected for presentation by an SPE Program Committee following review of information contained in a proposal submitted by the author(s). Contents of the paper, as presented, have not been reviewed by the Society of Petroleum Engineers and are subject to correction by the author(s). The material, as presented, does not necessarily reflect any position of the Society of Petroleum Engineers, its officers, or members. Papers presented at SPE meetings are subject to publication review by Editorial Committees of the Society of Petroleum Engineers. Electronic reproduction, distribution, or storage of any part of this paper for commercial purposes without the written consent of the Society of Petroleum Engineers is prohibited. Permission to reproduce in print is restricted to a proposal of not more than 300 words; illustrations may not be copied. The proposal must contain conspicuous acknowledgment of where and by whom the paper was presented. Write Librarian, SPE, P.O. Box 833836, Richardson, TX 75083-3836, U.S.A., fax 01-972-952-9435. Abstract History matching and simulation of naturally fractured reservoir is a recurring challenge to many oil and gas companies seeking to manage and develop fractured reservoirs. Several techniques have been applied in the past to match past production and pressure history that have been proven unreliable. This paper describes a methodology to improve the simulation of fractured reservoir using seismically driven reservoir characterization. The methodology presented in this paper uses the integration of geophysical, geologic, and engineering data simultaneously to improve the reservoir description. At the root of the reservoir characterization lays the more and more accurate seismic data collected on most of the reservoirs around the world. The initial use of this seismic information is made possible through high-resolutioninversion and spectral imaging. These two processes allow a better imaging of key reservoir properties that have an important impact on fracturing. Based on this seismically driven reservoir characterization, the reservoir properties necessary as inputs to the reservoir simulator, i.e. fracture porosity and permeability, are generated using artificial intelligence tools and core measuremenst as fracture indicators. The usefulness of the derived seismic attributes is illustrated on a specific reservoir where a new well was recently drilled. The drilling results indicate that the derived seismic attributes can be used successfully to locate highly fractured areas. Using the generated seismic attributes in an integrated fracture modeling approach allows for a better modeling of the “plumbing” of the reservoir through a correct estimation of the fracture permeability and porosity. These improved fracture properties lead to a history match of the well performances. Examples of such history matches are given for illustration purposes. Introduction A recent survey 1 of 100 fractured reservoirs has shown that almost half of the fields examined by the authors have an ultimate recovery less than 40%. Out of these 100 fractured reservoirs, which have combined recoverable oil and gas reserves of 90 billion bbls, 20% of the fields have an ultimate recovery in the range of 20-30%.. If we assume that the 20 fields have 20% of the combined recoverable reserves, then 12.6 billion bbls will not be recovered. This huge amount of oil represents 20 months of US oil consumption, or 20 years of United Kingdom oil consumption. Clearly, the amount of oil and gas left in these fractured reservoirs is alarming. The authors 1 of the survey have also shown the expected tight link between proper reservoir management and ultimate recovery. Increasing the ultimate recovery from fractured reservoirs can be achieved with carefully planned reservoir management strategies that are the result of an accurate reservoir modeling and simulation effort. Unfortunately, the E&P industry at large still views the modeling and simulation of fractured reservoir as an immature area that is still under development. This impression perhaps results from the variety of products and opinions promulgated by service companies that are driving most of the research efforts in fractured reservoir modeling. Commercial implications and past strategic decisions taken by these companies may not always lead to the advancement of the science as their highest priority. Unlike the reservoir simulation arena, where SPE comparative solutions provided an objective way to compare simulators from service companies and oil companies, the fracture modeling area is a real jungle. This lack of concerted efforts does not help the industry in meeting the challenge of increasing the recovery from fractured reservoirs, and consequently, the previously mentioned equivalent of 20 years of United Kingdom oil consumption will remain underground. On every continent, E&P companies are struggling with fractured reservoirs, trying to understand the distribution of the fractures. A large majority of these fields have never benefited from a fracture modeling effort, as this presently seems to be the purvue of large companies. However, even large companies may take years before initiating a fractured reservoir modeling effort. For example, Dorta et. al. 2 described in 2001 the first detailed study of a fractured reservoir in Venezuela.. In the last five years, more and more companies have come under pressure to reduce the accelerated production decline from their fractured reservoirs, or to drill SPE 90822 Improved Reservoir Simulation With Seismically Derived Fracture Models Ahmed Ouenes, Abdel M. Zellou, Gary C. Robinson, David R. Balogh, Udo G. Araktingi, PRISM SEISMIC
Transcript of SPE 90822 Improved Reservoir Simulation With...
Copyright 2004, Society of Petroleum Engineers Inc. This paper was prepared for presentation at the SPE Annual Technical Conference and Exhibition held in Houston, Texas, U.S.A., 26–29 September 2004. This paper was selected for presentation by an SPE Program Committee following review of information contained in a proposal submitted by the author(s). Contents of the paper, as presented, have not been reviewed by the Society of Petroleum Engineers and are subject to correction by the author(s). The material, as presented, does not necessarily reflect any position of the Society of Petroleum Engineers, its officers, or members. Papers presented at SPE meetings are subject to publication review by Editorial Committees of the Society of Petroleum Engineers. Electronic reproduction, distribution, or storage of any part of this paper for commercial purposes without the written consent of the Society of Petroleum Engineers is prohibited. Permission to reproduce in print is restricted to a proposal of not more than 300 words; illustrations may not be copied. The proposal must contain conspicuous acknowledgment of where and by whom the paper was presented. Write Librarian, SPE, P.O. Box 833836, Richardson, TX 75083-3836, U.S.A., fax 01-972-952-9435.
Abstract History matching and simulation of naturally fractured reservoir is a recurring challenge to many oil and gas companies seeking to manage and develop fractured reservoirs. Several techniques have been applied in the past to match past production and pressure history that have been proven unreliable. This paper describes a methodology to improve the simulation of fractured reservoir using seismically driven reservoir characterization. The methodology presented in this paper uses the integration of geophysical, geologic, and engineering data simultaneously to improve the reservoir description. At the root of the reservoir characterization lays the more and more accurate seismic data collected on most of the reservoirs around the world. The initial use of this seismic information is made possible through high-resolutioninversion and spectral imaging. These two processes allow a better imaging of key reservoir properties that have an important impact on fracturing. Based on this seismically driven reservoir characterization, the reservoir properties necessary as inputs to the reservoir simulator, i.e. fracture porosity and permeability, are generated using artificial intelligence tools and core measuremenst as fracture indicators. The usefulness of the derived seismic attributes is illustrated on a specific reservoir where a new well was recently drilled. The drilling results indicate that the derived seismic attributes can be used successfully to locate highly fractured areas. Using the generated seismic attributes in an integrated fracture modeling approach allows for a better modeling of the “plumbing” of the reservoir through a correct estimation of the fracture permeability and porosity. These improved fracture properties lead to a history match of the well performances. Examples of such history matches are given for illustration purposes.
Introduction
A recent survey1 of 100 fractured reservoirs has shown that almost half of the fields examined by the authors have an ultimate recovery less than 40%. Out of these 100 fractured reservoirs, which have combined recoverable oil and gas reserves of 90 billion bbls, 20% of the fields have an ultimate recovery in the range of 20-30%.. If we assume that the 20 fields have 20% of the combined recoverable reserves, then 12.6 billion bbls will not be recovered. This huge amount of oil represents 20 months of US oil consumption, or 20 years of United Kingdom oil consumption. Clearly, the amount of oil and gas left in these fractured reservoirs is alarming. The authors1 of the survey have also shown the expected tight link between proper reservoir management and ultimate recovery.
Increasing the ultimate recovery from fractured reservoirs
can be achieved with carefully planned reservoir management strategies that are the result of an accurate reservoir modeling and simulation effort. Unfortunately, the E&P industry at large still views the modeling and simulation of fractured reservoir as an immature area that is still under development. This impression perhaps results from the variety of products and opinions promulgated by service companies that are driving most of the research efforts in fractured reservoir modeling. Commercial implications and past strategic decisions taken by these companies may not always lead to the advancement of the science as their highest priority. Unlike the reservoir simulation arena, where SPE comparative solutions provided an objective way to compare simulators from service companies and oil companies, the fracture modeling area is a real jungle. This lack of concerted efforts does not help the industry in meeting the challenge of increasing the recovery from fractured reservoirs, and consequently, the previously mentioned equivalent of 20 years of United Kingdom oil consumption will remain underground.
On every continent, E&P companies are struggling with fractured reservoirs, trying to understand the distribution of the fractures. A large majority of these fields have never benefited from a fracture modeling effort, as this presently seems to be the purvue of large companies. However, even large companies may take years before initiating a fractured reservoir modeling effort. For example, Dorta et. al.2 described in 2001 the first detailed study of a fractured reservoir in Venezuela.. In the last five years, more and more companies have come under pressure to reduce the accelerated production decline from their fractured reservoirs, or to drill
SPE 90822
Improved Reservoir Simulation With Seismically Derived Fracture Models Ahmed Ouenes, Abdel M. Zellou, Gary C. Robinson, David R. Balogh, Udo G. Araktingi, PRISM SEISMIC
2 SPE90822
new wells in these reservoirs. In these circumstances, two types of behavior are observed. In the first group are companies that try to find an internal solution by using simplistic methods such as curvature or trying to duplicate an existing method available in some commercial software. The second group prefers to hire a service company that may have some internal or commercial software to carry out the fracture modeling effort. Because of the multitude of approaches used for fracture modeling, we will limit the scope of this paper to only those methods that can incorporate seismic data.
The paper will first provide a brief description of the
different approaches used to characterize and simulate fractured reservoirs. Next, the different methods that can use seismic data in improving fractured reservoir modeling are described. Two practical seismic analysis tools, high resolution inversion and spectral imaging, that can be used efficiently in an integrated fractured modeling approach are described in detail. Drilling results using these seismic attributes to find fractures are described. After testing the ability of the derived seismic attributes to find fractures by drilling, the case is made for using the same attributes to build better reservoir simulation models that are able to capture the complex “plumbing” of the fractured reservoirs.
Characterization and Simulation of Fractured Reservoirs Tremendous efforts3 spanning more than three decades have been expended on all the aspects of fractured reservoir simulation. Special emphasis has been given to dual-porosity systems and the ability to simulate complex fluid transfer from matrix to fractures. Unfortunately, the key fracture parameters required as input in the sophisticated reservoir silmulators did not benefit from these significant efforts. Unlike conventional reservoirs, where geostatistics provided an impetus for reservoir characterization, fractured reservoirs do not yet enjoy a systematic approach that can provide reliable input for fracture permeability and porosity. There are many reasons behind this lag, some of which are discussed below. Unlike a conventional reservoir, where the rock properties are evolving in a “smooth” manner, fractures can be very elusive and their distribution may seem random. Hence, the analytical tools used to describe this “apparent” random fracture distribution have been inadequate. The tools used in fracture characterization fall in three major categories. Geomechanical Approach The first category is related to geomechanical concepts, ranging from simple curvature methods to rock deformation and including fracture growth models. Conceptually, these approaches are very appealing to academia as they involve quantitative “science” in their partial differential equations. Unfortunately, they lack geologic realism in their implementation. For example, fractured reservoirs are very heterogeneous and have many facies that exhibit dramatic changes in rock mechanical properties from one facies to another. These geologic realities are not accounted for in most
of the geomechanical approaches, where it is very common to see models built with constant rock mechanical properties. As a result, the derived fracture models only account for tectonic and mechanical effects, and thus completely miss the dramatic role played by the geology, facies, and diagenesis. Discrete Fracture Networks (DFN) The second category is the Discrete Fracture Network (DFN), which stems from the observation that fracture distribution seems random. In this approach, fracture data collected at the wells from image logs and cores are used to derive a statistical distribution of various fracture properties. In this regard, one has to note the efforts by authors such as Lorenz et al.,4 who point to the fact that most of the fractures are vertical, as are most of the wells. Hence, the statistics derived from the very limited well data and used in DFN modeling can be misleading. The DFN model is constructed by generating in the reservoir volume a large number of discrete objects that represents the fractures. The DFN model is then upscalled to create fracture input for the reservoir simulators5. Such models are able to reasonably reproduce the near wellbore zone but fail miserably away from the wells – the area in which we are interested. As a result, all DFN publications address the question of dynamic validation using mostly well tests, but we are still desperately searching for examples in the literature where a DFN model was able to reproduce well performances. The hard truth is that DFN models are not able to reproduce the fractures away from the well without a little help. In order to guide and constrain the random generation of these discrete fractures away from the wells, early efforts were made to impose a 2D map as a constraint. For example, in a shale-sand system, the 2D map provides the distribution of facies and the DFN model will only generate fractures where the sand is present. Despite the fact that facies is a complex 3D distribution, such simple approaches are still used to generate DFN models. Ouenes and Hartley6 used a 3D constraint that is the result of an integration of various drivers to constrain a DFN model. In other words, a 3D continuous fracture intensity model is built by finding the relationship that exists between a multitude of drivers and a fracture indicator available at the wells. Once this relationship is found, it can be used to generate a 3D continous fracture model. This model will guide the distribution of the fractures in the 3D DFN model. The increasing interest and efforts in using seismic data in fracture characterization provided a golden opportunity to DFN users. A new constraint used in DFN models is some average seismic attribute that contains some fracture indication7. In this case, both 2D and 3D seismic constraints have been applied to control the wild and random distribution of the discrete fracture objects. Unfortunately, this new trend in DFN modeling is based on the assumption that there is a magical seismic attribute that will provide the definitive answer for the distribution of fracture density. DFN modeling has evolved from totally random models to models relying entirely on one seismic attribute that is supposedly a direct indicator of fracture density. In both cases, all the geologic realities related to facies, tectonics, diagenesis, and all the complex geologic factors that control fracturing have no room

SPE 90822 3
to be incorporated in the DFN modeling process. Furthermore, the dynamic validation of the resulting DFN models are still discussed and even included in the titles but nowhere does at least one example show clearly the ability of these models to reproduce the dynamic effects of fractures. Despite their deficiencies and their blatant inability to reproduce pressure or production performances, DFN models have survived and continue to thrive. Two major reasons keep them going. The first one is the visual appeal of the discrete representation that makes geoscientists feel that they are truly modeling the fractures. The second one is the historical background of service and oil companies investing large resources in developing DFN software. Few large oil companies have even established a company wide strategy for fracture modeling based on the use of DFN. Even if the derived models are barely able to match the field pressure, it is very difficult for those service and oil companies to change direction, and the E&P industry will have to live with this approach. Fortunately, DFN is not the only solution for fracture modeling and efficient new8 and old9 alternative approaches have always been available. Continuous Fracture Modeling (CFM) Among these alternative approaches is the Continuous Fracture Modeling (CFM) approach9. This framework was developed with the objectives of working on a geocellular grid at the reservoir simulation scale by using any type of fracture indicator available at the wells and providing a framework where any geologic or geomechanical indicator available as a 3D geocellualr grid, or any field measurement (seismic), can be incorporated quantitatively in the modeling effort. The glue of the method is a set of artificial intelligence tools10 that give the flexibility needed to deal with complex fractured reservoirs. The approach was successfully applied to solve a wide range of fractured reservoir problems11-14, has been continuously improved by the developers15 and other authors,16-17 and is currently used in many institutions. From the early stages of the CFM approach, the goal was to use seismic data in fracture modeling18. These early efforts have paid out and opened the door to more opportunities to include seismic data,3,19 which turn out to be the cornerstone of fracture modeling. The incorporation of seismic data finally turned the tide in fracture modeling, leading to meaningful fracture models. The seismically derived fracture models can be used to drill wells and accurately simulate complex fractured reservoirs because they permit the correct modeling of the complex “plumbing”. A general description of the different approaches to use seismic data in fracture modeling is given below. Seismic Data in the Characterization of Fractured Reservoirs
Geophysicists have continuously pleaded the cause of using seismic data in fracture modeling. Their plea20 was not always heard for several reasons. The first reason is related to economics. The primary use of seismic data is to provide structural information from the processed compressional wave
reflection arrival times, with some simple attributes, such as reflection amplitude, also provided. Extracting fracture density and orientation information from seismic data required additional work, and therefore expense, in acquiring and processing shear wave or converted wave data or in acquiring and processing wide angle compressional wave data for azimuthal anisotropy information. In the case of marine data, the additional complications of shear waves not propagating in fluids (such as the water column) as well as the limited azimuths available in the typical marine streamer acquisition technique added technical as well as financial hurdles to overcome. It took the E&P industry more than a decade to become convinced about the value of simple 3D P wave seismic, and it may take more than that to demonstrate the added value of acquiring shear waves or converted waves. In addition to the financial and technical problems, the exaggerated promise that seismic data will provide the silver bullet that reveals the intricate details about the fractures. In other words, seismic data was not seen as additional information that can complement geologic and geomechanical information, but rather was thought to be the ultimate answer to the problem. Because many simplistic assumptions were made when using seismic data in fracture modeling, the resulting attributes that were supposed to be a direct measure of fracture density turned out to be misleading.
Currently, the main trend in the use of seismic for fracture
modeling is the use of azimuthal anisotropy 7,16. Instead of an expensive shear wave survey, efforts are now directed towards acquiring wide-azimuth surveys with the purpose of using the new azimuthal anisotropy technologies to detect fractures. The original work by Crampin et al21 has recently mushroomed into various consortiums working in this promising area. Unfortunately many of these efforts are not ready for field applications as they use overly simplistic theories that do not take into account the real complexity of the fractured reservoirs. Some of the simplistic assumptions made in this area are discussed in Ouenes et al.19. Because of a lack of something similar to the SPE comparative solutions to evaluate the different approaches proposed by the various service companies, the entire industry runs the risk of misjudging the azimuthal anisotropy approach. Azimuthal anisotropy has been misused in many basins, and has lead to the drilling of dry holes with no fractures in locations where it was expected to find plentiful fractures.
In addition to shear waves and azimuthal anisotropy,
which both require additional spending during seismic acquisition, the authors have focused on the use of existing P wave seismic to extract useful information for fracture modeling. The main idea is that 3D seismic attributes are only additional drivers that can be added to an integrated fracture modeling effort to provide a better modeling of the inter-well region, rather than a method of direct fracture identification.
Practical Use of High Resolution Inversion and Spectral Imaging in Fractured Reservoir
The major point in the CFM approach is the recognition
that many drivers affect fracturing. Some of these drivers are
4 SPE90822
critical and play a first order role. Hence, it is important to have an accurate 3D reservoir model that describes the distribution of the critical drivers. For example, in a carbonate reservoir where we have dolomite and limestone, it is imperative to have an accurate 3D model of the distribution of each facies, as dolomite can have four to six times more fractures than limestone. In a clastic reservoir composed of sand and shale, it is important to obtain the distribution of these two facies, as the shales tend to have no fractures. This critical information can be provided by seismic inversion and spectral imaging, which can provide an accurate distribution of many key rock properties that have a direct impact on fracturing.
Seismic inversion has been used for more than three
decades but has been employed primarily by large companies. The majority of the E&P companies still use their 3D seismic primarily for structural interpretation and simple analysis such as amplitude anomalies. Hence, the wealth of information available in the seismic data remains largely untapped and underutilized. The real value of seismic data is fully realized when combining it with log data in algorithms that merge the two datasets and create real added value reservoir information. More recently, efforts were made to increase the resolution of the seismic inversion and reach a level of detail on the order of one meter resolution. Both stochastic22-23 and deterministic19 inversion can be used for this purpose. Unfortunately, a recent survey by the authors of E&P companies has shown that 92% of the surveyed companies do not know about the existence of such high resolution inversion algorithms. It is interesting also to note that 36% of the surveyed geophysicists do not believe that such methods do exist, and believe that seismic attributes can only have the resolution of the seismic data, which is significantly poorer than one meter. The reality is that high resolution seismic attribute cubes with a resolution on the order of one meter are routinely created to solve a multitude of reservoir problems, including those related to fractures. These seismic attributes are the acoustic impedance derived from post-stack P wave inversion or rock mechanical properties derived from pre-stack elastic inversion.
These high resolution seismic attributes can be used in
different ways to improve the fracture modeling. For example, they can be used directly as input in the integrated fracture modeling approach15 as an additional driver. Another way they can be used is by creating geostatiscal models constrained to the seismic data22. For example, very accurate facies models can be generated by using high resolution impedance and facies information from wells. These facies models play a major role in any fracture modeling effort, as the presence of fractures is facies dependent. Furthermore, the facies models can be used in geostatistics to create accurate porosity models, which are another major driver affecting fracturing. In numerous fractured reservoirs, the fractures are mostly present in the low porosity rock. Grain movement in response to underlying stresses is limited in these rocks because of the lack of pore space, and therefore these low porosity rocks often accomodate stresses by fracturing. These accurate facies and porosity models are the result of the additional seismic constraint available in the acoustic impedance. This
information being available everywhere in the reservoir results in accurate geologic models.
When pre-stack data is available, high resolution elastic
inversion provides very important fracture drivers, namely the Lamé coefficients. These seismic attributes provide a direct indication of the rock mechanical properties that control fracturing.
In summary, high resolution inversion using pre- or post-
stack seismic data is capable of providing accurate 3D models of geologic and mechanical properties of the rock. These are the key properties that control the degree of fracturing in a rock. These models can be used directly in an integrated fracture modeling approach or combined with other geologic attributes that can also benefit from these seismic attributes. However, none of these attributes provide a direct indicator of fracture density, and therefore we need another component to the fractured reservoir modeling methodology.
The solution came from spectral imaging, which is a
workflow that uses log data and spectral decomposition24. The result of this process is a multitude of seismic attributes that often correlate well with fracture density. The tuning sand attenuation effects at specific reservoir-dependent frequencies seem to be sensitive to the presence of fractures and the fluids contained within the fractures. These additional seismic attributes complement the previous ones derived from the high resolution inversion. Again, the objective is not to find a single magic bullet, but to accumulate a multitude of seismic attributes that will allow us to solve the puzzle of a fractured reservoir.
Case Study
In practice, the inversion and spectral imaging results are
used as additional drivers in the integrated modeling approach15 and they provide a level of detail never previously achieved. These attributes can be also used in making drilling decisions in complex fractured reservoirs.
In 2003, a joint operating company drilled an exploration well near an existing field. The target was a carbonate reservoir known to hold oil in the fractured zones. In this reservoir, finding the fractures is equivalent to finding the movable oil. Unfortunately, finding fractures is a complex task, evidenced by many failures throughout the world. An illustration of the application of high resolution inversion and spectral imaging to the reservoir is shown below.
After reaching TD and logging the exploration well, it appeared that the well was a dry hole with no fractures and no oil. As a back-up plan, a side-track was proposed by one of the partners, but the optimal direction for such a side-track remained unknown. At this point, one of the partners contacted the authors to assist in looking beyond the wellbore.
As P wave 3D seismic data were available in the area, spectral imaging was applied to the 3D volume. In this reservoir, high amplitudes in a specific frequency range are correlated with the presence of oil-filled fractures. Spectral imaging revealed

SPE 90822 5
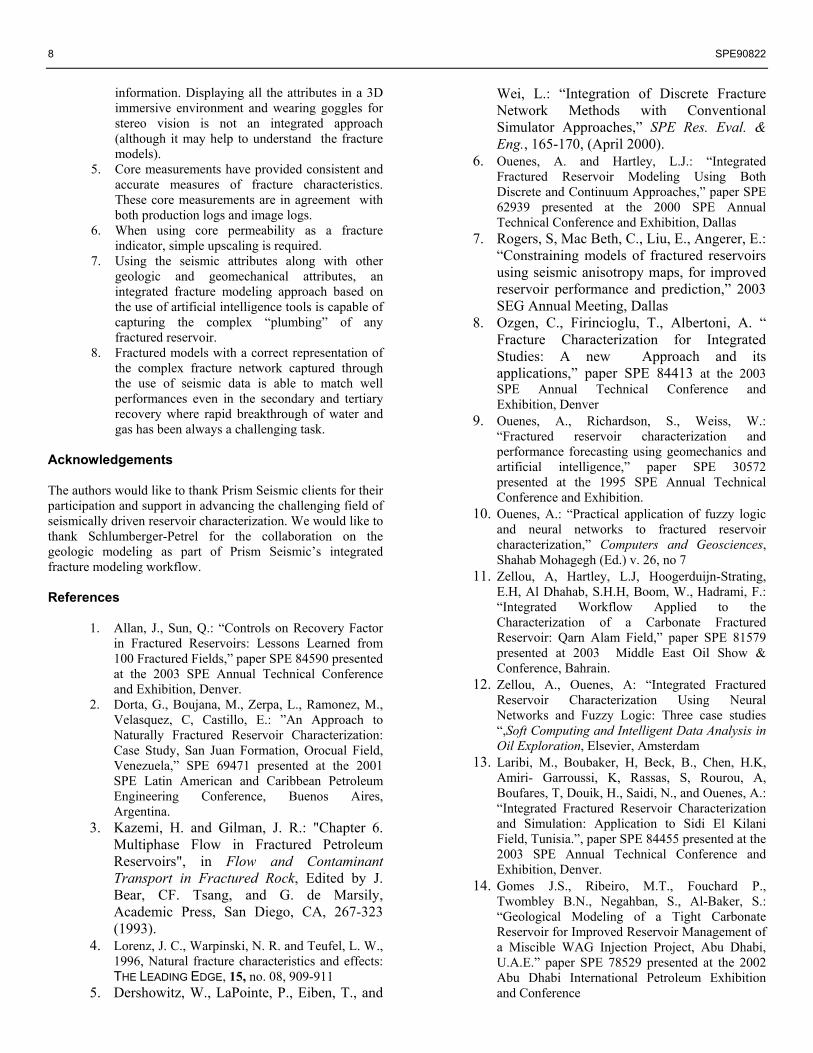
the presence of high amplitudes (indicating oil-filled fractures) around the newly drilled well. A north-south cross section through the well (Figure 1) shows two large high amplitude zones (accumulations of oil) indicated in red and yellow.
Armed with this information, the partners agreed to test the well, despite the lack of fracture and oil indicators at the wellbore. The result was a surprising oil production of 1800 barrels per day and the discovery of new reserves.
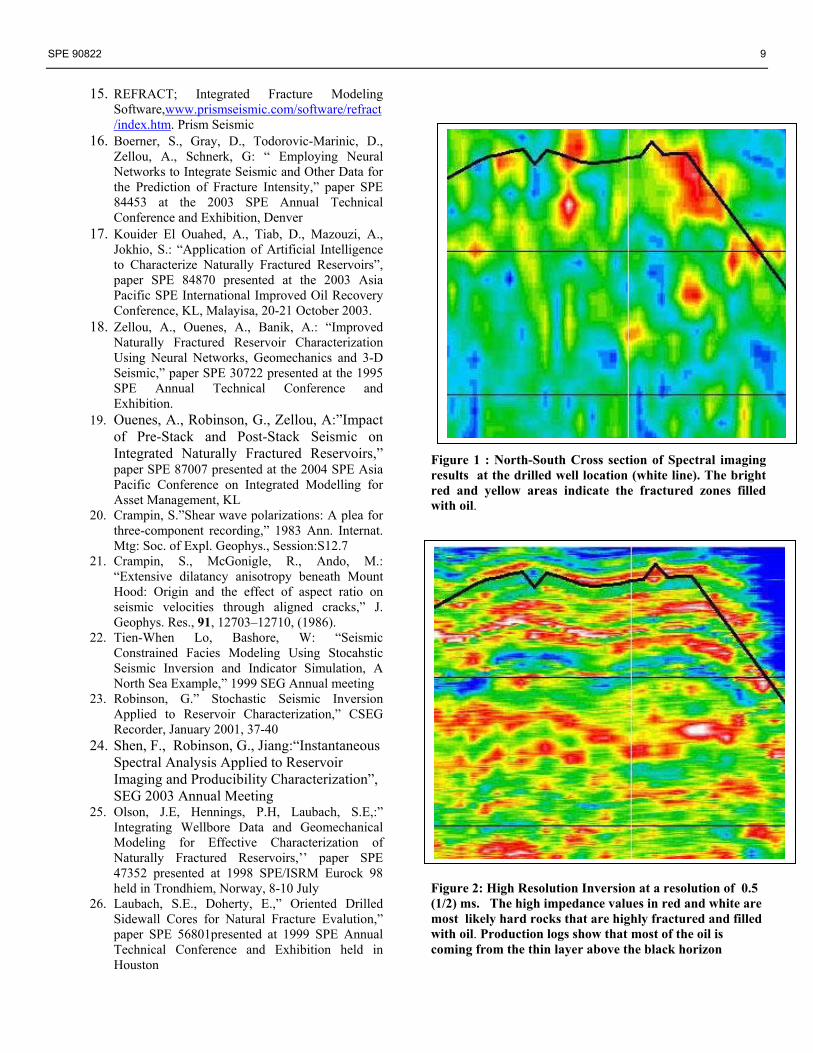
Using logs from a nearby well, a high resolution inversion was performed to better understand the producing zones. The resulting acoustic impedance cube has a 0.5 ms sample rate, which represents about one meter in this reservoir. Figure 2 shows the existence of a high impedance zones (in red) that can indicate brittle rock rich in fractures. Production tests have in fact shown that the entire production is coming from the continuous and fractured layer shown in red, lying just above the time horizon shown in a black in Figure 2. This layer is directly connected to the large accumulation of oil located around the fault on the right side of the well and clearly visible on the spectral imaging result of Figure 1.
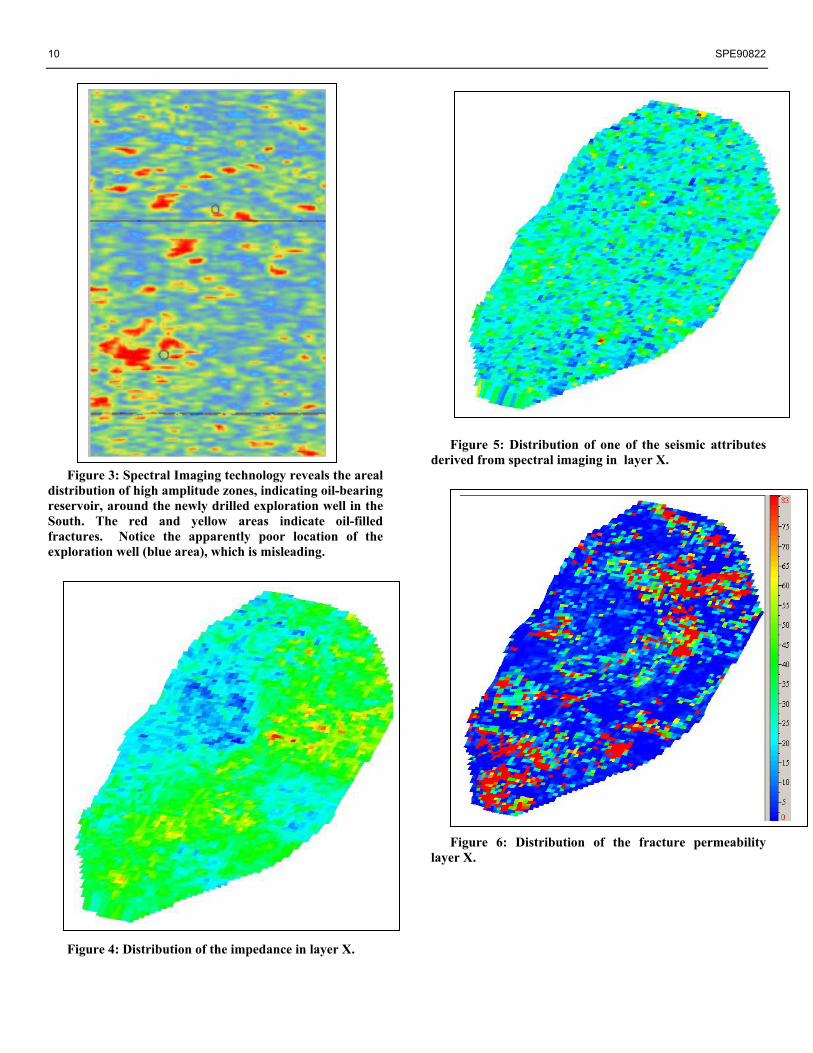
These results have assisted the partners in discovering new reserves that can have been missed because the well was drilled in a poorly fractured area that is very close to large accumulations of oil. Using the spectral imaging results over the entire reservoir interval, a 2D map showing the areal distribution of high amplitude events (indicating fractured oil-bearing reservoir) around the well was generated, as shown in Figure. 3. In this 2D map, the prospective areas are clearly delimited, appearing as red and yellow areas. As expected, the location of the new exploration well is in a blue (non-prospective) area, which is misleading. The new exploration well is in the south part of the picture and the only well log used for the high resolution inversion is shown in the northern part of the reservoir. At this stage, please note that deterministic high resolution inversion has many advantages compared to the stochastic inversion. A major advantage is the ability to run the inversion with only ONE well, which is not possible in stochastic inversion. Other important advantages such as an order of magnitude faster and one single resulting impedance cube rather than the need to generate multiple equiprobable realizations makes the deterministic high resolution inversion a key tool for accurate reservoir characterization.
This recent example, and many previous ones we have encountered, illustrate very well the point made numerous times by Lorenz et al4 of the low probability of encountering vertical fractures with vertical wells. If vertical wells are needed, such as in the case of the field described above, then relevant seismic attributes are the only hope for deciding where to drill successful wells.
For the DFN users who rely heavily on distributions of
fracture properties derived from image logs and cores, this recent example should serve as food for thought. According to the image logs and cores there are no fractures in this well. The reality is that an important fracture network was a few meters, if not less, from the wellbore and the dynamic
response of the well completely contradicts the static picture provided by the image logs and cores, which have a shallow depth of investigation. Hence, any DFN model using the static data as input will fail in reproducing the dynamic response of the well.
Now that the drillbit has shown in this field and numerous
others that high resolution inversion and spectral imaging attributes can find the fractures and explain the observed production, or in other words reveal the “plumbing”, one can now proceed to using this valuable input to create reservoir models to be used as input in simulators.
Improved Fractured Reservoir Simulation Models
The entire purpose of this multi-year effort is to develop a framework where it is a possible to derive a fracture permeability and porosity model that will allow a good match of the well performances for any recovery mechanism, including water or gas injection. A decade ago this goal looked almost unachievable because of the multitude and complexity of the factors involved in simulating fractured reservoirs. After a trial and error process, we have reached a stage where a well defined workflow that uses available software can lead to fracture permeability and porosity models that match more than 80% of the well performances (pressure and rate) without doing any history matching. For those involved in the simulation of fractured reservoirs this will be hard to believe, just as a large percentage of geophysicists will not believe that seismic attributes with a resolution of one meter is possible. For those who are curious to know how such results are possible, we will share the key aspects applied in a multitude of projects done in collaboration with various E&P companies.
The most important factor in simulating the fractured
reservoir is the “plumbing,” as mentioned many time in this paper. The “plumbing” is the complex network of fractures found in any fractured reservoir which entirely controls all the observed dynamic effects. Our experience has shown that the derived fracture permeability models are very complex and show a distribution that appears random. Under close examination, we can see features that play a major role in creating extreme behavior, such as early and fast breakthrough of water and gas during secondary and tertiary mechanisms. Figure 6 shows a layer of fracture permeability in a very complex fractured reservoir with all the well performances, (more than 50 wells and more than three decades of primary, secondary and tertiary recovery) where matched without any history matching. In other words, describing a fractured reservoir with average fracture spacing, average fracture width and aperture will never lead to such a complex description. The use of key seismic attributes in an integrated fracture modeling approach has revealed in many fields a fracture distribution that requires a geocellular grid representation from the beginning of the modeling. In other words, the DFN approach which requires the use of discrete objects then upscaling, is likely to introduce noise in the final fracture permeability model. This noise is a result of the upscaling of various discrete fracture objects in a cell. This noise can

6 SPE90822
explain why the upscaled permeability derived from DFN models is only able to match field pressure and rates rather than well performances individually.
If a geocellular grid is used from the beginning, the grid
cell size is dictated by the simulation time. In all the projects concluded we have found that an areal cell size of 50 to 100 m and a vertical cell size of 5-10 meters was sufficient to reasonably reproduce most of the dynamic effects. In this situation, the question is how to find the porosity and permeability of such large blocks using core and log data.
The biggest and most pleasant surprise found in all the
projects is the key role played by the core data especially for fracture permeability. As we use the integrated fracture modeling approach that allows any fracture indicator, we have found that the use of fracture porosity and core permeability were the best fracture indicators. This was originally a surprise, and we were inclined to prefer the use of interpreted image logs. From the experience acquired in many fractured fields, it appears that the core data represents the fractures more accurately than the interpreted image logs, and is able to explain very well the production behavior observed on production logs. Part of this difference in the usefulness of core data versus image log data can be explained by the fact that interpreting image logs remains an art with many pitfalls. Although the interpreted image logs are still able to qualitatively describe the observed dynamic effects, they seem less precise and accurate than core data in describing quantitatively fractures. In this case, we frequently hear the argument that core plugs are taken in the parts of the core where fractures are not present. We are fully aware of this, but cannot ignore the fact that when displaying an excellent permeability next to a production log we notice a perfect correlation. Given this fact what are the possible explanations?
Based on what we have seen in many fields and read in the
literature, fractures are present at different scales from the microfractures to the large fractures several meters wide. Apparently the cores still have microfractures that are visible in thin sections but invisible to the naked eyewhen selecting a core plug. These microfractures are able to reproduce the dynamic effects, and in a relative sense along a core they are able to show the presence of the highly fractured zones. The magnitude of this core permeability may not be exactly the fracture permeability of a 100x 100x 5 m gridblock but we will see that it is not a problem.
The importance of core data in fracture measurement has
been a major topic for the UT Austin researchers, Olson and Laubach (Olson et al.25 and Laubach and Doherty26), whose work allowed us to better understand why these core measurements were able to provide the right answer.
As for the upscaling of these core measurements, we also
found that it was surprisingly very simple. When whole core data were used13, we did not find the need to even upscale the measured fracture permeability. When core plugs were used the upscaling consisted of only multiplying the permeability
by a constant factor in all gridblocks where fractures are present. Sometimes we have used multiple scaling factors depending on the facies. For example, in a dolomite-limestone system, the factor applied to all the gridblocks that have fractures and happen to be in a dolomite facies is ten while the cells that have fractures in limestone have their permeability multiplied by a factor five. These multiplicative factors can be estimated easily by comparing the highest value measured in the cores with the values derived from well test or other well performance. Their ratio is the “upscaling” factor. Such a simple upscaling can be exaplained by the fact that the gridd cell of 100x100x5 m has more fractures and “plumbing with bigger pipes” than the small core plugs.
In summary, if relevant seismic attributes are available,
one can have a detailed facies model and be able to use an integrated approach where both geologic and seismic attributes are used jointly to find the complex “plumbing”. This plumbing is described-discretized with a geocellular grid from the beginning of the modeling efforts. The best fracture indicator to quantify this plumbing is porosity and permeability from core measurements. The derived 3D fracture models can be upscaled in a simple way by using multiplicative factors applied by facies.
In order to refine the models, one can address the
following items, which are flow functions (relative permeability and capillary pressure curves). Most of the history matching efforts consist of tweaking these flow functions. Our experience has shown that a correct 3D fracture permeability and porosity will achieve 80% history match with a simple average flow function curve. In order to refine the models, one can use flow functions for each facies. Since the 3D distribution of the facies is readily available this is a simple exercise. Field Examples
Field examples are given to illustrate some of these
concepts. A more detailed description of the fields and the computed fracture models will be given in a separate paper.
Recently this approach was applied to a limestone reservoir, and the entire project is described in a previous paper 13. In this example, the critical seismic attribute was the impedance which allowed the identification of highly brittle limestone prone to fracturing. The inversion result shown in Figure 2, combined with production logs, indicates that the fractured limestone zone occurs where the impedance is highest. Using the impedance and other seismic attributes, along with many geologic attributes as drivers and the fracture porosity as a fracture indicator, it was possible to unravel the complex distributions of the fractures. The fracture distribution was affected by mineralization that left open fractures only in areas where oil migration occurred prior to the arrival of the mineralizating fluids. In this example, a whole core with only three measurements allowed us to establish a relationship between fracture porosity and permeability. As fracture porosity was known in 3D following the fracture modeling, the use of the simple porosity-permeability relationship derived from the whole core allowed
SPE 90822 7
the generation of the fracture permeability. Using these input in a simulator lead to the pleasant surprise of a reasonable match of the past performances of all the wells. This match includes the time of water breakthrough and the water cut. This last detail is an indication that the model had the correct plumbing that allowed the difficult matching of the water breakthrough. The use of whole core data did prove that core measurements do contain critical fracture information. In this case, a permeability scaling factor was not even needed and the whole core measurements exhibited the correct magnitudes.
In another recent example, a complex clastic reservoir with
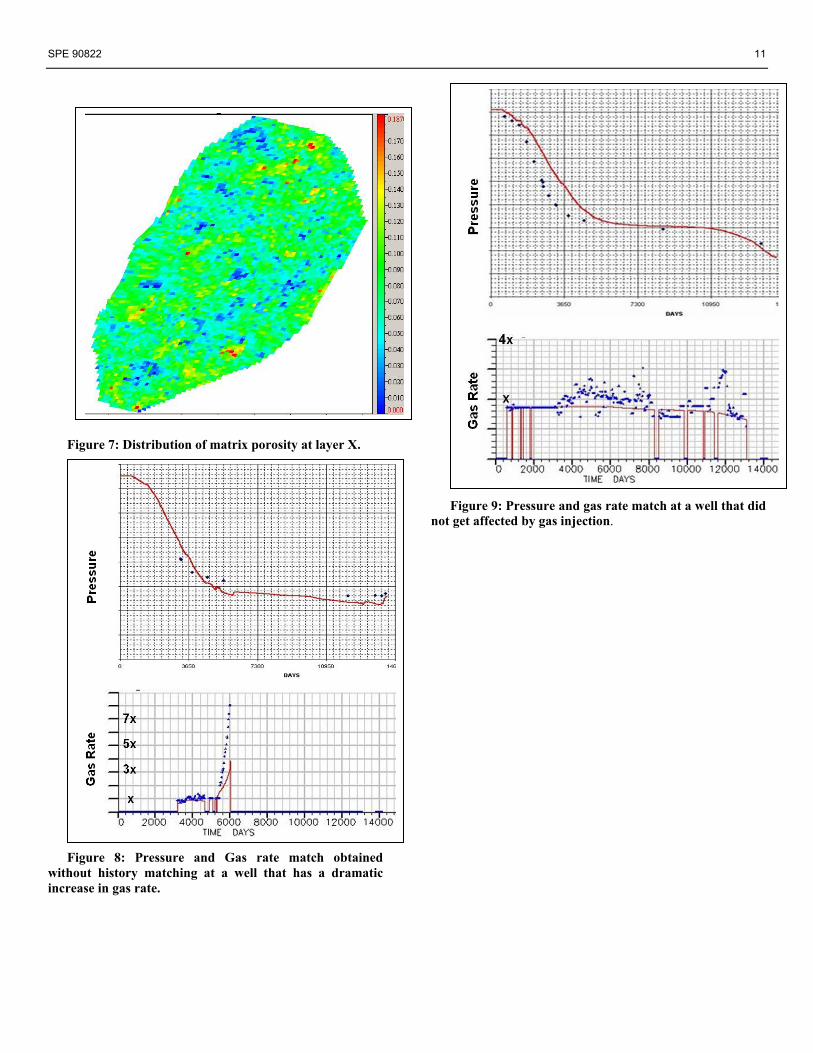
almost one hundred wells and many decades of production under primary, secondary and tertiary recovery mechanisms was the object of a similar workflow. Unlike the previous example, this fracture modeling effort did benefit from both the high resolution impedance (Figure 4) and the spectral imaging (Figure 5). These two seismic attributes played a major role in influencing the final fracture models. In this field, the storage is in the matrix and the permeability is provided mostly by the fractures. Figure 7 shows the porosity distribution at a given layer. This porosity distribution was generated using core porosity data and geostatistics. The examination of the core permeability along a production log demonstrates the ability of the plug to capture very well the high flow zones created by the fractures. As a result, the core permeability was used as a “fracture indicator”. The resulting distribution is shown in Figure 6 at the same given layer. The examination of these permeabilities from one layer to another shows the complexity of the flow network. This complexity was captured primarily by using two key seismic attributes. Because the core permeability had a magnitude smaller than the known well test values, a scaling factor was applied by facies. A detailed facies model divided the reservoir in multiple facies depending on their shale and quartz content. The facies with the highest quartz content are the most britlle; hence, the facies with the majority of the fractures. The scaling factor applied to different facies was high for the quartz-rich facies rich and was reduced as a function of the shale content. The facies without fractures had a scaling factor of one. The available porosity and the scaled permeability were input in a simulator, and surprisingly many decades of production were matched at almost all the wells. This match includes the gas rate, which was affected in many wells by a gas cap and subsequently by gas injection. Figure 8 shows the pressure and gas rate match of a well that was affected by the gas breakthrough. Figure 9 displays a well that was not affected by the gas breakthrough. Similar results were obtained for all the wells, and these results indicate the ability of the derived models to capture the complex “plumbing” revealed during secondary and tertiary recovery.
These efforts and successes are by no means an indication
that the simulation of fractured reservoirs is finally an easy task. Many other complex issues remain unsolved and will continue to challenge us. For example, a difficult problem is the estimation of external factors, such as water coming from other sources. Many fractured reservoirs around the world are plagued with the problem of water coming from faults and
originating in other formations. In such situation, there are no ways to measure or model the strength and rates of this water source, and history matching remains the only way to estimate the contribution of these external sources of water.
Another challenge in some fractured reservoirs is the
dynamic changes in permeability and porosity. The famous chalk fields in the North Sea are good examples, but there are a plethora of similar problems elsewhere. Fractured gas storage reservoirs, where the deliverability of the gas is dramatically reduced during the withdrwal phases, are a good example of the many difficulties created by the fractures. We have one problem essentially solved, but have many more left to solve.
Conclusions
The various completed integrated fractured modeling projects, spanning from seismic inversion to reservoir simulation, have demonstrated that key seismic attributes play a major role in improving the reservoir simulation models. In this paper we discussed some of the key issues encountered when modeling fractured reservoirs and shared our accumulated experience.
The main items higlighted in the paper are: 1. All the ultimate recovery data from existing
fractured reservoirs point to the need for serious reservoir modeling efforts to optimize reservoir management. It appears that a significant quantity of oil and gas is left behind because of inappropriate reservoir management strategies.
2. Fractured reservoir modeling efforts amongst most of the service companies are at an immature stage of development. There is an acute need for new SPE comparative solutions specially geared towards the validation of fractured reservoir modeling methods where the derived fracture permeability and porosity are input in accepted commercial simulators.
3. The use of seismic data in fracture modeling has followed a roller-coaster like ride of enthusiastic acceptance and abject rejection, owing in large part to unrealistic excpectations and the resulting failures. After the shear wave “trend” in seismic fracture detection, we are experiencing the azimuthal anisotropy “trend”. Methods and approaches that are too simplistic to extract realistic fracture information from seismic data may hurt more than help, as we have already experienced in many basins.
4. Despite the availability of extremely relevant seismic attributes resulting from high resolution inversion and spectral imaging, our experience has shown that the best use of seismic attributes is within an integrated framework where geologic and geomechanical data are used along with the seismic attributes to provide the full synergistic picture. The term “integrated framework” refers to algorithms that use the available information as input and produce an output able to digest all the
8 SPE90822
information. Displaying all the attributes in a 3D immersive environment and wearing goggles for stereo vision is not an integrated approach (although it may help to understand the fracture models).
5. Core measurements have provided consistent and accurate measures of fracture characteristics. These core measurements are in agreement with both production logs and image logs.
6. When using core permeability as a fracture indicator, simple upscaling is required.
7. Using the seismic attributes along with other geologic and geomechanical attributes, an integrated fracture modeling approach based on the use of artificial intelligence tools is capable of capturing the complex “plumbing” of any fractured reservoir.
8. Fractured models with a correct representation of the complex fracture network captured through the use of seismic data is able to match well performances even in the secondary and tertiary recovery where rapid breakthrough of water and gas has been always a challenging task.
Acknowledgements The authors would like to thank Prism Seismic clients for their participation and support in advancing the challenging field of seismically driven reservoir characterization. We would like to thank Schlumberger-Petrel for the collaboration on the geologic modeling as part of Prism Seismic’s integrated fracture modeling workflow.
References
1. Allan, J., Sun, Q.: “Controls on Recovery Factor
in Fractured Reservoirs: Lessons Learned from 100 Fractured Fields,” paper SPE 84590 presented at the 2003 SPE Annual Technical Conference and Exhibition, Denver.
2. Dorta, G., Boujana, M., Zerpa, L., Ramonez, M., Velasquez, C, Castillo, E.: ”An Approach to Naturally Fractured Reservoir Characterization: Case Study, San Juan Formation, Orocual Field, Venezuela,” SPE 69471 presented at the 2001 SPE Latin American and Caribbean Petroleum Engineering Conference, Buenos Aires, Argentina.
3. Kazemi, H. and Gilman, J. R.: "Chapter 6. Multiphase Flow in Fractured Petroleum Reservoirs", in Flow and Contaminant Transport in Fractured Rock, Edited by J. Bear, CF. Tsang, and G. de Marsily, Academic Press, San Diego, CA, 267-323 (1993).
4. Lorenz, J. C., Warpinski, N. R. and Teufel, L. W., 1996, Natural fracture characteristics and effects: THE LEADING EDGE, 15, no. 08, 909-911
5. Dershowitz, W., LaPointe, P., Eiben, T., and
Wei, L.: “Integration of Discrete Fracture Network Methods with Conventional Simulator Approaches,” SPE Res. Eval. & Eng., 165-170, (April 2000).
6. Ouenes, A. and Hartley, L.J.: “Integrated Fractured Reservoir Modeling Using Both Discrete and Continuum Approaches,” paper SPE 62939 presented at the 2000 SPE Annual Technical Conference and Exhibition, Dallas
7. Rogers, S, Mac Beth, C., Liu, E., Angerer, E.: “Constraining models of fractured reservoirs using seismic anisotropy maps, for improved reservoir performance and prediction,” 2003 SEG Annual Meeting, Dallas
8. Ozgen, C., Firincioglu, T., Albertoni, A. “ Fracture Characterization for Integrated Studies: A new Approach and its applications,” paper SPE 84413 at the 2003 SPE Annual Technical Conference and Exhibition, Denver
9. Ouenes, A., Richardson, S., Weiss, W.: “Fractured reservoir characterization and performance forecasting using geomechanics and artificial intelligence,” paper SPE 30572 presented at the 1995 SPE Annual Technical Conference and Exhibition.
10. Ouenes, A.: “Practical application of fuzzy logic and neural networks to fractured reservoir characterization,” Computers and Geosciences, Shahab Mohagegh (Ed.) v. 26, no 7
11. Zellou, A, Hartley, L.J, Hoogerduijn-Strating, E.H, Al Dhahab, S.H.H, Boom, W., Hadrami, F.: “Integrated Workflow Applied to the Characterization of a Carbonate Fractured Reservoir: Qarn Alam Field,” paper SPE 81579 presented at 2003 Middle East Oil Show & Conference, Bahrain.
12. Zellou, A., Ouenes, A: “Integrated Fractured Reservoir Characterization Using Neural Networks and Fuzzy Logic: Three case studies “,Soft Computing and Intelligent Data Analysis in Oil Exploration, Elsevier, Amsterdam
13. Laribi, M., Boubaker, H, Beck, B., Chen, H.K, Amiri- Garroussi, K, Rassas, S, Rourou, A, Boufares, T, Douik, H., Saidi, N., and Ouenes, A.: “Integrated Fractured Reservoir Characterization and Simulation: Application to Sidi El Kilani Field, Tunisia.”, paper SPE 84455 presented at the 2003 SPE Annual Technical Conference and Exhibition, Denver.
14. Gomes J.S., Ribeiro, M.T., Fouchard P., Twombley B.N., Negahban, S., Al-Baker, S.: “Geological Modeling of a Tight Carbonate Reservoir for Improved Reservoir Management of a Miscible WAG Injection Project, Abu Dhabi, U.A.E.” paper SPE 78529 presented at the 2002 Abu Dhabi International Petroleum Exhibition and Conference
SPE 90822 9
15. REFRACT; Integrated Fracture Modeling Software,www.prismseismic.com/software/refract/index.htm. Prism Seismic
16. Boerner, S., Gray, D., Todorovic-Marinic, D., Zellou, A., Schnerk, G: “ Employing Neural Networks to Integrate Seismic and Other Data for the Prediction of Fracture Intensity,” paper SPE 84453 at the 2003 SPE Annual Technical Conference and Exhibition, Denver
17. Kouider El Ouahed, A., Tiab, D., Mazouzi, A., Jokhio, S.: “Application of Artificial Intelligence to Characterize Naturally Fractured Reservoirs”, paper SPE 84870 presented at the 2003 Asia Pacific SPE International Improved Oil Recovery Conference, KL, Malayisa, 20-21 October 2003.
18. Zellou, A., Ouenes, A., Banik, A.: “Improved Naturally Fractured Reservoir Characterization Using Neural Networks, Geomechanics and 3-D Seismic,” paper SPE 30722 presented at the 1995 SPE Annual Technical Conference and Exhibition.
19. Ouenes, A., Robinson, G., Zellou, A:”Impact of Pre-Stack and Post-Stack Seismic on Integrated Naturally Fractured Reservoirs,” paper SPE 87007 presented at the 2004 SPE Asia Pacific Conference on Integrated Modelling for Asset Management, KL
20. Crampin, S.”Shear wave polarizations: A plea for three-component recording,” 1983 Ann. Internat. Mtg: Soc. of Expl. Geophys., Session:S12.7
21. Crampin, S., McGonigle, R., Ando, M.: “Extensive dilatancy anisotropy beneath Mount Hood: Origin and the effect of aspect ratio on seismic velocities through aligned cracks,” J. Geophys. Res., 91, 12703–12710, (1986).
22. Tien-When Lo, Bashore, W: “Seismic Constrained Facies Modeling Using Stocahstic Seismic Inversion and Indicator Simulation, A North Sea Example,” 1999 SEG Annual meeting
23. Robinson, G.” Stochastic Seismic Inversion Applied to Reservoir Characterization,” CSEG Recorder, January 2001, 37-40
24. Shen, F., Robinson, G., Jiang:“Instantaneous Spectral Analysis Applied to Reservoir Imaging and Producibility Characterization”, SEG 2003 Annual Meeting
25. Olson, J.E, Hennings, P.H, Laubach, S.E,:” Integrating Wellbore Data and Geomechanical Modeling for Effective Characterization of Naturally Fractured Reservoirs,’’ paper SPE 47352 presented at 1998 SPE/ISRM Eurock 98 held in Trondhiem, Norway, 8-10 July
26. Laubach, S.E., Doherty, E.,” Oriented Drilled Sidewall Cores for Natural Fracture Evalution,” paper SPE 56801presented at 1999 SPE Annual Technical Conference and Exhibition held in Houston
Figure 1 : North-South Cross section of Spectral imaging results at the drilled well location (white line). The bright red and yellow areas indicate the fractured zones filled with oil. Figure 2: High Resolution Inversion at a resolution of 0.5 (1/2) ms. The high impedance values in red and white are most likely hard rocks that are highly fractured and filled with oil. Production logs show that most of the oil is coming from the thin layer above the black horizon
10 SPE90822
Figure 3: Spectral Imaging technology reveals the areal
distribution of high amplitude zones, indicating oil-bearing reservoir, around the newly drilled exploration well in the South. The red and yellow areas indicate oil-filled fractures. Notice the apparently poor location of the exploration well (blue area), which is misleading.
Figure 4: Distribution of the impedance in layer X.
Figure 5: Distribution of one of the seismic attributes
derived from spectral imaging in layer X. Figure 6: Distribution of the fracture permeability
layer X.
SPE 90822 11
Figure 7: Distribution of matrix porosity at layer X. Figure 8: Pressure and Gas rate match obtained
without history matching at a well that has a dramatic increase in gas rate.
Figure 9: Pressure and gas rate match at a well that did
not get affected by gas injection.


![SPE 103284 Mexico07 - SIGMA CUBEDsigmacubed.com/filebin/files/CFM_Papers/SPE_103284_Mexico07.pdf · 2 [Paper Number] algaes, etc. All rocks have undergone a significant recrystallization](https://static.fdocuments.net/doc/165x107/5b7efd2f7f8b9ad4778b8046/spe-103284-mexico07-sigma-2-paper-number-algaes-etc-all-rocks-have-undergone.jpg)


