SPE-191562-18RPTC-MS Multistage Hydrofracturing Efficiency ...
9
SPE-191562-18RPTC-MS Multistage Hydrofracturing Efficiency Analysis and Horizontal Well Inflow Profiling Using Spectral Noise Logging Technique Alexey Andreev, Artur Kamalov, Ansar Zaripov, Dmitriy Kanyukov, Sergei Vyhristyuk, and Albert Yuvashev, RN-Purneftegaz LLC; Irina Aslanyan, Roza Minakhmetova, Alexander Trusov, and Yulia Maslennikova, TGT Oilfield Services Copyright 2018, Society of Petroleum Engineers This paper was prepared for presentation at the SPE Russian Petroleum Technology Conference held in Moscow, Russia, 15–17 October 2018. This paper was selected for presentation by an SPE program committee following review of information contained in an abstract submitted by the author(s). Contents of the paper have not been reviewed by the Society of Petroleum Engineers and are subject to correction by the author(s). The material does not necessarily reflect any position of the Society of Petroleum Engineers, its officers, or members. Electronic reproduction, distribution, or storage of any part of this paper without the written consent of the Society of Petroleum Engineers is prohibited. Permission to reproduce in print is restricted to an abstract of not more than 300 words; illustrations may not be copied. The abstract must contain conspicuous acknowledgment of SPE copyright. Abstract One of the most cost-effective technologies used during the development of hard-to-recover reserves is horizontal drilling with multistage hydraulic fracturing. This paper is dedicated to the assessment of multistage hydraulic fracturing effectiveness in formations with low-permeability and high clay content. The paper demonstrates how the integrated logging suite supplemented with High-Definition Spectral Noise Logging tool can provide valuable information on the flowing reservoir zones behind the liner and therefore the multistage hydraulic fracturing effectiveness. Based on the results of logging survey carried out in flowing regime with nitrogen being injected into the well, the hydraulic fracturing job performance was assessed and the inflow intervals were identified. As a result of the multistage hydraulic fracturing job, incremental oil production was achieved. On the basis of an integrated logging survey and field data analysis, the integrity of well completion elements was also checked. Introduction Hydraulic fracturing is the most efficient type of well interventions to ensure incremental production of hydrocarbons. In the regional petroleum industry hydraulic fracturing started to be put into practice since the middle of the XXth century but later on the interest in hydraulic fracturing was practically entirely lost after the highly productive Western Siberia fields had been brought into development. As the share of oil deposits in low permeability reservoirs in the structure of reserves was growing, the interest in hydraulic fracturing was revived in the early 90s. This technique is being constantly improved and upgraded in accordance with the new objectives and conditions. An increased number of hydraulic fracturing stages during development of low permeability reservoirs leads to an increased number of fractures penetrating the oil reservoir and therefore to a larger drainage zone. Identification of flows through induced fractures in the target reservoir is one of the criteria for assessing a hydraulic fracturing job effectiveness. The situation becomes even more complicated when the well is equipped with an uncemented liner. In this case the reservoir flow zones and hydraulic fracturing sleeves flow zones may differ considerably.
Transcript of SPE-191562-18RPTC-MS Multistage Hydrofracturing Efficiency ...
SPE-191562-18RPTC-MS
Multistage Hydrofracturing Efficiency Analysis and Horizontal Well InflowProfiling Using Spectral Noise Logging Technique
Alexey Andreev, Artur Kamalov, Ansar Zaripov, Dmitriy Kanyukov, Sergei Vyhristyuk, and Albert Yuvashev,RN-Purneftegaz LLC; Irina Aslanyan, Roza Minakhmetova, Alexander Trusov, and Yulia Maslennikova, TGTOilfield Services
Copyright 2018, Society of Petroleum Engineers
This paper was prepared for presentation at the SPE Russian Petroleum Technology Conference held in Moscow, Russia, 15–17 October 2018.
This paper was selected for presentation by an SPE program committee following review of information contained in an abstract submitted by the author(s). Contentsof the paper have not been reviewed by the Society of Petroleum Engineers and are subject to correction by the author(s). The material does not necessarily reflectany position of the Society of Petroleum Engineers, its officers, or members. Electronic reproduction, distribution, or storage of any part of this paper without the writtenconsent of the Society of Petroleum Engineers is prohibited. Permission to reproduce in print is restricted to an abstract of not more than 300 words; illustrations maynot be copied. The abstract must contain conspicuous acknowledgment of SPE copyright.
AbstractOne of the most cost-effective technologies used during the development of hard-to-recover reservesis horizontal drilling with multistage hydraulic fracturing. This paper is dedicated to the assessment ofmultistage hydraulic fracturing effectiveness in formations with low-permeability and high clay content.
The paper demonstrates how the integrated logging suite supplemented with High-Definition SpectralNoise Logging tool can provide valuable information on the flowing reservoir zones behind the liner andtherefore the multistage hydraulic fracturing effectiveness.
Based on the results of logging survey carried out in flowing regime with nitrogen being injected intothe well, the hydraulic fracturing job performance was assessed and the inflow intervals were identified. Asa result of the multistage hydraulic fracturing job, incremental oil production was achieved. On the basisof an integrated logging survey and field data analysis, the integrity of well completion elements was alsochecked.
IntroductionHydraulic fracturing is the most efficient type of well interventions to ensure incremental production ofhydrocarbons. In the regional petroleum industry hydraulic fracturing started to be put into practice since themiddle of the XXth century but later on the interest in hydraulic fracturing was practically entirely lost afterthe highly productive Western Siberia fields had been brought into development. As the share of oil depositsin low permeability reservoirs in the structure of reserves was growing, the interest in hydraulic fracturingwas revived in the early 90s. This technique is being constantly improved and upgraded in accordance withthe new objectives and conditions. An increased number of hydraulic fracturing stages during developmentof low permeability reservoirs leads to an increased number of fractures penetrating the oil reservoir andtherefore to a larger drainage zone. Identification of flows through induced fractures in the target reservoiris one of the criteria for assessing a hydraulic fracturing job effectiveness. The situation becomes even morecomplicated when the well is equipped with an uncemented liner. In this case the reservoir flow zones andhydraulic fracturing sleeves flow zones may differ considerably.
2 SPE-191562-18RPTC-MS
The High-Definition Spectral Noise Logging hardware and software system has been developed to solvesuch tasks as location of flowing hydraulic fracturing sleeves, identification of behind-casing flows andestimation of their rates, and integrity assessment of swell packers. The flowing zones in the reservoir,behind the liner, were identified by the SNL high-frequency component. This paper describes a newtechnique of defining an inflow flow profile inside the wellbore based on the SNL data. A technique that usesthe low-frequency noise power for estimation of inflows inside the liner was applied for the first time ever.
Technologies
Spectral Noise LoggingThe Spectral Noise Logging suite is a hardware and software system developed for recording acousticsignals generated in the wellbore in a wide frequency range [1-4]. The key component of the systemis the High-Definition Spectral Noise Logging tool. The highly sensitive hydrophone which is part ofthe SNL-HD tool can record sound pressure levels starting from 1 mPa (threshold sensitivity) and has awide dynamic range (100 dB). The SNL-HD is equipped with special metrological equipment to monitorthe technical characteristics and sensitivity of the measuring instruments while manufacturing and beforelogging operations. A special calibration stand was developed for estimation of amplitude and frequencyresponse of the SNL-HD tool with accuracy up to 3 dB. There is also a mobile calibration tester available totest the tool sensitivity in field conditions immediately before and after the logging survey in the frequencyband up to 60 kHz. This measuring system not only assures a high quality of the data recorded by the toolbut also their uniformity. This applies to the test measurements performed both in lab conditions and inthe wellbore.
The software system for SNL data processing and visualisation is equipped with advanced adaptive filtersand digital data processing equipment. The software performs automatic data matching and data qualitycontrol, calculates spectral panels and adaptively adjusts their amplitude, filters out statistically significantsignals, and automatically recognises the signal.
Acoustic Flowmeter. When an injector or a producer is logged in injection of flowing regime, acousticsignals generated by fluid flow in the wellbore can very often be observed. However, not any fluid flow inthe pipe can be the source of acoustic waves but only a turbulent flow. A turbulent flow is formed whenthe fluid velocity across the pipe section reaches a critical value determined by the Reynold's number. Thepipe cross-section should be estimated in this case after deducting the area occupied by the toolstring inthe wellbore.
The theory of sound generation by turbulent flow was originally suggested in early 50s in M. Lighthill'sworks (5) where he proposes a solution of heterogeneous wave equation deduced on the basis of equationsof continuity and momentum conservation, with turbulent flow moving in infinite space. In late 50s N. Curl[6] supplemented Lighthill's theory by adding rigid boundaries to the turbulent flow (in our case these arepipe walls). According to the Lighthill - Curle's heterogeneous wave equation, the acoustic power dependsin a complex way on the pipe and fluid flow parameters:
(1)
where W is acoustic power, u - flow velocity, ρ - average fluid density in the pipe cross-section, a – soundvelocity in fluid and d - pipe diameter which determines the typical turbulence scale.
Such strong dependence of the generated acoustic signal power on flow velocity along the wellboremakes SNL very sensitive to any variation of flow velocity in the pipe and wellbore, and makes it possibleto use the SNL tool as a sort of acoustic flowmeter. Currently, this technique can yield unambiguous resultsonly in case of a single-phase flow, as a consequence of sound velocity and density depending heavily onthe fluid type. The resulting injection/flow profile is relative and should be calibrated to the total injection/

SPE-191562-18RPTC-MS 3
flow rate measured at surface. This technique was proved by multiple lab experiments with gaseous andliquid fluids, during which the wellbore flow velocity profile derived according to SNL data was found tobe in good correlation with the spinner data. The accuracy of calculations made according to the acousticflowmeter technique is about 3%.
Daisy Chain. To eliminate the acoustic signals produced by SNL-HD and other tools in the toolstring asthey move along the wellbore, the Spectral Noise Logging is recommended to be performed at stations. Itis especially important that the measurements are taken at stations in case of low-power acoustic signalsgenerated, for example, by fluid flow at relatively low underbalance or overbalance pressures. Low-power acoustic signals are also generated by fluid flows through well completion leaks at low fluid flowvelocities. When logging at stations, the SNL data quality depends primarily on the duration of stationarymeasurements and the depth step. The depth step is selected according to the survey objectives and thelogging interval. In some cases, for example, for the purpose of leak detection, the distance between stationscan be increased up to 3 m (10 ft). In order to reduce logging time in long horizontal wells, the measurementsmay also be taken at 3 m intervals. To increase logging speed during SNL surveys which in the majorityof cases are performed at stations, Daisy Chain technique is applied. This logging technique requires thesimultaneous use of several tools in one toolstring and a special data merging algorithm. In this case, theinterval covered by logging tools at each station will be several times larger. Accordingly, the number ofstations can be reduced several times without compromising the depth resolution, which can considerablycut down the logging time. The distance between stations depends on the number of SNL-HD sensors inthe Daisy Chain toolstring. The SNL-HD toolstring is shown below in Fig. 1.
Figure 1—Daisy Chain toolstring with three SNL-HD sensors
Temperature ModellingTemperature modelling is an effective tool for defining quantitative distribution of fluid inflows fromreservoir (inflow profile). The temperature logging technique is based on the analysis of temperatureanomalies generated in the reservoir both during production and after a hydraulic fracturing. The mostinformative temperature logs in terms of quantitative assessment of reservoir parameters can be recordedin a well that has been steadily flowing for a long period of time.
TermoSim™ software package is used for numerical modelling of temperature and hydrodynamicpatterns in the well-reservoir system with the purpose of flow profiling [7-9].
The TermoSim™ software package can simulate in detail the thermodynamic processes taking placein the well and the near-wellbore zone. The accuracy of the results totally depends on the completenessand quality of input parameters which include the information about porosity and permeability of thetarget formation and surrounding rocks, and insulation properties that are determined mostly by the well

4 SPE-191562-18RPTC-MS
completion design. The reservoir flow zones are specified on the basis of SNL data and the results of aqualitative analysis of anomalies on HPT logs recorded in different well operation regimes. The type offluid is specified on the basis of multiphase sensor data analysis.
Field overview and reservoir parameters within the survey zone
Lithostratigraphic characteristics of the formationThe field under study was discovered in 1978 in the West Siberian Basin and classified as the gas-condensatetype. The development target is a lithologically screened reservoir occurring at a depth of 2800-2850 m.The average formation water salinity is 16 g/l and specific electrical resistivity 0.14 Ohm·m. The averagereservoir permeability varies from well to well in a narrow range of 0.9 – 18.4 mD. The reservoir consistsof grey sandstones, often silty, micaceous, with argillaceous or argillaceous/carbonaceous cement. Thereservoir fluid is exposed to high pressures (up to 28 MPa) and temperatures (up to 98°C). The dew pointvaries from 16 to 18 MPa.
Case studyThis paper provides a case study of production profiling using acoustic flowmeter and temperaturemodelling techniques after a multistage hydraulic fracturing job to monitor its effectiveness.
The surveyed horizontal well was completed with uncemented liner and a system of casing packersand hydraulic fracturing sleeves. The entire volume of water injected during the hydraulic fracturing wasrecovered back a few days later. The production water cut after putting the well on stream was 50%. Afterthree months of production the water cut increased to 70%.
At the preparatory stage, before commencement of the hydraulic fracturing job, more than 550 m3 ofwater was pumped into the well, which resulted in the well flowing mainly water during the survey. Thefluid flow rate was 75 m3/day.
To profile the flows from reservoir into horizontal wellbore through hydraulic fracturing sleeves, andassess the integrity of sleeves and casing packers, an integrated logging suite containing a standard set ofsensors: GR, CCL, HPT, pressure gauge, PLT, HEX, multiphase sensors, and SNL-HD of the Daisy Chainmodification was run. The integrated logging survey was conducted several months after the multistagehydraulic fracturing job.
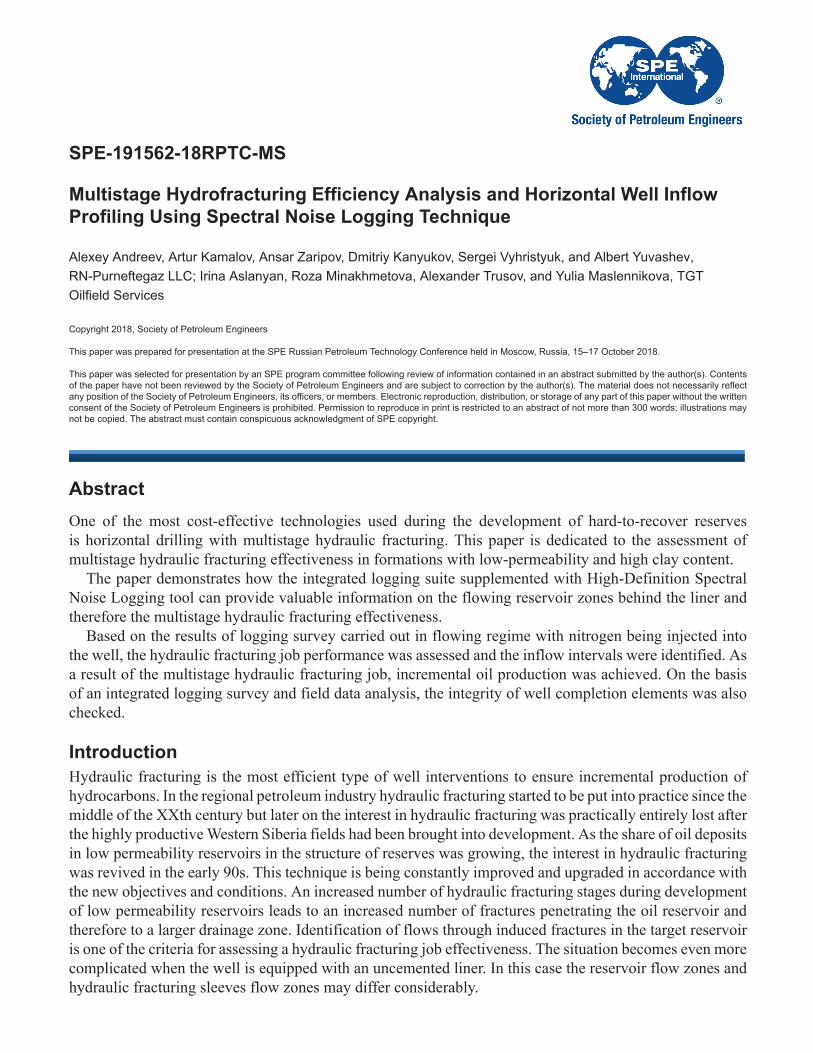
The survey was performed in several consecutive regimes. The logging programme was designed so asthe baseline log could be recorded under shut-in conditions. For this purpose, the well remained shut in for11 days before the survey. The logging toolstring was run on coil tubing. Then nitrogen was injected intothe annulus to stimulate the flow. The nitrogen was injected for more than 24 hours to stabilise reservoirtemperature and pressure. After logging in the steady flowing regime, the well was shut in and logging wascontinued under transient conditions: 1 hour and then 12 hours after shut-in. The integrated logging suiteschematic is shown in Fig 2.
SPE-191562-18RPTC-MS 5
Figure 2—Schematic of the integrated logging suite including SNL-HD technique
To shorten the logging time in 880 m long horizontal wellbore section without reducing the SNL dataresolution, the survey was run according to the Daisy Chain procedure. The SNL was performed at stationsin order to minimise the interference associated with the tool motion. The distance between stations in thesurveyed well was 3 m, which was equivalent to the continuous logging speed circa 3 m/min.
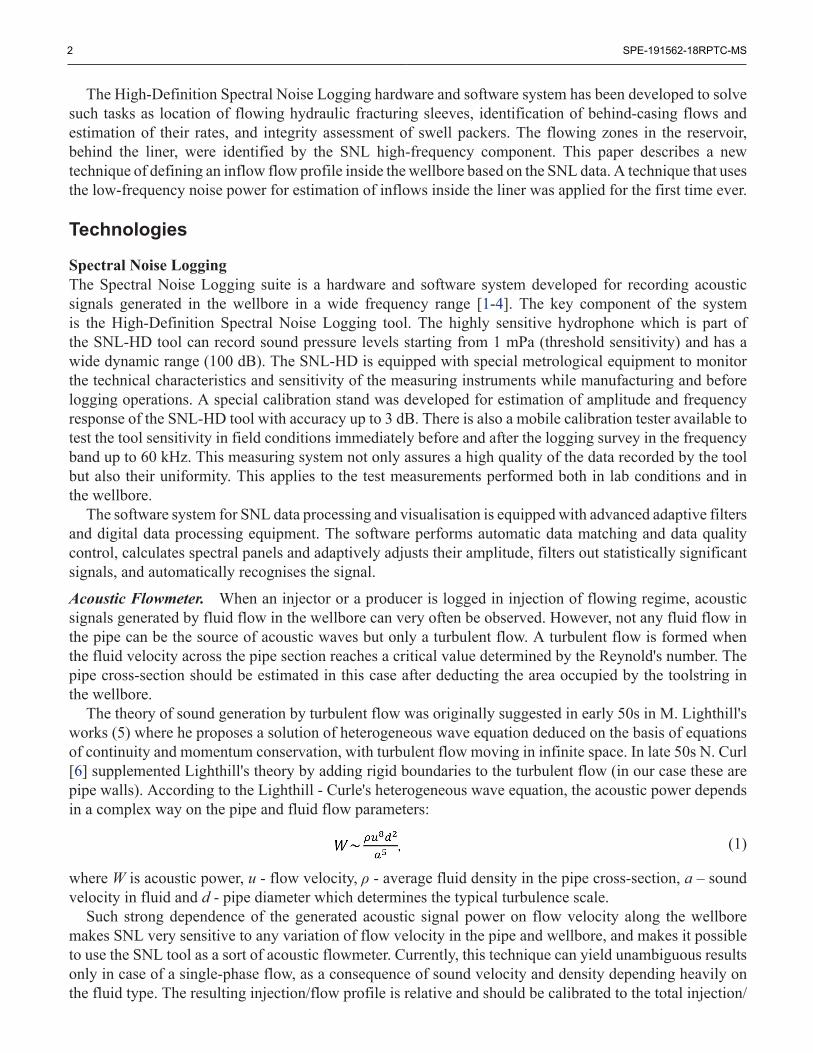
Inflow profiling in horizontal wellbore sectionThe main integrated logging results are shown in Fig. 3.
Figure 3—Results of the integrated logging suite including SNL-HD technique

6 SPE-191562-18RPTC-MS
The active flow zones were identified according to the SNL data (See SNL panel). Fluid flows alongthe active reservoir zones, including the flows through fractures created by multistage hydraulic fracturing,generate depth-specific acoustic signals that occur in a particular frequency spectrum extending to the high-frequency range.
Inflow profiling in horizontal wellbore section using Acoustic Flowmeter. Inflow profile throughhydraulic fracturing sleeves was determined with the Acoustic Flowmeter, based on the analysis of SNL-HDlow-frequency component. According to the multiphase sensor data (capacitance and salinity) the inflowcontained mainly water and it can be therefore assumed that the relationship between fluid density and sonicwave velocity in fluid remained more or less constant. As the liner diameter was the same (4½ ″) in theentire horizontal wellbore section, all acoustic signal power variations were caused by the changes in flowvelocity in the horizontal wellbore section.
To estimate the acoustic signal power of the low-frequency component of the spectrum, a frequencyrange below 10 kHz was selected because the most intensive acoustic signals from the wellbore flows hadbeen observed in this well in this particular frequency range. Although the flow rate of the fluid producedfrom the entire horizontal wellbore section was only 75 m3/day, the linear velocity of the flow along theliner was sufficiently high to create a turbulent flow. This turbulent flow along the wellbore generates low-frequency acoustic signal of the intensity varying with flow velocity increase.
The SNL column in Fig. 3 contains a curve representing the relative flow velocity in the horizontalwellbore section estimated according to the SNL data. To improve the accuracy of flow velocity estimations,the sound produced by the tool itself was taken into account, and, in particular, the sound generated by thetool electronics, which was observed even when there were no other acoustic signal sources in the well.The relative profile of flow velocity in the intervals between hydraulic fracturing sleeves was averaged,disregarding the intervals where acoustic signals from flowing reservoir zones and fractures were presenttogether with the low-frequency range signal. At the depth shown by Line A the value of fluid flow velocityshould correspond to the fluid production rate in the horizontal wellbore section and therefore this intervalwas selected for the general profile normalisation and estimation of absolute values for the inflow profilein the horizontal wellbore section.
It should be noted that above the depth marked as Line B the pipe ID varies because the liner changesover to the tubing of a smaller diameter (3½ ″), resulting in an increase of low-frequency acoustic signalpower at this depth. No flow velocity variations take place at this depth.
The inflows through the hydraulic fracturing sleeves show that the main fluid (water with traces ofhydrocarbons) flows are from the reservoir zones across hydraulic fracturing stages 4 through 7 where,according to the open-hole data, the most extensive and permeable intervals of the multilayer reservoir occur,with one fifth of the total well production (12 m3/day) coming from sleeve 6. The zone with such low flowrate could not be located by the spinner but HEX sensor (See HEX column), which has a lower sensitivitythreshold, showed a slight variation in the readings. A small volume of fluid enters the wellbore throughthe top hydraulic fracturing sleeve 9. The reservoir interval across the lower three sleeves contributes onlyslightly to the well production, which is partially due to poor reservoir quality in this zone.
Temperature modelling-based inflow profile. Temperature simulations help to estimate inflow profiles inhorizontal wells including inflows both from sleeves and directly from the reservoir. It can be seen that theflowing temperature curve (blue line in the HPT column) contains anomalies at each sleeve and betweenthem, which is due to the flows from the reservoir.
In this particular case a quantitative analysis of the temperature curves is complicated by the fact that alarge volume (500 m3) of cold water was injected into the well immediately before the survey, resulting inan uncontrollable temperature drop in the near-wellbore zone. The geothermal profile (green TG line in theHPT column) that was reconstructed on the basis of temperature data recorded near the rathole indicatesthat all curves show a temperature decrease in comparison with the initial temperature. The estimation of
SPE-191562-18RPTC-MS 7
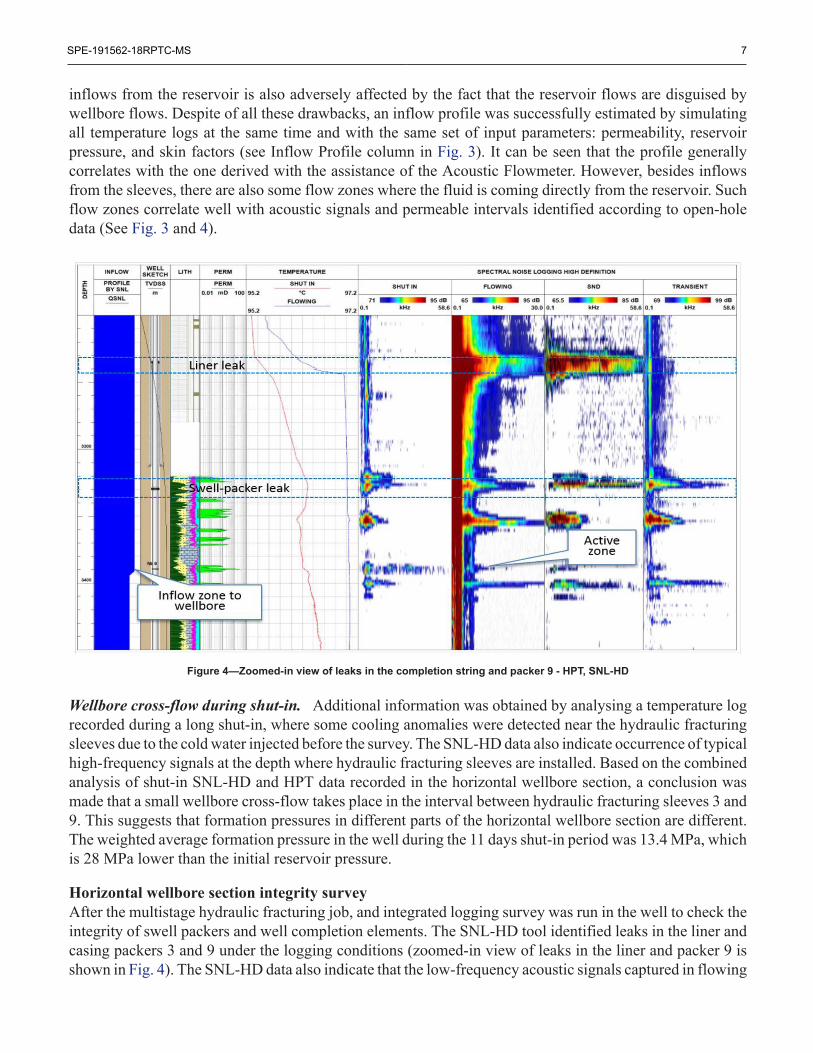
inflows from the reservoir is also adversely affected by the fact that the reservoir flows are disguised bywellbore flows. Despite of all these drawbacks, an inflow profile was successfully estimated by simulatingall temperature logs at the same time and with the same set of input parameters: permeability, reservoirpressure, and skin factors (see Inflow Profile column in Fig. 3). It can be seen that the profile generallycorrelates with the one derived with the assistance of the Acoustic Flowmeter. However, besides inflowsfrom the sleeves, there are also some flow zones where the fluid is coming directly from the reservoir. Suchflow zones correlate well with acoustic signals and permeable intervals identified according to open-holedata (See Fig. 3 and 4).
Figure 4—Zoomed-in view of leaks in the completion string and packer 9 - HPT, SNL-HD
Wellbore cross-flow during shut-in. Additional information was obtained by analysing a temperature logrecorded during a long shut-in, where some cooling anomalies were detected near the hydraulic fracturingsleeves due to the cold water injected before the survey. The SNL-HD data also indicate occurrence of typicalhigh-frequency signals at the depth where hydraulic fracturing sleeves are installed. Based on the combinedanalysis of shut-in SNL-HD and HPT data recorded in the horizontal wellbore section, a conclusion wasmade that a small wellbore cross-flow takes place in the interval between hydraulic fracturing sleeves 3 and9. This suggests that formation pressures in different parts of the horizontal wellbore section are different.The weighted average formation pressure in the well during the 11 days shut-in period was 13.4 MPa, whichis 28 MPa lower than the initial reservoir pressure.
Horizontal wellbore section integrity surveyAfter the multistage hydraulic fracturing job, and integrated logging survey was run in the well to check theintegrity of swell packers and well completion elements. The SNL-HD tool identified leaks in the liner andcasing packers 3 and 9 under the logging conditions (zoomed-in view of leaks in the liner and packer 9 isshown in Fig. 4). The SNL-HD data also indicate that the low-frequency acoustic signals captured in flowing
8 SPE-191562-18RPTC-MS
regime during nitrogen injection confirm that a cross-flow takes place from the overlying unperforatedreservoir zones (Fig. 3) due to a leak in packer 9.
ConclusionsThis paper describes the method of multistage fracturing effectiveness assessment using an integrateddownhole suite. Combined application of SNL-HD and HPT tools and subsequent temperature simulationhas made it possible to assess flows from the fractures created during the multistage hydraulic fracturing inthe horizontal well and check well completion integrity and swell packer operation. Upon an analysis of thelogging data, fluid flow zones were identified in the reservoir and quantitative estimation of inflows fromeach reservoir zone associated with hydraulic fracturing stages was carried out.
To estimate the profile of fluid flows into the wellbore through hydraulic fracturing sleeves, AcousticFlowmeter technique was applied. Although this technique has started to be used for flow assessment insteadof the conventional PLT only recently, it has already positioned itself confidently in the well services market,especially in horizontal well logging where the presence of mechanical parts in the logging tools causeadditional difficulties during the survey. This technique relies on the fact that the low-frequency acousticsignal intensity depends on the wellbore flow velocity, which affords an opportunity to estimate relativeinflows from each hydraulic fracturing sleeves.
The profiles of inflows through hydraulic fracturing sleeves plotted according to the Acoustic Flowmeterdata and the profile of inflows from reservoir into wellbore according to temperature modelling are in goodcorrelation with each other. The difference has been interpreted to be due to flow contribution from thereservoir zone behind the liner. The highest flow rates were identified in the middle part of the horizontalsection. These inflows are associated with hydraulic fracturing stages 4 through 7 due to better reservoirproperties in this interval of the target multilayer reservoir. In general, the integrated downhole survey resultshave confirmed that the hydraulic fracturing job was successful.
AcknowledgementsThe authors express their gratitude to Vener Nagimov, PhD, for the discussion of logging results andAlexander Sviridov, Well Log Analyst of the TGT Oilfield Services Geological Department for the loggingdata interpretation.
List of AcronymsCCL, Casing-Collar log
GR Gamma RayHEX Heat Exchange SensorHPT High Precision TemperatureSNL Spectral Noise Logging
SNL-HD High-Definition Spectral Noise Logging
References1. Suarez, N., Otubaga, A., Mehrotra, N., Aslanyan, A. et al. 2013. Complementing Production
Logging with Spectral Noise Analysis to Improve Reservoir Characterisation and Surveillance.Presented at the SPWLA 54th Annual Logging Symposium, 22-26 June, New Orleans,Louisiana. SPWLA-2013-TTT. https://www.onepetro.org/conference-paper/SPWLA-2013-TTT
2. Maslennikova, Y. S., Bochkarev, V. V., Savinkov, A. V., Davydov, D. A. 2012. Spectral NoiseLogging Data Processing Technology. Presented at the SPE Russian Oil and Gas Exploration

SPE-191562-18RPTC-MS 9
and Production Technical Conference and Exhibition, 16-18 October, Moscow, Russia.doi:10.2118/162081-MS.
3. Ghalem, S., Serry, A. M., Al-felasi Ali et al. 2012. Innovative Logging Tool Using Noise Logand High Precision Temperature Help to Diagnoses Complex Problems. Presented at the AbuDhabi International Petroleum Conference and Exhibition, 11-14 November, Abu Dhabi, UAE.doi:10.2118/161712-MS.
4. McKinley, R. M., Bower, F. M., Rumble, R. C. 1973. The Structure and Interpretation of Noisefrom Flow Behind Cemented Casing. Society of Petroleum Engineers. doi:10.2118/3999-PA.
5. M. J. Lighthill, "On Sound Generated Aerodynamically: Turbulence as a Sound Source", 1954.6. N. Curle , H.J. Davies, Modern fluid dynamics. – London: Van Nostrand, 19687. Aslanyan, A., Wilson, M., Al Shammakhy, A., Aristov, S. 2013. Evaluating Injection
Performance with High-precision Temperature Logging and Numerical Temperature Modelling.Presented at the SPE Reservoir Characterization and Simulation Conference and Exhibition,16-18 September, Abu Dhabi, UAE. doi:10.2118/166007-MS.
8. A.A. Lutfullin (Novatek-Tarkosaleneftegaz LLC), A.R. Abdrahimov (Novatek JSC), I.N.Shigapov, I. Yu. Aslanyan, A.M. Aslanyan, R.K. Kuzyutin (TGT Oilfield Services). 2014.Identification of Behind-Casing Flowing Reservoir Intervals by the Integrated High-PrecisionTemperature and Spectral Noise Logging Techniques. Presented at the SPE Russian Oil and GasExploration & Production Technical Conference and Exhibition, 14-16 October, Moscow, Russiahttps://doi.org/10.2118/171251-RU
9. A. Aslanyan, I. Aslanyan, A. Salamatin, A. Karuzin, Y. Fesina et al. 2014. NumericalTemperature Modelling for Quantitative Analysis of Low-Compressible Fluid Production. SPE172090 presented at the Abu-Dhabi International Petroleum Exhibition and Conference held inAbu-Dhabi, UAE, 10–13 November. https://doi.org/10.2118/172090-MS