Spatially Resolved Kinematics of Binary Quasar Candidates · Spatially Resolved Kinematics of...
26
Spatially Resolved Kinematics of Binary Quasar Candidates IFU Spectroscopy with VIMOS/VLT Ivana Stoklasová–Orlitová Astronomical Institute, Academy of Sciences, Prague, Czech Republic In collaboration with: B. Jungwiert, T. Skalická, M. Kˇ rížek, L. Jílková, I. Ebrová, K. Bartošková
Transcript of Spatially Resolved Kinematics of Binary Quasar Candidates · Spatially Resolved Kinematics of...

Spatially Resolved Kinematics of Binary QuasarCandidates
IFU Spectroscopy with VIMOS/VLT
Ivana Stoklasová–Orlitová
Astronomical Institute, Academy of Sciences, Prague, Czech Republic
In collaboration with:B. Jungwiert, T. Skalická, M.Krížek, L. Jílková, I. Ebrová, K. Bartošková

Introduction: Binary Quasar Candidates in SDSS
Double-peaked [O III] lines in SDSSe. g. Liu et al. (2010a), Smith et al. (2010)Follow-up observations:NIR and optical imaging, slit spectroscopy, IFU spectroscopy(Rosario et al. 2011; Liu et al. 2010b; Shen et al. 2011; Fu et al. 2012)
Liu et al. (2010) Liu et al. (2010)
Our VIMOS/VLT observations (2010)Stoklasová (PI), Jungwiert, Bartáková, Bartošková, Ebrová, Jílková, Krížek
Targets:Selected 5 low-z targets (pilot study) from Liu et al. (2010a)Selection by redshift (0.03 < z < 0.07), luminosity and RA
Goals:Observe selected candidates with VIMOSDerive spatial kinematics and [O III]/H! ratioInterpretation – detailed exploration of 3D data cubes
binary AGNrotation, outflow (double-peaked lines frequent in Seyferts)projection of two galaxies along LOS

VIMOS/VLT observationsESO program number 085.B-0669
Targets:SDSS J144804.17+182537.8 ! Q1418SDSS J151659.24+051751.5 ! Q1505SDSS J155619.29+094855.5 ! Q1509SDSS J163056.75+164957.1 ! Q1616SDSS J230442.82–093345.2 ! Q23–09
Observations in spring/summer 2010High-resolution spatial sampling 0.33"/pixelSeeing 0.6" – 0.8" (i. e. resolution " 0.5 – 1 kpc)FOV: 13" # 13"High spectral resolution (R = 2550, dispersion 0.51 Å/pixel)– resolution 120 km/sSpectral range 4 150 – 6200 Å (HR blue grism) – [O III], H!
Integration 8 # 1000 s for each targetWe have approx. 300 resultant emission spectra per target
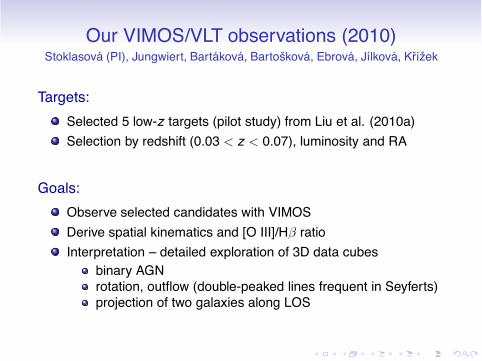
VIMOS – Stellar continuumCentral 2 – 3 kpc
Q1418
z = 0.0378
1"= 0.75 kpc
Q1509
z = 0.0678
1" =1.3 kpc
Q1418 Continuum 4000 - 6000 A
-1 0 1 2 3arcsec
-3.0
-2.0
-1.0
0.0
1.0arc
sec
200.0
400.0
600.0
800.0
1000.0
1200.0
1400.0
1600.0
1800.0
Q1505 Continuum 4000 - 6000 A
-1 0 1 2 3 4arcsec
-3
-2
-1
0
1
arc
sec
200.0
400.0
600.0
800.0
1000.0
1200.0
Q1509 Continuum 4000 - 6000 A
-1.0 0.0 1.0 2.0 3.0arcsec
-2.0
-1.0
0.0
1.0
arc
sec
500.0
1000.0
1500.0
2000.0
Q1616 Continuum 4000 - 6000 A
-1.0 0.0 1.0 2.0arcsec
-1.0
0.0
1.0
arc
sec
500.0
1000.0
1500.0
2000.0
Q1505
z = 0.0512
1" =1 kpc
Q1616
z = 0.0341
1" =0.67 kpc

VIMOS – [O III] Emission mapsAligned with continuum, extent: ! 1.5– 3 kpc
Q1418
z = 0.0378
1"= 0.75 kpc
Q1509
z = 0.0678
1" =1.3 kpc
Intensity in [OIII] 5007, both comp’s
-1 0 1 2 3arcsec
-3.0
-2.0
-1.0
0.0
1.0arc
sec
1.0
2.0
3.0
4.0
5.0
6.0
7.0
8.0
9.0
Intensity in [OIII] 5007
-1 0 1 2 3 4arcsec
-3
-2
-1
0
1
arc
sec
5.0
10.0
15.0
20.0
Intensity in [OIII] 5007, both comp’s
-1.0 0.0 1.0 2.0 3.0arcsec
-2.0
-1.0
0.0
1.0
arc
sec
2.0
4.0
6.0
8.0
10.0
12.0
14.0
16.0
Intensity in [OIII] 5007, both comp’s
-1.0 0.0 1.0 2.0arcsec
-1.0
0.0
1.0
arc
sec
5.0
10.0
15.0
20.0
25.0
30.0
Q1505
z = 0.0512
1" =1 kpc
Q1616
z = 0.0341
1" =0.67 kpc
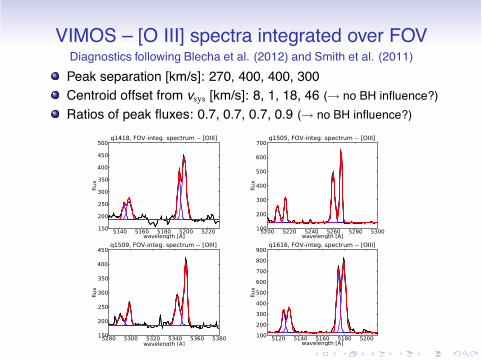
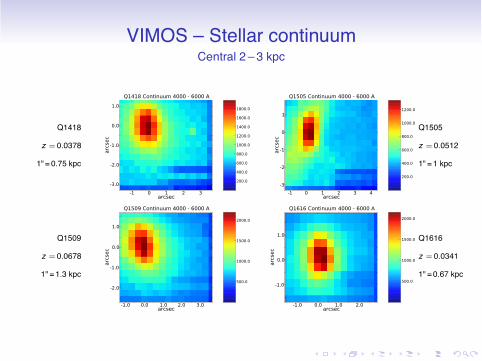
VIMOS – [O III] spectra integrated over FOVDiagnostics following Blecha et al. (2012) and Smith et al. (2011)Peak separation [km/s]: 270, 400, 400, 300Centroid offset from vsys [km/s]: 8, 1, 18, 46 (" no BH influence?)Ratios of peak fluxes: 0.7, 0.7, 0.7, 0.9 (" no BH influence?)
q1418, FOV-integ. spectrum -- [OIII]
5140 5160 5180 5200 5220wavelength [A]
150
200
250
300
350
400
450
500
flux
q1505, FOV-integ. spectrum -- [OIII]
5200 5220 5240 5260 5280 5300wavelength [A]
100
200
300
400
500
600
700
flux
q1509, FOV-integ. spectrum -- [OIII]
5280 5300 5320 5340 5360 5380wavelength [A]
150
200
250
300
350
400
450
flux
q1616, FOV-integ. spectrum -- [OIII]
5120 5140 5160 5180 5200wavelength [A]
100
200
300
400
500
600
700
800
900flux

VIMOS - [O III] spectra spatially resolved
Spectral line profiles: from simple narrow to complex
Q1505
Spec No.4
5170 5220 52700
10
20
30Spec No.200
5170 5220 52700
1
2
3
Spec No.77
5170 5220 52700.5
1.5
2.5Spec No.93
5170 5220 52700.6
1.0
1.4
1.8
2.2
2.6
Q1509
Spec No.54
5270 5320 5370
2
6
10Spec No.64
5270 5320 53700
4
8
12
16
Spec No.82
5270 5320 53701.0
1.4
1.8
2.2
2.6 Spec No.92
5270 5320 53701
2
3
4

VIMOS – Q1505J151659+051752, z = 0.0512, 1" = 3 pixels = 1 kpc
Q1505 Continuum 4000 - 6000 A
-1 0 1 2 3 4arcsec
-3
-2
-1
0
1
arc
sec
200.0
400.0
600.0
800.0
1000.0
1200.0
Intensity in [OIII] 5007
-1 0 1 2 3 4arcsec
-3
-2
-1
0
1
arc
sec
5.0
10.0
15.0
20.0
Mean LOS velocity in [OIII] 5007
-1 0 1 2 3 4arcsec
-3
-2
-1
0
1
arc
sec
-200.0
-100.0
0.0
100.0
200.0
FWHM of [OIII] 5007
-1 0 1 2 3 4arcsec
-3
-2
-1
0
1
arc
sec
100.0
200.0
300.0
400.0
500.0

Theoretical I, v, ! mapsCode by Jugwiert et al. (2007)
Velocity maxima off-axis:in elliptical rotation, or circular rotation + outflow
Rotating disk – flat vr Elliptical rotation
Expanding disk Outflow in a cone
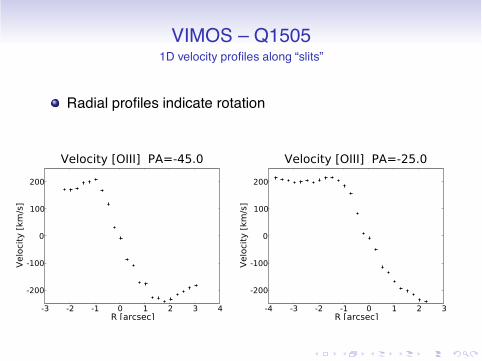
VIMOS – Q15051D velocity profiles along “slits”
Radial profiles indicate rotation
Velocity [OIII] PA=-45.0
-3 -2 -1 0 1 2 3 4R [arcsec]
-200
-100
0
100
200
Velo
city
[km
/s]
Velocity [OIII] PA=-25.0
-4 -3 -2 -1 0 1 2 3R [arcsec]
-200
-100
0
100
200
Velo
city
[km
/s]

VIMOS – Q1505Velocity channel maps for [O III] 5007
Range: (– 440,420) km/s1 channel: 60 km/s
-1 0 1 2 3 4arcsec
-3
-2
-1
0
1
arc
sec
-1 0 1 2 3 4arcsec
-3
-2
-1
0
1
arc
sec
-1 0 1 2 3 4arcsec
-3
-2
-1
0
1
arc
sec
-1 0 1 2 3 4arcsec
-3
-2
-1
0
1
arc
sec
-1 0 1 2 3 4arcsec
-3
-2
-1
0
1
arc
sec
-1 0 1 2 3 4arcsec
-3
-2
-1
0
1
arc
sec
-1 0 1 2 3 4arcsec
-3
-2
-1
0
1
arc
sec
-1 0 1 2 3 4arcsec
-3
-2
-1
0
1
arc
sec
-1 0 1 2 3 4arcsec
-3
-2
-1
0
1
arc
sec
-1 0 1 2 3 4arcsec
-3
-2
-1
0
1
arc
sec
-1 0 1 2 3 4arcsec
-3
-2
-1
0
1
arc
sec
-1 0 1 2 3 4arcsec
-3
-2
-1
0
1
arc
sec
-1 0 1 2 3 4arcsec
-3
-2
-1
0
1
arc
sec
-1 0 1 2 3 4arcsec
-3
-2
-1
0
1arc
sec
-1 0 1 2 3 4arcsec
-3
-2
-1
0
1
arc
sec

Theoretical velocity channel mapsRotating disk – flat vr
Outflow in Disk (-1000,-800) km/s
0 10 20 30 40arcsec
5
10
15
20
25
30
35
40
arc
sec
Outflow in Disk (-800,-600) km/s
0 10 20 30 40arcsec
5
10
15
20
25
30
35
40
arc
sec
Outflow in Disk (-600,-400) km/s
0 10 20 30 40arcsec
5
10
15
20
25
30
35
40
arc
sec
Outflow in Disk (-400,-200) km/s
0 10 20 30 40arcsec
5
10
15
20
25
30
35
40
arc
sec
Outflow in Disk (-200,0) km/s
0 10 20 30 40arcsec
5
10
15
20
25
30
35
40
arc
sec
Outflow in Disk (0,200) km/s
0 10 20 30 40arcsec
5
10
15
20
25
30
35
40
arc
sec
Outflow in Disk (200,400) km/s
0 10 20 30 40arcsec
5
10
15
20
25
30
35
40
arc
sec
Outflow in Disk (400,600) km/s
0 10 20 30 40arcsec
5
10
15
20
25
30
35
40
arc
sec
Outflow in Disk (600,800) km/s
0 10 20 30 40arcsec
5
10
15
20
25
30
35
40
arc
sec
Outflow in Disk (800,1000) km/s
0 10 20 30 40arcsec
5
10
15
20
25
30
35
40
arc
sec
Outflow in Disk (1000,1200) km/s
0 10 20 30 40arcsec
5
10
15
20
25
30
35
40
arc
sec
Outflow in Disk (1200,1400) km/s
0 10 20 30 40arcsec
5
10
15
20
25
30
35
40
arc
sec
Outflow in Disk (1400,1600) km/s
0 10 20 30 40arcsec
5
10
15
20
25
30
35
40
arc
sec
Outflow in Disk (1600,1800) km/s
0 10 20 30 40arcsec
5
10
15
20
25
30
35
40
arc
sec
Outflow in Disk (1800,2000) km/s
0 10 20 30 40arcsec
5
10
15
20
25
30
35
40
arc
sec
Outflow in a hollow cone

Theoretical velocity channel maps
Elliptical rotating disk

VIMOS – Q1505Position-velocity diagrams
P-V diagram for [OIII] 5007, PA = -45 deg
-3 -2 -1 0 1 2 3
arcsec-542
-324
-106
111
329
velo
city
[km
/s]
2.0
4.0
6.0
8.0
10.0
12.0
14.0
16.0
18.0
P-V diagram for [OIII] 5007, PA = -25 deg
-3 -2 -1 0 1 2 3
arcsec-542
-324
-106
111
329
velo
city
[km
/s]
2.0
4.0
6.0
8.0
10.0
12.0
14.0
16.0
18.0
P-V diagram for [OIII] 5007, PA = 45 deg
-3 -2 -1 0 1 2 3
arcsec-542
-324
-106
111
329
velo
city
[km
/s]
0.5
1.0
1.5
2.0
2.5
3.0
P-V diagram for [OIII] 5007, PA = 90 deg
-3 -2 -1 0 1 2 3
arcsec-542
-324
-106
111
329
velo
city
[km
/s]
0.5
1.0
1.5
2.0
2.5
3.0
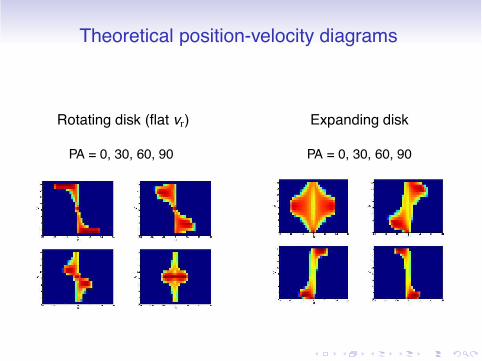
Theoretical position-velocity diagrams
Rotating disk (flat vr)
PA = 0, 30, 60, 90
Expanding disk
PA = 0, 30, 60, 90
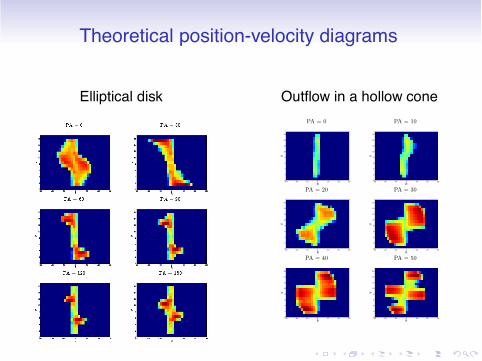
Theoretical position-velocity diagrams
Elliptical disk Outflow in a hollow conePA = 0 PA = 10
-30 -20 -10 0 10 20 30
R0
2
4
6
8
10
12
14
16
V
-30 -20 -10 0 10 20 30
R0
2
4
6
8
10
12
14
16
V
PA = 20 PA = 30
-30 -20 -10 0 10 20 30
R0
2
4
6
8
10
12
14
16
V
-30 -20 -10 0 10 20 30
R0
2
4
6
8
10
12
14
16
V
PA = 40 PA = 50
-30 -20 -10 0 10 20 30
R0
2
4
6
8
10
12
14
16
V
-30 -20 -10 0 10 20 30
R0
2
4
6
8
10
12
14
16
V
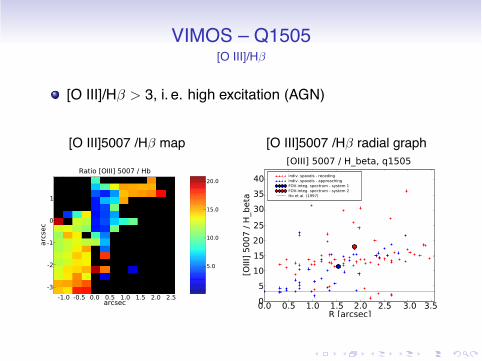
VIMOS – Q1505[O III]/H!
[O III]/H! > 3, i. e. high excitation (AGN)
[O III]5007 /H! map [O III]5007 /H! radial graph
Ratio [OIII] 5007 / Hb
-1.0 -0.5 0.0 0.5 1.0 1.5 2.0 2.5arcsec
-3
-2
-1
0
1
arc
sec
5.0
10.0
15.0
20.0
[OIII] 5007 / H_beta, q1505
0.0 0.5 1.0 1.5 2.0 2.5 3.0 3.5R [arcsec]
0
5
10
15
20
25
30
35
40
[OIII]
50
07
/ H
_beta
indiv. spaxels - recedingindiv. spaxels - approachingFOV-integ. spectrum - system 1FOV-integ. spectrum - system 2Ho et al. (1997)

Q1505 – InterpretationElliptical ring (r = 2.5 kpc)?
2 emission-line regions (5 kpc sepation),– off-centered, but aligned with continuumHigh excitation ([O III]/H!)Simple narrow lines (200 km/s)FOV spectrum double-peakedVelocity map: rotation (?), maxima off-axis1D rotation curve at PA = – 45 degVelocity channel maps: do not have the “V-shapes” typicalof rotation. Effect of resolution?P-V diagrams: rotation (?)FWHM different in the two parts of the ring
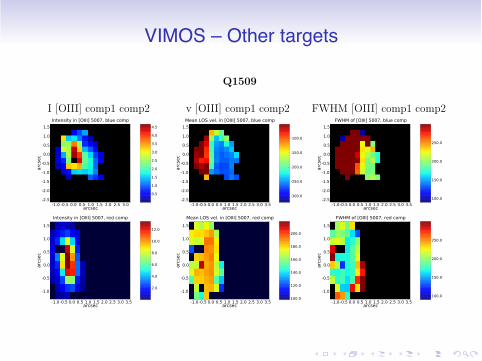
VIMOS – Other targets
Q1509
I [OIII] comp1 comp2 v [OIII] comp1 comp2 FWHM [OIII] comp1 comp2Intensity in [OIII] 5007, blue comp
-1.0 -0.5 0.0 0.5 1.0 1.5 2.0 2.5 3.0arcsec
-2.5
-2.0
-1.5
-1.0
-0.5
0.0
0.5
1.0
1.5
arc
sec
0.5
1.0
1.5
2.0
2.5
3.0
3.5
4.0
4.5
Mean LOS vel. in [OIII] 5007, blue comp
-1.0-0.5 0.0 0.5 1.0 1.5 2.0 2.5 3.0 3.5arcsec
-2.5
-2.0
-1.5
-1.0
-0.5
0.0
0.5
1.0
1.5
arc
sec
-300.0
-250.0
-200.0
-150.0
-100.0
FWHM of [OIII] 5007, blue comp
-1.0-0.5 0.0 0.5 1.0 1.5 2.0 2.5 3.0 3.5arcsec
-2.5
-2.0
-1.5
-1.0
-0.5
0.0
0.5
1.0
1.5
arc
sec
100.0
150.0
200.0
250.0
Intensity in [OIII] 5007, red comp
-1.0-0.5 0.0 0.5 1.0 1.5 2.0 2.5 3.0 3.5arcsec
-1.0
-0.5
0.0
0.5
1.0
1.5
arc
sec
2.0
4.0
6.0
8.0
10.0
12.0
Mean LOS vel. in [OIII] 5007, red comp
-1.0-0.5 0.0 0.5 1.0 1.5 2.0 2.5 3.0 3.5arcsec
-1.0
-0.5
0.0
0.5
1.0
1.5
arc
sec
100.0
120.0
140.0
160.0
180.0
200.0
FWHM of [OIII] 5007, red comp
-1.0-0.5 0.0 0.5 1.0 1.5 2.0 2.5 3.0 3.5arcsec
-1.0
-0.5
0.0
0.5
1.0
1.5
arc
sec
100.0
150.0
200.0
250.0
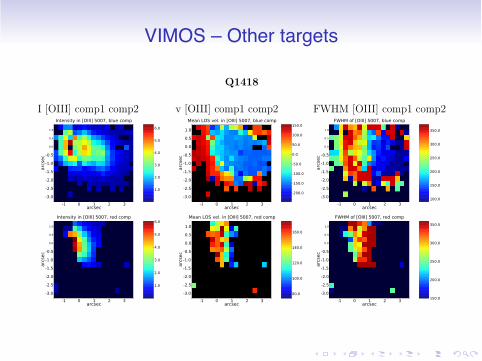
VIMOS – Other targets
Q1418
I [OIII] comp1 comp2 v [OIII] comp1 comp2 FWHM [OIII] comp1 comp2Intensity in [OIII] 5007, blue comp
-1 0 1 2 3arcsec
-3.0
-2.5
-2.0
-1.5
-1.0
-0.5
0.0
0.5
1.0
arc
sec
1.0
2.0
3.0
4.0
5.0
6.0
Mean LOS vel. in [OIII] 5007, blue comp
-1 0 1 2 3arcsec
-3.0
-2.5
-2.0
-1.5
-1.0
-0.5
0.0
0.5
1.0
arc
sec
-200.0
-150.0
-100.0
-50.0
0.0
50.0
100.0
150.0FWHM of [OIII] 5007, blue comp
-1 0 1 2 3arcsec
-3.0
-2.5
-2.0
-1.5
-1.0
-0.5
0.0
0.5
1.0
arc
sec
100.0
150.0
200.0
250.0
300.0
350.0
Intensity in [OIII] 5007, red comp
-1 0 1 2 3arcsec
-3.0
-2.5
-2.0
-1.5
-1.0
-0.5
0.0
0.5
1.0
arc
sec
1.0
2.0
3.0
4.0
5.0
6.0Mean LOS vel. in [OIII] 5007, red comp
-1 0 1 2 3arcsec
-3.0
-2.5
-2.0
-1.5
-1.0
-0.5
0.0
0.5
1.0
arc
sec
80.0
100.0
120.0
140.0
160.0
FWHM of [OIII] 5007, red comp
-1 0 1 2 3arcsec
-3.0
-2.5
-2.0
-1.5
-1.0
-0.5
0.0
0.5
1.0
arc
sec
150.0
200.0
250.0
300.0
350.0

VIMOS – Other targets
Q1616
I [OIII] comp1 comp2 v [OIII] comp1 comp2 FWHM [OIII] comp1 comp2Intensity in [OIII] 5007, blue comp
-1.5 -1.0 -0.5 0.0 0.5 1.0 1.5 2.0 2.5arcsec
-1.5
-1.0
-0.5
0.0
0.5
1.0
1.5
arc
sec
5.0
10.0
15.0
20.0
Mean LOS vel. in [OIII] 5007, blue comp
-1.5 -1.0 -0.5 0.0 0.5 1.0 1.5 2.0 2.5arcsec
-1.5
-1.0
-0.5
0.0
0.5
1.0
1.5
arc
sec
-200.0
-180.0
-160.0
-140.0
-120.0
-100.0
-80.0
-60.0
FWHM of [OIII] 5007, blue comp
-1.5 -1.0 -0.5 0.0 0.5 1.0 1.5 2.0 2.5arcsec
-1.5
-1.0
-0.5
0.0
0.5
1.0
1.5
arc
sec
100.0
150.0
200.0
250.0
Intensity in [OIII] 5007, red comp
-1.5 -1.0 -0.5 0.0 0.5 1.0 1.5 2.0 2.5arcsec
-1.5
-1.0
-0.5
0.0
0.5
1.0
1.5
arc
sec
5.0
10.0
15.0
20.0
25.0
Mean LOS vel. in [OIII] 5007, red comp
-1.5 -1.0 -0.5 0.0 0.5 1.0 1.5 2.0 2.5arcsec
-1.5
-1.0
-0.5
0.0
0.5
1.0
1.5
arc
sec
70.0
80.0
90.0
100.0
110.0
120.0
130.0
140.0
FWHM of [OIII] 5007, red comp
-1.5 -1.0 -0.5 0.0 0.5 1.0 1.5 2.0 2.5arcsec
-1.5
-1.0
-0.5
0.0
0.5
1.0
1.5
arc
sec
100.0
150.0
200.0
250.0
300.0
350.0
400.0

VIMOS – Summary of results
No obvious binary sources in continuum emission! study in more detail[O III] emission 2– 3 kpc, mostly aligned with continuum2 kinematic components overlap in spaceDouble-peaked [O III] 5007, H! in spatially resolvedspectraSigns of rotation (?)[O III] / Hb ratio generally high

Further exploration of VIMOS data
Explore the velocity spacemore kinematic models, more realisticinclude overlapping NLRs from 2 AGNuse all the possible mappings (I, v, FWHM, channel maps,p-v diagrams) to determine best-fitting modelFourier decomposition (kinemetry, Krajnovic et al. 2006)
Combine gas emission data with stellar continuumLook for disturbed morphologies indicating mergersAbsorption lines (e.g. Mg 5170) and the 4000Å jump! derive stellar kinematics, population ages
Search for other emission linese. g. [O III] 4363Å! derive temperature

Kinematic modellingSuperposed components
Surf.br. Mean vLOS LOS vel.disp.
Line 1: Conical outflow in rotating disk
Line 2: Two mis-inclined off-centered rotating disks

[O III]/H" ratios
[OIII] 5007 / H_beta, q1418
0.0 0.5 1.0 1.5 2.0R [arcsec]
0
5
10
15
20
25
30
35
40
[OIII]
50
07
/ H
_beta
indiv. spaxelsindiv. spaxelsFOV-integrated spectrumFOV-integrated spectrumHo et al. (1997)
[OIII] 5007 / H_beta, q1505
0.0 0.5 1.0 1.5 2.0 2.5 3.0 3.5R [arcsec]
0
5
10
15
20
25
30
35
40
[OIII]
50
07
/ H
_beta
indiv. spaxels - recedingindiv. spaxels - approachingFOV-integ. spectrum - system 1FOV-integ. spectrum - system 2Ho et al. (1997)
[OIII] 5007 / H_beta, q1509
0.0 0.5 1.0 1.5 2.0R [arcsec]
0
5
10
15
20
25
30
35
[OIII]
50
07
/ H
_beta
indiv. spaxelsindiv. spaxelsFOV-integrated spectrumFOV-integrated spectrumHo et al. (1997)
[OIII] 5007 / H_beta, q1616
0.0 0.5 1.0 1.5 2.0R [arcsec]
0
5
10
15
20
25
30
35
[OIII]
50
07
/ H
_beta
indiv. spaxelsindiv. spaxelsFOV-integrated spectrumFOV-integrated spectrumHo et al. (1997)