Spatial variation in particle number size distributions in ...
13
Spatial variation in particle number size distributions in a large metropolitan area J. F. Mej´ ıa, L. Morawska, K. Mengersen To cite this version: J. F. Mej´ ıa, L. Morawska, K. Mengersen. Spatial variation in particle number size distributions in a large metropolitan area. Atmospheric Chemistry and Physics, European Geosciences Union, 2008, 8 (5), pp.1127-1138. <hal-00296466> HAL Id: hal-00296466 https://hal.archives-ouvertes.fr/hal-00296466 Submitted on 28 Feb 2008 HAL is a multi-disciplinary open access archive for the deposit and dissemination of sci- entific research documents, whether they are pub- lished or not. The documents may come from teaching and research institutions in France or abroad, or from public or private research centers. L’archive ouverte pluridisciplinaire HAL, est destin´ ee au d´ epˆ ot et ` a la diffusion de documents scientifiques de niveau recherche, publi´ es ou non, ´ emanant des ´ etablissements d’enseignement et de recherche fran¸cais ou ´ etrangers, des laboratoires publics ou priv´ es. brought to you by CORE View metadata, citation and similar papers at core.ac.uk provided by HAL-INSU
Transcript of Spatial variation in particle number size distributions in ...
Spatial variation in particle number size distributions in
a large metropolitan area
J. F. Mejıa, L. Morawska, K. Mengersen
To cite this version:
J. F. Mejıa, L. Morawska, K. Mengersen. Spatial variation in particle number size distributionsin a large metropolitan area. Atmospheric Chemistry and Physics, European GeosciencesUnion, 2008, 8 (5), pp.1127-1138. <hal-00296466>
HAL Id: hal-00296466
https://hal.archives-ouvertes.fr/hal-00296466
Submitted on 28 Feb 2008
HAL is a multi-disciplinary open accessarchive for the deposit and dissemination of sci-entific research documents, whether they are pub-lished or not. The documents may come fromteaching and research institutions in France orabroad, or from public or private research centers.
L’archive ouverte pluridisciplinaire HAL, estdestinee au depot et a la diffusion de documentsscientifiques de niveau recherche, publies ou non,emanant des etablissements d’enseignement et derecherche francais ou etrangers, des laboratoirespublics ou prives.
brought to you by COREView metadata, citation and similar papers at core.ac.uk
provided by HAL-INSU

Atmos. Chem. Phys., 8, 1127–1138, 2008www.atmos-chem-phys.net/8/1127/2008/© Author(s) 2008. This work is distributed underthe Creative Commons Attribution 3.0 License.
AtmosphericChemistry
and Physics
Spatial variation in particle number size distributions in a largemetropolitan area
J. F. Mejıa1, L. Morawska1, and K. Mengersen2
1International Laboratory of Air Quality and Health, Queensland University of Technology, GPO Box 2434, Brisbane, Qld4001, Australia2School of Mathematical Sciences, Queensland University of Technology, GPO Box 2434, Brisbane, QLD, 4001, Australia
Received: 30 August 2007 – Published in Atmos. Chem. Phys. Discuss.: 26 November 2007Revised: 25 January 2008 – Accepted: 28 January 2008 – Published: 28 February 2008
Abstract. Air quality studies have indicated that particlenumber size distribution (NSD) is unevenly spread in urbanair. To date, these studies have focussed on differences inconcentration levels between sampling locations rather thandifferences in the underlying geometries of the distributions.As a result, the existing information on the spatial variationof the NSD in urban areas remains incomplete. To investi-gate this variation in a large metropolitan area in the south-ern hemisphere, NSD data collected at nine different loca-tions during different campaigns of varying duration werecompared using statistical methods. The spectra were anal-ysed in terms of their modal structures (the graphical repre-sentation of the number size distribution function), cumula-tive distribution and number median diameter (NMD). Thestudy found that with the exception of one site all distri-butions were bimodal or suggestive of bimodality. In gen-eral, peak concentrations were below 30 nm and NMDs be-low 50 nm, except at a site dominated by diesel trucks, whereit shifted to around 50 and 60 nm respectively. Ultrafine par-ticles (UFPs (<100 nm)) contributed to 82–90% of the parti-cle number, nanoparticles (<50 nm) to around 60–70%, ex-cept at the diesel traffic site, where their contribution droppedto 50%. Statistical analyses found that the modal structuresheterogeneously distributed throughout Brisbane whereas itwas not always the case for the NMD. The discussion led tothe following site classification: (1) urban sites dominatedby petrol traffic, (2) urban sites affected by the proximity tothe road and (3) an isolated site dominated by diesel traffic.Comparisons of weekday and weekend data indicated that,the distributions were not statistically different. The onlyexception occurred at one site, where there is a significantdrop in the number of diesel buses on the weekend. The dif-
Correspondence to: L. Morawska([email protected])
ferences in sampling period between sites did not affect theresults. The statistics instead suggested variations in trafficcomposition. However, the relative contribution of petrol ve-hicle emissions at each site could not be assessed due to thelimited traffic information available.
1 Introduction
Evidence from medical studies indicates that air pollution isa major contributor to cardiovascular and respiratory healthproblems (e.g. Hong et al., 2002). Until recently, these stud-ies focussed on the particle mass, which is dominated bythe coarse (2.5–10.0µm) and fine (<2.5µm) size fractions.Whilst the toxicological importance of these particles cannotbe dismissed, it has been suggested that the observed effectscould be better explained by the number of the ultrafine frac-tion (<100 nm) rather than the mass of the larger particles(Seaton et al., 1995). In urban air, ultrafine particles (UFPs)dominate the particle number size distribution whereas theircontribution to the particle mass is negligible (Morawska etal., 1998a, b; Jaenicke, 1993). Therefore, particle numberhas become the most widely employed parameter for mea-suring UFP concentration.
Although they are yet to be incorporated into long-term airquality monitoring systems, since the 1990s submicrometre(<1.0µm) and UFP number concentrations have been mea-sured in several cities around the world. Typical urban con-centrations range in the order of 103-105 cm−3 (e.g. Buzoriuset al., 1999) with the UFPs accounting for>80% of the to-tal particle number (Morawska et al., 1998a, b; Shi et al.,2001). There is wide agreement that vehicles are the princi-pal source of UFPs in urban areas. This has been shown bythe strong associations of particle number with vehicle ex-haust gases (Morawska et al., 1998b; Wahlin et al., 2001),
Published by Copernicus Publications on behalf of the European Geosciences Union.

1128 J. F. Mejıa et al.: Spatial variation in particle number size distributions
variations in particle number consistent with daily patternsof traffic (Harrison et al., 1999) and wind direction (see alsoMorawska et al., 2002), and higher number concentrationswhen the wind blows from the road (Hitchins et al., 2000),in areas of higher traffic density (Hussein et al., 2005; Harri-son et al., 1999) and during the week, when traffic levels arehigher (Morawska et al., 2002).
Particle size is determined by the particle generation pro-cess and in turn it influences particle behaviour and otherimportant chemical and physical properties. Therefore, theanalysis of particle size distribution can be useful in the in-terpretation of the properties of the distribution. Differentdescriptors of the particle number size distribution (NSD)have been used to characterize the source signatures of differ-ent types of emissions, for instance petrol (Morawska et al.,1998b) and diesel exhaust (Morawska et al., 1998a; CON-CAWE, 2001; Virtanen et al., 2004) and the NSD spectrafrom different environments (e.g. Morawska et al., 1999b;Flocas et al., 2006).
Urban ambient air quality investigations have found varia-tions in the NSD spectra obtained from different locations inthe same city (e.g. Hussein et al., 2004, 2005; Salma et al.,2002) but these studies have focussed on the differences inconcentration levels rather than the underlying geometries ofthe distributions. Therefore the existing information on thespatial variation of the NSD in urban areas remains incom-plete.
The present investigation aims to analyse the spatial vari-ation of the NSD spectra in a large city in the southernhemisphere, using data collected at nine different locations,and test the hypothesis that the spectra is evenly distributedthroughout the area. The objective was to compare the aver-age spectra using different descriptive size distributions pa-rameters, and to evaluate the relative contribution of UFPsand nanoparticles (<50 nm) to the local airborne particlenumber.
2 Methodology of the investigation
2.1 The city of Brisbane
Brisbane is the capital of the state of Queensland, Australia,and is located in the southeast coast of the state. It has apopulation of about 1.8 million people, making it the thirdlargest city in the country and the first in terms of populationgrowth. The city straddles the Brisbane River, and is locatedin a low-lying floodplain, although the area is dotted by largehills reaching up to 300 m.
Brisbane’s climate is the sub-tropical humid type (Bureauof Meteorology, 1983). The warm season takes place be-tween November and April, and is characterized by high rel-ative humidity, strong winds with average of 11–21 km h−1
and frequent rain. The cool half of the year (May–October)
is dry (0–50% relative humidity) with very low wind speedsthus increasing the persistence time of air pollutants.
The rapid population growth and consequently increasingnumber of vehicles on the road pose a serious challenge to theair quality of the city. In a recent five-year study in the cen-tral business district (CBD) of Brisbane (Mejia et al., 2007),we found that although particle number concentration lev-els compared favourably with other cities around the world,emissions from a nearby freeway resulted in increased totaland ultrafine particle concentrations by 105.3% and 81.5%respectively whereas non-freeway emissions remained un-changed. These conclusions were based on the available dataand their associations with the daily local pattern of wind di-rection.
Hazard-reduction burning, practiced during the cold sea-son in the outer agricultural and forest areas, is anotherimportant contributor to the particle number in the region.On these occasions, the city may be covered in smoke car-ried through the drainage flows. Commercial and industrialsources include a major airport and a seaport, oil refineries,a power station, and a number of manufacturing industries inthe outer suburbs.
2.2 Description of the instrumentation
A TSI model 3394 SMPS was used to measured NSD data inthe range 15–700 nm. Details of the operation and calibrationof the instrument have been provided in previous publica-tions (e.g. Hitchins et al., 2000; Morawska et al., 1998b) andbriefly summarised here. The SMPS consists of a TSI 3071AElectrostatic Classifier (EC), which classifies the particles bytheir ability to transverse an electric field, and a TSI 3010Condensation Particle Counter (CPC), which measures theirconcentration. The SMPS was calibrated before and after themeasurement period for the PSD using standard 100 nm latexspheres. The entire system is automated and is equipped withcustomized software. This software collects and stores sam-ple data, which can then be exported to other applications.
2.3 Location of the monitoring sites and sampling proce-dure
Particle number size distribution and temperature data werecollected at nine different locations in Brisbane. Table 1 sum-marizes the details of these locations and their correspondingdatabases including the area classification, distance to theCBD, number of recorded cases and the percentage of theretained observations. More details are provided below. Un-less otherwise indicated, the measurements were conductedat ground level, at an approximate height of 1.5 and 5–15 mto the road, with the principal road consisting of two lanestravelling in each direction:
1. Queensland University of Technology Air MonitoringResearch Station (QUT AMRS) – A joint venture be-tween QUT and the Environmental Protection Agency.
Atmos. Chem. Phys., 8, 1127–1138, 2008 www.atmos-chem-phys.net/8/1127/2008/
J. F. Mejıa et al.: Spatial variation in particle number size distributions 1129
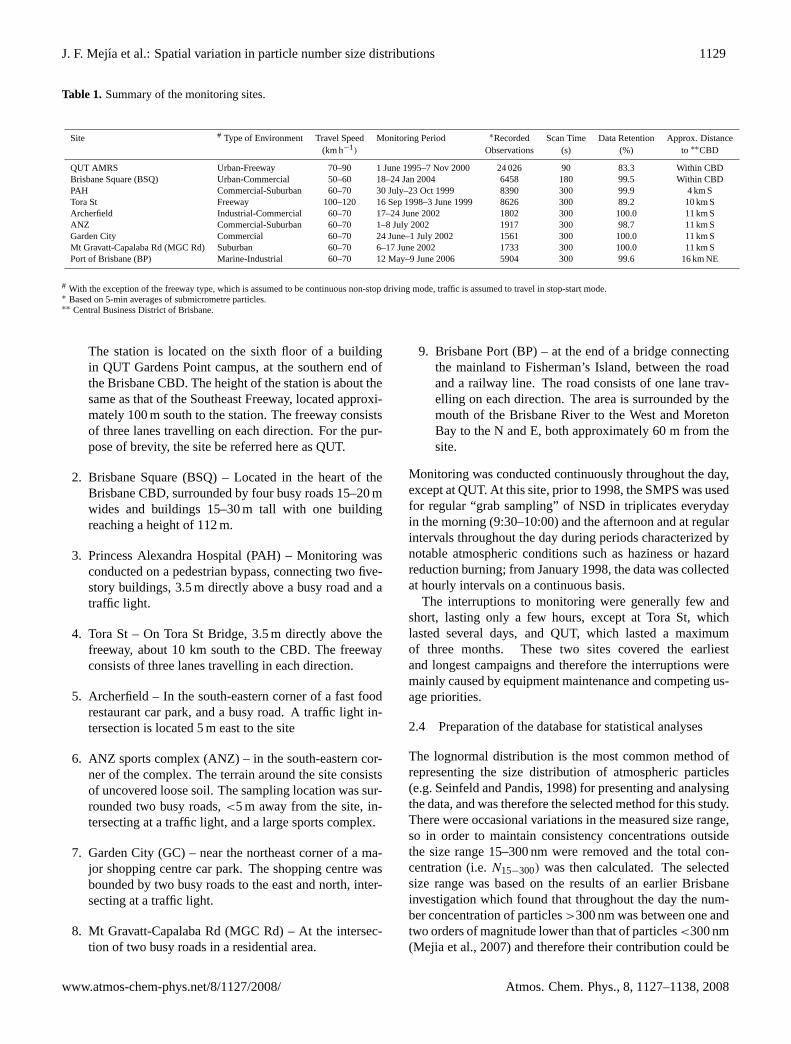
Table 1. Summary of the monitoring sites.
Site # Type of Environment Travel Speed Monitoring Period ∗Recorded Scan Time Data Retention Approx. Distance(km h−1) Observations (s) (%) to∗∗CBD
QUT AMRS Urban-Freeway 70–90 1 June 1995–7 Nov 2000 24 026 90 83.3 Within CBDBrisbane Square (BSQ) Urban-Commercial 50–60 18–24 Jan 2004 6458 180 99.5 Within CBDPAH Commercial-Suburban 60–70 30 July–23 Oct 1999 8390 300 99.9 4 km STora St Freeway 100–120 16 Sep 1998–3 June 1999 8626 300 89.2 10 km SArcherfield Industrial-Commercial 60–70 17–24 June 2002 1802 300 100.0 11 km SANZ Commercial-Suburban 60–70 1–8 July 2002 1917 300 98.7 11 km SGarden City Commercial 60–70 24 June–1 July 2002 1561 300 100.0 11 km SMt Gravatt-Capalaba Rd (MGC Rd) Suburban 60–70 6–17 June 2002 1733 300 100.0 11 km SPort of Brisbane (BP) Marine-Industrial 60–70 12 May–9 June 2006 5904 300 99.6 16 km NE
# With the exception of the freeway type, which is assumed to be continuous non-stop driving mode, traffic is assumed to travel in stop-start mode.∗ Based on 5-min averages of submicrometre particles.∗∗ Central Business District of Brisbane.
The station is located on the sixth floor of a buildingin QUT Gardens Point campus, at the southern end ofthe Brisbane CBD. The height of the station is about thesame as that of the Southeast Freeway, located approxi-mately 100 m south to the station. The freeway consistsof three lanes travelling on each direction. For the pur-pose of brevity, the site be referred here as QUT.
2. Brisbane Square (BSQ) – Located in the heart of theBrisbane CBD, surrounded by four busy roads 15–20 mwides and buildings 15–30 m tall with one buildingreaching a height of 112 m.
3. Princess Alexandra Hospital (PAH) – Monitoring wasconducted on a pedestrian bypass, connecting two five-story buildings, 3.5 m directly above a busy road and atraffic light.
4. Tora St – On Tora St Bridge, 3.5 m directly above thefreeway, about 10 km south to the CBD. The freewayconsists of three lanes travelling in each direction.
5. Archerfield – In the south-eastern corner of a fast foodrestaurant car park, and a busy road. A traffic light in-tersection is located 5 m east to the site
6. ANZ sports complex (ANZ) – in the south-eastern cor-ner of the complex. The terrain around the site consistsof uncovered loose soil. The sampling location was sur-rounded two busy roads,<5 m away from the site, in-tersecting at a traffic light, and a large sports complex.
7. Garden City (GC) – near the northeast corner of a ma-jor shopping centre car park. The shopping centre wasbounded by two busy roads to the east and north, inter-secting at a traffic light.
8. Mt Gravatt-Capalaba Rd (MGC Rd) – At the intersec-tion of two busy roads in a residential area.
9. Brisbane Port (BP) – at the end of a bridge connectingthe mainland to Fisherman’s Island, between the roadand a railway line. The road consists of one lane trav-elling on each direction. The area is surrounded by themouth of the Brisbane River to the West and MoretonBay to the N and E, both approximately 60 m from thesite.
Monitoring was conducted continuously throughout the day,except at QUT. At this site, prior to 1998, the SMPS was usedfor regular “grab sampling” of NSD in triplicates everydayin the morning (9:30–10:00) and the afternoon and at regularintervals throughout the day during periods characterized bynotable atmospheric conditions such as haziness or hazardreduction burning; from January 1998, the data was collectedat hourly intervals on a continuous basis.
The interruptions to monitoring were generally few andshort, lasting only a few hours, except at Tora St, whichlasted several days, and QUT, which lasted a maximumof three months. These two sites covered the earliestand longest campaigns and therefore the interruptions weremainly caused by equipment maintenance and competing us-age priorities.
2.4 Preparation of the database for statistical analyses
The lognormal distribution is the most common method ofrepresenting the size distribution of atmospheric particles(e.g. Seinfeld and Pandis, 1998) for presenting and analysingthe data, and was therefore the selected method for this study.There were occasional variations in the measured size range,so in order to maintain consistency concentrations outsidethe size range 15–300 nm were removed and the total con-centration (i.e.N15−300) was then calculated. The selectedsize range was based on the results of an earlier Brisbaneinvestigation which found that throughout the day the num-ber concentration of particles>300 nm was between one andtwo orders of magnitude lower than that of particles<300 nm(Mejia et al., 2007) and therefore their contribution could be
www.atmos-chem-phys.net/8/1127/2008/ Atmos. Chem. Phys., 8, 1127–1138, 2008

1130 J. F. Mejıa et al.: Spatial variation in particle number size distributions
Kilometres
0 1 3 2 4 5
Fig. 1. Schematic representation (approximate scale:5.4 mm=1 km) of the sampling point locations: (1) QUT, (2)Brisbane Square, (3) Princess Alexandra Hospital, (4) Tora St, (5)Archerfield, (6) ANZ Sports Complex, (7) Garden City, (8) MtGravatt-Capalaba Rd, and (9) Brisbane Port.
considered negligible. The second step was to obtain the rel-ative contribution of each channel to the particle number bydividing its concentration over theN15−300. This was donewith the objective of allowing comparisons of the underlyinggeometry of different NSD spectra, regardless of their actualconcentration levels.
The data were divided into major subsets based on windoriginating from the principal road (within±45◦ of the di-rection perpendicular to the road), wind towards this road,and in some cases, wind from other major physical struc-tures. These subsets were further divided into weekdays andweekends. The aim was to determine whether wind sector orday of the week had an effect on the spectra.
The datasets were subjected to outlier analysis in orderto identify and remove extreme values that may lead to anincorrect interpretation of the data. There are several tech-niques available for outlier identification (e.g. Abu-el-zeet etal., 2002) and their selection depends on the characteristicsof the dataset. In the present investigation, outliers were de-tected using the methodology described in Yu et al. (2004)and briefly summarized here. This is a two-stage graphicaland statistical procedure used in the identification of discor-dant size distributions. The first stage uses the total concen-
tration vs. the corresponding coefficient of variation, bothin the logarithmic scale in order to detect size distributionsisolated from the main cluster of observations. In the sec-ond stage, individual outliers are identified by the General-ized Extreme Studentized Deviate (ESD) Many-Outlier Pro-cedure and the modified z-score (see also Barnett and Lewis,1994, for more details).
After the outliers were identified and eliminated, the nextmove was to select those NSD properties to be analysedas well as appropriate data analysis procedure. The modalstructure (the graphical representation of the shape of thenumber size distribution function) has the advantage of pro-viding a detailed description of the structure of the distri-bution, provided that the diameter size range has been care-fully selected in order to maximise the amount of detail ofthe fraction dominating the particle parameter of interest andthat size intervals are of the same width in the same scale.The particle number is overwhelmingly dominated by parti-cles<300 nm (e.g. Eleftheriadis et al., 2006); therefore, theselected size range was therefore considered appropriate forthis study.
The Kolmogorov-Smirnov (K-S) test was used to comparethe modal distribution obtained from each site. The use andapplicability of this test for comparing particle size distribu-tions containing a large number of sizing channels has beendescribed by Heitinbrink et al. (1990) and the details of theapplication of this technique for measured SMPS data haveprovided by Morawska et al. (1999a) and further expandedhere. The K-S test compares the largest distance betweentwo cumulative distribution functions against a critical value(Dα), which is calculated from the equation:
Where c(α) is the confidence level (α) coefficient, andn1 and n2 are the sizes of the two samples. For a 95%confidence level, the value ofc(α) is 1.36 (Gibbons andChakraborti, 2003). The K-S tests were performed using S-Plus 6.1 (2002, Insightful Corp.).
Two other commonly employed parameters are the num-ber median diameter (NMD), which is also calculated fromthe cumulative distribution function, and the geometric stan-dard deviation (GSD), which measures the width of the dis-tribution. Datasets were compared through one-way ANOVAtests. Homogeneity of variances was analysed using Lev-ene’s test. Pairs of means were then compared using leastsignificant difference (LSD) tests in the case of equal vari-ances and Games-Howell tests in the case of unequal vari-ances.
3 Results
3.1 Modal structure of the NSD
Figure 2 shows the average modal structure of the submi-crometre (referred in this paper, unless otherwise indicatedto particles<300 nm) particle NSD obtained from each site.
Atmos. Chem. Phys., 8, 1127–1138, 2008 www.atmos-chem-phys.net/8/1127/2008/

J. F. Mejıa et al.: Spatial variation in particle number size distributions 1131
Particle Diameter (nm)
10 100 1000
Rela
tive C
oncentr
ation (
% o
f th
e T
ota
l)
0
2
4
6
8QUT
Particle Diameter (nm)
10 100 1000
Rela
tive C
oncentr
ation (
% o
f th
e T
ota
l)
0
2
4
6
8BSQ
Particle Diameter (nm)
10 100 1000
Rela
tive C
oncentr
ation (
% o
f th
e T
ota
l)
0
2
4
6
8PAH
Figure 2
Particle Diameter (nm)
10 100 1000
Rela
tive C
oncentr
ation (
% o
f th
e T
ota
l)
0
2
4
6
8Tora St
Particle Diameter (nm)
10 100 1000
Rela
tive C
oncentr
ation (
% o
f th
e T
ota
l)
0
2
4
6
8Archerfield
Particle Diameter (nm)
10 100 1000
Rela
tive C
oncentr
ation (
% o
f th
e T
ota
l)
0
2
4
6
8ANZ
Figure 2 (Cont’d)
Particle Diameter (nm)
10 100 1000
Rela
tive C
oncentr
ation (
% o
f th
e T
ota
l)
0
2
4
6
8Garden City
Particle Diameter (nm)
10 100 1000
Rela
tive C
oncentr
ation (
% o
f th
e T
ota
l)
0
2
4
6
8MGC Rd
Particle Diameter (nm)
10 100 1000
Rela
tive C
oncentr
ation (
% o
f th
e T
ota
l)
0
2
4
6
8BP
Figure 2 (Cont’d)
Fig. 2. Average particle NSD spectra in the range 15–300 nm of data collected at nine different locations in Brisbane, Australia.
For comparison purposes, the vertical axes have been drawnto the same scale. The figures indicate the percentage ofthe total concentration in the range 15–300 nm. As shownby these results, the NSDs were likely to have at least twopeaks, but partly masked: one occurring below 30 nm, anda second peak or protrusion suggesting its presence, is ob-served at above 50 nm. QUT was the exception by having aclearly unimodal distribution. At BP, the distribution appearsto be bimodal although the second peak, at around 50 nm, hasa higher concentration than the first peak, which occurs ataround 40 nm. At ANZ site, no peak in the lower size rangewas observed, and the data suggests that it was located belowthe lower end of the size range measured in this study; also,the second mode is above 100 nm and its sources are yet tobe determined.
The NSD data was then used to calculate the cumulativeNSD and the resulting spectra are shown in Fig. 3. The ob-jective was to assess the contribution of UFPs and nanopar-ticles (<50 nm) to the particle number and identify the loca-tion of the NMD. The results indicated that UFPs contributedto around 85% of the particle number and nanoparticles toaround 60%; at ANZ and Tora St sites the contribution ofUFPs and nanoparticles were, respectively, 90% and 70%,probably reflecting their close proximity to the road (<5 m).At BP, UFPs although the contribution of ultrafine particlesis consistent with those from the other sites (around 83%),the contribution of nanoparticles drops to 50%, indicatingthe much higher contribution of diesel trucks. With regard toNMD, the plots show that most NMDs fall in the 40 nm re-gion, except at Tora St and ANZ, where it falls around 30 nm,and BP, where it shifts to nearly 50 nm.
www.atmos-chem-phys.net/8/1127/2008/ Atmos. Chem. Phys., 8, 1127–1138, 2008

1132 J. F. Mejıa et al.: Spatial variation in particle number size distributions
Particle Diameter (nm)
10 100 1000
Re
lative
Co
nce
ntr
atio
n (
% o
f T
ota
l)
0
20
40
60
80
100
BSQ
Particle Diameter (nm)
10 100 1000
Re
lative
Co
nce
ntr
atio
n (
% o
f T
ota
l)
0
20
40
60
80
100
PAH
Particle Diameter (nm)
10 100 1000
Rela
tive C
oncentr
ation (
% o
f T
ota
l)
0
20
40
60
80
100
QUT
Figure 3
Particle Diameter (nm)
10 100 1000
Rela
tive C
oncentr
ation (
% o
f T
ota
l)
0
20
40
60
80
100
Tora St
Particle Diameter (nm)
10 100 1000
Rela
tive C
oncentr
ation (
% o
f T
ota
l)
0
20
40
60
80
100
Archerfield
Particle Diameter (nm)
10 100 1000
Rela
tive C
oncentr
ation (
% o
f T
ota
l)
0
20
40
60
80
100
ANZ
Particle Diameter (nm)
10 100 1000
Rela
tive C
oncentr
ation (
% o
f T
ota
l)
0
20
40
60
80
100
Garden City
Particle Diameter (nm)
10 100 1000
Rela
tive C
oncentr
ation (
% o
f T
ota
l)
0
20
40
60
80
100
MGC Rd
Particle Diameter (nm)
10 100 1000
Rela
tive C
oncentr
ation (
% o
f T
ota
l)
0
20
40
60
80
100
BP
Figure 3 (Cont’d)
Fig. 3. Cumulative particle NSD in the range 15–300 nm obtained from the average modal structure obtained at the nine selected sites.
The K-S test compared the distributions between each pairof spectra and the results are shown in Table 3. The testsshowed that the spectra differed significantly between all ofthe sites, thereby indicated that the composition of the emis-sions is not evenly distributed around the area. Despite thesedifferences, there were three major groups of spectra: thefirst group corresponded to the sites with peaks at around30 nm (PAH, Archerfield, Garden City, MGC Rd, QUT andBSQ); the second group was represented by the sites dom-inated by peaks<25 nm (Tora St and ANZ); and the thirdgroup was represented by one site (BP) where particle num-ber peaked at around 50 nm. Although these results hint atdifferences in the vehicle mix, there was no traffic data avail-able and therefore the effect of traffic composition on sizedistribution could not be analysed in more detail.
Comparisons between the data subsets for each site in-dicated that there were no significant differences betweenwind direction sectors or between weekdays and the week-end (p>0.05). Therefore, the extracted spectra above can beconsidered representative of their corresponding sites. Therewere minor exceptions, the most significant being at BSQbetween weekdays and the weekend (p=0.02). The resultantspectra are shown in Fig. 4a and b respectively. During theweek, the distribution is bimodal with peaks at around 30 and60 nm while on the weekend it is unimodal peaking at around35 nm.
3.2 Number median diameter (NMD) and geometric stan-dard deviation (GSD)
ANOVA tests applied to NMD found statistically significantdifferences between sites. Post hoc comparisons indicated
Atmos. Chem. Phys., 8, 1127–1138, 2008 www.atmos-chem-phys.net/8/1127/2008/

J. F. Mejıa et al.: Spatial variation in particle number size distributions 1133
Diameter (nm)
10 100 1000
Re
lative
Co
ntr
ibu
tio
n (
% o
f T
ota
l)
0
1
2
3
4
Diameter (nm)
10 100 1000
Re
lative
Co
nce
ntr
atio
n (
% o
f T
ota
l)
0
1
2
3
4
(a)
(b)
Fig. 4. Observed differences in NSD spectra obtained at BSQ dur-ing (a) weekdays and(b) the weekend.
that with the exception of PAH, Archerfield, Garden Cityand MGC Rd, the mean values differed significantly. Thiswas largely expected due to the large sample sizes. How-ever, the magnitudes of most of the differences were foundto be very small (maximum of 5 nm) and therefore not prac-tically important, so in practice, they could be grouped asfollows: Group 1 was represented by NMD in the 40–50 nmsize region (the four sites above plus BSQ and QUT); Group2 comprised those in the 30 nm region (ANZ and Tora St);and Group 3 belonged to the 60 nm region (BP). The meanvalues for each site are shown in Fig. 5, with the continuouslines used to separate the major groups.
The statistical tests indicated that mean GSD differed verylittle between sites (mean 1.94–2.02, s.d. 0.12–0.17) ex-cept at BP, where it was significantly greater (mean 2.46,s.d. 0.85). In other words, the size distribution showed moreor less the same level of polydispersity, except at BP.
Monitoring Location
PAH
Archerfield
Garden City
MGC Rd
Brisbane S
quareQUT
ANZ
Tora St
Brisbane P
ort
Num
ber
Media
n D
iam
ete
r (n
m)
0
20
40
60
80 Group 1 Group2 Group 3
Figure 5 Fig. 5. Average NMD per site. The error bars represent the corre-sponding standard errors. The continuous lines are used to groupthe sites into three major categories.
3.3 Effect of differences in time period
The NSD measurements were conducted during differentcampaigns, each having different duration, as indicated inTable 1. The results proved that despite the differences intime period the ranges of obtained values for the location ofthe peaks and NMD fell respectively, around 30 and 40 nm,with the exception of BP site where the corresponding valueswere around 50 and 60 nm. Similarly the ranges for the con-tribution of ultrafine particles and nanoparticles to the totalconcentration were very narrow (around 10% between theircorresponding minima and maxima). The only exceptionwas BP site but this cannot be explained by seasonal dif-ferences, particularly of temperature, as the averages rangebetween 14.0◦C and 26.4◦C (Table 2). As Table 2 shows,although there are obvious differences in particle concentra-tion levels (ranging from 7.2 to 45.6×103 cm−3), the rangeof temperatures is very narrow, with average values rangingbetween 14.0◦C and 26.5◦C. Therefore, it is very clear thatthe sampling periods had no effect on the distributions andparticle concentration levels.
4 Discussion
The size distribution of submicrometre particle data, col-lected at nine different sites in urban atmosphere of Brisbane,in the range 15–300 nm using the lognormal scale, were anal-ysed in terms of their modal structure and NMD, covering atotal period of 11 years. Larger particles were excluded fromthe study as we found in a previous investigation that theirconcentrations were between one and two orders of magni-tude lower than the above range (Mejia et al., 2007), and
www.atmos-chem-phys.net/8/1127/2008/ Atmos. Chem. Phys., 8, 1127–1138, 2008

1134 J. F. Mejıa et al.: Spatial variation in particle number size distributions
Table 2. Recorded temperatures and particle concentration levels at each site.
SiteTemperature (◦C) Conc. (×103 Particles cm−3)
Min. Max. Ave. Min. Max. Average
QUT AMRS 0.0 40.0 21.0 0.1 215.1 7.2Brisbane Square (BSQ) 8.0 35.5 26.4 0.7 120.3 11.3PAH 5.9 27.7 16.5 0.5 104.0 15.5Tora St 9.3 35.2 21.9 0.1 314.0 25.5Archerfield 0.4 24.9 14.9 0.5 83.0 17.5ANZ 5.7 25.2 14.3 3.6 242.1 45.6Garden City 6.7 23.7 14.0 1.7 111.5 15.0Mt Gravatt-Capalaba Rd (MGC Rd) 6.9 30.7 16.6 0.8 45.7 5.7Port of Brisbane (BP) 9.0 25.1 17.2 0.2 238.6 13.2
therefore, we did not expect that they would significantly af-fect the size distribution.
4.1 Modal structures
As can be seen in Fig. 2, the modal structures and corre-sponding concentration levels were very similar to those re-ported from traffic and urban emissions (Morawska et al.,1999b). Particle number peaked at below 30 nm and a sec-ond peak was observed, or at least suggested by the results,in the range 50–100 nm, except at QUT, where the distribu-tion was clearly unimodal. The results are consistent withthe modal structures observed in petrol and diesel exhaust,whose respective NSDs are dominated by the ranges 20–60and 20–120 nm (Maricq et al., 1999; Gouriou et al., 2004;Morawska et al., 1998a).
The first peak (<30 nm) predominates and is indicative ofthe predominance of petrol emissions in Brisbane, corrob-orating earlier findings (Holmes et al., 2005; Morawska etal., 1998b, 1999b), and also hint at the presence of dieseltraffic (Morawska et al., 1998a). These particles belong toa size category known as nanoparticles (<50 nm), whichare formed by primary carbonaceous emissions from petrol,and the supersaturation of semivolatile precursors due to therapid cooling of both petrol and diesel traffic exhaust gas re-sulting in homogeneous nucleation (Bukowiecki et al., 2002;Imhof et al., 2005b; Kittelson et al., 2002). This has beenshown to be a process that instantly (1–3 s) yields a highnumber of nanoparticles (Kittelson et al., 2000).
The second peak, in the range 50–100 nm, as already dis-cussed, is indicative of diesel fuel. These particles consistpredominantly of soot aggregates from incomplete combus-tion processes (Imhof et al., 2005a). Research from benchtests suggests that nanoparticles dominate the low engineload whereas the peak above 50 nm corresponds to high loads(Sturm et al., 2003). With the exception of QUT and Tora St,sampling took place close to traffic lights. During each scan,the lights changed, on average, ten times. As a result, engineloads varied regularly, being highest during acceleration.
The distributions at ANZ and Tora St are clearly domi-nated by the smaller particles, peaking at<25 nm. No peakwas observed at ANZ site, and the data indicates that thepeak is located below 15 nm. Modal diameters below thislimit have been observed in urban air (e.g. Shi et al., 2001).Particle NSD has been observed to change with distance tothe road, shifting to a larger diameter the further away down-wind (Pirjola et al., 2006; Zhu et al., 2002b). Research hasfound that the concentration of particles<50 nm decreasemore rapidly than that of particles>100 nm and concludedthat coagulation is more important than atmospheric dilutionfor UFPs whereas the reverse is true for larger particles (Zhuet al., 2002b). Other investigations, on the other hand, havefound that dilution is as important as coagulation in chang-ing the concentration of UFPs with increasing distance to theroad (e.g. Zhu et al., 2002a). Tora St and ANZ were veryclose to the road (<5 m) and therefore it is reasonable to con-clude that the distributions observed at these two sites reflecttheir close proximity to traffic.
Of the other sites, only PAH was as close to the road. Atthis site, however, smaller particles are less dominant thanat Tora St and ANZ. There is a greater flow of diesel vehi-cles around PAH, which partially explains the results. Therewere similarities but also differences in sampling conditionsbetween PAH and the two sites above. As in Tora St, sam-pling took place directly above the road. The main differ-ence was the traffic flow pattern, travelling continuously at100–110 km h−1 at Tora St whereas at PAH sampling tookplace directly above a traffic light. Gouriou et al. (2004) andImhoff et al. (2005a) observed that, for diesel fuel, particles>50 nm prevailed in stop-start traffic conditions. This can beexplained by the higher engine loads associated with start-acceleration conditions near these lights, resulting in highemission rates of soot particles. At ANZ, sampling tookplace near a traffic light but unlike PAH it was at groundlevel. Research on the horizontal and vertical distributionof particles around buildings (Morawska et al., 1999a), how-ever, found no association between height and total particle
Atmos. Chem. Phys., 8, 1127–1138, 2008 www.atmos-chem-phys.net/8/1127/2008/
J. F. Mejıa et al.: Spatial variation in particle number size distributions 1135
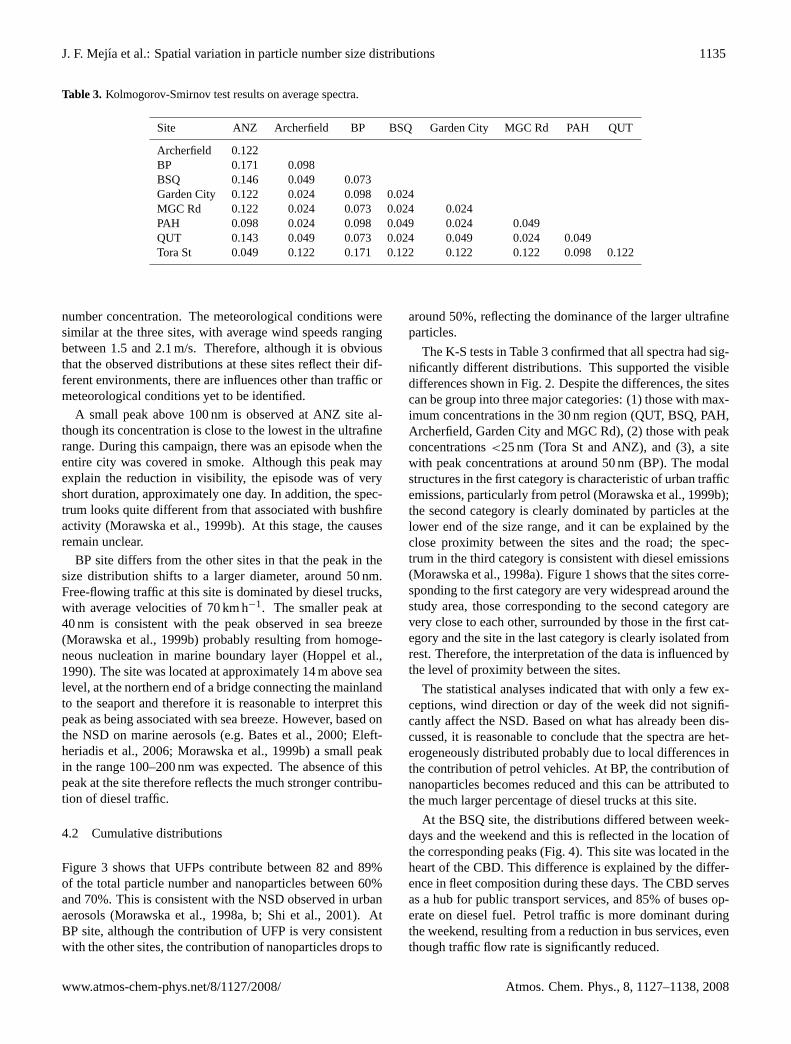
Table 3. Kolmogorov-Smirnov test results on average spectra.
Site ANZ Archerfield BP BSQ Garden City MGC Rd PAH QUT
Archerfield 0.122BP 0.171 0.098BSQ 0.146 0.049 0.073Garden City 0.122 0.024 0.098 0.024MGC Rd 0.122 0.024 0.073 0.024 0.024PAH 0.098 0.024 0.098 0.049 0.024 0.049QUT 0.143 0.049 0.073 0.024 0.049 0.024 0.049Tora St 0.049 0.122 0.171 0.122 0.122 0.122 0.098 0.122
number concentration. The meteorological conditions weresimilar at the three sites, with average wind speeds rangingbetween 1.5 and 2.1 m/s. Therefore, although it is obviousthat the observed distributions at these sites reflect their dif-ferent environments, there are influences other than traffic ormeteorological conditions yet to be identified.
A small peak above 100 nm is observed at ANZ site al-though its concentration is close to the lowest in the ultrafinerange. During this campaign, there was an episode when theentire city was covered in smoke. Although this peak mayexplain the reduction in visibility, the episode was of veryshort duration, approximately one day. In addition, the spec-trum looks quite different from that associated with bushfireactivity (Morawska et al., 1999b). At this stage, the causesremain unclear.
BP site differs from the other sites in that the peak in thesize distribution shifts to a larger diameter, around 50 nm.Free-flowing traffic at this site is dominated by diesel trucks,with average velocities of 70 km h−1. The smaller peak at40 nm is consistent with the peak observed in sea breeze(Morawska et al., 1999b) probably resulting from homoge-neous nucleation in marine boundary layer (Hoppel et al.,1990). The site was located at approximately 14 m above sealevel, at the northern end of a bridge connecting the mainlandto the seaport and therefore it is reasonable to interpret thispeak as being associated with sea breeze. However, based onthe NSD on marine aerosols (e.g. Bates et al., 2000; Eleft-heriadis et al., 2006; Morawska et al., 1999b) a small peakin the range 100–200 nm was expected. The absence of thispeak at the site therefore reflects the much stronger contribu-tion of diesel traffic.
4.2 Cumulative distributions
Figure 3 shows that UFPs contribute between 82 and 89%of the total particle number and nanoparticles between 60%and 70%. This is consistent with the NSD observed in urbanaerosols (Morawska et al., 1998a, b; Shi et al., 2001). AtBP site, although the contribution of UFP is very consistentwith the other sites, the contribution of nanoparticles drops to
around 50%, reflecting the dominance of the larger ultrafineparticles.
The K-S tests in Table 3 confirmed that all spectra had sig-nificantly different distributions. This supported the visibledifferences shown in Fig. 2. Despite the differences, the sitescan be group into three major categories: (1) those with max-imum concentrations in the 30 nm region (QUT, BSQ, PAH,Archerfield, Garden City and MGC Rd), (2) those with peakconcentrations<25 nm (Tora St and ANZ), and (3), a sitewith peak concentrations at around 50 nm (BP). The modalstructures in the first category is characteristic of urban trafficemissions, particularly from petrol (Morawska et al., 1999b);the second category is clearly dominated by particles at thelower end of the size range, and it can be explained by theclose proximity between the sites and the road; the spec-trum in the third category is consistent with diesel emissions(Morawska et al., 1998a). Figure 1 shows that the sites corre-sponding to the first category are very widespread around thestudy area, those corresponding to the second category arevery close to each other, surrounded by those in the first cat-egory and the site in the last category is clearly isolated fromrest. Therefore, the interpretation of the data is influenced bythe level of proximity between the sites.
The statistical analyses indicated that with only a few ex-ceptions, wind direction or day of the week did not signifi-cantly affect the NSD. Based on what has already been dis-cussed, it is reasonable to conclude that the spectra are het-erogeneously distributed probably due to local differences inthe contribution of petrol vehicles. At BP, the contribution ofnanoparticles becomes reduced and this can be attributed tothe much larger percentage of diesel trucks at this site.
At the BSQ site, the distributions differed between week-days and the weekend and this is reflected in the location ofthe corresponding peaks (Fig. 4). This site was located in theheart of the CBD. This difference is explained by the differ-ence in fleet composition during these days. The CBD servesas a hub for public transport services, and 85% of buses op-erate on diesel fuel. Petrol traffic is more dominant duringthe weekend, resulting from a reduction in bus services, eventhough traffic flow rate is significantly reduced.
www.atmos-chem-phys.net/8/1127/2008/ Atmos. Chem. Phys., 8, 1127–1138, 2008

1136 J. F. Mejıa et al.: Spatial variation in particle number size distributions
4.3 Number median diameters
In addition to the modal structure, the size distributions wereanalysed in terms of their NMDs (Fig. 5). Unlike the modalstructures, some sites were found to have similar NMD val-ues. Based on the statistical results and the average values,the sites were grouped into three major groups, and thesegroups were consistent with those obtained for the modalstructures.
Although some variations between sites were found withinthe groups, the magnitude of these differences was very smalland not practically important. For instance, the NMDs con-sistently fall around or below the 40 nm region, which is asource signature of petrol traffic (Morawska et al., 1998b,1999b). The only exception were BP site, where the averageNMD is 59 nm, reflecting the predominance of diesel trucks(Morawska et al., 1998a).
To deepen the analysis, the GSD were also compared andthere was little variability among the sites, with average val-ues falling around 1.96, although it was visibly higher at BP(2.46). In order to shed more light into the shape of the dis-tributions, the correlation between NMD and GSD was anal-ysed and although it was significant at the 99% confidencelevel (p<0.01), it was rather weak (r=−0.14). Therefore,the effect of NMD on the width of the distribution may notbe important in practice.
4.4 Effect of seasonality
The interpretation of the results suggests that, with the ex-ception of BP site, the distributions were unaffected by thedifferences in sampling period. A time series investigation(Mejia et al., 2007) found that, unlike in temperate latitudes,particle size distribution in Brisbane is unaffected by seasonof the year. This conclusion was based on seasonal analysisresults on particle number and NMD, which showed no an-nual periodic behaviour. The lack of seasonality in Brisbanecan be explained by the very small variations in meteorolog-ical conditions, for example air temperature, which in thisstudy had a range of 10oC between the minimum and maxi-mum averages (Table 2). There were obvious differences inparticle number (Table 2), but these can be interpreted as re-sulting from varying distance to the road, traffic levels andcomposition rather than caused by seasonal differences.
4.5 Summary and conclusions
To summarise the findings from this study, the data werecollected during different campaigns of varying durationsspanning an 11-year period. The results indicated that therewere statistically significant differences in the modal struc-tures and therefore they showed that particle number size washeterogeneously distributed in Brisbane. UFPs and nanopar-ticles contributed, respectively, to around 82–89% and 60–70% of the particle number. Although the contribution of
UFPs at the BP site, was similar to the other sites, the contri-bution of nanoparticles decreased to 50%, reflecting its dif-ferent environment. Particle number peaked at around or be-low 30 nm and NMD in the 40 nm region. Although somedifferences were also found for the NMD, there were foursites that had similar NMD values. Where statistically sig-nificant differences were found, in most cases, their magni-tudes were very small and therefore not important in practice.Although the locations of the peaks varied between sites, inmost cases half of the particle number was within approxi-mately the same size range. Based on these results, the siteswere divided into three major groups: (1) urban sites domi-nated by petrol traffic emissions, (2) sites dominated by thesmaller particles probably caused by the proximity betweenthe measurement points and the road, and (3) a site clearlydominated by diesel traffic. The average NSDs were clearlyunaffected by differences in sampling periods. The locationsof the peaks and NMD values consistently indicate that petrolvehicles are the dominant source, and therefore the resultsfrom the statistical tests hint at differences in traffic com-position, as expected. At this stage, however, no associationbetween traffic composition and size distribution could be es-tablished due to the limited traffic information available forthis study. Future investigations should benefit by includingtraffic composition data.
Acknowledgements. The authors wish to express their appreciationto R. Jayaratne, G. Johnson and N. Holmes, from the InternationalLaboratory of Air Quality and Health (ILAQH) and M. Jamriska(formerly from ILAQH and currently from the Australian DefenceAcademy), for supplying their data for the purposes of this project.Funding from the Australian Research Council is also gratefullyacknowledged.
Edited by: V.-M. Kerminen
References
Abu-el-zeet, Z. H., Becerra, V. M., and Roberts, P. D.: Combinedbias and outlier identification in dynamic data reconciliation,Comput. Chem. Eng., 26, 921–935, 2002.
Barnett, V. and Lewis, T.: Outliers in statistical data, Chichester,Wiley, 1994.
Bates, T. S., Quinn, P. K., Covert, D. S., Coffman, D. J., John-son, J. E., and Wiedensohler, A.: Aerosol physical propertiesand processes in the lower marine boundary layer: a comparisonof shipboard sub micron data from ACE 1 and ACE 2, Tellus B,52, 258–272, 2000.
Bukowiecki, N., Dommen, J., Prevot, A. S. H., Richter, R., Wein-gartner, E., and Baltensperger, U.: A mobile pollutant measure-ment laboratory–measuring gas phase and aerosol ambient con-centrations with high spatial and temporal resolution, Atmos. En-viron., 36, 5569–5579, 2002.
Bureau of Meteorology: The Climate of Brisbane, Canberra, 1983.Buzorius, G., Hameri, K., Pekkanen, J., and Kulmala, M.: Spatial
variation of aerosol number concentration in Helsinki city, At-mos. Environ., 33, 553–565, 1999.
Atmos. Chem. Phys., 8, 1127–1138, 2008 www.atmos-chem-phys.net/8/1127/2008/

J. F. Mejıa et al.: Spatial variation in particle number size distributions 1137
CONCAWE: Measurement of the Number and Mass Weighted SizeDistributions of Exhaust Particles Emitted from European HeavyDuty Engines (Report No. 01/51), Brussels, CONCAWE, ReportNo. 01/51, 2001.
Eleftheriadis, K., Colbeck, I., Housiadas, C., Lazaridis, M., Mi-halopoulos, N., Mitsakou, C., Smolik, J., and Zdimal, V.: Sizedistribution, composition and origin of the submicron aerosolin the marine boundary layer during the eastern Mediterranean“SUB-AERO” experiment, Atmos. Environ., 40, 6245–6260,2006.
Flocas, H. A., Assimakopoulos, V. D., and Helmis, C. G.: An exper-imental study of aerosol distribution over a Mediterranean urbanarea, Sci. Total Environ., 367, 872–887, 2006.
Gibbons, J. D. and Chakraborti, S.: Nonparametric Statistical Infer-ence, New York, Marcel Dekker Inc., p. 583, 2003.
Gouriou, F., Morin, J.-P., and Weill, M.-E.: On-road measurementsof particle number concentrations and size distributions in ur-ban and tunnel environments, Atmos. Environ., 38, 2831–2840,2004.
Harrison, R. M., Jones, M., and Collins, G.: Measurements of thephysical properties of particles in the urban atmosphere, Atmos.Environ., 33, 309–321, 1999.
Heitinbrink, W. A., Baron, P., and Willeke, K.: Coincidence intime-of-flight aerosol spectrometres: phantom particle creation.Aerosol Sci. Tech., 14, 112–126, 1990.
Hitchins, J., Morawska, L., Wolff, R., and Gilbert, D.: Concentra-tions of submicrometre particles from vehicle emissions near amajor road, Atmos. Environ., 34, 51–59, 2000.
Holmes, N. S., Morawska, L., Mengersen, K., and Jayaratne, E.R.: Spatial distribution of submicrometre particles and CO in anurban microscale environment, Atmos. Environ., 39, 3977–3988,2005.
Hong, Y. C., Lee, J. T., Kim, H., Ha, E. H., Schwartz, J., and Chris-tiani, D. C.: Effects of air pollutants on acute stroke mortality,Environ. Health Persp., 110, 187–191, 2002.
Hoppel, W. A., Larson, R., and Vietti, M. A.: Aerosol size distribu-tions and optical boundaries found in the marine boundary layerover the Atlantic Ocean, J. Geophys. Res., 95, 3659–3686, 1990.
Hussein, T., Hameri, K., Aalto, P. P., Paatero, P., and Kulmala,M.: Modal structure and spatial-temporal variations of urbanand suburban aerosols in Helsinki–Finland, Atmos. Environ., 39,1655–1668, 2005.
Hussein, T., Puustinen, A., Aalto, P., Makela, T., Hameri, K., andKulmala, M.: Urban aerosol number size distributions, Atmos.Chem. Phys., 4, 391–411, 2004,http://www.atmos-chem-phys.net/4/391/2004/.
Imhof, D., Weingartner, E., Ordonez, C., Gehrig, R., Hill, M., Buch-mann, B., and Baltensperger, U.: Real-World Emission Factorsof Fine and Ultrafine Aerosol Particles for Different Traffic Sit-uations in Switzerland, Environ. Sci. Technol., 39, 8341–8350,2005a.
Imhof, D., Weingartner, E., Vogt, U., Dreiseidler, A., Rosenbohm,E., Scheer, V., Vogt, R., Nielsen, O. J., Kurtenbach, R., andCorsmeier, U.: Vertical distribution of aerosol particles and NOxclose to a motorway, Atmos. Environ., 39, 5710–5721, 2005b.
Jaenicke, R.:, Tropospheric aerosols, in: Aerosol-Cloud-ClimateInteractions, edited by: Hobbs, P. V., London, Academic Press,1993.
Kittelson, D., Watts, W., and Johnson, J.: Diesel Aerosol Sampling
Methodology – CRC E-43, Final report, Coordinating ResearchCouncil, 2002.
Kittelson, D. B., Johnson, J., Watts, W., Wei, Q., Drayton, M.,Paulsen, D., and Bukowiecki, N.: Diesel sampling in the atmo-sphere, 2000.
Maricq, M. M., Podsiadlik, D. H., and Chase, R. E.: Examinationof the Size-Resolved and Transient Nature of Motor Vehicle Par-ticle Emissions, Environ. Sci. Technol., 33, 1618–1626, 1999.
Mejia, J. F., Wraith, D., Mengersen, K., and Morawska, L.: Trendsin size classified particle number concentration in subtropicalBrisbane, Australia, based on a 5 year study, Atmos. Environ.,41, 1064–1079, 2007.
Morawska, L., Bofinger, N., Kocis, L., and Nwankwoala, A.: Sub-micrometer and supermicrometer particles from diesel vehicleemissions. Environ. Sci. Technol., 32, 2033–2042, 1998a.
Morawska, L., Jayaratne, E. R., Mengersen, K., Jamriska, M., andThomas, S.: Differences in airborne particle and gaseous concen-trations in urban air between weekdays and weekends. Atmos.Environ., 36, 4375–4383, 2002.
Morawska, L., Thomas, S., Bofinger, N., Wainwright, D., andNeale, D.: Comprehensive characterization of aerosols in a sub-tropical urban atmosphere: particle size distribution and correla-tion with gaseous pollutants, Atmos. Environ., 32, 2467–2478,1998b.
Morawska, L., Thomas, S., Gilbert, D., Greenaway, C., and Rijn-ders, E.: A study of the horizontal and vertical profile of sub-micrometer particles in relation to a busy road, Atmos. Environ.,33, 1261–1274, 1999a.
Morawska, L., Thomas, S., Jamriska, M., and Johnson, G.: Themodality of particle size distributions of environmental aerosols,Atmos. Environ., 33, 4401–4411, 1999b.
Pirjola, L., Paasonen, P., Pfeiffer, D., Hussein, T., Hameri, K.,Koskentalo, T., Virtanen, A., Ronkko, T., Kesniken, J., Pakka-nen, T. A., and Hillamo, R.: Dispersion of particles and tracegases nearby a city highway: mobile laboratory measurements inFinland, Atmos. Environ., 40, 867–879, 2006.
Salma, I., Dal Maso, M., Kulmala, M., and Zaray, G.: Modal char-acteristics of particulate matter in urban atmospheric aerosols,Microchem. J., 73, 19–26, 2002.
Seaton, A., Godden, D., MacNee, W., and Donaldson, K.: Particu-late air pollution and acute health effects, The Lancet, 345, 176–178, 1995.
Seinfeld, J. H. Pandis, S. N.: Atmospheric Chemistry and Physics,New York, John Wiley & Sons, Inc., p. 545, 1998.
Shi, J. P., Evans, D. E., Khan, A. A., and Harrison, R. M.: Sourcesand concentration of nanoparticles (<10 nm diameter) in the ur-ban atmosphere, Atmos. Environ., 35, 1193–1202, 2001.
Sturm, P. J., Hausberger, S., Engler, D., Bacher, M., Lechner,B., and Rodler, J.: PM size distribution measurements in en-gine exhaust in context to road tunnel and ambient air measure-ments, Fifth international technion symposium, Vienna, Austria,http://www.technion.org/Pages/pdf/AP3.pdf, 2003.
Virtanen, A. K. K., Ristimaki, J. M., Vaaraslahti, K. M., and Keski-nen, J.: Effect of Engine Load on Diesel Soot Particles, Environ.Sci. Technol., 38, 2551–2556, 2004.
Wahlin, P., Palmgren, F., and Van Dingenen, R.: Experimental stud-ies of ultrafine particles in streets and the relationship to traffic,Atmos. Environ., 35, 63–69, 2001.
Yu, T. C., Teh, H. W., Jacques, P. A., Sioutas, C., and Froines, J.
www.atmos-chem-phys.net/8/1127/2008/ Atmos. Chem. Phys., 8, 1127–1138, 2008
1138 J. F. Mejıa et al.: Spatial variation in particle number size distributions
R.: Quality control of semi-continuous mobility size-fractionatedparticle number concentration data, Atmos. Environ., 38, 3341–3348, 2004.
Zhu, Y., Hinds, W. C., Kim, S., Shen, S., and Sioutas, C.: Study ofultrafine particles near a major highway with heavy-duty dieseltraffic, Atmos. Environ., 36, 4323–4335, 2002a.
Zhu, Y., Hinds, W. C., Kim, S., and Sioutas, C.: Concentration andsize distribution of ultrafine particles near a major highway, J.Air Waste Ma. Assoc., 52, 1032–1042, 2002b.
Atmos. Chem. Phys., 8, 1127–1138, 2008 www.atmos-chem-phys.net/8/1127/2008/