Spatial Simulation for Education Policy Analysis in Ireland An Initial Exploration Gillian Golden...
22
Spatial Simulation for Education Policy Analysis in Ireland An Initial Exploration Gillian Golden University College Dublin [email protected]
-
Upload
aubrie-higgins -
Category
Documents
-
view
226 -
download
0
Transcript of Spatial Simulation for Education Policy Analysis in Ireland An Initial Exploration Gillian Golden...
Spatial Simulation for Education Policy Analysis in Ireland An Initial Exploration
Gillian GoldenUniversity College Dublin
Overview
Individual level modelling for policy analysis in the education sector – proof of concept exercise
Exploiting statistical value of available administrative data and “Joined up data” – NSB Position Papers December 2011
Spatial component - important for planning and efficient resource provision.
Microsimulation
Representing a system in terms of it’s individual units.
Often generated synthetically using fitting techniques-Census small areas and PUMS
Model effect of a policy change on individuals and aggregate the results
Can provide a more insightful picture of a complex social system
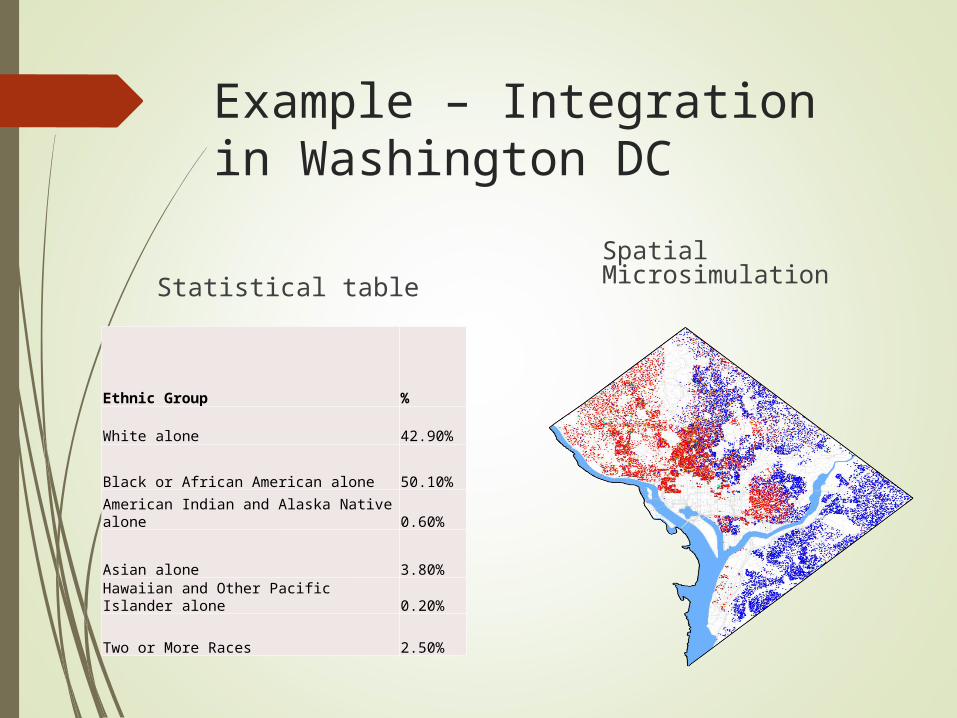
Example – Integration in Washington DC
Statistical table
Ethnic Group %
White alone 42.90%
Black or African American alone 50.10%
American Indian and Alaska Native alone 0.60%
Asian alone 3.80%Hawaiian and Other Pacific Islander alone 0.20%
Two or More Races 2.50%
Spatial Microsimulation
Irish Education System
Overall budget of €9 billion annually.
Primary sector – approximately 3200 schools with 520,000 pupils
Traditional macro analysis – Value for Money reviews, 2009 Special Group on Public Service Expenditure
Can spatial microsimulation add value?
Data Sources
Irish Census of Population 2011 POWSCAR file
Department of Education and Skills school XY coordinates
Other school level data combined from databases held in the Department
County Mayo chosen as test geographic area
Methodology
POWSCAR fuzzy northing and easting
Primary school XY data Spatial Join Operation Result - Individual level
data with contextual info on pupil’s home and school
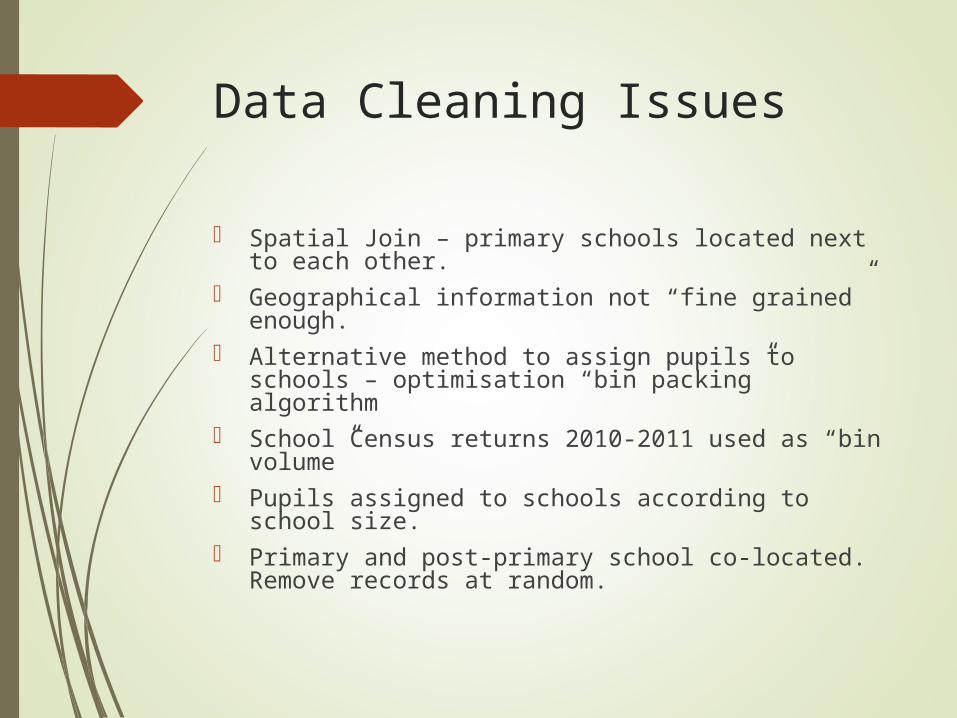
Data Cleaning Issues
Spatial Join – primary schools located next to each other.
Geographical information not “fine grained” enough. Alternative method to assign pupils to schools –
optimisation “bin packing” algorithm School Census returns 2010-2011 used as “bin
volume” Pupils assigned to schools according to school size. Primary and post-primary school co-located.
Remove records at random.
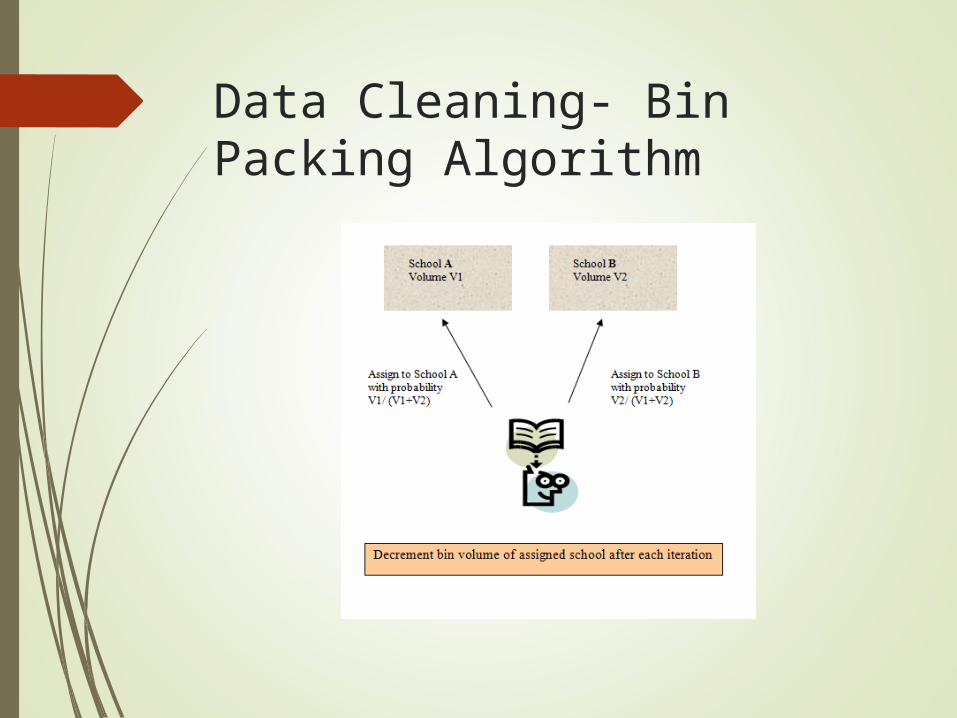
Data Cleaning- Bin Packing Algorithm
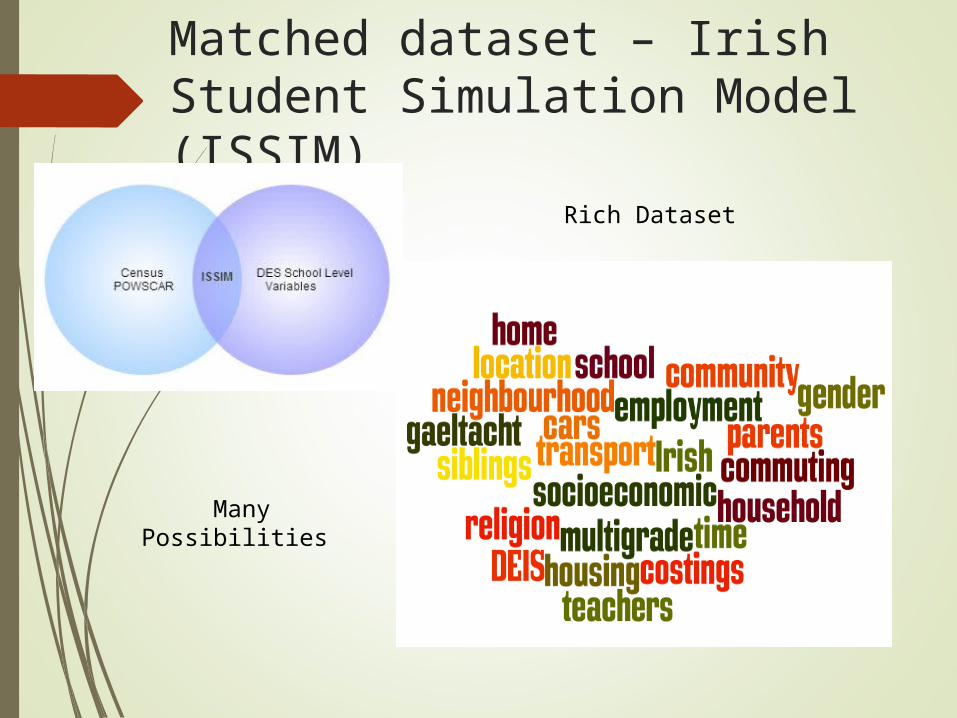
Matched dataset – Irish Student Simulation Model (ISSIM)
Many Possibilities
Rich Dataset
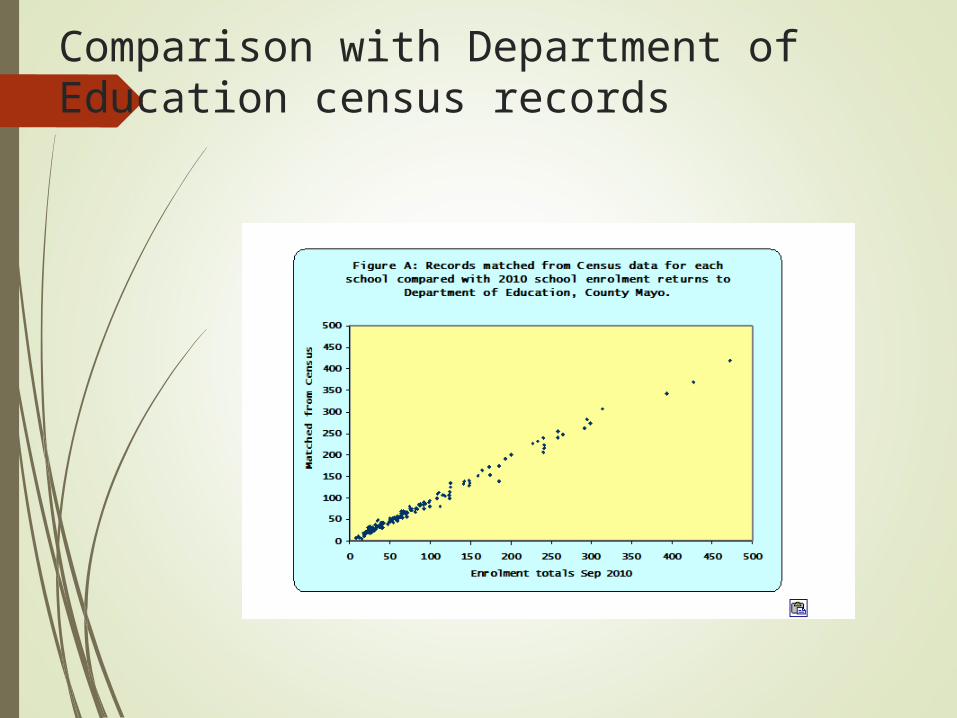
Comparison with Department of Education census records
Simulating school Amalgamations
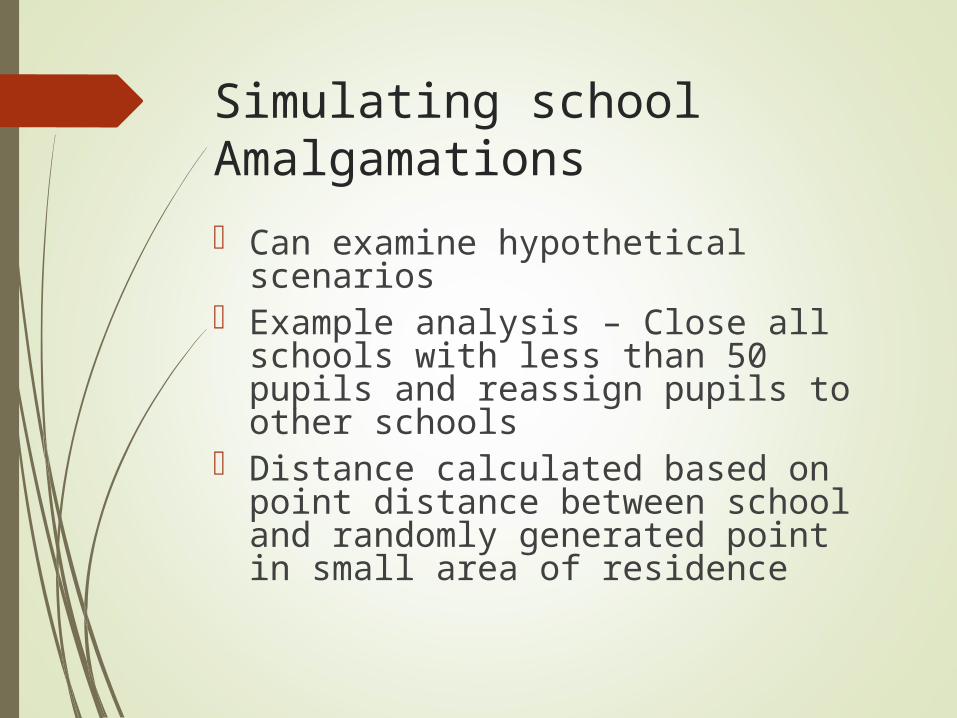
Can examine hypothetical scenarios Example analysis – Close all schools
with less than 50 pupils and reassign pupils to other schools
Distance calculated based on point distance between school and randomly generated point in small area of residence
School Amalgamations
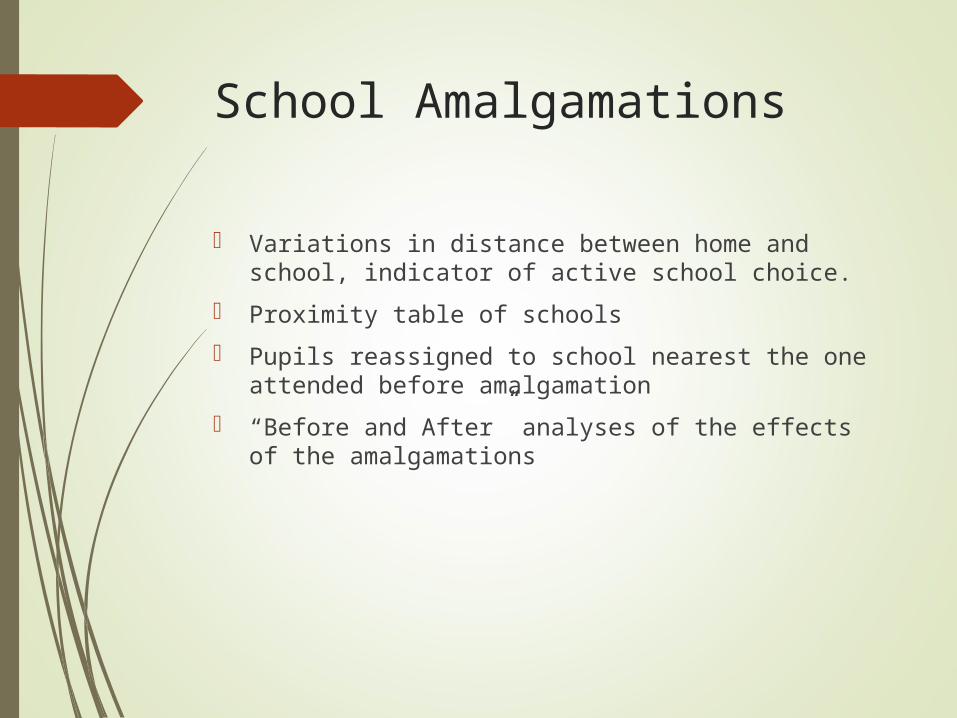
Variations in distance between home and school, indicator of active school choice.
Proximity table of schools
Pupils reassigned to school nearest the one attended before amalgamation
“Before and After” analyses of the effects of the amalgamations
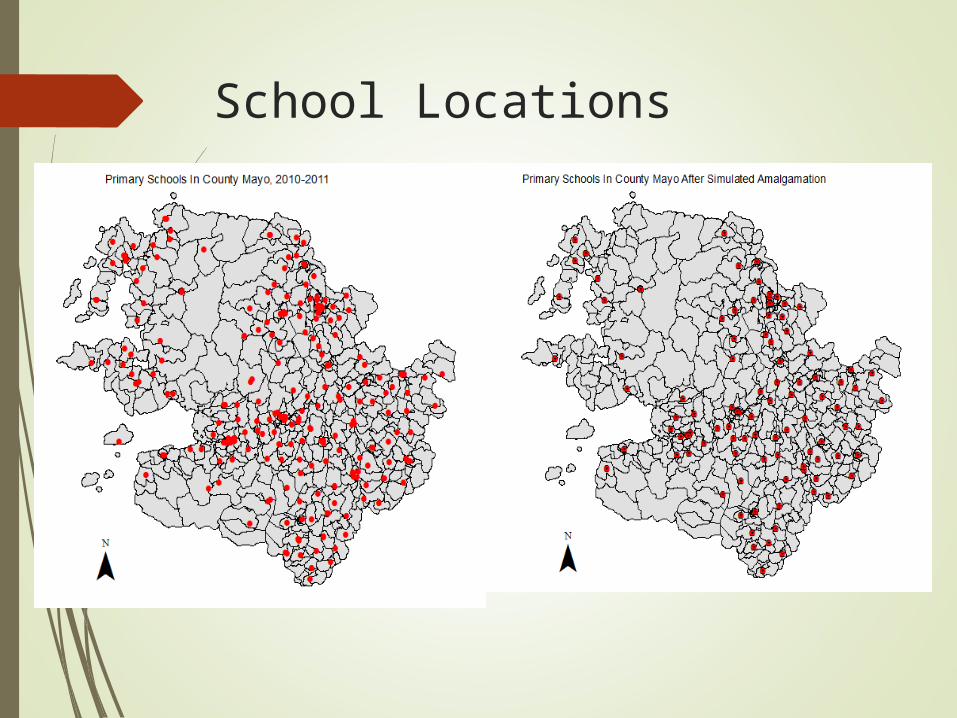
School Locations
Financial Effects
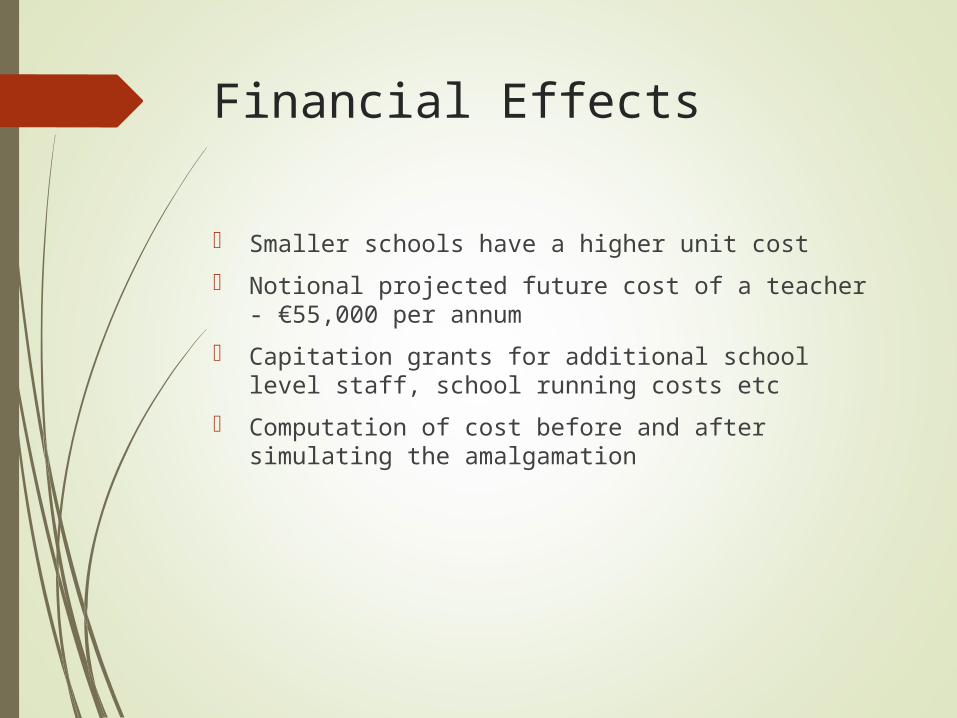
Smaller schools have a higher unit cost
Notional projected future cost of a teacher - €55,000 per annum
Capitation grants for additional school level staff, school running costs etc
Computation of cost before and after simulating the amalgamation
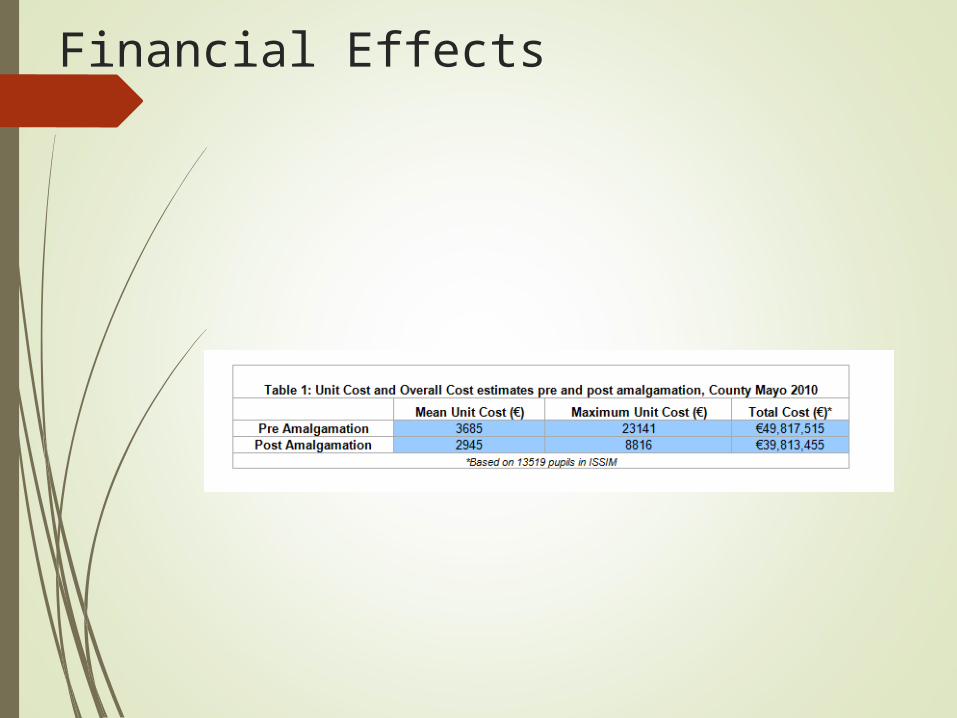
Financial Effects
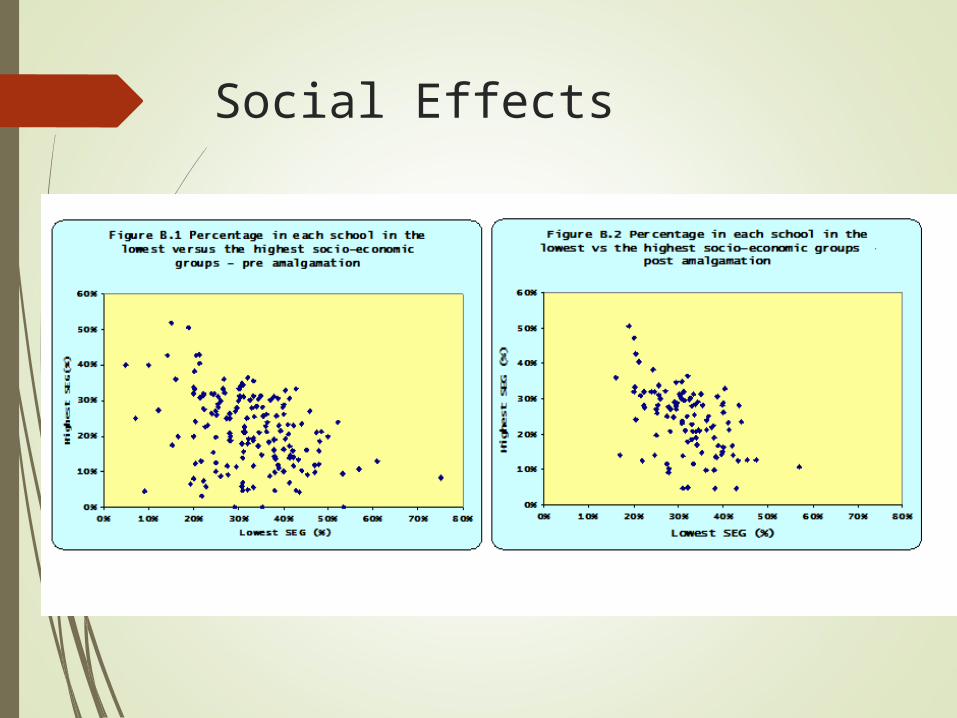
Social Effects
Socio-Economic “Equality” in schools
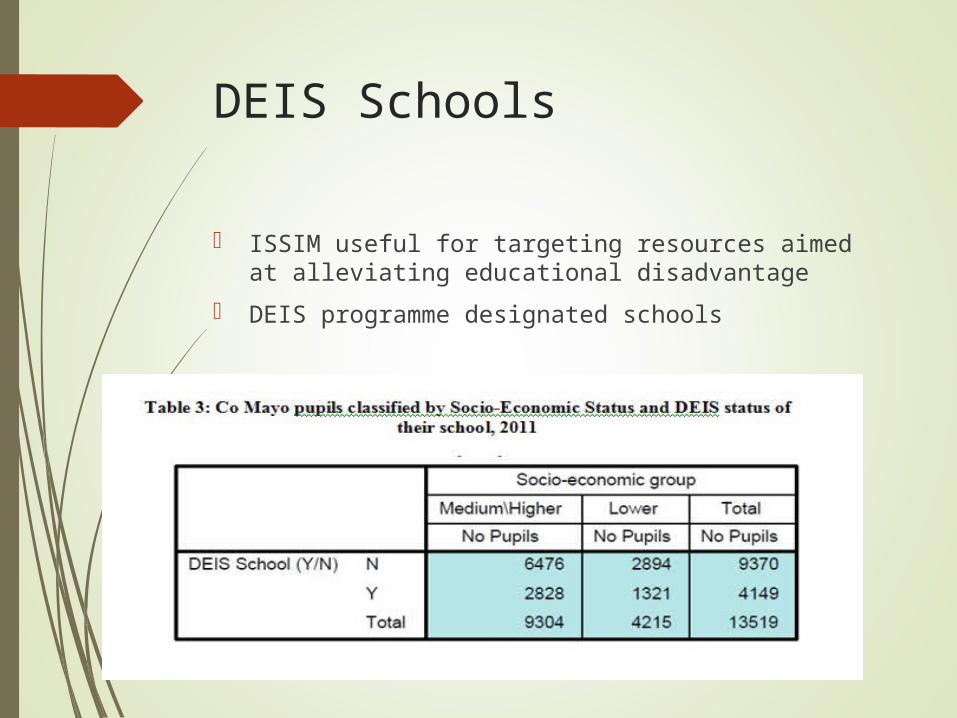
DEIS Schools
ISSIM useful for targeting resources aimed at alleviating educational disadvantage
DEIS programme designated schools
Community Effects
Add value to qualitative analysis also
Individual case studies possible
Local “catchment area” of school
Community effects of closure of small schools
ISSIM can add information to contextual analysis – to what extent does the school serve the local community?
Evaluation
Comprehensive dataset
Cost-effective insights compared to surveys
Possibilities to convert from microsimulation to agent-based model by including records with uncoded place of school and assigning records to specific households
From static to dynamic – enrolment and cost projections
Evaluation
Data protection - Dataset currently warehoused in Department of Education
Strict access controls Published material based on
POWSCAR must be approved by CSO.
Next steps
Expand the model to cover all of Ireland
Develop standard “data cleaning” methodologies – cities may present additional validation issues.
Examine some of the policy issues explored here in more detail – initial focus on policies affecting primary schools