Spatial Patterns Figuerola Et Al-1
16
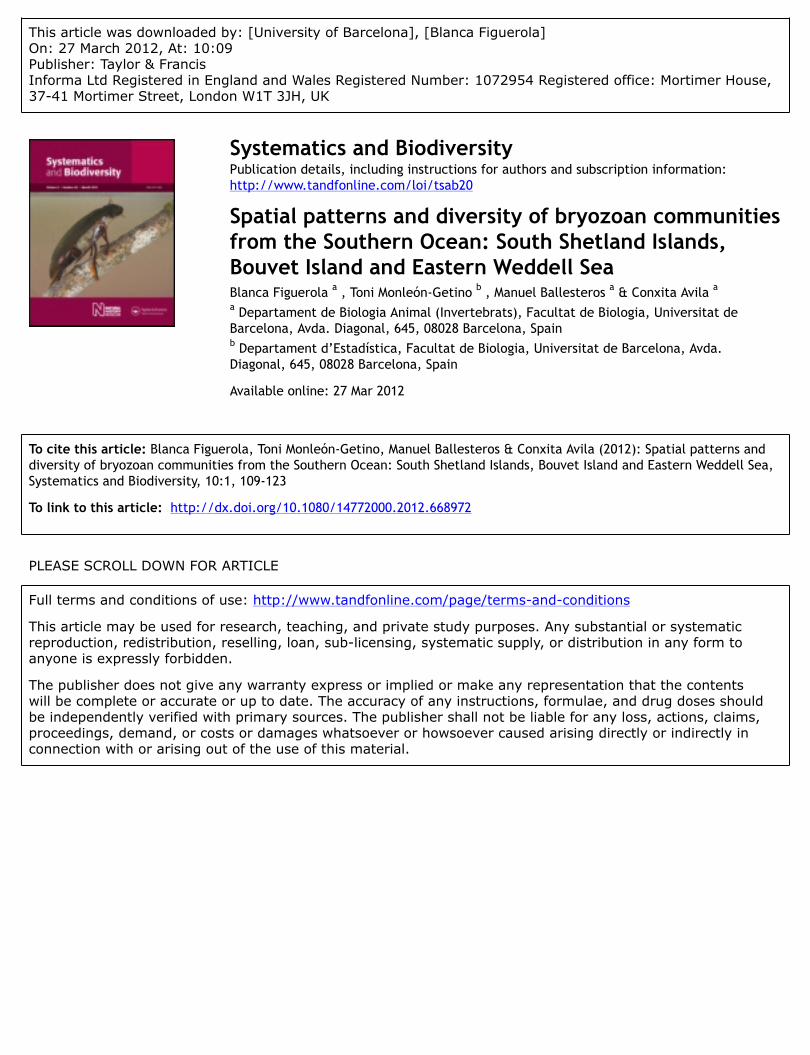
This article was downloaded by: [University of Barcelona], [Blanca Figuerola] On: 27 March 2012, At: 10:09 Publisher: Taylor & Francis Informa Ltd Registered in England and Wales Registered Number: 1072954 Registered office: Mortimer House, 37-41 Mortimer Street, London W1T 3JH, UK Systematics and Biodiversity Publication details, including instructions for authors and subscription information: http://www.tandfonline.com/loi/tsab20 Spatial patterns and diversity of bryozoan communities from the Southern Ocean: South Shetland Islands, Bouvet Island and Eastern Weddell Sea Blanca Figuerola a , Toni Monleón-Getino b , Manuel Ballesteros a & Conxita Avila a a Departament de Biologia Animal (Invertebrats), Facultat de Biologia, Universitat de Barcelona, Avda. Diagonal, 645, 08028 Barcelona, Spain b Departament d’Estadística, Facultat de Biologia, Universitat de Barcelona, Avda. Diagonal, 645, 08028 Barcelona, Spain Available online: 27 Mar 2012 To cite this article: Blanca Figuerola, Toni Monleón-Getino, Manuel Ballesteros & Conxita Avila (2012): Spatial patterns and diversity of bryozoan communities from the Southern Ocean: South Shetland Islands, Bouvet Island and Eastern Weddell Sea, Systematics and Biodiversity, 10:1, 109-123 To link to this article: http://dx.doi.org/10.1080/14772000.2012.668972 PLEASE SCROLL DOWN FOR ARTICLE Full terms and conditions of use: http://www.tandfonline.com/page/terms-and-conditions This article may be used for research, teaching, and private study purposes. Any substantial or systematic reproduction, redistribution, reselling, loan, sub-licensing, systematic supply, or distribution in any form to anyone is expressly forbidden. The publisher does not give any warranty express or implied or make any representation that the contents will be complete or accurate or up to date. The accuracy of any instructions, formulae, and drug doses should be independently verified with primary sources. The publisher shall not be liable for any loss, actions, claims, proceedings, demand, or costs or damages whatsoever or howsoever caused arising directly or indirectly in connection with or arising out of the use of this material.
-
Upload
blancafiguerola -
Category
Documents
-
view
10 -
download
1
description
Spatial Patterns
Transcript of Spatial Patterns Figuerola Et Al-1
This article was downloaded by: [University of Barcelona], [Blanca Figuerola]On: 27 March 2012, At: 10:09Publisher: Taylor & FrancisInforma Ltd Registered in England and Wales Registered Number: 1072954 Registered office: Mortimer House,37-41 Mortimer Street, London W1T 3JH, UK
Systematics and BiodiversityPublication details, including instructions for authors and subscription information:http://www.tandfonline.com/loi/tsab20
Spatial patterns and diversity of bryozoan communitiesfrom the Southern Ocean: South Shetland Islands,Bouvet Island and Eastern Weddell SeaBlanca Figuerola a , Toni Monleón-Getino b , Manuel Ballesteros a & Conxita Avila aa Departament de Biologia Animal (Invertebrats), Facultat de Biologia, Universitat deBarcelona, Avda. Diagonal, 645, 08028 Barcelona, Spainb Departament d’Estadística, Facultat de Biologia, Universitat de Barcelona, Avda.Diagonal, 645, 08028 Barcelona, Spain
Available online: 27 Mar 2012
To cite this article: Blanca Figuerola, Toni Monleón-Getino, Manuel Ballesteros & Conxita Avila (2012): Spatial patterns anddiversity of bryozoan communities from the Southern Ocean: South Shetland Islands, Bouvet Island and Eastern Weddell Sea,Systematics and Biodiversity, 10:1, 109-123
To link to this article: http://dx.doi.org/10.1080/14772000.2012.668972
PLEASE SCROLL DOWN FOR ARTICLE
Full terms and conditions of use: http://www.tandfonline.com/page/terms-and-conditions
This article may be used for research, teaching, and private study purposes. Any substantial or systematicreproduction, redistribution, reselling, loan, sub-licensing, systematic supply, or distribution in any form toanyone is expressly forbidden.
The publisher does not give any warranty express or implied or make any representation that the contentswill be complete or accurate or up to date. The accuracy of any instructions, formulae, and drug doses shouldbe independently verified with primary sources. The publisher shall not be liable for any loss, actions, claims,proceedings, demand, or costs or damages whatsoever or howsoever caused arising directly or indirectly inconnection with or arising out of the use of this material.

Systematics and Biodiversity (2012), 10(1): 109–123
Research Article
Spatial patterns and diversity of bryozoan communities from theSouthern Ocean: South Shetland Islands, Bouvet Island and EasternWeddell Sea
BLANCA FIGUEROLA1, TONI MONLEON-GETINO2, MANUEL BALLESTEROS1 & CONXITA AVILA1
1Departament de Biologia Animal (Invertebrats), Facultat de Biologia, Universitat de Barcelona, Avda. Diagonal, 645, 08028 Barcelona,Spain2Departament d’Estadıstica, Facultat de Biologia, Universitat de Barcelona, Avda. Diagonal, 645, 08028 Barcelona, Spain
(Received 30 November 2011; revised 30 January 2012; accepted 17 February 2012)
In this study, we report new data on the biodiversity and the geographic and bathymetric distribution of bryozoans collectedduring the ANT XXI/2 cruise (November 2003 to January 2004) in the Eastern Weddell Sea and Bouvet Island, and duringthe Spanish Antarctic expedition ECOQUIM (January 2006) in the South Shetland Islands. Our data on distribution wereanalysed together with previous studies carried out in the same regions. A total of 54 species of Antarctic bryozoans (206samples), including a new species of the genus Reteporella were found. Two species were reported for the first time fromBouvet Island, one from the Weddell Sea and one from Spiess Seamount. Fifty-five per cent of all species identified wereendemic to Antarctica. In the Weddell Sea, the regions of Austasen and Kapp Norvegia exhibit the highest relative speciesrichness, followed by the Vestkapp region. Multivariate and cluster analyses revealed small-scale spatial variability in thecommunity structure along depth and between localities.
Key words: Antarctica, bathymetric distribution, bryozoans, geographic distribution, multidimensional scaling
IntroductionThe conservation and management of marine biodiversityrequires detailed studies of the biodiversity and its relation-ship with environmental conditions (de Voogd et al., 2009).Although they seem to be under less intense pressureswhen compared with other ecosystems globally, Antarc-tic habitats are threatened by overexploitation of living re-sources, establishment of invasive marine species and cli-mate change, as well as the growing impact of tourism(Tejedo et al., 2009). The Antarctic fauna has evolved in sta-ble conditions, thus it is likely to be more sensitive and, forthis reason, the risk of extinctions caused by anthropogenicimpacts in these ecosystems makes it essential to intensifyresearch on Antarctic biodiversity (Barnes & Peck, 2008).
Knowledge of the bryozoan species from the SouthernOcean, their diversity and the environmental conditions inwhich they live, is still very poor (Kuklinski & Barnes,2009), which is largely determined by the relative inacces-sibility of the region. An understanding of how and whysimilarities and differences exist between benthic commu-
Correspondence to: Blanca Figuerola. E-mail: [email protected]
nities inhabiting Antarctic ecosystems may provide infor-mation about the physical and biological factors that influ-ence bryozoan distributions.
More than 700 new species of invertebrates from deepAntarctic waters have been recently discovered, with bry-ozoans, sponges and amphipods exhibiting high speciesrichness (Brandt et al., 2007). Therefore, recent studies ofAntarctic biodiversity in the region have described a richand varied fauna (Hayward & Winston, 2011). In general,the Antarctic shelf and slope are known to be able to sup-port biomass levels of macrobenthos far higher than thosein equivalent habitats in boreal and subtropical regions ofequal depth (Arntz et al., 1994).
In recent years, the number of taxonomic studies onAntarctic bryozoans has experienced a notable increase(Hayward, 1995; Gutt et al., 2000; Lopez-Fe de la Cuadra& Garcıa-Gomez, 2000). Since the scientific results of theBelgian Antarctic Expedition in 1897–99 (Waters, 1904),over 300 species have been described and new descriptionscontinue to appear (Clarke & Johnston, 2003; Gontar,2008; Lopez & Liuzzi, 2008; Kuklinski & Barnes, 2009;Griffiths, 2010; Figuerola et al., 2012). Cheilostomatidbryozoans are one of the best-represented taxa on the
ISSN 1477-2000 print / 1478-0933 onlineC! 2012 The Natural History Museum
http://dx.doi.org/10.1080/14772000.2012.668972
Dow
nloa
ded
by [U
nive
rsity
of B
arce
lona
], [B
lanc
a Fi
guer
ola]
at 1
0:09
27
Mar
ch 2
012
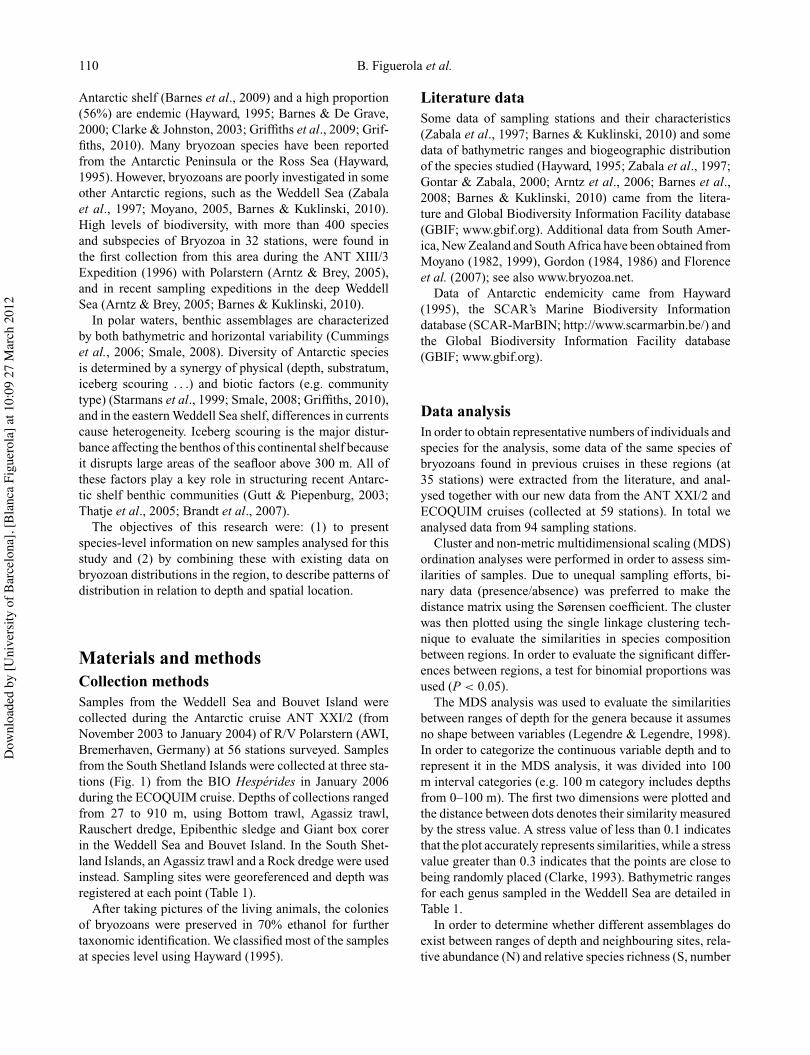
110 B. Figuerola et al.
Antarctic shelf (Barnes et al., 2009) and a high proportion(56%) are endemic (Hayward, 1995; Barnes & De Grave,2000; Clarke & Johnston, 2003; Griffiths et al., 2009; Grif-fiths, 2010). Many bryozoan species have been reportedfrom the Antarctic Peninsula or the Ross Sea (Hayward,1995). However, bryozoans are poorly investigated in someother Antarctic regions, such as the Weddell Sea (Zabalaet al., 1997; Moyano, 2005, Barnes & Kuklinski, 2010).High levels of biodiversity, with more than 400 speciesand subspecies of Bryozoa in 32 stations, were found inthe first collection from this area during the ANT XIII/3Expedition (1996) with Polarstern (Arntz & Brey, 2005),and in recent sampling expeditions in the deep WeddellSea (Arntz & Brey, 2005; Barnes & Kuklinski, 2010).
In polar waters, benthic assemblages are characterizedby both bathymetric and horizontal variability (Cummingset al., 2006; Smale, 2008). Diversity of Antarctic speciesis determined by a synergy of physical (depth, substratum,iceberg scouring . . .) and biotic factors (e.g. communitytype) (Starmans et al., 1999; Smale, 2008; Griffiths, 2010),and in the eastern Weddell Sea shelf, differences in currentscause heterogeneity. Iceberg scouring is the major distur-bance affecting the benthos of this continental shelf becauseit disrupts large areas of the seafloor above 300 m. All ofthese factors play a key role in structuring recent Antarc-tic shelf benthic communities (Gutt & Piepenburg, 2003;Thatje et al., 2005; Brandt et al., 2007).
The objectives of this research were: (1) to presentspecies-level information on new samples analysed for thisstudy and (2) by combining these with existing data onbryozoan distributions in the region, to describe patterns ofdistribution in relation to depth and spatial location.
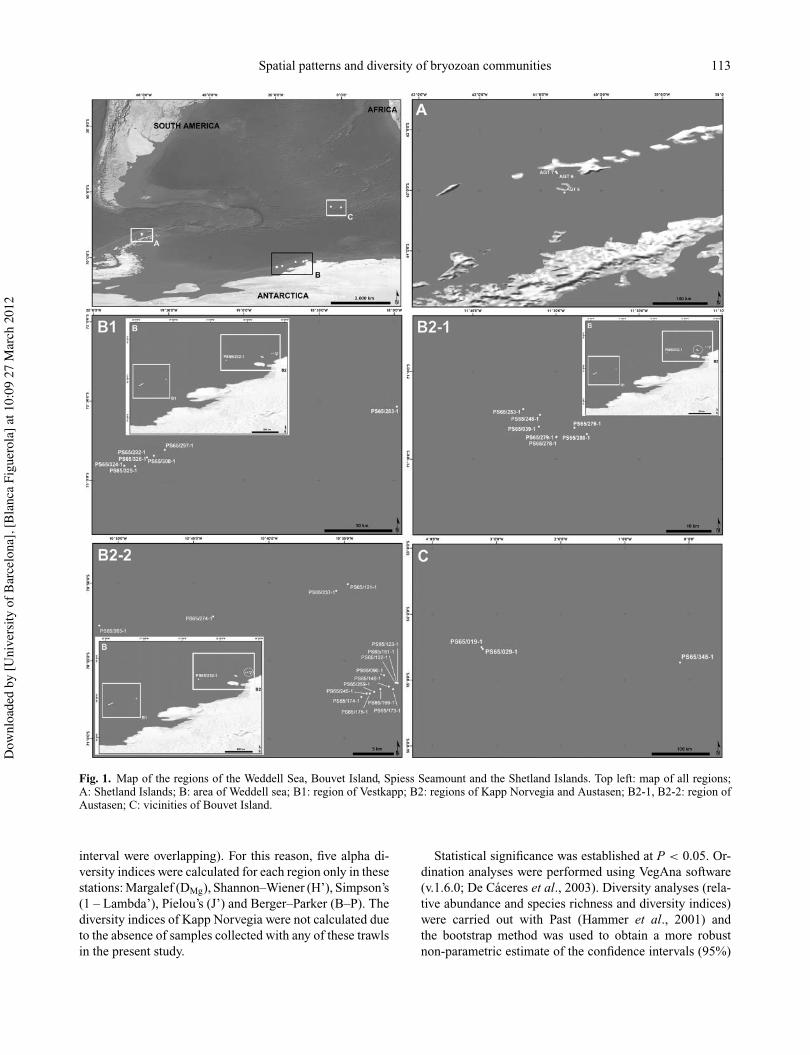
Materials and methodsCollection methodsSamples from the Weddell Sea and Bouvet Island werecollected during the Antarctic cruise ANT XXI/2 (fromNovember 2003 to January 2004) of R/V Polarstern (AWI,Bremerhaven, Germany) at 56 stations surveyed. Samplesfrom the South Shetland Islands were collected at three sta-tions (Fig. 1) from the BIO Hesperides in January 2006during the ECOQUIM cruise. Depths of collections rangedfrom 27 to 910 m, using Bottom trawl, Agassiz trawl,Rauschert dredge, Epibenthic sledge and Giant box corerin the Weddell Sea and Bouvet Island. In the South Shet-land Islands, an Agassiz trawl and a Rock dredge were usedinstead. Sampling sites were georeferenced and depth wasregistered at each point (Table 1).
After taking pictures of the living animals, the coloniesof bryozoans were preserved in 70% ethanol for furthertaxonomic identification. We classified most of the samplesat species level using Hayward (1995).
Literature dataSome data of sampling stations and their characteristics(Zabala et al., 1997; Barnes & Kuklinski, 2010) and somedata of bathymetric ranges and biogeographic distributionof the species studied (Hayward, 1995; Zabala et al., 1997;Gontar & Zabala, 2000; Arntz et al., 2006; Barnes et al.,2008; Barnes & Kuklinski, 2010) came from the litera-ture and Global Biodiversity Information Facility database(GBIF; www.gbif.org). Additional data from South Amer-ica, New Zealand and South Africa have been obtained fromMoyano (1982, 1999), Gordon (1984, 1986) and Florenceet al. (2007); see also www.bryozoa.net.
Data of Antarctic endemicity came from Hayward(1995), the SCAR’s Marine Biodiversity Informationdatabase (SCAR-MarBIN; http://www.scarmarbin.be/) andthe Global Biodiversity Information Facility database(GBIF; www.gbif.org).
Data analysisIn order to obtain representative numbers of individuals andspecies for the analysis, some data of the same species ofbryozoans found in previous cruises in these regions (at35 stations) were extracted from the literature, and anal-ysed together with our new data from the ANT XXI/2 andECOQUIM cruises (collected at 59 stations). In total weanalysed data from 94 sampling stations.
Cluster and non-metric multidimensional scaling (MDS)ordination analyses were performed in order to assess sim-ilarities of samples. Due to unequal sampling efforts, bi-nary data (presence/absence) was preferred to make thedistance matrix using the Sørensen coefficient. The clusterwas then plotted using the single linkage clustering tech-nique to evaluate the similarities in species compositionbetween regions. In order to evaluate the significant differ-ences between regions, a test for binomial proportions wasused (P < 0.05).
The MDS analysis was used to evaluate the similaritiesbetween ranges of depth for the genera because it assumesno shape between variables (Legendre & Legendre, 1998).In order to categorize the continuous variable depth and torepresent it in the MDS analysis, it was divided into 100m interval categories (e.g. 100 m category includes depthsfrom 0–100 m). The first two dimensions were plotted andthe distance between dots denotes their similarity measuredby the stress value. A stress value of less than 0.1 indicatesthat the plot accurately represents similarities, while a stressvalue greater than 0.3 indicates that the points are close tobeing randomly placed (Clarke, 1993). Bathymetric rangesfor each genus sampled in the Weddell Sea are detailed inTable 1.
In order to determine whether different assemblages doexist between ranges of depth and neighbouring sites, rela-tive abundance (N) and relative species richness (S, number
Dow
nloa
ded
by [U
nive
rsity
of B
arce
lona
], [B
lanc
a Fi
guer
ola]
at 1
0:09
27
Mar
ch 2
012

Spatial patterns and diversity of bryozoan communities 111
Table 1. Sampling stations and their characteristics from this study and from the literature. AT: Agassiz trawl, RD: Rauschert dredge,BT: Bottom trawl, GBC: Giant box corer, ES: Epibenthic sledge, R: Rock dredge, BP: bentopelagic trawl, MG: Multibox corer and GK:large box corer.
Location Station Date Latitude (S) Longitude (W) Depth (m) Gear References
Spiess Seamount PS65/345-1 11/01/2004 54" 44. 12# 00" 08. 31# 629.4 RD This studyBouvet Island PS65/019-1 24/11/2003 54" 30. 01# 03" 13. 97# 259.7 AT This studyBouvet Island PS65/029-1 25/11/2003 54" 31. 59# 03" 13. 05# 376.8 AT This studyLivingston AGT 7 06/01/2006 62" 41. 575# 60" 44. 827# 27.9 RD This studyLivingston AGT 6 06/01/2006 62" 43. 117# 60" 43. 683# 94.9 RD This studyDeception AGT 9 07/01/2006 63" 02. 292# 60" 36. 355# 110.3 AT This studyWeddell Sea PS67/102-11 06/03/2005 65" 35. 40# 36" 29. 00# 4794 AT Barnes et al. (2010)Neumayer 30 01/03/1996 70" 05. 30# 08" 20. 00# 2315 AG Zabala et al. (1997),Neumayer 30 01/03/1996 70" 05. 30# 08" 20. 00# 2315 DR Zabala et al. (1997)Neumayer PS65/069-1 07/12/2003 70" 25. 87# 08" 37. 43# 413.6 RD Barnes et al. (2010)Neumayer 32 04/03/1996 70" 28. 90# 08" 15. 10# 286 DR Zabala et al. (1997)Neumayer 31 02/03/1996 70" 30. 90# 10" 44. 20# 1586 DR Zabala et al. (1997)Austasen PS65/121-1 11/12/2003 70" 50. 08# 10" 34.76# 274 AT This studyAustasen PS65/121-1 11/12/2003 70" 50. 08# 10" 35. 54# 268 AT Barnes et al. (2010)Austasen PS65/237-1 22/12/2003 70" 50. 50# 10" 35. 54# 264.4 BT This studyAustasen PS65/336-1 05/01/2004 70" 50. 75# 10" 28. 01# 281.2 AT This studyAustasen PS65/339-1 05/01/2004 70" 50. 78# 10" 28. 51# 273.6 RD This studyAustasen PS65/274-1 28/12/2003 70" 52. 16# 10" 43. 69# 290.8 BT This studyAustasen PS65/265-1 27/12/2003 70" 52. 75# 10" 51. 24# 294.8 BT This studyAustasen PS65/090-1 09/12/2003 70" 55. 92# 10" 32. 37# 288 AT This studyAustasen PS65/123-1 11/12/2003 70" 56. 41# 10" 31. 58# 283.2 GBC This studyAustasen PS65/132-1 12/12/2003 70" 56. 42# 10" 31. 61# 284.4 BT This studyAustasen PS65/161-1 15/12/2003 70" 56. 43# 10" 31. 47# 279.6 AT This studyAustasen PS65/148-1 13/12/2003 70" 56. 67# 10" 32. 05# 302.4 BT This studyAustasen PS65/173-1 16/12/2003 70" 56. 82# 10" 31. 76# 296.4 AT This studyAustasen PS65/166-1 15/12/2003 70" 56. 83# 10" 32. 61# 338 BT This studyAustasen PS65/259-1 24/12/2003 70" 57. 00# 10" 33. 02# 332.8 BT This studyAustasen PS65/175-1 16/12/2003 70" 57. 11# 10" 33. 32# 337.2 BT This studyAustasen PS65/245-1 22/12/2003 70" 57. 11# 10" 33. 52# 337.2 BT This studyAustasen PS65/174-1 16/12/2003 70" 57. 33# 10" 33. 86# 351.6 BT This studyAustasen 1 05/02/1996 71" 03. 10# 11" 25. 50# 462 BT Zabala et al. (1997)Austasen PS65/253-1 23/12/2003 71" 04. 30# 11" 33. 92# 308.8 BT This studyAustasen PS65/248-1 23/12/2003 71" 04. 96# 11" 31. 90# 286.8 BT This studyAustasen PS65/039-1 05/12/2003 71" 06. 30# 11" 32. 04# 175.2 AT This studyAustasen PS65/276-1 28/12/2003 71" 06. 44# 11" 27. 76# 277.2 AT This studyAustasen PS65/280-1 29/12/2003 71" 07. 15# 11" 26. 23# 228.4 AT This studyAustasen PS65/279-0 29/12/2003 71" 07. 43# 11" 29. 83# 119.2 AT Barnes et al. (2010)Austasen PS65/279-1 29/12/2003 71" 07. 48# 11" 29. 91# 119.6 AT This studyAustasen PS65/278-1 29/12/2003 71" 07. 51# 11" 29. 94# 120 AT Barnes et al. (2010)Austasen 24 21/02/1996 71" 08. 15# 11" 32. 25# 123 AG Zabala et al. (1997)Austasen 24 21/02/1996 71" 08. 30# 11" 32. 40# 119 GK Zabala et al. (1997)Austasen 2 22/02/1996 71" 18. 60# 12" 25. 40# 181 MG Zabala et al. (1997)Austasen PS67/078-9 21/02/2005 71" 09. 39# 13" 59. 30# 2156 ES Barnes et al. (2010)Austasen PS67/078-11 21/02/2005 71" 09. 39# 13" 59. 33# 2157 AT Barnes et al. (2010)Kapp Norvegia PS67/074-6 20/02/2005 71" 18. 35# 13" 57. 71# 1030 ES Barnes et al. (2010)Kapp Norvegia PS65/232-1 21/12/2003 71" 18. 61# 13" 56. 12# 910 ES This studyKapp Norvegia 2 09/02/1996 71" 18. 70# 12" 17. 10# 170 AG Zabala et al. (1997)Kapp Norvegia 2 22/02/1996 71" 19. 10# 12" 22. 80# 159 MG Zabala et al. (1997)Kapp Norvegia 2 22/02/1996 71" 19. 20# 12" 27. 00# 253 MG Zabala et al. (1997)Kapp Norvegia 25 23/02/1996 71" 22. 90# 14" 19. 20# 622 AG Zabala et al. (1997)Kapp Norvegia 25 23/02/1996 71" 22. 90# 14" 19. 20# 622 DR Zabala et al. (1997)Kapp Norvegia 25 23/02/1996 71" 23. 10# 14" 19. 80# 634 AG Zabala et al. (1997)Kapp Norvegia 25 23/02/1996 71" 23. 10# 14" 19. 70# 621 GK Zabala et al. (1997)Kapp Norvegia 25 23/02/1996 71" 23. 10# 14" 19. 70# 628 GK Zabala et al. (1997)Kapp Norvegia 21 18/02/1996 71" 26. 50# 21" 10. 50# 253 BP Zabala et al. (1997)Kapp Norvegia 7 08/02/1996 71" 26. 80# 13" 44. 00# 215 GK Zabala et al. (1997)Kapp Norvegia 6 11/02/1996 71" 27. 40# 13" 43. 30# 212 AG Zabala et al. (1997)Kapp Norvegia 26 24/02/1996 71" 29. 30# 14" 18. 60# 216 DR Zabala et al. (1997)Kapp Norvegia 26 24/02/1996 71" 29. 30# 14" 19. 50# 210 DR Zabala et al. (1997)
(Continued on next page)
Dow
nloa
ded
by [U
nive
rsity
of B
arce
lona
], [B
lanc
a Fi
guer
ola]
at 1
0:09
27
Mar
ch 2
012

112 B. Figuerola et al.
Table 1. (Continued)
Location Station Date Latitude (S) Longitude (W) Depth (m) Gear References
Kapp Norvegia 29 29/02/1996 71" 30. 70# 12" 26. 40# 494 GK Zabala et al. (1997)Kapp Norvegia 29 28/02/1996 71" 31. 50# 12" 25. 50# 504 BP Zabala et al. (1997)Kapp Norvegia 6 08/02/1996 71" 31. 80# 13" 34. 50# 254 AG Zabala et al. (1997)Kapp Norvegia 6 25/02/1996 71" 32. 10# 13" 44. 10# 362 AG Zabala et al. (1997)Kapp Norvegia 9 26/02/1996 71" 32. 60# 12" 26. 30# 570 AG Zabala et al. (1997)Kapp Norvegia 9 10/02/1996 71" 34. 00# 12" 25. 80# 604 BT Zabala et al. (1997)Kapp Norvegia 9 26/02/1996 71" 34. 70# 12" 26. 60# 560 AG Zabala et al. (1997)Kapp Norvegia 9 26/02/1996 71" 34. 70# 12" 26. 60# 560 DR Zabala et al. (1997)Kapp Norvegia 3 26/02/1996 71" 39. 30# 12" 05. 10# 209 GK Zabala et al. (1997)Kapp Norvegia 5 06/02/1996 71" 39. 75# 12" 41. 00# 255 MG Zabala et al. (1997)Kapp Norvegia 5 06/02/1996 71" 40. 49# 12" 41. 70# 254 EB Zabala et al. (1997)Kapp Norvegia 5 07/02/1996 71" 41. 10# 12" 44. 30# 227 BT Zabala et al. (1997)Kapp Norvegia 4 20/02/1996 71" 41. 20# 12" 30. 80# 438 MG Zabala et al. (1997)Kapp Norvegia 4 20/02/1996 71" 41. 50# 12" 31. 70# 436 GK Zabala et al. (1997)Kapp Norvegia 4 20/02/1996 71" 41. 60# 12" 29. 40# 440 AG Zabala et al. (1997)Vestkapp PS65/283-1 30/12/2003 72" 32. 16# 17" 58. 88# 585.2 ES This studyVestkapp PS65/297-1 01/01/2004 72" 48. 50# 19" 31. 60# 668 RD This studyVestkapp PS65/308-1 02/01/2004 72" 50. 18# 19" 35. 94# 622 RD This studyVestkapp 20 18/02/1996 72" 50. 50# 19" 26. 00# 428 BP Zabala et al. (1997)Vestkapp PS65/292-1 31/12/2003 72" 51. 43# 19" 38. 62# 597.6 BT This studyVestkapp PS65/326-1 03/01/2004 72" 51, 43# 19" 38. 67# 616 RD This studyVestkapp PS65/326-1 03/01/2004 72" 51. 70# 19" 39. 22# 605.2 RD Barnes & Kuklinski (2010)Vestkapp PS65/324-1 03/01/2004 72" 54. 52# 19" 47. 74# 693.6 RD This studyVestkapp PS65/324-1 03/01/2004 72" 54. 55# 19" 47. 30# 647.2 RD Barnes & Kuklinski (2010)Vestkapp PS65/325-1 03/01/2004 72" 54. 76# 19" 43. 48# 457.6 RD This studyVestkapp 18 16/02/1996 73" 15. 40# 21" 27. 60# 1704 AG Zabala et al. (1997)Vestkapp 18 16/02/1996 73" 16. 70# 21" 25. 50# 1538 AG Zabala et al. (1997)Vestkapp 17 16/02/1996 73" 18. 00# 21" 09. 90# 468 BT Zabala et al. (1997)Vestkapp 12 13/02/1996 73" 18. 10# 21" 10. 10# 459 BT Zabala et al. (1997)Vestkapp 11 13/02/1996 73" 22. 60# 21" 10. 60# 338 BT Zabala et al. (1997)Vestkapp 21 18/02/1996 73" 22. 90# 21" 10. 00# 283 BP Zabala et al. (1997)Vestkapp 14 14/02/1996 73" 36. 10# 22" 35. 70# 850 BT Zabala et al. (1997)Vestkapp 13 14/02/1996 73" 36. 30# 22" 19. 10# 620 BT Zabala et al. (1997)Vestkapp 15 15/02/1996 73" 42. 00# 22" 30. 50# 446 BT Zabala et al. (1997)Vestkapp 16 15/02/1996 73" 53. 40# 22" 26. 90# 246 BT Zabala et al. (1997)
of species present) and P value (test for binomial propor-tions) were calculated for each depth range and area. Asample-based rarefaction curve was also computed. Chao2,Jacknife1 and Jacknife2 methods were used to estimate thetheoretical number of expected species within each area(Colwell & Coddington, 1994). Chao2 is an abundance-based non-parametric estimator of species richness thatworks by examining the number of species in a sampleobserved more than once relative to the number of speciesthat is observed just once. In the absence of complete inven-tories, these non-parametric estimators have been shown toperform better than most other methods, such as observedspecies richness (Krebs, 1999).
Diversity indices are commonly used to provide moreinformation about community composition than simplyspecies richness, such as the rarity and commonness ofspecies and they also take the relative abundances of dif-ferent species into account. The Margalef index is basedon the number of species (species richness), while the oth-
ers are indices of proportional abundances of the species.The Shannon–Wiener index is strongly influenced by theoccurrence of rare species and Simpson’s index by the im-portance of the more dominant species. Pielou’s (evenness)and Berger–Parker indices calculate the relationship be-tween the observed diversity and the maximum diversity,as well as between the number of the individuals of themost abundant species and the total number of individualsin the sample, respectively (Gray, 2000). Diversity indicesare used to assess the impact of disturbances on the marineenvironment. In this aspect, the Shannon–Wiener index ismore sensitive (high values mean an improvement in theenvironmental state) (Gray, 2000). In the case of the Simp-son and Berger–Parker indices, higher values correspondto a lower diversity (Salas et al., 2004; Marques et al.,2009). The values of diversity indices calculated from thedata of the present study of stations sampled with Agassiztrawl (AT), Bottom trawl (BT) and Rauschert dredge (RD)did not show significant differences (bootstrap confidence
Dow
nloa
ded
by [U
nive
rsity
of B
arce
lona
], [B
lanc
a Fi
guer
ola]
at 1
0:09
27
Mar
ch 2
012
Spatial patterns and diversity of bryozoan communities 113
Fig. 1. Map of the regions of the Weddell Sea, Bouvet Island, Spiess Seamount and the Shetland Islands. Top left: map of all regions;A: Shetland Islands; B: area of Weddell sea; B1: region of Vestkapp; B2: regions of Kapp Norvegia and Austasen; B2-1, B2-2: region ofAustasen; C: vicinities of Bouvet Island.
interval were overlapping). For this reason, five alpha di-versity indices were calculated for each region only in thesestations: Margalef (DMg), Shannon–Wiener (H’), Simpson’s(1 – Lambda’), Pielou’s (J’) and Berger–Parker (B–P). Thediversity indices of Kapp Norvegia were not calculated dueto the absence of samples collected with any of these trawlsin the present study.
Statistical significance was established at P < 0.05. Or-dination analyses were performed using VegAna software(v.1.6.0; De Caceres et al., 2003). Diversity analyses (rela-tive abundance and species richness and diversity indices)were carried out with Past (Hammer et al., 2001) andthe bootstrap method was used to obtain a more robustnon-parametric estimate of the confidence intervals (95%)
Dow
nloa
ded
by [U
nive
rsity
of B
arce
lona
], [B
lanc
a Fi
guer
ola]
at 1
0:09
27
Mar
ch 2
012

114 B. Figuerola et al.
(Briggs et al., 1997). The test for binomial proportionswas performed with Minitab Statistical Software. The SPSS(version 14.0, SPSS Inc, Chicago, Illinois, USA) packagewas used for the rest of the data analysis.
ResultsA total of 54 species of Antarctic bryozoans (206 sam-ples), belonging to 12 families and 27 genera, were foundwith different trawls, from depths between 27 and 910 min the studied areas (Table 2). The list includes a newlydescribed species, Reteporella rosjoarum (Figuerola et al.,2011). Furthermore, two species were reported for the firsttime from Bouvet Island, one from the Weddell Sea andone from Spiess Seamount. Eight of the species were iden-tified only to genus level. The most diverse Infraorder wasLepraliomorpha with 18 species (33%). Fifty-five per centof the species found were endemic to the Southern Ocean(see Hayward, 1995, SCAR-MarBIN and GBIF databases),with a total of 49 species. Reteporella with six specieswas the dominant genus. Most of the species found wereBostrychopora dentata, which represented 9.7% of the totalspecimens collected, and Nematoflustra flagellata (6.7%).These were followed by Austroflustra vulgaris, Alcyonidiumsp., Carbasea curva, Cellarinella nutti and Osthimosia cur-tioscula. Austroflustra vulgaris was the only species foundin the three studied areas from the Weddell Sea.
Data from recent cruises reported in the literature andthe GBIF database together with our own data were jointlyanalysed, revealing that four species have been found farfrom their known distribution range in the Weddell Sea.Therefore, an expansion in their known geographical dis-tribution is reported here (Table 2).
Bathymetric rangesFrom a total of 27 genera analysed on the different cruises,50.2% (16 genera) were restricted to the continental shelf(18 species) and above 900 m. Camptoplites, Melicerita andCellaria were the only genera found in deeper waters (5900,4802 and 4531 m, respectively) and showed the widestbathymetric ranges (Fig. 2). Seven genera showed largebathymetric ranges: Carbasea (31–2846 m), Austroflus-tra and Cornucopina (5–2700 m), Cellarinella (5–2334m), Isosecuriflustra (22–2315 m), Kymella (0–2157 m) andNematoflustra (0–2100 m). Four genera (15 species) werepresent at depths between 0 and 700 m.
Bathymetric distributionLow stress values (0.03) of the MDS indicate a good rep-resentation in the 2-dimensional ordination (Clarke, 1993).Five depth zones were discriminated by the multidimen-sional scaling analysis in bathymetric distribution (Fig. 3):(1) a zone between 0 and 100 m with the presence of three
Fig. 2. New bathymetric ranges of bryozoans genera from theSouthern Ocean found in the present study both from our owndata and the literature and the GBIF database. Additional data havebeen obtained from Hayward (1995), Zabala et al. (1997), Gontar& Zabala (2000), Arntz et al. (2006) and Barnes & Kuklinski(2010).
genera, (2) a zone between 100 and 700 m characterizedby the presence of all of the genera, a similar compositionat each depth (77.9% of the genera appear in each 100 mof depth) and the presence of the genus Dakariella only in
Fig. 3. Plot of the multidimensional scaling ordination (MDS)of the different genera in relation to depth. Points num-bered 100–5000 correspond to different depth ranges (stress= 0.03). Additional data have been obtained from Hay-ward (1981, 1995), Zabala et al. (1997), Gontar & Za-bala (2000), Arntz et al. (2006) and Barnes & Kuklinski(2010). Group 1: 0–100 m; group 2: 100–700 m; group 3:700–2000 m; group 4: 2000–3000 m and group 5: 3000–5000 m.
Dow
nloa
ded
by [U
nive
rsity
of B
arce
lona
], [B
lanc
a Fi
guer
ola]
at 1
0:09
27
Mar
ch 2
012

Spatialpatternsand
diversityof
bryozoancom
munities
115
Table 2. Bathymetric ranges and biogeographic distribution of the species studied using data from the present study, the literature and the GBIF database.
SpeciesPresentstudy Bathymetric distr. (m) Geographic distr.
New recordsfor species References
Carbasea curva Kluge, 1914 X 31–2846 Weddell Sea Zabala et al. (1997); Gontar & Zabala (2000)Klugeflustra antarctica Hastings, 1943 X 5–732 Livingston Hayward (1995)Isosecuriflustra angusta Kluge, 1914 31–2315 Weddell Sea Zabala et al. (1997); Gontar & Zabala (2000)Isosecuriflustra tenuis Kluge, 1914 X 22–639$ (previously 634) Weddell Sea Zabala et al. (1997); Gontar & Zabala (2000)Austroflustra vulgaris Kluge, 1914 X 5–2700 Bouvet Island, Livingston,
Weddell SeaArntz et al. (2006); Hayward (1995); Zabala
et al. (1997); Gontar & Zalaba (2000)Nematoflustra flagellata Waters, 1904 0–2100 Weddell Sea Zabala et al. (1997); Gontar & Zabala (2000)Camptoplites angustus Kluge, 1914 X 5–720 Weddell Sea Zabala et al. (1997); Gontar & Zabala (2000)Camptoplites bicornis Busk, 1884 5–5900 Weddell Sea Zabala et al. (1997); Gontar & Zabala (2000)Camptoplites giganteus Kluge, 1914 X 20–294$ (previously 293) Weddell Sea Zabala et al. (1997); Gontar & Zabala (2000)Camptoplites tricornis Waters, 1904 5–2000 Weddell Sea Zabala et al. (1997); Gontar & Zabala (2000)Cornucopina polymorpha Kluge, 1914 X 5–2700 Bouvet Island $$ Arntz et al. (2006)Himantozoum antarcticum Calvet, 1909 X 5–1517 Weddell Sea, Livingston Zabala et al. (1997); Gontar & Zabala (2000);
Hayward (1995)Klugella echinata Kluge, 1914 170–640 Weddell Sea Zabala et al. (1997); Gontar & Zabala (2000)Notoplites antarcticus Waters, 1904 104–634 Weddell Sea Zabala et al. (1997); Gontar & Zabala (2000)Notoplites drygalskii Kluge, 1914 123–1030 Weddell Sea Zabala et al. (1997); Gontar & Zabala (2000);
Barnes & Kuklinski (2010)Cellaria aurorae Livingstone, 1928 5–2334 Weddell Sea Zabala et al. (1997); Gontar & Zabala (2000);
Barnes et al. (2010)Cellaria diversa Livingstone, 1928 X 5–3545 Weddell Sea Zabala et al. (1997); Gontar & Zabala (2000)Cellaria moniliorata Rogick, 1956d 10–4531 Weddell Sea Zabala et al. (1997); Gontar & Zabala (2000)Cellaria incula Hayward and Ryland, 1993 X 123–668$ (previously 634) Weddell Sea Zabala et al. (1997); Gontar & Zabala (2000)Paracellaria wandeli Calvet, 1909 5–2700 Weddell Sea Zabala et al. (1997); Gontar & Zabala (2000)Melicerita latilaminata Rogick, 1956d X 5–528 Deception Barnes et al. (2008)Melicerita obliqua Thornely, 1924 0–4802 Weddell Sea Zabala et al. (1997); Gontar & Zabala (2000);
Barnes & Kuklinski (2010)Cellarinella nodulata Waters, 1904 118–1133 Weddell Sea Zabala et al. (1997); Gontar & Zabala (2000)Cellarinella nutti Rogick, 1956d 11–2334 Weddell Sea Zabala et al. (1997); Gontar & Zabala (2000)Cellarinella rogickae Moyano, 1965 5–1517 Weddell Sea Zabala et al. (1997); Gontar & Zabala (2000))Cellarinella watersi Calvet, 1909 5–1517 Weddell Sea Zabala et al. (1997); Gontar & Zabala (2000)Systenopora contracta Waters, 1904 61–1133 Weddell Sea Zabala et al. (1997); Gontar & Zabala (2000)Isoschizoporella secunda Hayward and
Taylor, 1984X 18–1495 Weddell Sea Zabala et al. (1997); Gontar & Zabala (2000)
Isoschizoporella tricuspis Calvet, 1909 5–759 Weddell Sea Zabala et al. (1997); Gontar & Zabala (2000)Dakariella dabrowni Rogick, 1956d 181–1404 Weddell Sea Zabala et al. (1997); Gontar & Zabala (2000)Kymella polaris Waters, 1904 0–2157 Weddell Sea Zabala et al. (1997); Gontar & Zabala (2000);
Barnes & Kuklinski (2010)Smittina antarctica Waters, 1904 5–1150 Weddell Sea Zabala et al. (1997); Gontar & Zabala (2000)Smittoidea albula Hayward and Taylor, 1984 35–628 Weddell Sea Zabala et al. (1997); Gontar & Zabala (2000)
(Continued on next page)
Downloaded by [University of Barcelona], [Blanca Figuerola] at 10:09 27 March 2012

116 B. Figuerola et al.
Tabl
e2.
(Con
tinue
d)
Spec
ies
Pres
ent
stud
yB
athy
met
ric
dist
r.(m
)G
eogr
aphi
cdi
str.
New
reco
rds
for
spec
ies
Ref
eren
ces
Smitt
oide
aor
natip
ecto
ralis
Rog
ick,
1956
dX
10–1
517
Wed
dell
Sea
Zab
ala
etal
.(19
97);
Gon
tar
&Z
abal
a(2
000)
Thry
ptic
ocir
rus
cont
ortu
plic
ata
Cal
vet,
1909
10–7
32W
edde
llSe
aZ
abal
aet
al.(
1997
);G
onta
r&
Zab
ala
(200
0)
Pem
mat
opor
ella
mar
gina
taC
alve
t,19
090–
1150
Wed
dell
Sea
Zab
ala
etal
.(19
97);
Gon
tar
&Z
abal
a(2
000)
Bos
tryc
hopo
rade
ntat
aW
ater
s,19
04X
56–6
16$
(pre
viou
sly
567)
Wed
dell
Sea
Zab
ala
etal
.(19
97);
Gon
tar
&Z
abal
a(2
000)
Ost
him
osia
curt
iosc
ula
Hay
war
d,19
92X
104–
1150
Wed
dell
Sea
Zab
ala
etal
.(19
97);
Gon
tar
&Z
abal
a(2
000)
;B
arne
s&
Kuk
linsk
i(20
10)
Spig
aleo
sho
rner
oide
sW
ater
s,19
04X
283–
1543
Spie
ssSe
amou
nt$$
$
Ret
epor
ella
anta
rctic
aW
ater
s,19
0461
–622
Wed
dell
Sea
Zab
ala
etal
.(19
97);
Gon
tar
&Z
abal
a(2
000)
Ret
epor
ella
erug
ata
Hay
war
d,19
92X
86–1
030
Bou
vetI
slan
dA
rntz
etal
.(20
06);
Bar
nes
etal
.(20
10)
Ret
epor
ella
frig
ida
Wat
ers,
1904
5–92
3W
edde
llSe
aZ
abal
aet
al.(
1997
);G
onta
r&
Zab
ala
(200
0);
Bar
nes
&K
uklin
ski(
2010
)R
etep
orel
lahi
ppoc
repi
sW
ater
s,19
04X
61–6
34B
ouve
tIsl
and,
Wed
dell
Sea
$$A
rntz
etal
.(20
06);
Zab
ala
etal
.(19
97);
Gon
tar
&Z
abal
a(2
000)
Ret
epor
ella
lepr
alio
ides
Wat
ers,
1904
61–6
34W
edde
llSe
aZ
abal
aet
al.(
1997
);G
onta
r&
Zab
ala
(200
0)R
etep
orel
lasp
.nov
.Fig
uero
la,B
alle
ster
osan
dA
vila
2012
X26
4$W
edde
llSe
a$$
$$Z
abal
aet
al.(
1997
);G
onta
r&
Zab
ala
(200
0)
Alc
yoni
dium
unid
entifi
edsp
ecie
sK
irkp
atri
ck,1
902
X73
–655
Wed
dell
Sea
Zab
ala
etal
.(19
97);
Gon
tar
&Z
abal
a(2
000)
$ New
bath
ymet
ric
rang
ede
scri
bed
inth
isst
udy,
$$Fi
rstr
ecor
dfo
rB
ouve
tIsl
and,
$$$ F
irst
reco
rdfo
rSp
iess
Seam
ount
,$$$
$ Fir
stre
cord
for
the
Wed
dell
Sea.
Dow
nloa
ded
by [U
nive
rsity
of B
arce
lona
], [B
lanc
a Fi
guer
ola]
at 1
0:09
27
Mar
ch 2
012
Spatial patterns and diversity of bryozoan communities 117
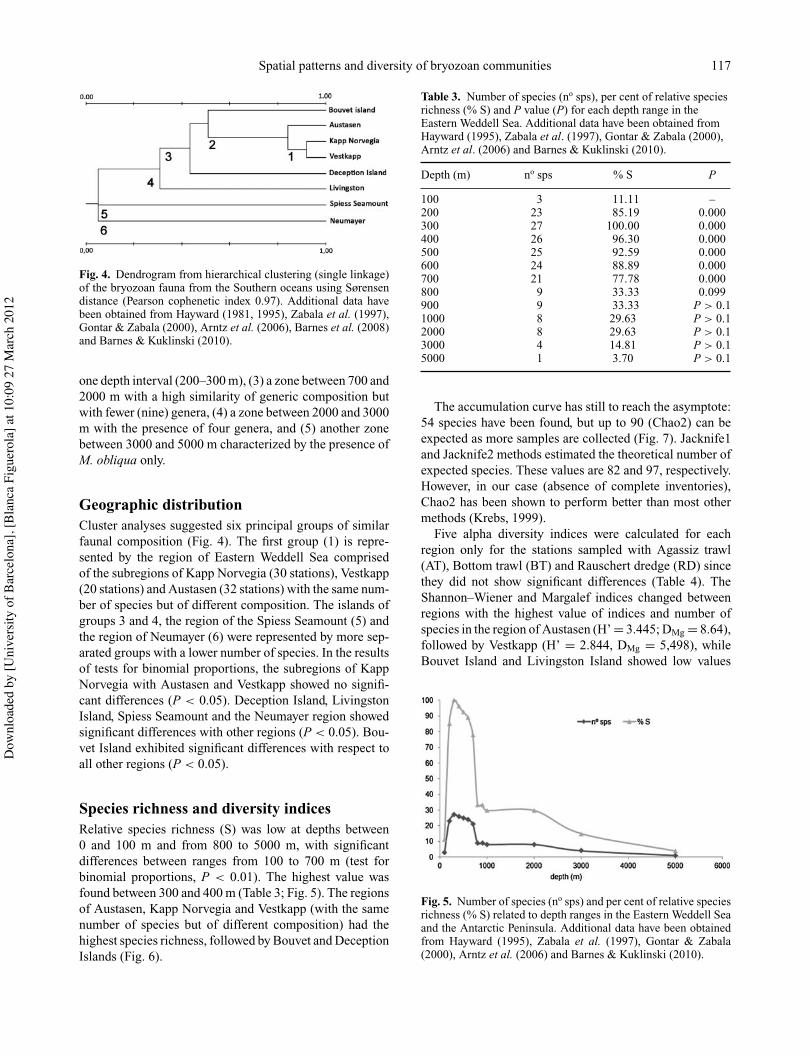
Fig. 4. Dendrogram from hierarchical clustering (single linkage)of the bryozoan fauna from the Southern oceans using Sørensendistance (Pearson cophenetic index 0.97). Additional data havebeen obtained from Hayward (1981, 1995), Zabala et al. (1997),Gontar & Zabala (2000), Arntz et al. (2006), Barnes et al. (2008)and Barnes & Kuklinski (2010).
one depth interval (200–300 m), (3) a zone between 700 and2000 m with a high similarity of generic composition butwith fewer (nine) genera, (4) a zone between 2000 and 3000m with the presence of four genera, and (5) another zonebetween 3000 and 5000 m characterized by the presence ofM. obliqua only.
Geographic distributionCluster analyses suggested six principal groups of similarfaunal composition (Fig. 4). The first group (1) is repre-sented by the region of Eastern Weddell Sea comprisedof the subregions of Kapp Norvegia (30 stations), Vestkapp(20 stations) and Austasen (32 stations) with the same num-ber of species but of different composition. The islands ofgroups 3 and 4, the region of the Spiess Seamount (5) andthe region of Neumayer (6) were represented by more sep-arated groups with a lower number of species. In the resultsof tests for binomial proportions, the subregions of KappNorvegia with Austasen and Vestkapp showed no signifi-cant differences (P < 0.05). Deception Island, LivingstonIsland, Spiess Seamount and the Neumayer region showedsignificant differences with other regions (P < 0.05). Bou-vet Island exhibited significant differences with respect toall other regions (P < 0.05).
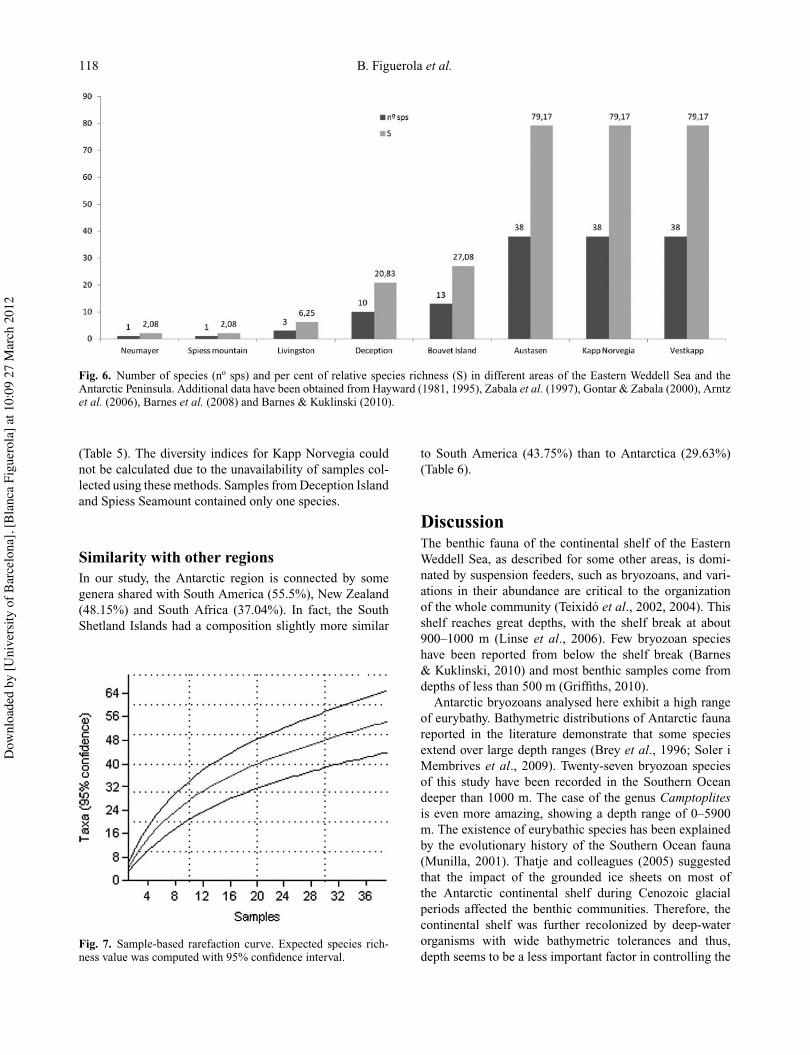
Species richness and diversity indicesRelative species richness (S) was low at depths between0 and 100 m and from 800 to 5000 m, with significantdifferences between ranges from 100 to 700 m (test forbinomial proportions, P < 0.01). The highest value wasfound between 300 and 400 m (Table 3; Fig. 5). The regionsof Austasen, Kapp Norvegia and Vestkapp (with the samenumber of species but of different composition) had thehighest species richness, followed by Bouvet and DeceptionIslands (Fig. 6).
Table 3. Number of species (no sps), per cent of relative speciesrichness (% S) and P value (P) for each depth range in theEastern Weddell Sea. Additional data have been obtained fromHayward (1995), Zabala et al. (1997), Gontar & Zabala (2000),Arntz et al. (2006) and Barnes & Kuklinski (2010).
Depth (m) no sps % S P
100 3 11.11 –200 23 85.19 0.000300 27 100.00 0.000400 26 96.30 0.000500 25 92.59 0.000600 24 88.89 0.000700 21 77.78 0.000800 9 33.33 0.099900 9 33.33 P > 0.11000 8 29.63 P > 0.12000 8 29.63 P > 0.13000 4 14.81 P > 0.15000 1 3.70 P > 0.1
The accumulation curve has still to reach the asymptote:54 species have been found, but up to 90 (Chao2) can beexpected as more samples are collected (Fig. 7). Jacknife1and Jacknife2 methods estimated the theoretical number ofexpected species. These values are 82 and 97, respectively.However, in our case (absence of complete inventories),Chao2 has been shown to perform better than most othermethods (Krebs, 1999).
Five alpha diversity indices were calculated for eachregion only for the stations sampled with Agassiz trawl(AT), Bottom trawl (BT) and Rauschert dredge (RD) sincethey did not show significant differences (Table 4). TheShannon–Wiener and Margalef indices changed betweenregions with the highest value of indices and number ofspecies in the region of Austasen (H’ = 3.445; DMg = 8.64),followed by Vestkapp (H’ = 2.844, DMg = 5,498), whileBouvet Island and Livingston Island showed low values
Fig. 5. Number of species (no sps) and per cent of relative speciesrichness (% S) related to depth ranges in the Eastern Weddell Seaand the Antarctic Peninsula. Additional data have been obtainedfrom Hayward (1995), Zabala et al. (1997), Gontar & Zabala(2000), Arntz et al. (2006) and Barnes & Kuklinski (2010).
Dow
nloa
ded
by [U
nive
rsity
of B
arce
lona
], [B
lanc
a Fi
guer
ola]
at 1
0:09
27
Mar
ch 2
012
118 B. Figuerola et al.
Fig. 6. Number of species (no sps) and per cent of relative species richness (S) in different areas of the Eastern Weddell Sea and theAntarctic Peninsula. Additional data have been obtained from Hayward (1981, 1995), Zabala et al. (1997), Gontar & Zabala (2000), Arntzet al. (2006), Barnes et al. (2008) and Barnes & Kuklinski (2010).
(Table 5). The diversity indices for Kapp Norvegia couldnot be calculated due to the unavailability of samples col-lected using these methods. Samples from Deception Islandand Spiess Seamount contained only one species.
Similarity with other regionsIn our study, the Antarctic region is connected by somegenera shared with South America (55.5%), New Zealand(48.15%) and South Africa (37.04%). In fact, the SouthShetland Islands had a composition slightly more similar
Fig. 7. Sample-based rarefaction curve. Expected species rich-ness value was computed with 95% confidence interval.
to South America (43.75%) than to Antarctica (29.63%)(Table 6).
DiscussionThe benthic fauna of the continental shelf of the EasternWeddell Sea, as described for some other areas, is domi-nated by suspension feeders, such as bryozoans, and vari-ations in their abundance are critical to the organizationof the whole community (Teixido et al., 2002, 2004). Thisshelf reaches great depths, with the shelf break at about900–1000 m (Linse et al., 2006). Few bryozoan specieshave been reported from below the shelf break (Barnes& Kuklinski, 2010) and most benthic samples come fromdepths of less than 500 m (Griffiths, 2010).
Antarctic bryozoans analysed here exhibit a high rangeof eurybathy. Bathymetric distributions of Antarctic faunareported in the literature demonstrate that some speciesextend over large depth ranges (Brey et al., 1996; Soler iMembrives et al., 2009). Twenty-seven bryozoan speciesof this study have been recorded in the Southern Oceandeeper than 1000 m. The case of the genus Camptoplitesis even more amazing, showing a depth range of 0–5900m. The existence of eurybathic species has been explainedby the evolutionary history of the Southern Ocean fauna(Munilla, 2001). Thatje and colleagues (2005) suggestedthat the impact of the grounded ice sheets on most ofthe Antarctic continental shelf during Cenozoic glacialperiods affected the benthic communities. Therefore, thecontinental shelf was further recolonized by deep-waterorganisms with wide bathymetric tolerances and thus,depth seems to be a less important factor in controlling the
Dow
nloa
ded
by [U
nive
rsity
of B
arce
lona
], [B
lanc
a Fi
guer
ola]
at 1
0:09
27
Mar
ch 2
012

Spatial patterns and diversity of bryozoan communities 119
Table 4. Diversity indices for the three types of sampling (AT: Agassiz trawl, BT: Bottom trawl and RD: Rauschert dredge) from thepresent study with 95% confidence intervals using Bootstrap method: Margalef index (DMg), Shannon–Wiener diversity index, H’ (baselog e), Simpson’s Index (1 – Lambda’), Pielou’s index (J’) and Berger–Parker index (B–P).
DMg H# 1-Lambda# J# BP
Lower Upper Lower Upper Lower Upper Lower Upper Lower Upper
AT 5.87 8.21 3.01 3.40 0.93 0.96 0.72 0.87 0.07 0.17BT 6.16 8.44 3.05 3.41 0.94 0.96 0.71 0.85 0.08 0.16RD 5.11 7.67 2.82 3.27 0.92 0.96 0.74 0.90 0.08 0.20
distribution of communities compared with other areas.Changes in Antarctic biodiversity have been found to beassociated with the movement of taxa between the shelfand the deep sea (Brey et al., 1996; Arntz et al., 1997;Brandt & Hilbig, 2004). However, this possibility has notbeen proved so far (Thatje et al., 2005). The possibilityshould also be considered that some deep occurrences(>1000 m) are due to transport off the shelf by currents, asshown for bryozoans from elsewhere, such as New Zealand(Lagaaij, 1973, Hayward, 1981; Taylor et al., 2004).
Horizontal and vertical variability in Antarctic bryozoandistributions does exist. For some benthic species, hori-zontal and bathymetric distribution patterns have been de-scribed, but, in the case of most bryozoan species from thisarea, their horizontal distribution and bathymetric rangesare relatively unknown. Multidimensional scaling analy-sis in our study showed that bryozoans were distributed inzones or depth bands. Clarke et al. (2003) reported thatin Antarctica the continental shelf lies at depths between500 m and 700 m and in some places depths exceed 1000m, while the continental slope is found at 1000–3000 mand the deep sea at over 3000 m. For example, Prydz Bayis considered to be Antarctic shelf with the deepest areasabout 1200 m (O’Brien et al., 2007). The bryozoan dis-tribution found in our study fits well with these proposedlimits: the species composition of continental shelf (0–700m or 800–1000 m) differs from that of the continental slopeand of the deep sea (>3000 m). However, the sample effort
banding may have influenced these results. In agreementwith this, Kaiser and colleagues (2011) found that the shelfand abyssal bryozoans were clearly separated in the Wed-dell Sea.
Some studies have demonstrated that Antarctic megafau-nal density generally decreases with depth (Arntz et al.,1994; Thatje & Mutschke, 1999; Rex et al., 2006; Linseet al., 2007), which can be related to the decreasing avail-ability of food with depth. However, other factors couldbe correlated with this, such as a limited availability ofsubstratum for encrusting species at depth. Decrease inorganic matter is considered to be the main limiting fac-tor for the Antarctic benthos (Arntz et al., 1994; Lampittet al., 2001; Saiz-Salinas et al., 2008). Barnes & Kuklin-ski (2010) also reported that the bryozoan species richnessdecreases rapidly with depth. Nevertheless, abundances arevery variable at depths of 1000–3500 m and some authorshave suggested the existence of patchy distribution patterns(Brandt et al., 2005). In agreement with this, slope richnessof some taxa and of some areas was larger than that of theshelf or abyss zones (Kaiser et al., 2011). In contrast, otherfindings suggested that abundance increases with depth insome areas of the Weddell Sea and decreases with depthin other areas, such as Kapp Norvegia (Linse et al., 2002).In addition, there are other factors we must take into ac-count, such as biological factors (e.g. food availability andpredation), which may have more influence at small spatialscales and depths greater than 20 m, where physical distur-
Table 5. Characteristics of the regions sampled with the three dominant types of sampling (AT, BT and RD). For each region: dominantspecies found in the sample, total number of species found (no sps), Margalef index (DMg), Shannon–Wiener diversity index, H’ (base loge), Simpson’s Index (1 – Lambda’), Pielou’s index (J’) and Berger–Parker index (B–P).
Site Dominant species found in the sample no sps DMg H# 1-Lambda# J# B-P
Bouvet Island Osthimosia curtioscula 13 1.559 1.525 0.7692 0.9188 0.3077Austasen Bostrychopora dentata 145 8.64 3.445 0.9557 0.7124 0.1241Vestkapp Carbasea curva 38 5.498 2.844 0.9294 0.8186 0.1316
Nematoflustra flagellataSpiess Seamount Spigaleos horneroides 1 0 0 0 1 1Livingston Island Austroflustra vulgaris 3 1.82 1.099 0.6667 1 0.3333
Himantozoum antarcticumKlugeflustra antarctica
Deception Island Melicerita latilaminata 1 0 0 0 1 1
Dow
nloa
ded
by [U
nive
rsity
of B
arce
lona
], [B
lanc
a Fi
guer
ola]
at 1
0:09
27
Mar
ch 2
012

120 B. Figuerola et al.
Table 6. Genera found in this study in Antarctica and Scotia Arc.Additional data from South America, New Zealand and SouthAfrica have been obtained from Moyano (1982, 1999), Gordon(1984, 1986), Florence et al. (2007); see also www.bryozoa.net.
South New South ScotiaGenera Antarctica America Zealand Africa Arc
Carbasea x x x xKlugeflustra x x xIsosecuriflustra xAustroflustra x x x xNematoflustra xCamptoplites x x x xCornucopina x x x xHimantozoum x x x x xKlugella xNotoplites x x x xCellaria x x x x xParacellaria x x xMelicerita x x x xCellarinella x xSystenopora xIsoschizoporella xDakariella xKymella xSmittina x x x xSmittoidea x x x xThrypticocirrus xPemmatoporella xBostrychopora xOsthimosia x x x xSpigaleos xReteporella x x x xAlcyonidium x x x x
bance by ice is less frequent. With this regard, Smale (2008)found high variability in the distribution of species in theseconditions.
The result of our cluster analyses indicated a spatial pat-tern in the distribution of species of bryozoans, and thedifferent regions observed agree with the different zoogeo-graphical zones of diversity suggested by previous authors(Barnes & De Grave, 2000; Barnes & Kuklinski, 2010):the Sub-Antarctic islands (Bouvet Island), East Antarctica(eastern Weddell Sea), West Antarctica and the Scotia Arc(Deception and Livingston Islands). At a smaller scale, weobserved a horizontal variability in assemblage composi-tion between some regions. The regions of Kapp Norvegia(30 stations), Vestkapp (20 stations) and Austasen (32 sta-tions) showed the same values of relative species richness.However, the regions of Kapp Norvegia and Vestkapp aremore similar (the subgroup of cluster 1 has the highest simi-larity, 92%), indicating an even greater similarity in speciescomposition. The reason for this similarity could be theirproximity. Moreover, Gerdes et al. (2008) proposed thatthe shelf off Austasen has to be considered as a patch-work of disturbed areas and this could be the reason for itshigher diversity (higher values of DMg, H’ and 1-Lambda’indices) compared with Vestkapp. In contrast, the value of
the Berger–Parker and Pielou’s indices were lower becausethere were many individuals of one species (B. dentata).However, this area shows the same value of species rich-ness as the region of Kapp Norvegia (84% similarity).
The regions of Neumayer, the Spiess Seamount and theislands of Bouvet, Deception and Livingston are sepa-rated geographically, and exhibit the lowest species rich-ness and diversity because they are distant from other re-gions and scarcely sampled. Many new records of knownor unknown species can be expected to be found in thefuture. Also, the rarefaction curve showed no sign ofapproaching an asymptote. Fifty-four species have beenfound, but total numbers estimated by species richnessstatistics (Chao2) suggest that at least 90 species of bry-ozoans will be found in the studied area as more samples arecollected.
Some studies have reported that Bouvet Island showssimilarity with the region of the Weddell Sea and has asimilar taxonomic richness (Barnes, 2006; Gutt et al., 2006)and our results for bryozoans are in agreement with that.This could be due to the existence of a permanent importof species by dispersion of marine benthic animals (Pielou,1975). Other studies have demonstrated that the generalcomposition and diversity of Bouvet Island were not lowercompared with the Patagonian shelf and only moderatelylower than the Antarctic continental shelf (Arntz et al.,2006; Gutt et al., 2006).
Bouvet Island and the region of Spiess Seamount arelocated at a particular position relative to the Antarctic Cir-cumpolar Current and may be in a potential zone of faunalexchange among the various regions and across the PolarFront (Linse, 2006). Larvae of different invertebrates fromthe Scotia Arc could reach Bouvet Island with the Circum-polar Current or from the Weddell Sea with the WeddellGyre (Barnes, 2006). One hypothesis is that Bouvet Islandcould have acted as a supply source to the Weddell Sea dur-ing the glacial maximum, when this island was not coveredby ice and adults of species could travel on kelp or pumicewith currents of the Weddell Sea Gyre (Barnes & Kuklinski,2010). The benthos of the Spiess Seamount is characterizedby being extremely poor (Arntz et al., 2006). However, thecluster analyses showed Deception Island to be more sepa-rated than the other islands (0% of similarity). San Vicenteet al. (1997) suggested that the reduced number of speciesat Deception Island was probably related to the last volcanicepisode and to the present acidity in the surface sediment.This could also explain the low bryozoan diversity. Also,the availability of hard substrates limits the abundance anddiversity of bryozoans (Hughes, 2001). Many filter feed-ers have a preference for an elevated position which mayenhance prey capture (Wildish & Kristmanson, 1997). De-ception Island has few hard substrates and this could affectbryozoan diversity. However, Barnes et al. (2008) reportedthat the undersurfaces of boulders from Deception Islandare dominated by bryozoans (cryptofauna).
Dow
nloa
ded
by [U
nive
rsity
of B
arce
lona
], [B
lanc
a Fi
guer
ola]
at 1
0:09
27
Mar
ch 2
012

Spatial patterns and diversity of bryozoan communities 121
The presence of a common bryozoan fauna betweenSouth America and the Western Antarctica can be explainedby their proximity during the Tertiary (Zinsmeister, 1979)and by the relatively similar environmental conditions re-lated to the Antarctic Circumpolar Current (Moyano, 1982).
Various studies support the role of the Scotia Arc as thelink between Antarctica and South America (e.g. Arntzet al., 2005). In our study, the South Shetland Islandsshowed a balanced composition between these two regions,thus supporting this hypothesis. Although Antarctic en-demism is very high, zoogeographically, there are clearrelationships between the fauna of Antarctica and thoseof South America, New Zealand and South Africa. Thesesimilarities could be traced back to the time when con-tinents were part of Gondwana. Also, in the Oligocene,a palaeobiogeographic connection between New Zealandand Patagonia may have existed, as shown by the presenceof common taxa, through the West Antarctic Rift System(Casadıo et al., 2010).
In Antarctica, a clear latitudinal cline in diversity, ori-ented north to south along the western Antarctic Peninsula,has been reported also for macroalgae and molluscs (Moe& deLaca, 1976; Schiaparelli et al., 2006). The existenceof a similar cline in bryozoan diversity has been foundin this study, with a higher richness at 70–73"S (Austasen,Kapp Norvegia and Vestkap) than at 54–70"S (Bouvet, Liv-ingston and Deception Islands, and Neumayer). However,the interpretation of these results must be treated with somecaution because they are based on the frequency of occur-rence rather than the abundance of species.
ConclusionsDuring the past two decades, research of the basic de-scriptive taxonomy and benthic ecology from the South-ern Ocean has improved greatly, demonstrating that thisarea is quite rich and diverse. However, some almost in-accessible regions, such as some parts of Antarctica, aredifficult to sample and the research on biodiversity is lim-ited by the lack of richness data for some groups, such as thebryozoans. Although the results of the analyses performedhere from new data on bryozoan biodiversity increase ourknowledge of species’ geographical ranges, they are stilllimited because samples were collected from only a fewareas. The scales of the latitudinal and the bathymetric gra-dients are large and the majority of marine studies haveonly sampled small areas. This causes an underestimationof diversity because it has been demonstrated that speciesrichness varies with increasing sampled area (Gray, 2000).The main limitation of this study is the use of data from dif-ferent methods of sampling. However, the bathymetric andgeographical distributions of the studied species contributeto a better understanding of Antarctic bryozoan diversityand distributions and it is relevant in the establishment ofbiogeographical patterns. More intensive sampling of bry-
ozoans along a wider geographical range is needed for theWeddell Sea and other Antarctic areas.
AcknowledgementsThe authors wish to thank Dr C. Lopez Fe de la Cuadra (Uni-versity of Sevilla) for his help in the identification of somespecies and Dr D. P. Gordon (National Institute of Waterand Atmospheric Research), Dr M. Zabala (University ofBarcelona) and Dr B. Berning (Linz Museum, Austria) fortheir help with bibliographic searches. Special thanks go toS. Taboada, J. Vazquez, L. Nunez-Pons and F.J. Cristobo forlaboratory support and to Dr R. Sarda and Dr A. Maceda fortheir reviews of the manuscript. Thanks are due to W. Arntzand the crew of the R/V of Polarstern (AWI) for invitingus to participate in the Antarctic cruise ANT XXI/2 (AWI,Bremerhaven, Germany), and M. Franch for helping withthe maps. Funding was provided by the Ministry of Sci-ence and Education of Spain through the ECOQUIM andACTIQUIM Projects (REN2002-12006EANT, REN2003-00545, CGL2004-03356/ANT and CGL2007-65453).
ReferencesARNTZ, W.E. & BREY, T. 2005. The expedition ANTARKTIS
XXI/2 (BENDEX) of RV “Polarstern” in 2003/2004. Berichtezur Polarforschung/Reports on Polar Research 503, 31–35.
ARNTZ, W.E., BREY, T. & GALLARDO, V.A. 1994. Antarctic zooben-thos. Oceanography and Marine Biology, Annual Review 32,241–304.
ARNTZ, W.E. & GUTT, J. 1997. The expedition ANTARKTISXIII/3 (EASIZ I) of “Polarstern” to the eastern Weddell Seain 1996. Berichte zur Polarforschung/Reports on Polar Re-search 249, 1–148.
ARNTZ, W.E., LOVRICH, G.A. & THATJE, S. 2005. TheMagellan–Antarctic connection: links and frontiers at highsouthern latitudes. Scientia Marina 69, 1–368.
ARNTZ, W.E., THATJE, S., LINSE, K., AVILA, C., BALLESTEROS,M., BARNES, D.K.A., COPE, T., CRISTOBO, F.J., DEBROYER,C., GUTT, J., ISLA, E., LOPEZ-GONZALEZ, P., MONTIEL, A.,MUNILLA, T., RAMOS ESPLA, A., RAUPACH, M., RAUSCHERT,M., RODRIGUEZ, E. & TEIXIDO, N. 2006. Missing link in theSouthern Ocean: sampling the marine benthic fauna of remoteBouvet Island. Polar Biology 29, 83–96.
BARNES, D.K.A. 2006. A most isolated benthos: coastal bryozoansof Bouvet Island. Polar Biology 29, 114–119.
BARNES, D.K.A. & De GRAVE, S. 2000. Biogeography of southernpolar bryozoans. Vie et Milieu 50, 261–274.
BARNES, D.K.A., LINSE, K., ENDERLEIN, P., SMALE, D., FRASER,K.P.P. & BROWN, M. 2008. Marine richness and gradients atDeception Island, Antarctica. Antarctic Science 20, 271–279.
BARNES, D.K.A. & KUKLINSKI, P. 2010. Bryozoans of the WeddellSea continental shelf, slope and abyss: did marine life colonizethe Antarctic shelf from deep water, outlying islands or in siturefugia following glaciations? Journal of Biogeography 37,1648–1656.
BARNES, D.K.A., KAISER, S., GRIFFITHS, H.J. & LINSE, K. 2009.Marine, intertidal, freshwater and terrestrial biodiversity ofan isolated polar archipelago. Journal of Biogeography 36,756–769.
Dow
nloa
ded
by [U
nive
rsity
of B
arce
lona
], [B
lanc
a Fi
guer
ola]
at 1
0:09
27
Mar
ch 2
012

122 B. Figuerola et al.
BARNES, D.K.A. & PECK, L.S. 2008. Vulnerability of Antarc-tic shelf biodiversity to predicted regional warming. ClimateResearch 37, 149–163.
BRANDT, A., ELLINGSEN, K., BRIX, S., BROKELAND, W. & MA-LYUTINA, M. 2005. Southern Ocean deep-sea isopod speciesrichness (Crustacea, Malacostraca): influences of depth, lati-tude and longitude. Polar Biology 28, 284–289.
BRANDT, A., GOODAY, J.A., BRANDAO, S.N., BRIX, S., BROKELAND,W., CEDHAGEN, T., CHOUDHURY, M. ET AL. 2007. First insightsinto the biodiversity and biogeography of the Southern Oceandeep sea. Nature 447, 307–311.
BRANDT, A. & HILBIG, B. 2004. ANDEEP (Antarctic benthicDEEP-sea biodiversity: colonization history and recent com-munity patterns) – a tribute to Howard L. Sanders. Deep-SeaResearch PT II 51, 14–16.
BREY, T., DAHM, C., GORNY, M., KLAGES, M., STILLER, M. &ARNTZ, W.E. 1996. Do Antarctic benthic invertebrates showan extended level of eurybathy? Antarctic Science 8, 3–6.
BRIGGS, A.H., WONDERLING, D.E. & MOONEY, C.Z. 1997. Pullingcost-effectiveness analysis up by its bootstraps: a non-parametric approach to confidence interval estimation. HealthEconomics Research Centre 6, 327–340.
CASADIO, S., NELSON, C., TAYLOR, P.D., GRIFFIN, M. & GOR-DON, D.P. 2010. West Antarctic Rift system: a possibleNew Zealand–Patagonia Oligocene paleobiogeographic link.Ameghiniana 47, 129–132.
CLARKE, A. & JOHNSTON, N.M. 2003. Antarctic marine benthicdiversity. In GIBSON, R.N. & ATKINSON, R.J.A., Eds., Oceano-graphy and Marine Biology: an Annual Review 41, 47–114.
CLARKE, K.R. 1993. Non-parametric multivariate analyses ofchanges in community structure. Austral Ecology 18,117–143.
COLWELL, R.K. & CODDINGTON, J.A. 1994. Estimating terrestrialbiodiversity through extrapolation. Philosophical Transac-tions of the Royal Society of London. Series B, BiologicalSciences 345, 101–118.
CUMMINGS, V., THRUSH, S., NORKKO, A., ANDREW, N., HEWITT, J.,FUNNELL, G. & SCHWARZ, A.-M. 2006. Accounting for localscale variability in benthos: implications for future assess-ments of latitudinal trends in the coastal Ross Sea. AntarcticScience 18, 633–644.
DE CACERES, M., FONT, X., GARCIA, R. & OLIVA, F. 2003. VE-GANA, un paquete de programas para la gestion y analisisde datos ecologicos. VII Congreso Nacional de la AsociacionEspanola de Ecologıa Terrestre. Barcelona, 1484–1497.
DE VOOGD, N.J., BECKING, L.E. & CLEARY, D.F.R. 2009. Spongecommunity composition in the Derawan Islands, NE Kaliman-tan, Indonesia. Marine Ecology Progress Series 396, 169–180.
FIGUEROLA, B., BALLESTEROS, M. & AVILA, C. 2012. Description ofa new species of Reteporella (Bryozoa Phidoloporidae) fromthe Weddell Sea (Antarctica) and possible functional mor-phology of avicularia. Acta Zoologica (doi: 10.1111/j.1463-6395.2011.00531.x).
FLORENCE, W.K., HAYWARD, P.J. & GIBBONS, M.J. 2007. Taxonomyof shallow-water Bryozoa from the west coast of South Africa.African Natural History 3, 1–58.
GERDES, D., ISLA, E., KNUST, R., MINTENBECK, K. & ROSSI, S.2008. Response of Antarctic benthic communities to distur-bance: first results from the artificial Benthic Disturbance Ex-periment on the eastern Weddell Sea Shelf, Antarctica. PolarBiology 31, 1469–1480.
GONTAR, V.I. 2008. Three new species of the genus Smittina fromthe Weddell Sea, Antarctic (Bryozoa: Cheilostomata: Smit-tinidae). Zoosystematica Rossica 17, 7–9.
GONTAR, V.I. & ZABALA, M. 2000. Bryozoa. Berichte zur Polar-forschung/Reports on Polar Research 372, 24–43.
GORDON, D.P. 1984. The marine fauna of New Zealand: Bry-ozoa: Gymnolaemata from the Kermadec Ridge. New ZealandOceanographic Institute Memoir 91, 1–198.
GORDON, D.P. 1986. The marine fauna of New Zealand:Bryozoa: Gymnolaemata (Ctenostomata and CheilostomataAnasca) from the western South Island continental shelfand slope. New Zealand Oceanographic Institute Memoir 95,1–121.
GRAY, J.S. 2000. The measurement of species diversity: an exam-ple from the continental shelf of Norway. Journal of Experi-mental Marine Biology and Ecology 250, 23–49.
GRIFFITHS, H.J. 2010. Antarctic marine biodiversity – what do weknow about the distribution of life in the Southern Ocean?PLoS ONE 5, e11683.
GRIFFITHS, H.J., BARNES, D.K.A. & LINSE, K. 2009. Towards ageneralized biogeography of the Southern Ocean benthos.Journal of Biogeography 36, 162–177.
GUTT, J., FRICKE, A., TEIXIDO, N., POTTHOFF, M. & ARNTZ, W.E. 2006. Mega-epibenthos at Bouvet Island (South Atlantic):a spatially isolated biodiversity hot spot on a tiny geologicalspot. Polar Biology 29, 97–105.
GUTT, J. & PIEPENBURG, D. 2003. Scale-dependent impact on di-versity of Antarctic benthos caused by grounding of icebergs.Marine Ecology Progress Series 253, 77–83.
GUTT, J., SIRENKO, B.I., ARNTZ, W.E., SMIRNOV, I.S. & De BROYER,C. 2000. Biodiversity of the Weddell Sea: macrozoobenthicspecies (demersal fish included) sampled during the expedi-tion ANT Xllll3 (EASIZ I) with RV “Polarstern”. Berichtezur Polarforschung/Reports on Polar Research 372.
HAMMER, O., HARPER, D. & RYAN, P. 2001. PAST: paleontologicalstatistics software for education and data analysis. Palaeon-tologia Electronica 4, 1–9.
HAYWARD, P.J. 1981. The Cheilostomata (Bryozoa) of the deepsea. Galathea Report 15, 21–68.
HAYWARD, P.J. 1995. Antarctic Cheilostomatous Bryozoa. Oxford:Oxford University Press.
HAYWARD, P.J. & WINSTON, J.E. 2011. Bryozoa collected by theUnited States Antarctic Research Program: new taxa and newrecords. Journal of Natural History 45, 37–38.
HUGHES, D.J. 2001. Quantitative analysis of a deep-water bry-ozoan collection from the Hebridean continental slope. Jour-nal of the Marine Biological Association of the UK 81,987–993.
KAISER, S., GRIFFITHS, H.J., BARNES, D.K.A., BRANDAO, S.N. &BRANDT, A. 2011. Is there a distinct continental slope faunain the Antarctic? Deep-Sea Research II 58, 91–104.
KREBS, C.J. 1999. Ecological Methodology. 2nd edition. BenjaminCummings, Menlo Park, California.
KUKLINSKI, P. & BARNES, D.K.A. 2009. A new genus and threenew species of Antarctic cheilostome. Polar Biology 32,1251–1259.
LAMPITT, R.S., BETT, B.J., KIRIAKOULAKIS, K., POPOVA, E.E.,RAGUENEAU, O., VANGRIESHEIM, A. & WOLFF, G.A. 2001. Ma-terial supply to the abyssal seafloor in the Northeast Atlantic.Progress in Oceanography 50, 27–63.
LAGAAIJ, R. 1973. Shallow-water Bryozoa from deep-sea sandsof the Principe Channel Gulf of Guinea. In: LARWOOD, G.P.,Ed., Living and Fossil Bryozoa. Academic Press, London, pp.139–151.
LEGENDRE, P. & LEGENDRE, L. 1998. Numerical Ecology, 2ndedition. Elsevier Science BV, Amsterdam.
LINSE, K. 2006. New records of shelled marine molluscs at Bou-vet Island and preliminary assessment of their biogeographicaffinities. Polar Biology 29, 120–127.
LINSE, K., BRANDT, A., BOHN, J.M., DANIS, B., BROYER, C.D.,EBBE, B., HETERIER, V., JANUSSEN, D., GONZALEZ, P.J.L.,
Dow
nloa
ded
by [U
nive
rsity
of B
arce
lona
], [B
lanc
a Fi
guer
ola]
at 1
0:09
27
Mar
ch 2
012

Spatial patterns and diversity of bryozoan communities 123
SCHULLER, M., SCHWABE, E. & THOMSON, M.R.A. 2007.Macro- and megabenthic assemblages in the bathyal andabyssal Weddell Sea (Southern Ocean). Deep Sea ResearchPart II 54, 1848–1863.
LINSE, K., BRANDT, A., HILBIG, B. & WEGENER, G. 2002. Composi-tion and distribution of suprabenthic fauna in the southeasternWeddell Sea and off King George Island. Antarctic Science14, 3–10.
LINSE, K., GRIFFITHS, H.J., BARNES, D.K.A. & CLARKE, A. 2006.Biodiversity and biogeography of Antarctic and sub-AntarcticMollusca. Deep Sea Research Part II 53, 985–1008.
LOPEZ-FE DE LA CUADRA, C.M. & GARCIA-GOMEZ, J.C. 2000. Thecheilostomate Bryozoa (Bryozoa: Cheilostomatida) collectedby the Spanish ‘Antartida 8611’ expedition to the Scotia Arcand South Shetland Islands. Journal of Natural History 34,755–772.
LOPEZ, G. & LIUZZI, M.G. 2008. A new Antarctic Osthimosia (Bry-ozoa, Cheilostomata, Celleporidae) with dimorphic zooids.Polar Biology 32, 47–51.
MARQUES, J.C., SALAS, F., PATRICIO, J., TEIXEIRA, H. & NETO, J.M.2009. Ecological Indicators for Coastal and Estuarine En-vironmental Assessment. WIT Press, University of Coimbra,Portugal.
MOE, R.L. & DELACA, T.E. 1976. Occurrence of macroscopicalgae along the Antarctic Peninsula. Antarctic Journal of theUnited States 11, 20–24.
MOYANO, H.I. 1982. Magellanic Bryozoa: some ecological andzoogeographical aspects. Marine Biology 67, 81–96.
MOYANO, H.I. 1999. Magellan Bryozoa: a review of the diversityand of the Subantarctic and Antarctic zoogeographical links.Scientia Marina 63, 219–226.
MOYANO, H.I. 2005. A Century of Antarctic Bryozoology sincethe Belgian Antarctic Expedition 1904, to the 13th IBA Inter-national Conference. Concepcion, Chile, 2004. Gayana 69,122–138.
MUNILLA, T. 2001. Synopsis of the Pycnogonids from Antarcticand Subantarctic waters. Polar Biology 24, 941–945.
O’BRIEN, P., GOODWIN, I., FORSBERG, C.F., COOPER, A., WHITE-HEAD, J. 2007. Late Neogene ice drainage changes in PrydzBay, East Antarctica and the interaction of Antarctic ice sheetevolution and climate. Paleogeography, Paleoclimatology, Pa-leoecology 245, 390–410.
PIELOU, E.C. 1975. Ecological diversity. Wiley, New York.REX, M.A., ETTER, R.J., MORRIS, J.S., CROUSE, J., MCCLAIN, C.R.,
JOHNSON, N.A., STUART, C., DEMING, J.W., THIES, R. & AVERY,R. 2006. Global bathymetric patterns of standing stock andbody size in the deep-sea benthos. Marine Ecology ProgressSeries 317, 1–8.
SAIZ-SALINAS, J.I., GARCIA, F.J., MANJON-CABEZA, M.E., PARAPAR-VEGAS, J., PENA-CANTERO, A., SAUCEDE, T., TRONCOSO, J.S. &RAMOS, A. 2008. Community structure and spatial distributionof benthic fauna in the Bellingshausen Sea (West Antarctica).Polar Biology 31, 735–743.
SALAS, F., NETO, J.M., BORJA, A. & MARQUES, J.C. 2004. Evalua-tion of the applicability of a marine biotic index to character-ize the status of estuarine ecosystems: the case of Mondegoestuary (Portugal). Ecological Indicators 4, 215–225.
SAN VICENTE, C., RAMOS, A., JIMENO, A. & SORBE, J.C. 1997.Suprabenthic assemblages from South Shetland Islands and
Bransfield Strait (Antarctica): preliminary observations onfaunistical composition, bathymetric and near-bottom distri-bution. Polar Biology 18, 415–422.
SCHIAPARELLI, S., LORZ, A-N. & CATTANEO-VIETTI. R. 2006. Di-versity and distribution of mollusc assemblages on the Victo-ria Land coast and the Balleny Islands, Ross Sea, Antarctica.Antarctic Science 18, 615–631.
SMALE, D. 2008. Spatial variability in the distribution of dom-inant shallow-water benthos at Adelaide Island, Antarctica.Journal of Experimental Marine Biology and Ecology 357,140–148.
SOLER I MEMBRIVES, A., TURPAEVA, E. & MUNILLA, T. 2009. Py-cnogonids of the Eastern Weddell Sea (Antarctica), with re-marks on their bathymetric distribution. Polar Biology 32,1389–1397.
STARMANS, A., GUTT, J. & ARNTZ, W.E. 1999. Mega-epibenthiccommunities in Arctic and Antarctic shelf areas. MarineBiology 135, 269–280.
TAYLOR, P.D., GORDON, D.P. & BATSON, P.B. 2004. Bathymetricdistributions of modern populations of some common Ceno-zoic Bryozoa from New Zealand, and paleodepth estima-tion. New Zealand Journal of Geology and Geophysics 47,57–69.
TEIXIDO, N., GARRABOU, J. & ARNTZ, W.E. 2002. Spatial pat-tern quantification of Antarctic benthic communities usinglandscape indices. Marine Ecology Progress Series 242,1–14.
TEIXIDO, N., GARRABOU, J., GUTT, J. & ARNTZ, W.E. 2004. Recov-ery in Antarctic benthos after iceberg disturbance: trends inbenthic composition, abundance and growth forms. MarineEcology Progress Series 278, 1–16.
TEJEDO, P., JUSTEL, A., BENAYAS, J., RICO, E., CONVEY, P. & QUE-SADA, A. 2009. Soil trampling in an Antarctic Specially Pro-tected Area: tools to assess levels of human impact. AntarcticScience 21, 229–236.
THATJE, S., HILLENBRAND, C.D. & LARTER, R. 2005. On the originof Antarctic marine benthic community structure. Trends inEcology and Evolution 20, 534–540.
THATJE, S. & MUTSCHKE, E. 1999. Distribution of abundance,biomass, production and productivity of macrozoobenthos inthe subAntarctic Magellan Province (South America). PolarBiology 22, 31–37.
WATERS, A.W. 1904. Bryozoa. Resultats du Voyage du S.Y. Belgicaen 1897–99. Zoologie, 114.
WILDISH, D. & KRISTMANSON, D. 1997. Benthic Suspension Feed-ers and Flow. Cambridge University Press, Cambridge.
ZABALA, M., OREJAS, C. & ALVA, V. 1997. Bryozoans of theWeddell Sea. Berichte zur Polarforschung/Reports on PolarResearch 249, 55–61.
ZINSMEISTER, W.J. 1979. Biogeographic significance of the lateMesozoic and Early Tertiary molluscan faunas of Sey-mour Island (Antarctic Peninsula) to the final break-up ofGondwana-land. In: GRAY, J. & BOUCOT, A.J., Eds., His-torical Biogeography. Tectonics and the Changing Environ-ment. Oregon State University Press, Corvallis, pp. 349–355.
Associate Editor: Peter Hayward
Dow
nloa
ded
by [U
nive
rsity
of B
arce
lona
], [B
lanc
a Fi
guer
ola]
at 1
0:09
27
Mar
ch 2
012