Spatial Distribution of Urban Primary Health Centers: A Study ......
10
International Journal of Research in Social Sciences Vol. 8 Issue 12, December 2018, ISSN: 2249-2496 Impact Factor: 7.081 Journal Homepage: http://www.ijmra.us , Email: [email protected] Double-Blind Peer Reviewed Refereed Open Access International Journal - Included in the International Serial Directories Indexed & Listed at: Ulrich's Periodicals Directory ©, U.S.A., Open J-Gage as well as in Cabell’s Directories of Publishing Opportunities, U.S.A 388 International Journal of Research in Social Sciences http://www.ijmra.us , Email: [email protected] Spatial Distribution of Urban Primary Health Centers: A Study of Chennai City M. Sujatha * Thulasi Mala* Abstract Understanding spatial distribution pattern of any geographic feature is considered as an important issue for physical planning, and decision making at spatial level. This paper measures spatial distribution of Urban Primary Health Centers in Chennai City Corporation. Different statistical techniques such s location quotient, health center – population ratio analysis of variance have been used to measure the spatial pattern of health centers in the city. The results reveal that the city has good number of health centers, but simultaneously these facilities are having indicated the uneven distribution at zonal level. Spatial distribution gives an insight to understand the associated locational disparities and help to plan accordingly to enhance the optimal utilization of resources. Key words: Healthcare Centers, Distribution, Population ratio, disparity * Department of Geography, Bharathi women’s College, Chennai, India
Transcript of Spatial Distribution of Urban Primary Health Centers: A Study ......
International Journal of Research in Social Sciences Vol. 8 Issue 12, December 2018, ISSN: 2249-2496 Impact Factor: 7.081
Journal Homepage: http://www.ijmra.us, Email: [email protected]
Double-Blind Peer Reviewed Refereed Open Access International Journal - Included in the International Serial
Directories Indexed & Listed at: Ulrich's Periodicals Directory ©, U.S.A., Open J-Gage as well as in Cabell’s
Directories of Publishing Opportunities, U.S.A
388 International Journal of Research in Social Sciences
http://www.ijmra.us, Email: [email protected]
Spatial Distribution of Urban Primary
Health Centers: A Study of Chennai City
M. Sujatha*
Thulasi Mala*
Abstract
Understanding spatial distribution pattern of any geographic feature is considered as an
important issue for physical planning, and decision making at spatial level. This paper measures
spatial distribution of Urban Primary Health Centers in Chennai City Corporation. Different
statistical techniques such s location quotient, health center – population ratio analysis of
variance have been used to measure the spatial pattern of health centers in the city. The results
reveal that the city has good number of health centers, but simultaneously these facilities are
having indicated the uneven distribution at zonal level. Spatial distribution gives an insight to
understand the associated locational disparities and help to plan accordingly to enhance the
optimal utilization of resources.
Key words: Healthcare Centers, Distribution, Population ratio, disparity
* Department of Geography, Bharathi women’s College, Chennai, India

ISSN: 2249-2496 Impact Factor: 7.081
389 International Journal of Research in Social Sciences
http://www.ijmra.us, Email: [email protected]
Introduction
Disparities in geographic access to health care result from the configuration of facilities,
population distribution, and the transportation infrastructure (Delamater et al., 2012). The
healthcare disparities arise due to problems in optimal health care functionalities such as
availability, accessibility and affordability (Steinwachs& Hughes 2008). GIS provides a wide
range of techniques and functions used for health services planning. In this concern Murad,
(2011) carried out the survey based study on Jeddah city of Kingdom of Saudi Arabia for the
demand and supply of health services. The author applied the GIS for the exploration of
accessibility to health centers covering three main analytical issues; i.e.; 1) health care supply; 2)
location and characteristics; 3) accessibility level to health services. Based on the above
mentioned analytical issues the growth and extent of health centers was delineated.
An inequality in health care accessibility depends on a number of factors it is therefore essential
to study the nature of the factors (social, geographical, or economic lines) which influences the
inequalities in access (Ricketts et al., 2001). Relationships between social disadvantages and
availability of the quality and quantity of General Practice services, the geographical access to
healthcare services were relatively equal across socioeconomic groups. However, the residents of
deprived areas are facing difficulty in obtaining evening and same-day appointments. They
conclude that services were available but more travel time and inadequate quality of services for
some underprivileged populations (Hyndman et al., 2001).
Spatial Disparity of Health Centers
Inequality in health services distribution has become a concern of challenge among different
countries (Mackenbach et al., 2008). Equality in distribution of health services and equal
accessibility to such services has become a major principle in most health systems (Horev et al.,
2004). Therefore, understanding the geographical distribution of health resources, equal
accessibility to such resources and improvement of them may lead to better planning to make
health services accessible to all.
The equal and fair distribution of resources in the health sector is one of the most important goals
to be achieved by health systems in every country all over the world. It is usually considered to

ISSN: 2249-2496 Impact Factor: 7.081
390 International Journal of Research in Social Sciences
http://www.ijmra.us, Email: [email protected]
be one of the main challenges and concerns of policy makers and managers in the health sector
(Nishiura et al., 2004). To evaluate the distribution of healthcare resources such as health centers
in the study area, Gini coefficient and Lorenz curve methods are being used. This will help to
understand the nature of accessibility to health services and assist in reducing the inequality in
the distribution of healthcare resources in Chennai city.
Fig. 1

ISSN: 2249-2496 Impact Factor: 7.081
391 International Journal of Research in Social Sciences
http://www.ijmra.us, Email: [email protected]
i. Location quotient
Location quotient provides the spatial concentration pattern of amenities in a particular area. The
location quotient is a method for comparing percentage share of a particular facility with its
percentage share of population. This method is applied in order to show the variation in the
concentration of health centers among zones of the city. For calculating the location quotient
(L.Q.) for health centers in a particular zone the following formula has been used.
𝐿.𝑄 = ℎ𝑧
𝑝𝑧 /
𝐻𝑐
𝑃𝑐
Where:
L.Q= Location Quotient
hz= Number of health centers in particular zone
pz= Population of the concerned zone
Hc= Number of health centers in the City
Pc= Population of the City
If the value of the quotient for a particular facility in all zones equals to 1, it indicates that the
facilities are equally distributed. If the value of the quotient for a particular facility in a particular
zone exceeds 1, it means that the concentration exceeds the city average. A value lesser than 1
indicates a deficiency in the service, while a value equal to l or close to l indicates self-
sufficiency (Isard, 1960).
The primary health care infrastructure provides the first level of contact between the population
and health care providers. Realizing its importance in the delivery of health services, the centre,
states and several government related agencies simultaneously started creating primary health
care infrastructure and manpower. This has resulted in substantial amount of duplication of the
infrastructure and manpower.
Table 1: Location Quotient of Urban Primary Health Centers
Zone Name Population No of UPHC Location Quotient
I Thiruvotriyur 289181 6 1.07
II Manali 132025 2 0.78
III Madhavaram 196067 4 1.06
IV Tondiarpet. 598547 15 1.30
V Royapuram 631747 13 1.07

ISSN: 2249-2496 Impact Factor: 7.081
392 International Journal of Research in Social Sciences
http://www.ijmra.us, Email: [email protected]
VI Thiru-vi.ka-Nagar 827891 14 0.88
VII Ambattur 478134 9 0.98
VIII Anna Nagar 759493 15 1.02
IX Teynampet 762634 16 1.09
X Kodambakkam 716514 15 1.08
XI Valasaravakkam 433077 5 0.60
XII Alandur 264497 6 1.18
XIII Adyar 534699 10 0.97
XIV Perungudi 325425 5 0.80
XV Sholinganallur 303600 5 0.85
Fig. 2
The table 1 and Fig. 1 depicts that the distribution of urban primary health centers varies at zonal
level. The degree of location quotient of UPHC’s is higher in eight zones (Anna Nagar,
Madhavaram, Royapuram, Thiruvotriyur, Kodambakkam, Teynampet, Alandur and Tondiarpet)
which is more than one, which indicates more number of UPHC’s are available to its population.

ISSN: 2249-2496 Impact Factor: 7.081
393 International Journal of Research in Social Sciences
http://www.ijmra.us, Email: [email protected]
While as, in two zones (Adyar and Ambattur) the location quotient value is close to 1, which
indicates that the facilities are self-sufficient to the population of the zone. In five zones of the
city (Valasaravakkam, Manali, Perungudi, Sholinganallur and Thiru-vi.ka-Nagar) the value is
less than 1, which reveals that the facilities are deficit to the population. The location quotient of
the zones indicates that higher the value more facilities are available to the population and vice
versa. While as the ward wise scenario indicates that location quotient 76 of wards is lea than
one and 9 wards have equal to one and location quotient of 116 wards is more than one.
ii. Health Center Population Ratio
As per the norms of National Health Mission (NHM) the population norms for the provision of
SC’s, PHC’s and CHC’s are suggested 5000, 30000, and 120000 people respectively in plain
areas, whereas in the Hilly/Tribal regions it is 3000, 20000 and 80000 respectively.
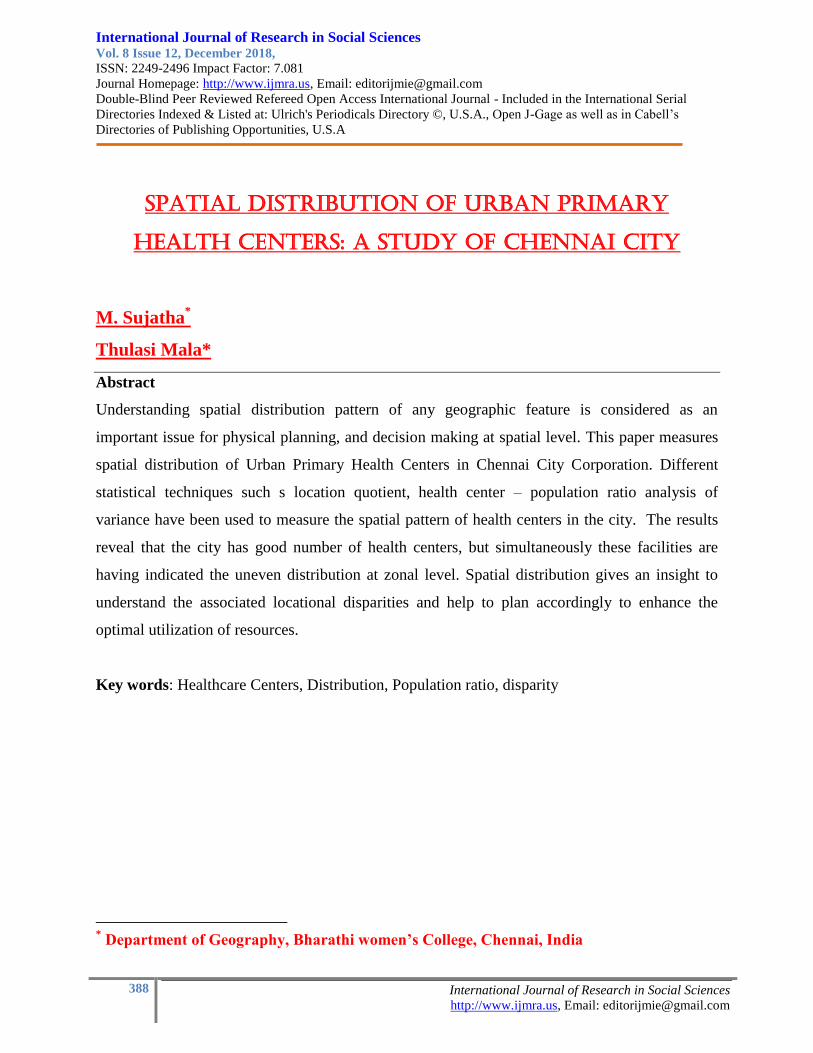
Table 2: Population – UPHC Ratio
Zone Name Population No of UPHC Ratio
I Thiruvotriyur 289181 6 48197
II Manali 132025 2 66013
III Madhavaram 196067 4 49017
IV Tondiarpet. 598547 15 39903
V Royapuram 631747 13 48596
VI Thiru-vi.ka-Nagar 827891 14 59135
VII Ambattur 478134 9 53126
VIII Anna Nagar 759493 15 50633
IX Teynampet 762634 16 47665
X Kodambakkam 716514 15 47768
XI Valasaravakkam 433077 5 86615
XII Alandur 264497 6 44083
XIII Adyar 534699 10 53470
XIV Perungudi 325425 5 65085
XV Sholinganallur 303600 5 60720
Total 7253531 140 51811
ISSN: 2249-2496 Impact Factor: 7.081
394 International Journal of Research in Social Sciences
http://www.ijmra.us, Email: [email protected]
Fig. 3

ISSN: 2249-2496 Impact Factor: 7.081
395 International Journal of Research in Social Sciences
http://www.ijmra.us, Email: [email protected]
Table:3 Analysis of Variance
Zone wise UPHC – Population Ratio Variance
Sum of Squares df Mean Square F Sig.
Between Groups 34060401795.224 14 2432885842.516 8.421 .000
Within Groups 53737138961.764 186 288909349.257
Total 87797540756.988 200
Zone Wise Health Center Variance
Sum of Squares df Mean Square F Sig.
Between Groups 13.186 14 .942 3.704 .000
Within Groups 47.301 186 .254
Total 60.488 200
The available PHC’s at zonal level are considered for assessing the nature of availability of
health services as per the Health Policy norms of the Government of India (Table.4). In Chennai
City there are 140 UPHC’s, and it is estimated that on an average each PHC in the district is
serving 51811 persons indicating better status in terms of ratio between the health centers and
population served by each UPHC. The high concentration of UPHC’s is observed in Tondiarpet,
Alandur, Teynampet, Kodambakkam, Thiruvotriyur, Royapuram and Madhavaram (75) serving
the population at the ratio of below 5000; hence there is lower population ratio than the city
average. Anna Nagar, Ambattur, Adyar and Thiru-vi.ka-Nagar zones have medium concentration
of health centers (48 health centers) in total with the population of 2600217 thus serving the
population at the ratio of from 5000 to 6000. A less number of health centers are found in
Sholinganallur, Perungudi, Manali and Valasaravakkam (17 health centers) in total and serving
the population at the ratio of above 6000 which is higher than NHM norms
This reveals that the UPHC’s in zone II, XI, XIV and XV are under more pressure than other
zones. But when we compare the UPHC population ratio in zones with the NHM it is less than
the prescribed norms. Hence the people in these zones are having good healthcare facilities. The
analysis of variance (Table) of UPHC and population ratio and also the health centers
distribution among the zones varies significantly (P< 0.1).

ISSN: 2249-2496 Impact Factor: 7.081
396 International Journal of Research in Social Sciences
http://www.ijmra.us, Email: [email protected]
Conclusion
Health service facilities in urban area context are an important geographic feature as they are
providing one of the basic services to city dwellers. However, the city dwellers are not always
getting equal accessibility to health services for several reasons, and locational disparity is one of
them. Spatial distribution gives an insight to understand the associated locational disparities and
help to plan accordingly. The above analysis reveals that the people of the city have good
availability of health centers as a whole as the serving population ratio of UPHC’s is according
to NHM norms. Though the facilities are good enough to serve the population of the city, but
while analyzing the spatial pattern of these facilities at zonal level using location quotient, the
results revealed that there is unequal distribution of urban primary health centers.
References
Delamater, P. L., Messina, J. P., Shortridge, A. M., & Grady, S. C. (2012).Measuring
geographic access to health care: raster and network-based methods.International journal
of health geographics, 11(1), 15.
Horev, T., Pesis-Katz, I., &Mukamel, D. B. (2004).Trends in geographic disparities in
allocation of health care resources in the US.Health policy, 68(2), 223-232.
Hyndman, J. C., & Holman, C. A. J. (2001).Accessibility and spatial distribution of
general practice services in an Australian city by levels of social disadvantage. Social
Science & Medicine, 53(12), 1599-1609.
Isard, W. (1960), Methods of Regional Analysis‖ M.I.T Press, 123-126
Mackenbach, J. P., Stirbu, I., Roskam, A. J. R., Schaap, M. M., Menvielle, G., Leinsalu,
M., &Kunst, A. E. (2008). Socioeconomic inequalities in health in 22 European
countries. New England Journal of Medicine, 358(23), 2468-2481.
Murad, A. A. (2011). Creating a geographical information systems-based spatial profile
for exploring health services supply and demand. American Journal of Applied Sciences,
8(6), 644-651
Nishiura, H., Barua, S., Lawpoolsri, S., Kittitrakul, C., Leman, M. M., Maha, M. S.,
&Muangnoicharoen, S. (2004). Health inequalities in Thailand: geographic distribution
of medical supplies in the provinces. Southeast Asian J Trop Med Public Health.2004;
35(3), 735–40.

ISSN: 2249-2496 Impact Factor: 7.081
397 International Journal of Research in Social Sciences
http://www.ijmra.us, Email: [email protected]
Ricketts, T. C., Randolph, R., Howard, H. A., Pathman, D., & Carey, T. (2001).
Hospitalization rates as indicators of access to primary care. Health & place, 7(1), 27-38.
Steinwachs, D. M., & Hughes, R. G. (2008). Health services research: Scope and
significance.