Spatial distribution of Culex mosquito abundance and ...
13
RESEARCH ARTICLE Spatial distribution of Culex mosquito abundance and associated risk factors in Hanoi, Vietnam Tuyen V. Ha ID 1 , Wonkook Kim ID 2 , Thang Nguyen-Tien ID 3 , Johanna Lindahl ID 3,4,5 , Hung Nguyen-Viet 3 , Nguyen Quang Thi 1 , Huy Van Nguyen 1 , Fred Unger 3 , Hu Suk Lee ID 3 * 1 Faculty of Resources Management, Thai Nguyen University of Agriculture and Forestry (TUAF), Thai Nguyen, Vietnam, 2 Pusan National University, Busan, South Korea, 3 International Livestock Research Institute (ILRI), Hanoi, Vietnam, 4 Department of Medical Biochemistry and Microbiology, Uppsala University, Uppsala, Sweden, 5 Department of Clinical Sciences, Swedish University of Agricultural Sciences, Uppsala, Sweden * [email protected] Abstract Japanese encephalitis (JE) is the major cause of viral encephalitis (VE) in most Asian- Pacific countries. In Vietnam, there is no nationwide surveillance system for JE due to lack of medical facilities and diagnoses. Culex tritaeniorhynchus, Culex vishnui, and Culex quin- quefasciatus have been identified as the major JE vectors in Vietnam. The main objective of this study was to forecast a risk map of Culex mosquitoes in Hanoi, which is one of the most densely populated cities in Vietnam. A total of 10,775 female adult Culex mosquitoes were collected from 513 trapping locations. We collected temperature and precipitation informa- tion during the study period and its preceding month. In addition, the other predictor vari- ables (e.g., normalized difference vegetation index [NDVI], land use/land cover and human population density), were collected for our analysis. The final model selected for estimating the Culex mosquito abundance included centered rainfall, quadratic term rainfall, rice cover ratio, forest cover ratio, and human population density variables. The estimated spatial dis- tribution of Culex mosquito abundance ranged from 0 to more than 150 mosquitoes per 900m 2 . Our model estimated that 87% of the Hanoi area had an abundance of mosquitoes from 0 to 50, whereas approximately 1.2% of the area showed more than 100 mosquitoes, which was mostly in the rural/peri-urban districts. Our findings provide better insight into understanding the spatial distribution of Culex mosquitoes and its associated environmental risk factors. Such information can assist local clinicians and public health policymakers to identify potential areas of risk for JE virus. Risk maps can be an efficient way of raising public awareness about the virus and further preventive measures need to be considered in order to prevent outbreaks and onwards transmission of JE virus. PLOS Neglected Tropical Diseases | https://doi.org/10.1371/journal.pntd.0009497 June 21, 2021 1 / 13 a1111111111 a1111111111 a1111111111 a1111111111 a1111111111 OPEN ACCESS Citation: Ha TV, Kim W, Nguyen-Tien T, Lindahl J, Nguyen-Viet H, Thi NQ, et al. (2021) Spatial distribution of Culex mosquito abundance and associated risk factors in Hanoi, Vietnam. PLoS Negl Trop Dis 15(6): e0009497. https://doi.org/ 10.1371/journal.pntd.0009497 Editor: Roberto Barrera, Centers for Disease Control and Prevention, Puerto Rico, UNITED STATES Received: February 21, 2021 Accepted: May 21, 2021 Published: June 21, 2021 Copyright: © 2021 Ha et al. This is an open access article distributed under the terms of the Creative Commons Attribution License, which permits unrestricted use, distribution, and reproduction in any medium, provided the original author and source are credited. Data Availability Statement: The data is available at https://github.com/tuyenhavan/Mosquito_ILRI. Funding: This study was supported by the Southeast Asia One Health University Network (SEAOHUN); and the United States Agency for International Development (USAID). In addition, this study was also supported by the CGIAR Research Program on Agriculture for Nutrition and Health (A4NH), which is led by the International Food Policy Research Institute (IFPRI); and the
Transcript of Spatial distribution of Culex mosquito abundance and ...
RESEARCH ARTICLE
Spatial distribution of Culex mosquito
abundance and associated risk factors in
Hanoi, Vietnam
Tuyen V. HaID1, Wonkook KimID
2, Thang Nguyen-TienID3, Johanna LindahlID
3,4,5,
Hung Nguyen-Viet3, Nguyen Quang Thi1, Huy Van Nguyen1, Fred Unger3, Hu Suk LeeID3*
1 Faculty of Resources Management, Thai Nguyen University of Agriculture and Forestry (TUAF), Thai
Nguyen, Vietnam, 2 Pusan National University, Busan, South Korea, 3 International Livestock Research
Institute (ILRI), Hanoi, Vietnam, 4 Department of Medical Biochemistry and Microbiology, Uppsala University,
Uppsala, Sweden, 5 Department of Clinical Sciences, Swedish University of Agricultural Sciences, Uppsala,
Sweden
Abstract
Japanese encephalitis (JE) is the major cause of viral encephalitis (VE) in most Asian-
Pacific countries. In Vietnam, there is no nationwide surveillance system for JE due to lack
of medical facilities and diagnoses. Culex tritaeniorhynchus, Culex vishnui, and Culex quin-
quefasciatus have been identified as the major JE vectors in Vietnam. The main objective of
this study was to forecast a risk map of Culex mosquitoes in Hanoi, which is one of the most
densely populated cities in Vietnam. A total of 10,775 female adult Culex mosquitoes were
collected from 513 trapping locations. We collected temperature and precipitation informa-
tion during the study period and its preceding month. In addition, the other predictor vari-
ables (e.g., normalized difference vegetation index [NDVI], land use/land cover and human
population density), were collected for our analysis. The final model selected for estimating
the Culex mosquito abundance included centered rainfall, quadratic term rainfall, rice cover
ratio, forest cover ratio, and human population density variables. The estimated spatial dis-
tribution of Culex mosquito abundance ranged from 0 to more than 150 mosquitoes per
900m2. Our model estimated that 87% of the Hanoi area had an abundance of mosquitoes
from 0 to 50, whereas approximately 1.2% of the area showed more than 100 mosquitoes,
which was mostly in the rural/peri-urban districts. Our findings provide better insight into
understanding the spatial distribution of Culex mosquitoes and its associated environmental
risk factors. Such information can assist local clinicians and public health policymakers to
identify potential areas of risk for JE virus. Risk maps can be an efficient way of raising public
awareness about the virus and further preventive measures need to be considered in order
to prevent outbreaks and onwards transmission of JE virus.
PLOS Neglected Tropical Diseases | https://doi.org/10.1371/journal.pntd.0009497 June 21, 2021 1 / 13
a1111111111
a1111111111
a1111111111
a1111111111
a1111111111
OPEN ACCESS
Citation: Ha TV, Kim W, Nguyen-Tien T, Lindahl J,
Nguyen-Viet H, Thi NQ, et al. (2021) Spatial
distribution of Culex mosquito abundance and
associated risk factors in Hanoi, Vietnam. PLoS
Negl Trop Dis 15(6): e0009497. https://doi.org/
10.1371/journal.pntd.0009497
Editor: Roberto Barrera, Centers for Disease
Control and Prevention, Puerto Rico, UNITED
STATES
Received: February 21, 2021
Accepted: May 21, 2021
Published: June 21, 2021
Copyright: © 2021 Ha et al. This is an open access
article distributed under the terms of the Creative
Commons Attribution License, which permits
unrestricted use, distribution, and reproduction in
any medium, provided the original author and
source are credited.
Data Availability Statement: The data is available
at https://github.com/tuyenhavan/Mosquito_ILRI.
Funding: This study was supported by the
Southeast Asia One Health University Network
(SEAOHUN); and the United States Agency for
International Development (USAID). In addition,
this study was also supported by the CGIAR
Research Program on Agriculture for Nutrition and
Health (A4NH), which is led by the International
Food Policy Research Institute (IFPRI); and the

Author summary
Our study was to estimate the spatial distribution of Culex mosquitoes in Hanoi, which is
one of the most densely populated cities in Vietnam. Our findings may provide better
insight into understanding the spatial distribution of Culex mosquitoes and its associated
environmental risk factors. Such information can assist local clinicians and public health
policymakers to identify the potential areas of risk for JE virus.
Introduction
Japanese encephalitis (JE) is the major cause of viral encephalitis (VE) in most Asian-Pacific
countries. It is a vector-borne flavivirus, in the same viral family, Flaviviridae, as dengue, yel-
low fever and West Nile virus [1–3]. About 3.1 billion people live in endemic areas with an
estimated number of 50,000–68,000 clinical cases and 10,000–15,000 deaths annually [4,5].
Most human infections are asymptomatic, or very mild febrile disease, but when clinical
encephalitis occurs, the death rate could reach 30%, and another 30–50% of patients suffer
from permanent neurologic or psychiatric sequelae [4,6].
In Vietnam, the JE virus was first reported in 1951 and became a serious public health issue
across the country, particularly in the northern part [7]. Currently, there is no nationwide sur-
veillance system for JE due to lack of medical facilities and diagnoses, but there is national sur-
veillance data available for viral encephalitis (VE) [8]. Some studies found that JE cases
accounted for 12–72% of total VE cases, therefore VE cases can be considered to be a proxy for
JE cases [8–10]. Before the vaccination was scaled out, the Red River Delta region (including
Hanoi) had the highest JE incidence rate with an estimated 22 cases /100,000 people [8]. Culextritaeniorhynchus, Culex vishnui, and Culex quinquefasciatus have been identified as the major
JE vectors in Vietnam, of which the two first were mosquitoes associated with rice production,
pig farms and wastewater [11–13]. In Hanoi, a study between 2006 and 2008 found the most
Culex mosquitoes in rural districts of the city, and also isolated three JE virus strains from mos-
quitoes in the southern and western parts of Hanoi [14]. Pigs are a major amplifying host for
the JE virus, and since they are commonly raised in the backyard farms, the transmission of
the virus to humans is facilitated [5,15]. A study conducted in Hanoi showed that approxi-
mately 60% of pig samples from slaughterhouses were seropositive [16].
Remote sensing, with recent advances in sensor capability and open-access data policies,
can provide great opportunities for public health researchers and scientists to predict and map
the abundance of mosquitoes or disease risks [17–19]. By linking data from the known mos-
quito abundance locations with their associated environmental and socio-economic informa-
tion, researchers can estimate the mosquito species distribution in other less well known
locations [20]. Several studies have been conducted to map the abundance of different Culexspecies and potential JE transmission risk areas worldwide [21–23]. Studies suggest that the
Asia, including the Southeast Asia region have the highest risk of Culex mosquitoes whereas
approximately 1.7 billion people are estimated to live in areas with a high risk of encephalitis
[24–26].
Previous studies have been designed to estimate the mosquito distribution at the regional
and global level, which may not be suitable for the local context. In Vietnam, some studies
have sought to understand the ecology of JE vectors and Culex mosquitoes [12,27,28]. How-
ever, to our knowledge, no studies have been conducted to estimate the spatial distribution of
Culex mosquito abundance in Vietnam using remote sensing data. Therefore, the main objec-
tive of this study was to estimate the spatial distribution of Culex mosquitoes in Hanoi, which
PLOS NEGLECTED TROPICAL DISEASES Culex mosquito, risk map, forecast, remote sensing, Hanoi, Vietnam
PLOS Neglected Tropical Diseases | https://doi.org/10.1371/journal.pntd.0009497 June 21, 2021 2 / 13
“Metropolitan Mosquitoes Project,” which is
funded by the Swedish Research Council for
Environment, Agricultural Sciences and Spatial
Planning (Formas, grant number 2016-00364). The
funders had no role in study design, data collection
and analysis, decision to publish, or preparation of
the manuscript.
Competing interests: The authors have declared
that no competing interests exist.
is one of the most densely populated cities in Vietnam. This information can be helpful for
local health authorities and clinicians to implement better JE control programs by identifying
the potential hotspot areas for the virus.
Materials and methods
Ethics statement
This study was approved by the Institutional Review Board for Biomedical Research of Hanoi
University of Public Health No. 406/2018 YTCC-HD3.
Study area and mosquito data
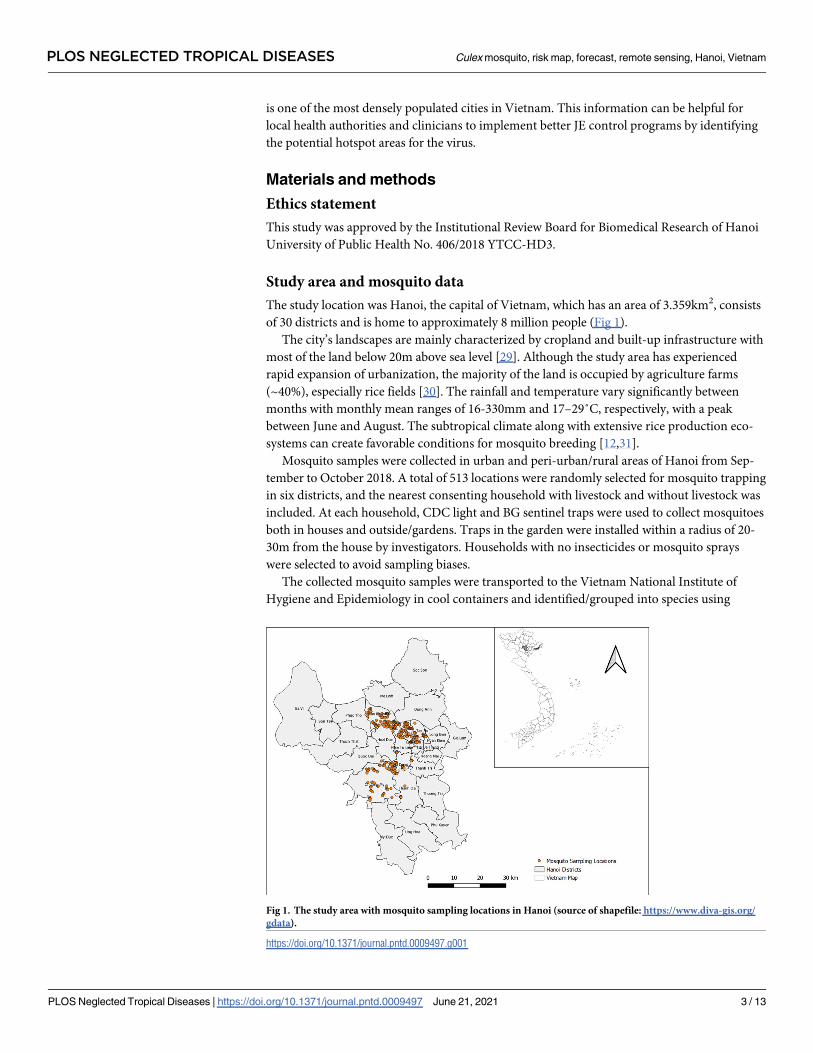
The study location was Hanoi, the capital of Vietnam, which has an area of 3.359km2, consists
of 30 districts and is home to approximately 8 million people (Fig 1).
The city’s landscapes are mainly characterized by cropland and built-up infrastructure with
most of the land below 20m above sea level [29]. Although the study area has experienced
rapid expansion of urbanization, the majority of the land is occupied by agriculture farms
(~40%), especially rice fields [30]. The rainfall and temperature vary significantly between
months with monthly mean ranges of 16-330mm and 17–29˚C, respectively, with a peak
between June and August. The subtropical climate along with extensive rice production eco-
systems can create favorable conditions for mosquito breeding [12,31].
Mosquito samples were collected in urban and peri-urban/rural areas of Hanoi from Sep-
tember to October 2018. A total of 513 locations were randomly selected for mosquito trapping
in six districts, and the nearest consenting household with livestock and without livestock was
included. At each household, CDC light and BG sentinel traps were used to collect mosquitoes
both in houses and outside/gardens. Traps in the garden were installed within a radius of 20-
30m from the house by investigators. Households with no insecticides or mosquito sprays
were selected to avoid sampling biases.
The collected mosquito samples were transported to the Vietnam National Institute of
Hygiene and Epidemiology in cool containers and identified/grouped into species using
Fig 1. The study area with mosquito sampling locations in Hanoi (source of shapefile: https://www.diva-gis.org/
gdata).
https://doi.org/10.1371/journal.pntd.0009497.g001
PLOS NEGLECTED TROPICAL DISEASES Culex mosquito, risk map, forecast, remote sensing, Hanoi, Vietnam
PLOS Neglected Tropical Diseases | https://doi.org/10.1371/journal.pntd.0009497 June 21, 2021 3 / 13

taxonomic keys [11]. The number of Culex mosquitoes was counted by experts at each sam-
pling location. Since all sampling locations were randomly selected, some traps were installed
very close to each other. In this case, the total number of counted mosquitoes was aggregated
as one point if more than two traps were located within the same pixel (30m). The analyses
considered only female mosquitoes identified as Cx. tritaeniorhynchus, Cx. quinquefasciatus,and Cx. vishnui since these are the primary vectors for JE virus transmission [32].
Environmental and socio-economic predictor variables
The survival and distribution of mosquitoes species can be significantly influenced by climate
and socio-economic conditions [33,34]. For meteorological data, we collected temperature
and precipitation information during the study period and its preceding month. In addition,
the other predictor variables (e.g., normalized difference vegetation index [NDVI], land use/
land cover and human population density), were collected for our analysis. The NDVI repre-
sents vegetation health and its value ranges from -1 to +1, a higher NDVI value means denser
and healthier vegetation and vice versa [35]. All the collected data was pre-processed with the
same study extent, resampled to the same spatial resolution of Landsat 8 (30m pixel size), and
then converted to UTM zone 48N.
Specifically, we used eight-day average MODIS land surface temperature data from NASA’s
Land Processes Distributed Active Archive Center (https://lpdaac.usgs.gov/), and precipitation
data from the Climate Hazards Center (https://chc.ucsb.edu/data/chirps). Data included mean
temperature (September and October), previous-month temperature (August), mean total
rainfall (September and October), and previous-month rainfall (August). The 30m land cover/
land-use layer with five classes (rice, urban/built-up, water body, forest and other agricultural
land) was obtained from a previous study [36]. In addition, the human population density
layer for 2015 was downloaded from the NASA SEDAC at the Center for International Earth
Science Information Network while the mean NDVI was calculated from Landsat 8 (red and
near-infrared bands) data (https://earthexplorer.usgs.gov/) during the study period.
Previous research suggested that mosquitoes are active within hundreds of meters (e.g. 200-
300m) from their nearest breeding sites [37,38]. Also, most mosquito-borne diseases were
observed among people living near mosquito breeding habitats [39]. Thus, we computed the
cover ratios for rice, forest, and water at 250m buffer radius for every pixel whereas meteoro-
logical, human population and NDVI layers were taken as an average. Therefore, a total of 9
potential risk factors were used for developing a model.
Data analysis
A Poisson regression model has been commonly used for countable data, which assumes the
equality between the sample mean and variance [40,41]. However, our mosquito count data
showed evidence of overdispersion (variance is greater than the mean). An alternative
approach for over-dispersed count data is negative binomial regression (NBR) because it has
an extra parameter (alpha [α]) to account for the over-dispersion [42, 43].
Given Y is the response variable (Y2{0,1,2,3,4. . .}), representing the number of mosquitoes
at a certain location, having x1, x2, x3, . . .., xi with predictor variables (e.g. environmental and
socio-economic variables). The NBR distribution can be expressed as follow [44, 45]:
PrðY ¼ yijmi; aÞ ¼Gðyi þ a� 1Þ
Gða� 1ÞGðyi þ 1Þð
1
1þ amiÞa� 1
ðami
1þ amiÞyi
PLOS NEGLECTED TROPICAL DISEASES Culex mosquito, risk map, forecast, remote sensing, Hanoi, Vietnam
PLOS Neglected Tropical Diseases | https://doi.org/10.1371/journal.pntd.0009497 June 21, 2021 4 / 13

Model mean and variance are EðyiÞ ¼ mi ¼ eb0þb1x1þb2xiþ���þbixi and varðyiÞ ¼ mþ am2,
respectively, and α (α� 0) is the dispersion parameter. To minimize the overfitting problem,
our data was randomly split into two parts, training (80%) and testing (20%).
A shapefile is a digital vector storage format for storing geometric location and associated
attribute information. We used the point vector shapefile (https://www.diva-gis.org/gdata)
with mosquito count data in order to extract environmental and socio-economic values from
associated raster layers using raster package in R [46]. We used “glmmTMB” package in R to
evaluate the association between mosquito abundance and environmental predictor variables.
The glmmTMB package is used to fit generalized linear mixed models with various extensions
for random effects and non-normal data such as negative binomial regression as described by
Magnusson et al [47]. For variable screening, all predictor variables were examined for their
collinearity using Pearson’s correlation test and any variables with a Pearson’s coefficient <0.7
were considered in the models. If two or more variables were strongly correlated, we consid-
ered their biological relevance with mosquitoes. In addition, the effects of linearity between
potential predictor variables and mosquito abundance were explored using loess smoothed
curves. If any nonlinearity was observed, a quadratic function of the predictor variable was
explored and retained if p-value <0.05.
Because of nonlinearity between mosquito abundance and total mean rainfall, we created
two new variables (1. centered variable, 2. quadratic term variable) from the current month
rainfall (September-October). The centered variable was computed by subtracting the rainfall
mean across mosquito sampling locations while the quadratic term variable was the square of
the centered variable. In addition, a random effect for sampling locations (rural/peri-urban
and urban) was included to take into account the variability among trapping locations. Vari-
ables with p-value < 0.05 were considered in the final model. The incidence rate ratio (IRR)
was calculated for the final NBR model.
The performance of the final fitted model was assessed using root mean square error
(RMSE) and mean absolute error (MAE). The RMSE is the square root of the average of
squared differences between predicted values and observed values while the MAE is the aver-
age of absolute differences between predicted values and observed values [48,49]. Finally, three
additional raster layers (centered, quadratic term and random effect layers) were created and
stacked with other relevant layers, and then the abundance of mosquitoes was estimated with
stacked layers from the final model. All data analysis was conducted in R version 4.0.1 while
risk maps were created through QGIS version 3.16.
Results
Mosquito descriptive statistics
A total of 10,775 female adult Culex mosquitoes were collected from 513 trapping locations.
The most dominant Culex mosquitoes were Cx. tritaeniorhynchus (80%), followed by Cx. quin-quefasciatus (10.39%) and Cx. vishnui (9.61%). Also, our mosquito data showed that nearly
97% of the samples had less than 150 cumulative counts per location during the study period
whereas approximately 2% of trapping locations had a cumulative count of more than 200
mosquitoes (Fig 2, left).
A total of 6,361 mosquitoes were obtained in Ha Dong suburb district, accounting for 59%
of the total while Ba Dinh (urbanized district) generated 44 collected mosquitoes (0.4%) (Fig 2,
right). Overall, the rural/ peri-urban districts had a much higher number of mosquitoes than
densely urban areas.
PLOS NEGLECTED TROPICAL DISEASES Culex mosquito, risk map, forecast, remote sensing, Hanoi, Vietnam
PLOS Neglected Tropical Diseases | https://doi.org/10.1371/journal.pntd.0009497 June 21, 2021 5 / 13

Final NBR models and estimated spatial distribution of Culex abundance
Overall, the NDVI value and temperature (lag1) had a strong correlation with bi-monthly tem-
perature whereas other remaining variables were less correlated (Table 1). The final model
selected for estimating the Culex mosquito abundance included centered rainfall, quadratic
term rainfall, rice cover ratio, forest cover ratio, and human population density variables. The
NBR model showed that there was an increase in the mosquito abundance as total monthly
rainfall rose to its mean value (220mm), but it dropped gradually as the precipitation increased
beyond its mean value (Table 2). In addition, a percentage increase in rice cover ratio corre-
sponded to an increase in the mosquito abundance by 3.78 times. In contrast, a 1% increase in
forest cover ratio corresponded to a reduction in the mosquito abundance by 97.5%. Similarly,
a unit increase in human population density (per km2) had resulted in 1.1% reduction of the
mosquito population. Our final model showed that the RMSE and MAE were 24.15 and 16.83,
respectively.
Fig 2. Distribution and mosquito sampling count from six districts in Hanoi.
https://doi.org/10.1371/journal.pntd.0009497.g002
Table 1. Pearson’s correlation coefficient (r) among predictor variables.
Variables Forest cover
ratio (%)
Rice cover
ratio (%)
Water cover
ratio (%)
Temperature
(lag1, oC)
Bi-monthly
temperature (oC)
Rainfall
(lag1, mm)
Bi-monthly
rainfall (mm)
NDVI Human population
density (per km2)
Forest cover ratio 1
Rice cover ratio 0.24 1
Water cover ratio -0.13 0.10 1
Temperature -0.23 -0.51 -0.14 1
Bi-monthly
temperature
-0.29 -0.38 -0.16 0.84 1
Rainfall 0.07 0.24 -0.03 -0.25 -0.14 1
Bi-monthly
rainfall
-0.18 0.01 -0.23 0.30 0.57 0.14 1
NDVI 0.27 0.47 -0.03 -0.7 -0.48 0.37 -0.05 1
Human
population
density
-0.21 -0.46 -0.06 0.62 0.35 -0.52 -0.06 -0.56 1
Lag1 = preceding month; bi-monthly = during study period
https://doi.org/10.1371/journal.pntd.0009497.t001
PLOS NEGLECTED TROPICAL DISEASES Culex mosquito, risk map, forecast, remote sensing, Hanoi, Vietnam
PLOS Neglected Tropical Diseases | https://doi.org/10.1371/journal.pntd.0009497 June 21, 2021 6 / 13

The estimated spatial distribution of Culex mosquito abundance ranged from 0 to 150, and
the colors ranged from purple-blue for areas with low to orange-red berry for areas with high
abundance of the mosquitoes (Fig 3).
The abundance of Culex species was mainly observed in rural and agriculture areas,
whereas the central districts of Hanoi and forest areas showed the lowest abundance. Notice-
ably, some areas in the northwest region had the highest mosquito abundance. Our model esti-
mated that 87% of the Hanoi area had an abundance of mosquitoes from 0 to 50, whereas
approximately 1.2% of the area showed more than 100 mosquitoes, which was mostly in the
rural/peri-urban districts.
Table 2. Final NBR model with accuracy and associated risk factors of Culex mosquito abundance in Hanoi.
Variables Adjusted IRRs 95% CI P-value RMSE MAE
Bi-monthly total mean rainfall (mm, centering variable) 1.0492 1.021–1.077 <0.0004
Bi-monthly total mean rainfall (mm, quadratic term) 1.001 1.000–1.002 0.0475
Rice cover ratio (%) 3.778 1.549–9.204 0.0034
Forest cover ratio (%) 0.0249 0.003–0.105 <0.0001
Human population density (person per km2) 0.989 0.986–0.991 <0.0001
Accuracy 24.15 16.83
CI = confidence interval; IRR = incidence rate ratio; NBR = negative binomial regression; Bi-monthly = study period (Sep-Oct)
https://doi.org/10.1371/journal.pntd.0009497.t002
Fig 3. Estimated map of the Culex mosquito abundance in Hanoi (source of shapefile: https://www.diva-gis.org/
gdata).
https://doi.org/10.1371/journal.pntd.0009497.g003
PLOS NEGLECTED TROPICAL DISEASES Culex mosquito, risk map, forecast, remote sensing, Hanoi, Vietnam
PLOS Neglected Tropical Diseases | https://doi.org/10.1371/journal.pntd.0009497 June 21, 2021 7 / 13

Discussion
This study was the first evaluation of the spatial abundance of Culex mosquitoes using remote
sensing data in Hanoi, Vietnam. We found that the rice paddy cover was positively associated
with the spatial distribution of mosquito abundance, which was similar to findings from previ-
ous studies, suggesting that the rice crop ecosystem is the most important breeding habitat for
the Culex mosquitoes, and expanding rice cultivation is positively associated with JE virus.
[12,13,50]. These results are similar to those of an earlier study that observed Culex mosquitoes
in the rice fields and stagnant water habitats in northern Vietnam [12]. In addition, rainfall
was identified as the main driver of Culex mosquito abundance in areas with rainfall level
below 220mm, then gradually decreased at rainfall level higher than 220mm annually. A Chi-
nese study found that a precipitation between 80mm and 120mm was suitable for mosquito
growing and breeding. Other studies have suggested that locations with higher precipitation
were more suitable for mosquitoes with JE virus, but excessive rainfall such as typhoons could
wash away mosquitos’ habitats and larvae [51,52].
However, this study found that high forest cover had a negative association with mosquito
abundance. One study, in Thailand, suggested that mosquitoes were least likely to survive in
dense forests because of unfavorable environmental conditions (e.g. low temperature) [53].
Similarly, other studies found that a forest with bushy vegetation was likely to block the sun-
shine which reduced the temperature of small water bodies, thereby preventing larval growth
[54,55]. Our study also exhibited that mosquito abundance decreased as human population
density increased which was consistent with previous studies [56,57]. These studies indicated
that the reduction of mosquitoes in more densely populated areas was due to regular mosquito
control programs, improved urban planning, and better sanitation.
The estimated map of Culex mosquitoes demonstrated the higher risks associated with the
rice ecosystems and rural areas that were observed in some rice growing areas of My Duc,
Phuc Tho and Ha Dong districts (in strong red color areas in Fig 3). For rural areas, it is likely
that poor environmental sanitation facilitates the mosquitoes’ breeding habitats whereas peo-
ple in urban areas are more aware of JE virus and other vector-borne diseases. For instance,
one study in Pakistan showed that 65% of urban households implemented mosquito control
measures, while only 39% of rural households did it [58]. However, previous studies in the
Hanoi Province have had mixed findings. Jakobsen et al suggested that peri-urban households
in Hanoi had better mosquito control knowledge and practices compared to households in
more central districts [59]. Other studies have suggested that regular indoor spraying and
removing water containers close to the house could contribute to a reduction of mosquitoes
and vector-borne diseases [60,61].
Over the past two decades, remote sensing has increasingly involved in mapping mosquito-
borne risks and species distribution. Michael et al highlighted that increasingly available earth
observation data play a crucial role in the control of vector-borne diseases [62]. In addition,
Anna et al indicated that remote sensing-based variables were likely to reduce the over-fitting
problems in ecological statistical models [63]. Several global and regional mappings of mos-
quito-borne diseases and species distribution took advantage of this unique data nature and
provided useful information [34,64,65]. Such data visualization would be very important to cli-
nicians to target vulnerable areas and early intervention programs are timely undertaken for
those areas.
Although coarse spatial resolution data has been frequently used in geospatial public health,
it is less likely to take into consideration local variations or micro-habitats because of large
pixel size [24–26]. For example, an earlier Asian JE and Culex mosquito risk map showed the
spatial patterns of mosquitoes and vector-borne diseases but it did not identify the accurate
PLOS NEGLECTED TROPICAL DISEASES Culex mosquito, risk map, forecast, remote sensing, Hanoi, Vietnam
PLOS Neglected Tropical Diseases | https://doi.org/10.1371/journal.pntd.0009497 June 21, 2021 8 / 13

locations where mosquito-borne diseases occur (e.g. at village level) [26]. This limitation was
improved in our study by constructing 30 x30m pixel size raster layer and computing varia-
tions among local pixels (e.g. using a 250m buffer) as this better resolution can reflect local var-
iations and consequently increase the accuracy of mosquito risk maps [66].
Our study was not able to identify the geographic association between JE reported cases
and Culex mosquitoes because JE data was unavailable. However, several studies showed that
Culex mosquito abundance was geographically associated with JE, and West Nile viruses
[25,26,67]. In Vietnam, Culex mosquitoes are the primary vector for JE virus across the coun-
try [14,28]. From a public health point of view, risk maps can be useful to increase the public
awareness in areas with high-risk of Culex mosquitoes. This early warning information can
alert people to take precautions such as wearing long-sleeved shirts, trousers, and hats when
engaged in outdoor activities or travelling to hotspots. Culex mosquitoes lay their eggs in
standing water, such as is found in rice fields and septic tanks, but can also breed in smaller
water bodies. Our risk map identified some high-risk areas with more than 130 mosquitoes/
900m2 in the rice fields and rural areas where further preventive control measures need to be
considered (e.g. use of insecticides and proper sanitation).
This study had several limitations. First, the mosquito sampling was conducted in six out of
30 districts for a limited time, so our samples may not be representative across the entire year
and/or seasons. However, our study was more robust than other similar studies in Egypt, Italy,
and the United States that employed one-period sampling of mosquitoes, in terms of large
mosquito sampling points collected and/or higher spatial resolution [68–71]. In addition, we
may have overestimated the mosquito population in this study because samples were collected
during the wet season (May–October), not the dry season (November–April). One study sug-
gested that Culex mosquitoes were more predominant (43%) during the rainy season than the
dry season in Hanoi [12]. We assumed that more mosquitoes have a higher chance of being
infected with JE virus. However, we did not know the proportion of mosquitoes with JE virus
as laboratory confirmation was not conducted. Furthermore, livestock are commonly raised in
many rural/peri-urban districts of Hanoi, but this raster layer was not available for our study.
Previous research suggested that livestock production was associated with the mosquito abun-
dance and JE virus [72,73]. Animal waste and nearby ponds can provide favorable mosquito-
breeding areas if the livestock and their barns were not regularly washed and cleaned [74,75].
Lastly, the human population density used in this study was from 2015, which was assumed to
be constant for 2018, but it was unlikely to be accurate because of rapid urbanization in Hanoi.
Our findings may provide better insight into understanding the spatial distribution of
Culex mosquitoes and its associated environmental risk factors. Such information can assist
local clinicians and public health policymakers to identify the potential areas of risk for JE
virus. Risk maps can be an efficient way of raising public awareness about the virus and further
preventive measures need to be considered in order to prevent outbreaks and onwards trans-
mission of the JE virus.
Acknowledgments
We also would like to give special thanks to Paul Karaimu for English editing.
Author Contributions
Conceptualization: Tuyen V. Ha, Wonkook Kim, Thang Nguyen-Tien, Hu Suk Lee.
Data curation: Tuyen V. Ha, Wonkook Kim, Thang Nguyen-Tien, Hu Suk Lee.
Formal analysis: Tuyen V. Ha, Wonkook Kim, Thang Nguyen-Tien, Hu Suk Lee.
PLOS NEGLECTED TROPICAL DISEASES Culex mosquito, risk map, forecast, remote sensing, Hanoi, Vietnam
PLOS Neglected Tropical Diseases | https://doi.org/10.1371/journal.pntd.0009497 June 21, 2021 9 / 13

Funding acquisition: Tuyen V. Ha, Wonkook Kim, Thang Nguyen-Tien, Hu Suk Lee.
Investigation: Tuyen V. Ha, Wonkook Kim, Thang Nguyen-Tien, Hu Suk Lee.
Methodology: Tuyen V. Ha, Wonkook Kim, Thang Nguyen-Tien, Hu Suk Lee.
Project administration: Tuyen V. Ha, Wonkook Kim, Thang Nguyen-Tien, Hu Suk Lee.
Resources: Tuyen V. Ha, Hu Suk Lee.
Software: Tuyen V. Ha, Wonkook Kim, Thang Nguyen-Tien, Hu Suk Lee.
Supervision: Wonkook Kim, Hu Suk Lee.
Validation: Tuyen V. Ha, Wonkook Kim, Thang Nguyen-Tien, Hu Suk Lee.
Visualization: Tuyen V. Ha, Wonkook Kim, Thang Nguyen-Tien, Hu Suk Lee.
Writing – original draft: Tuyen V. Ha.
Writing – review & editing: Wonkook Kim, Thang Nguyen-Tien, Johanna Lindahl, Hung
Nguyen-Viet, Nguyen Quang Thi, Huy Van Nguyen, Fred Unger, Hu Suk Lee.
References1. Solomon T. Control of Japanese encephalitis—within our grasp? New England Journal of Medicine.
2006; 355(9):869–71. https://doi.org/10.1056/NEJMp058263 PMID: 16943399
2. Japanese encephalitis [Internet]. WHO. 2019 [cited 15/12/2020].
3. Heinz F, Stiasny K. Flaviviruses and their antigenic structure. Journal of Clinical Virology. 2012; 55
(4):289–95. https://doi.org/10.1016/j.jcv.2012.08.024 PMID: 22999801
4. Campbell GL, Hills SL, Fischer M, Jacobson JA, Hoke CH, Hombach JM, et al. Estimated global inci-
dence of Japanese encephalitis: a systematic review. Bulletin of the World Health Organization. 2011;
89:766–74. https://doi.org/10.2471/BLT.10.085233 PMID: 22084515
5. Erlanger TE, Weiss S, Keiser J, Utzinger J, Wiedenmayer K. Past, present, and future of Japanese
encephalitis. Emerging infectious diseases. 2009; 15(1):1. https://doi.org/10.3201/eid1501.080311
PMID: 19116041
6. Japanese encephalitis [Internet]. 2019 [cited 10/12/2020]. Available from: https://www.who.int/en/
news-room/fact-sheets/detail/japanese-encephalitis.
7. Okuno T. An epidemiological review of Japanese encephalitis. World health statistics quarterly Rapport
trimestriel de statistiques sanitaires mondiales. 1978; 31(2):120–33. PMID: 214963
8. Yen NT, Duffy MR, Hong NM, Hien NT, Fischer M, Hills SL. Surveillance for Japanese encephalitis in
Vietnam, 1998–2007. The American journal of tropical medicine and hygiene. 2010; 83(4):816–9.
https://doi.org/10.4269/ajtmh.2010.10-0262 PMID: 20889870
9. Solomon T, Dung NM, Kneen R, Thao LTT, Gainsborough M, Nisalak A, et al. Seizures and raised intra-
cranial pressure in Vietnamese patients with Japanese encephalitis. Brain. 2002; 125(5):1084–93.
https://doi.org/10.1093/brain/awf116 PMID: 11960897
10. Tan LV, Thai LH, Phu NH, Nghia HDT, Chuong LV, Sinh DX, et al. Viral aetiology of central nervous sys-
tem infections in adults admitted to a tertiary referral hospital in southern Vietnam over 12 years. PLoS
neglected tropical diseases. 2014; 8(8):e3127. https://doi.org/10.1371/journal.pntd.0003127 PMID:
25165820
11. Reuben R, Tewari S, Hiriyan J, Akiyama J. Illustrated keys to species of Culex (Culex) associated with
Japanese encephalitis in Southeast Asia (Diptera: Culicidae). Mosquito systematics. 1994; 26(2):75–
96.
12. Ohba S-y, Van Soai N, Van Anh DT, Nguyen YT, Takagi M. Study of mosquito fauna in rice ecosystems
around Hanoi, Northern Vietnam. Acta tropica. 2015; 142:89–95. https://doi.org/10.1016/j.actatropica.
2014.11.002 PMID: 25445747
13. Keiser J, Maltese MF, Erlanger TE, Bos R, Tanner M, Singer BH, et al. Effect of irrigated rice agriculture
on Japanese encephalitis, including challenges and opportunities for integrated vector management.
Acta tropica. 2005; 95(1):40–57. https://doi.org/10.1016/j.actatropica.2005.04.012 PMID: 15878762
PLOS NEGLECTED TROPICAL DISEASES Culex mosquito, risk map, forecast, remote sensing, Hanoi, Vietnam
PLOS Neglected Tropical Diseases | https://doi.org/10.1371/journal.pntd.0009497 June 21, 2021 10 / 13
14. Kuwata R, Nga PT, Yen NT, Hoshino K, Isawa H, Higa Y, et al. Surveillance of Japanese encephalitis
virus infection in mosquitoes in Vietnam from 2006 to 2008. The American journal of tropical medicine
and hygiene. 2013; 88(4):681–8. https://doi.org/10.4269/ajtmh.12-0407 PMID: 23358634
15. Mackenzie J, Barrett AD, Deubel V. Japanese encephalitis and West Nile viruses: Springer Science &
Business Media; 2012.
16. Ruget AS, Beck C, Gabassi A, Trevennec K, Lecollinet S, Chevalier V, et al. Japanese encephalitis cir-
culation pattern in swine of northern Vietnam and consequences for swine’s vaccination recommenda-
tions. Transboundary and emerging diseases. 2018; 65(6):1485–92. https://doi.org/10.1111/tbed.
12885 PMID: 29740970
17. Kalluri S, Gilruth P, Rogers D, Szczur M. Surveillance of arthropod vector-borne infectious diseases
using remote sensing techniques: a review. PLoS Pathog. 2007; 3(10):e116. https://doi.org/10.1371/
journal.ppat.0030116 PMID: 17967056
18. Palaniyandi M. The role of Remote Sensing and GIS for spatial prediction of vector-borne diseases
transmission: A systematic review. Journal of vector borne diseases. 2012; 49(4):197. PMID: 23428518
19. Yang G-J, Vounatsou P, Xiao-Nong Z, Utzinger J, Tanner M. A review of geographic information system
and remote sensing with applications to the epidemiology and control of schistosomiasis in China. Acta
tropica. 2005; 96(2–3):117–29. https://doi.org/10.1016/j.actatropica.2005.07.006 PMID: 16112638
20. Elith J, Leathwick JR. Species distribution models: ecological explanation and prediction across space
and time. Annual review of ecology, evolution, and systematics. 2009; 40:677–97.
21. Dale P, Morris C. Culex annulirostris breeding sites in urban areas: using remote sensing and digital
image analysis to develop a rapid predictor of potential breeding areas. Journal of the American Mos-
quito Control Association. 1996; 12(2 Pt 1):316–20. PMID: 8827612
22. Zou L, Miller SN, Schmidtmann ET. Mosquito larval habitat mapping using remote sensing and GIS:
implications of coalbed methane development and West Nile virus. Journal of medical entomology.
2006; 43(5):1034–41. https://doi.org/10.1603/0022-2585(2006)43[1034:mlhmur]2.0.co;2 PMID:
17017244
23. Jacob BG, Gu W, Caamano EX, Novak RJ. Developing operational algorithms using linear and non-lin-
ear squares estimation in Python® for the identification of Culex pipiens and Culex restuans in a mos-
quito abatement district (Cook County, Illinois, USA). Geospatial Health. 2009; 3(2):157–76. https://doi.
org/10.4081/gh.2009.218 PMID: 19440960
24. Alaniz AJ, Carvajal MA, Bacigalupo A, Cattan PE. Global spatial assessment of Aedes aegypti and
Culex quinquefasciatus: a scenario of Zika virus exposure. Epidemiology & Infection. 2019;147.
25. Samy AM, Elaagip AH, Kenawy MA, Ayres CF, Peterson AT, Soliman DE. Climate change influences
on the global potential distribution of the mosquito Culex quinquefasciatus, vector of West Nile virus and
lymphatic filariasis. PloS one. 2016; 11(10):e0163863. https://doi.org/10.1371/journal.pone.0163863
PMID: 27695107
26. Longbottom J, Browne AJ, Pigott DM, Sinka ME, Golding N, Hay SI, et al. Mapping the spatial distribu-
tion of the Japanese encephalitis vector, Culex tritaeniorhynchus Giles, 1901 (Diptera: Culicidae) within
areas of Japanese encephalitis risk. Parasites & vectors. 2017; 10(1):1–12. https://doi.org/10.1186/
s13071-017-2086-8 PMID: 28302156
27. Lowry PW, Truong DH, Hinh LD, Ladinsky JL, Karabatsos N, Cropp CB, et al. Japanese encephalitis
among hospitalized pediatric and adult patients with acute encephalitis syndrome in Hanoi, Vietnam
1995. The American journal of tropical medicine and hygiene. 1998; 58(3):324–9. https://doi.org/10.
4269/ajtmh.1998.58.324 PMID: 9546412
28. Lindahl JF, Ståhl K, Chirico J, Boqvist S, Thu HTV, Magnusson U. Circulation of Japanese encephalitis
virus in pigs and mosquito vectors within Can Tho city, Vietnam. PLoS Negl Trop Dis. 2013; 7(4):e2153.
https://doi.org/10.1371/journal.pntd.0002153 PMID: 23593520
29. Pham VC, Pham T-T-H, Tong THA, Nguyen TTH, Pham NH. The conversion of agricultural land in the
peri-urban areas of Hanoi (Vietnam): patterns in space and time. Journal of Land Use Science. 2015;
10(2):224–42.
30. Statistical Yearbook 2018 [Internet]. 2018 [cited 05/10/2020]. Available from: https://www.gso.gov.vn/.
31. Victor TJ, Reuben R. Population dynamics of mosquito immatures and the succession in abundance of
aquatic insects in rice fields in Madurai, South India. Indian journal of malariology. 1999; 36(1–2):19–32.
PMID: 11304916
32. Mackenzie JS, Gubler DJ, Petersen LR. Emerging flaviviruses: the spread and resurgence of Japanese
encephalitis, West Nile and dengue viruses. Nature medicine. 2004; 10(12):S98–S109. https://doi.org/
10.1038/nm1144 PMID: 15577938
33. Afrane YA, Githeko AK, Yan G. The ecology of Anopheles mosquitoes under climate change: Case
studies from the effects of environmental changes in east Africa highlands. Annals of the New York
PLOS NEGLECTED TROPICAL DISEASES Culex mosquito, risk map, forecast, remote sensing, Hanoi, Vietnam
PLOS Neglected Tropical Diseases | https://doi.org/10.1371/journal.pntd.0009497 June 21, 2021 11 / 13

Academy of Sciences. 2012; 1249:204. https://doi.org/10.1111/j.1749-6632.2011.06432.x PMID:
22320421
34. Zheng X, Zhong D, He Y, Zhou G. Seasonality modeling of the distribution of Aedes albopictus in China
based on climatic and environmental suitability. Infectious diseases of poverty. 2019; 8(1):1–9. https://
doi.org/10.1186/s40249-018-0513-5 PMID: 30626428
35. Hashim H, Abd Latif Z, Adnan NA. Urban vegetation classification with NDVI thresold value method
with very high resolution (VHR) PLEIADES Imagery. Int Arch Photogramm Remote Sens Spat Inf Sci.
2019:237–40.
36. Huy Van Nguyen. A Comparison of Advanced Classification Methods for Land Use/Land Cover
Changes Investigation in Hanoi, Vietnam [Thesis]: Stuttgart University of Applied Sciences; 2019.
37. Thomas CJ, Cross DE, Bøgh C. Landscape movements of Anopheles gambiae malaria vector mosqui-
toes in rural Gambia. PloS one. 2013; 8(7):e68679. https://doi.org/10.1371/journal.pone.0068679
PMID: 23874719
38. Medeiros MC, Boothe EC, Roark EB, Hamer GL. Dispersal of male and female Culex quinquefasciatus
and Aedes albopictus mosquitoes using stable isotope enrichment. PLoS neglected tropical diseases.
2017; 11(1):e0005347. https://doi.org/10.1371/journal.pntd.0005347 PMID: 28135281
39. Jardine A, Neville PJ, Lindsay MD. Proximity to mosquito breeding habitat and Ross River virus risk in
the Peel region of Western Australia. Vector-Borne and Zoonotic Diseases. 2015; 15(2):141–6. https://
doi.org/10.1089/vbz.2014.1693 PMID: 25700045
40. Lee HS, Nguyen-Viet H, Lee M, Duc PP, Grace D. Seasonality of viral encephalitis and associated envi-
ronmental risk factors in son La and Thai Binh provinces in Vietnam from 2004 to 2013. The American
journal of tropical medicine and hygiene. 2017; 96(1):110–7. https://doi.org/10.4269/ajtmh.16-0471
PMID: 27799646
41. Mouatassim Y, Ezzahid EH. Poisson regression and Zero-inflated Poisson regression: application to
private health insurance data. European actuarial journal. 2012; 2(2):187–204.
42. Linden A, Mantyniemi S. Using the negative binomial distribution to model overdispersion in ecological
count data. Ecology. 2011; 92(7):1414–21. https://doi.org/10.1890/10-1831.1 PMID: 21870615
43. Gardner W, Mulvey EP, Shaw EC. Regression analyses of counts and rates: Poisson, overdispersed
Poisson, and negative binomial models. Psychological bulletin. 1995; 118(3):392. https://doi.org/10.
1037/0033-2909.118.3.392 PMID: 7501743
44. McCulloch CE, Neuhaus JM. Generalized linear mixed models. Wiley StatsRef: Statistics Reference
Online. 2014.
45. Myers RH, Montgomery DC, Vining GG, Robinson TJ. Generalized linear models: with applications in
engineering and the sciences: John Wiley & Sons; 2012.
46. Hijmans RJ, Van Etten J, Cheng J, Mattiuzzi M, Sumner M, Greenberg JA, et al. Package ‘raster’. R
package. 2015; 734.
47. Magnusson A, Skaug H, Nielsen A, Berg C, Kristensen K, Maechler M, et al. Package ‘glmmTMB’. R
Package Version 02 0. 2017.
48. Wang W, Lu Y, editors. Analysis of the mean absolute error (MAE) and the root mean square error
(RMSE) in assessing rounding model. IOP Conference Series: Materials Science and Engineering;
2018.
49. Chai T, Draxler RR. Root mean square error (RMSE) or mean absolute error (MAE)? GMDD. 2014; 7
(1):1525–34.
50. Phukan A, Borah P, Mahanta J. Japanese encephalitis in Assam, northeast India. Southeast Asian jour-
nal of tropical medicine and public health. 2004; 35:618–22. PMID: 15689077
51. Wang L, Hu W, Magalhaes RJS, Bi P, Ding F, Sun H, et al. The role of environmental factors in the spa-
tial distribution of Japanese encephalitis in mainland China. Environment international. 2014; 73:1–9.
https://doi.org/10.1016/j.envint.2014.07.004 PMID: 25072160
52. Gubler DJ, Reiter P, Ebi KL, Yap W, Nasci R, Patz JA. Climate variability and change in the United
States: potential impacts on vector-and rodent-borne diseases. Environmental health perspectives.
2001; 109(suppl 2):223–33. https://doi.org/10.1289/ehp.109-1240669 PMID: 11359689
53. Thongsripong P, Green A, Kittayapong P, Kapan D, Wilcox B, Bennett S. Mosquito vector diversity
across habitats in central Thailand endemic for dengue and other arthropod-borne diseases. PLoS Negl
Trop Dis. 2013; 7(10):e2507. https://doi.org/10.1371/journal.pntd.0002507 PMID: 24205420
54. Jacob BG, Muturi EJ, Mwangangi JM, Funes J, Caamano EX, Muriu S, et al. Remote and field level
quantification of vegetation covariates for malaria mapping in three rice agro-village complexes in Cen-
tral Kenya. International Journal of Health Geographics. 2007; 6(1):21. https://doi.org/10.1186/1476-
072X-6-21 PMID: 17550620
PLOS NEGLECTED TROPICAL DISEASES Culex mosquito, risk map, forecast, remote sensing, Hanoi, Vietnam
PLOS Neglected Tropical Diseases | https://doi.org/10.1371/journal.pntd.0009497 June 21, 2021 12 / 13
55. Sunish I, Reuben R. Factors influencing the abundance of Japanese encephalitis vectors in ricefields in
India–I. Abiotic. Medical and veterinary entomology. 2001; 15(4):381–92. https://doi.org/10.1046/j.
0269-283x.2001.00324.x PMID: 11776457
56. Lindsay SW, Wilson A, Golding N, Scott TW, Takken W. Improving the built environment in urban areas
to control Aedes aegypti-borne diseases. Bulletin of the world health organization. 2017; 95(8):607.
https://doi.org/10.2471/BLT.16.189688 PMID: 28804174
57. Ferraguti M, Martınez-de La Puente J, Roiz D, Ruiz S, Soriguer R, Figuerola J. Effects of landscape
anthropization on mosquito community composition and abundance. Scientific reports. 2016; 6(1):1–9.
https://doi.org/10.1038/s41598-016-0001-8 PMID: 28442746
58. Hafeez F, Akram W, Suhail A, Arshad M. Knowledge and attitude of the public towards dengue control
in urban and rural areas of Punjab. Pakistan Journal of Zoology. 2012; 44(1).
59. Jakobsen F, Nguyen-Tien T, Pham-Thanh L, Bui VN, Nguyen-Viet H, Tran-Hai S, et al. Urban livestock-
keeping and dengue in urban and peri-urban Hanoi, Vietnam. PLoS neglected tropical diseases. 2019;
13(11):e0007774. https://doi.org/10.1371/journal.pntd.0007774 PMID: 31770384
60. Mani T, Arunachalam N, Rajendran R, Satyanarayana K, Dash A. Efficacy of thermal fog application of
deltacide, a synergized mixture of pyrethroids, against Aedes aegypti, the vector of dengue. Tropical
Medicine & International Health. 2005; 10(12):1298–304. https://doi.org/10.1111/j.1365-3156.2005.
01522.x PMID: 16359411
61. Perich MJ, Rocha N, Castro A, Alfaro A, Platt K, Solano T, et al. Evaluation of the efficacy of lambda-
cyhalothrin applied by three spray application methods for emergency control of Aedes aegypti in Costa
Rica. Journal of the American Mosquito Control Association. 2003; 19(1):58–62. PMID: 12674536
62. Wimberly MC, de Beurs KM, Loboda TV, Pan WK. Satellite Observations and Malaria: New Opportuni-
ties for Research and Applications. Trends in parasitology. 2021. https://doi.org/10.1016/j.pt.2021.03.
003 PMID: 33775559
63. Cord AF, Klein D, Gernandt DS, de la Rosa JAP, Dech S. Remote sensing data can improve predictions
of species richness by stacked species distribution models: a case study for Mexican pines. Journal of
Biogeography. 2014; 41(4):736–48.
64. Messina JP, Brady OJ, Golding N, Kraemer MU, Wint GW, Ray SE, et al. The current and future global
distribution and population at risk of dengue. Nature microbiology. 2019; 4(9):1508–15. https://doi.org/
10.1038/s41564-019-0476-8 PMID: 31182801
65. Rogers D, Wilson A, Hay S, Graham A. The global distribution of yellow fever and dengue. Advances in
parasitology. 2006; 62:181–220. https://doi.org/10.1016/S0065-308X(05)62006-4 PMID: 16647971
66. Bøgh C, Lindsay SW, Clarke SE, Dean A, Jawara M, Pinder M, et al. High spatial resolution mapping of
malaria transmission risk in the Gambia, west Africa, using LANDSAT TM satellite imagery. The Ameri-
can journal of tropical medicine and hygiene. 2007; 76(5):875–81. PMID: 17488908
67. Liu B, Gao X, Ma J, Jiao Z, Xiao J, Wang H. Influence of host and environmental factors on the distribu-
tion of the Japanese Encephalitis vector Culex tritaeniorhynchus in China. International journal of envi-
ronmental research and public health. 2018; 15(9):1848. https://doi.org/10.3390/ijerph15091848 PMID:
30150565
68. Baldacchino F, Marcantonio M, Manica M, Marini G, Zorer R, Delucchi L, et al. Mapping of Aedes albo-
pictus abundance at a local scale in Italy. Remote Sensing. 2017; 9(7):749.
69. El-Zeiny A, El-Hefni A, Sowilem M. Geospatial techniques for environmental modeling of mosquito
breeding habitats at Suez Canal Zone, Egypt. The Egyptian Journal of Remote Sensing and Space Sci-
ence. 2017; 20(2):283–93.
70. Cleckner HL, Allen TR, Bellows AS. Remote sensing and modeling of mosquito abundance and habitats
in Coastal Virginia, USA. Remote Sensing. 2011; 3(12):2663–81.
71. El-Hefni AM, El-Zeiny AM, Effat HA, editors. Environmental sensitivity to mosquito transmitted diseases
in El-Fayoum using spatial analyses. E3S Web of Conferences; 2020: EDP Sciences.
72. Lee HS, Bui VN, Nguyen HX, Bui AN, Hoang TD, Nguyen-Viet H, et al. Seroprevalences of multi-patho-
gen and description of farm movement in pigs in two provinces in Vietnam. BMC veterinary research.
2020; 16(1):15. https://doi.org/10.1186/s12917-020-2236-7 PMID: 31937298
73. Nguyen TT, Pham LT, Nguyen-Viet H, Lundkvist A, Lindahl JF. The association between livestock
keeping and mosquito-borne diseases in urban areas in Hanoi city, Vietnam. 2018.
74. Solomon T, Dung NM, Kneen R, Gainsborough M, Vaughn DW, Khanh VT. Japanese encephalitis.
Journal of Neurology, Neurosurgery & Psychiatry. 2000; 68(4):405–15. https://doi.org/10.1136/jnnp.68.
4.405 PMID: 10727474
75. Lawler S. Managing mosquitoes on the farm: UCANR Publications; 2005.
PLOS NEGLECTED TROPICAL DISEASES Culex mosquito, risk map, forecast, remote sensing, Hanoi, Vietnam
PLOS Neglected Tropical Diseases | https://doi.org/10.1371/journal.pntd.0009497 June 21, 2021 13 / 13