Spatial data quality assessment in GIS -...
8
Spatial data quality assessment in GIS DANIELA CRISTIANA DOCAN Surveying and Cadastre Department Technical University of Civil Engineering Bucharest Lacul Tei Bvd., no 122-124, RO 020396, sector 2, Bucharest ROMANIA [email protected] Abstract: The paper aims to present the main issues related to spatial data quality assessment for a given dataset. There were described the elements and subelements of the data quality evaluation according with ISO (International Organization for Standardization) standards on geographic information. The analysis on dataset reveals some difficulties and limitation in evaluation of quality elements. Key-Words: data quality, accuracy, error, geospatial, topology, standards, ISO. 1 Introduction Geospatial datasets are an important component for a geographic information system (GIS). The GIS software allows user to capture, integrate and analyze different geospatial datasets that have different origins and most of the time contain different quality levels [1]. For specific projects or certain needs data users require different levels of data quality (from less to extremely accurate data). The data quality directly influence the results of analyze in GIS and price of dataset also. “Meet requirements [7]” became an objective which should not overlooked. A complete descriptions of the quality dataset facilitate the best suited selection according with the needs and requirements of the users and also will encourage the sharing, interchange and reuse different spatial datasets [8]. A spatial dataset is a “model of reality”, a logical and simplified representation of the reality [5]. All the spatial data are, at different levels, vague, incorrect, old or incomplete (Devillers, Jeansoulin [5]). Figure 1 presents the same features from the real world (roads) represented in different geospatial databases (topographic plans and maps ranging between 1:500 and 1:250 000). None of these representations is strictly according to reality, but these models represent the same features at various abstracting levels, in spite of they could meet the requirements. Using a standard method in identifying, collecting and reporting data quality information [8], will give datasets reliability and credibility. The International Organization for Standardization (ISO) establishes in ISO19113 Geographic Information-Quality principles and in ISO 19114 Geographic Information-quality evaluation procedures the principles for describing the quality of geographic data [8] and procedures to determine and report the quality information in a consistent and standard manner [7]. Fig.1 Overlapping of the roads and railways networks from different datasets at different scales (1:500, 1:5 000 and 1:250 000 scale); The International Organization for Standardization (ISO) considers that quality is „totality of characteristics of a product that bear on its ability to satisfy stated and implied needs” [8]. The quality of a dataset can be described using two components [8]: -data quality elements; -data quality overview elements (propose, usage, lineage); Recent Advances in Geodesy and Geomatics Engineering ISBN: 978-960-474-335-3 105
Transcript of Spatial data quality assessment in GIS -...
Spatial data quality assessment in GIS
DANIELA CRISTIANA DOCAN
Surveying and Cadastre Department
Technical University of Civil Engineering Bucharest
Lacul Tei Bvd., no 122-124, RO 020396, sector 2, Bucharest
ROMANIA
Abstract: The paper aims to present the main issues related to spatial data quality assessment for a
given dataset. There were described the elements and subelements of the data quality evaluation
according with ISO (International Organization for Standardization) standards on geographic
information. The analysis on dataset reveals some difficulties and limitation in evaluation of quality
elements.
Key-Words: data quality, accuracy, error, geospatial, topology, standards, ISO.
1 Introduction Geospatial datasets are an important component for
a geographic information system (GIS). The GIS
software allows user to capture, integrate and
analyze different geospatial datasets that have
different origins and most of the time contain
different quality levels [1]. For specific projects or
certain needs data users require different levels of
data quality (from less to extremely accurate data).
The data quality directly influence the results of
analyze in GIS and price of dataset also. “Meet
requirements [7]” became an objective which
should not overlooked.
A complete descriptions of the quality dataset
facilitate the best suited selection according with the
needs and requirements of the users and also will
encourage the sharing, interchange and reuse
different spatial datasets [8].
A spatial dataset is a “model of reality”, a logical
and simplified representation of the reality [5]. All
the spatial data are, at different levels, vague,
incorrect, old or incomplete (Devillers, Jeansoulin
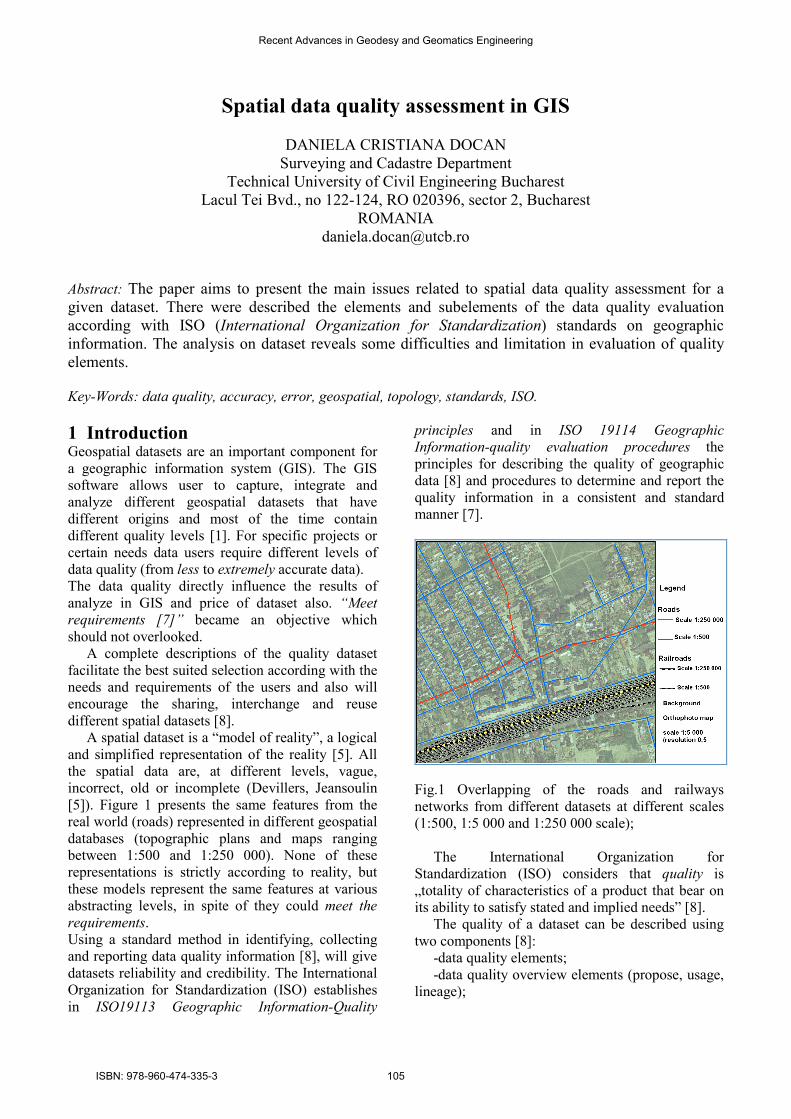
[5]). Figure 1 presents the same features from the
real world (roads) represented in different geospatial
databases (topographic plans and maps ranging
between 1:500 and 1:250 000). None of these
representations is strictly according to reality, but
these models represent the same features at various
abstracting levels, in spite of they could meet the
requirements.
Using a standard method in identifying, collecting
and reporting data quality information [8], will give
datasets reliability and credibility. The International
Organization for Standardization (ISO) establishes
in ISO19113 Geographic Information-Quality
principles and in ISO 19114 Geographic
Information-quality evaluation procedures the
principles for describing the quality of geographic
data [8] and procedures to determine and report the
quality information in a consistent and standard
manner [7].
Fig.1 Overlapping of the roads and railways
networks from different datasets at different scales
(1:500, 1:5 000 and 1:250 000 scale);
The International Organization for
Standardization (ISO) considers that quality is
„totality of characteristics of a product that bear on
its ability to satisfy stated and implied needs” [8].
The quality of a dataset can be described using
two components [8]:
-data quality elements;
-data quality overview elements (propose, usage,
lineage);
Recent Advances in Geodesy and Geomatics Engineering
ISBN: 978-960-474-335-3 105
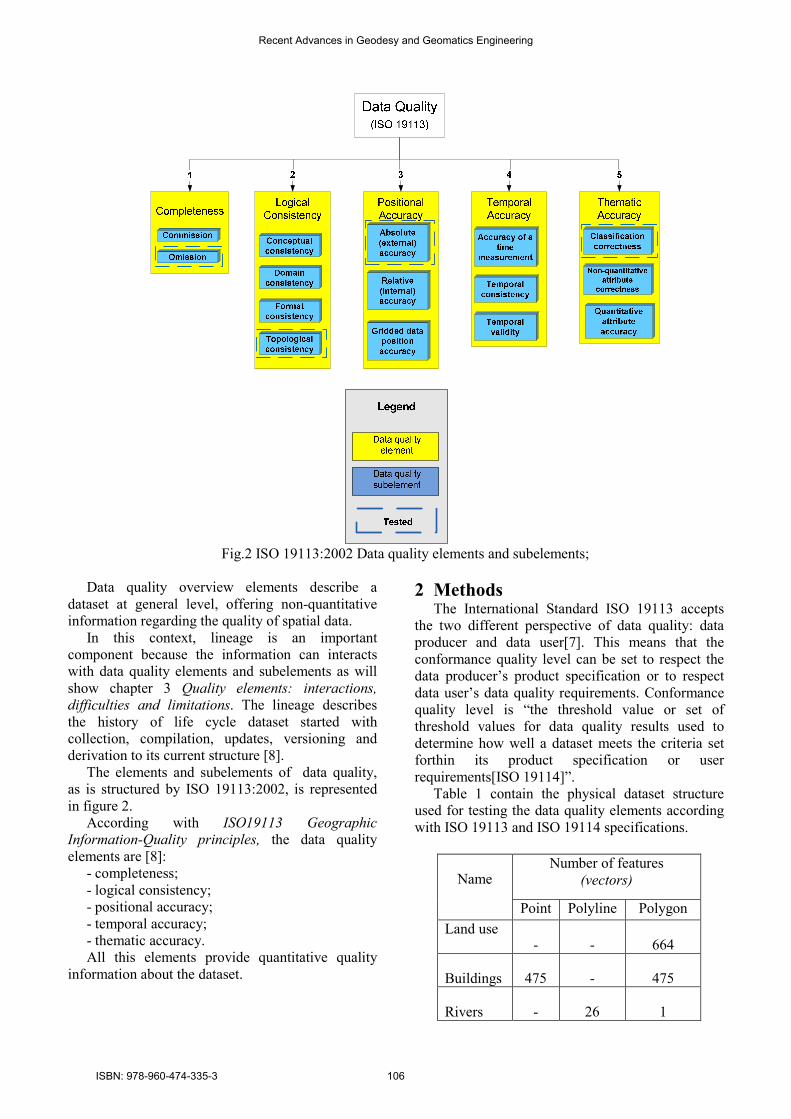
Fig.2 ISO 19113:2002 Data quality elements and subelements;
Data quality overview elements describe a
dataset at general level, offering non-quantitative
information regarding the quality of spatial data.
In this context, lineage is an important
component because the information can interacts
with data quality elements and subelements as will
show chapter 3 Quality elements: interactions,
difficulties and limitations. The lineage describes
the history of life cycle dataset started with
collection, compilation, updates, versioning and
derivation to its current structure [8].
The elements and subelements of data quality,
as is structured by ISO 19113:2002, is represented
in figure 2.
According with ISO19113 Geographic
Information-Quality principles, the data quality
elements are [8]:
- completeness;
- logical consistency;
- positional accuracy;
- temporal accuracy;
- thematic accuracy.
All this elements provide quantitative quality
information about the dataset.
2 Methods The International Standard ISO 19113 accepts
the two different perspective of data quality: data
producer and data user[7]. This means that the
conformance quality level can be set to respect the
data producer’s product specification or to respect
data user’s data quality requirements. Conformance
quality level is “the threshold value or set of
threshold values for data quality results used to
determine how well a dataset meets the criteria set
forthin its product specification or user
requirements[ISO 19114]”.
Table 1 contain the physical dataset structure
used for testing the data quality elements according
with ISO 19113 and ISO 19114 specifications.
Name Number of features
(vectors)
Point Polyline Polygon
Land use - - 664
Buildings 475 - 475
Rivers - 26 1
Recent Advances in Geodesy and Geomatics Engineering
ISBN: 978-960-474-335-3 106
Altimetry 241 67 -
Roads - 133 43
Sum 716 236 1183
Table 1 The thematic layers from dataset;
Because the complexity of quality evaluation
procedures, in the present paper there were tested
only four quality elements mentioned by ISO 19113
for a topographical database at 1:5000 scale.
It was used internal and external direct
evaluation methods on simple random sampling
features from dataset. There wasn’t established a
conformance quality level.
2.1 Completeness The completeness element expresses the presence
and absence of features, their attributes and
relationships. There are two subelements:
commission (excess data present) and omission
(data absent) [8]. There were tested 200 features
(parcels) by check in the field. The simple random
sampling covers 30% of the total of parcels existing
in the feature class Land use.
Ground check
(omission)
Feature
from
dataset
Omission
Number of
errors
Ag
ricu
ltu
re z
on
e
Arable Arable land 47 3 Vegetable
garden 2 0
Pasture
Pasture 3 0 Pasture with
scrub and
brambles 4 0
Grassland Grassland 13 0
Vineyard Vineyard 10 2
Orchard Orchard 7 0
1 0
Table 2 A sample from completeness: omission
table;
The number of omission in a sense of geometry was
very small but the number of wrong classifications
is quite significant as will results from
misclassification matrix. There is an interaction
between the omission (polygon is missing),
temporal accuracy (changes in land use, re-allot)
and classification correctness (errors in
interpretation).
2.2 Logical consistency The logical consistency is a degree of adherence to
logical rules of data structure, attribution and
relationships [8]. There are four subelements:
conceptual, domain, format and topological
consistency [8]. Topological consistency refers to
the correctness of the explicitly geometrical
properties and spatial relationships between
features. Spatial relations describe the spatial
integrity of a geospatial dataset [5]. Spatial integrity
constraints are a tool for improving the internal
quality of spatial data [5].
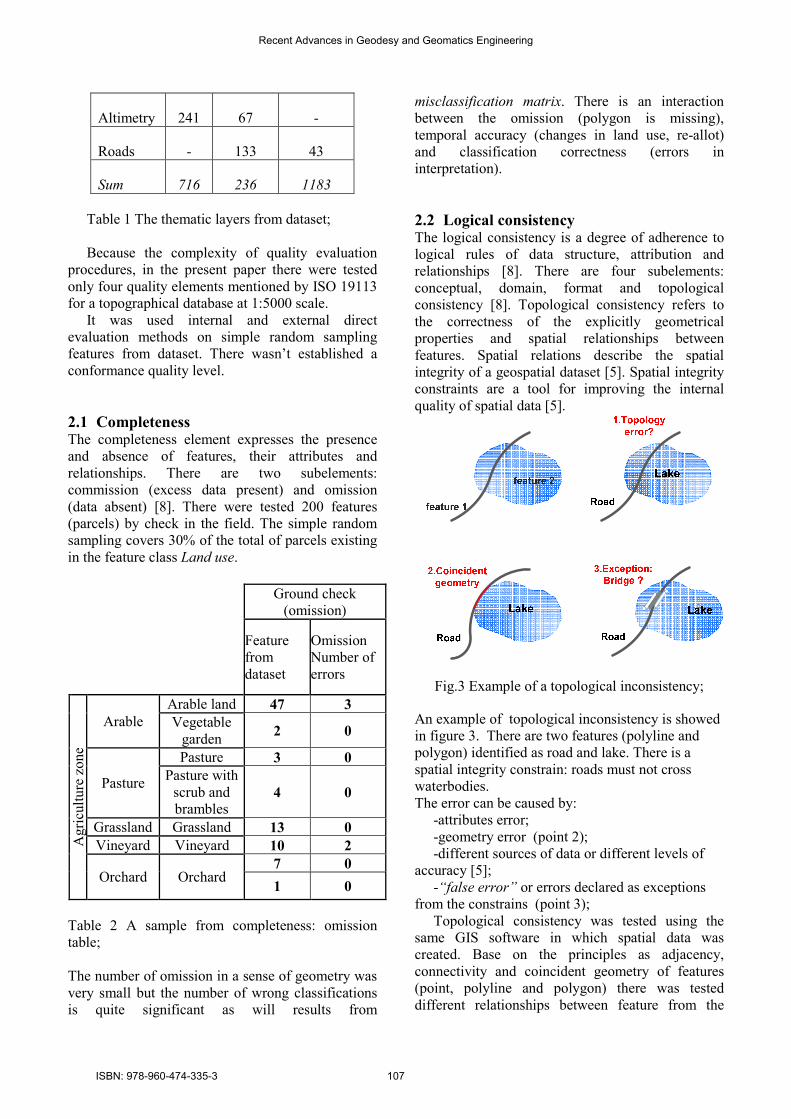
Fig.3 Example of a topological inconsistency;
An example of topological inconsistency is showed
in figure 3. There are two features (polyline and
polygon) identified as road and lake. There is a
spatial integrity constrain: roads must not cross
waterbodies.
The error can be caused by:
-attributes error;
-geometry error (point 2);
-different sources of data or different levels of
accuracy [5];
-“false error” or errors declared as exceptions
from the constrains (point 3);
Topological consistency was tested using the
same GIS software in which spatial data was
created. Base on the principles as adjacency,
connectivity and coincident geometry of features
(point, polyline and polygon) there was tested
different relationships between feature from the
Recent Advances in Geodesy and Geomatics Engineering
ISBN: 978-960-474-335-3 107
same thematic layers or between different thematic
layers.
The most important relationships between
features of the Land use thematic layer are:
- parcels must not overlap;
- parcels must not have gaps.
Fig.4 Must not overlap şi Must not have gaps errors
(ESRI.com);
There were identified 106 errors (point, polyline and
polygon type errors) for all features from dataset
that were corrected in this stage of internal quality
control.
2.1 Positional accuracy The ISO19113 Geographic Information-Quality
principles defines accuracy as “closeness of
agreement between a test result and the accepted
reference value [ISO 3534-1]”.
The positional accuracy element defines the
accuracy of the position of a feature [8].
There are three subelements [8]:
- absolute or external accuracy;
- relative or internal accuracy;
- gridded data position accuracy.
Absolute or external accuracy is a measure of
“closeness of reported coordinate values to values
accepted as or being true” [8].
The planimetric positional accuracy can be
evaluated by comparing the dataset with another
dataset of a better quality (following the same
specifications), also called “control” or “reference”
data, or by comparing with data resulted from
topographical survey.
The root mean square error (RMSE) was used to
express the planimetric positional accuracy. The
RMSE is not the same with the standard deviation of
a statistical sample, because the value of the RMSE
is calculated from a set of check measurements [6].
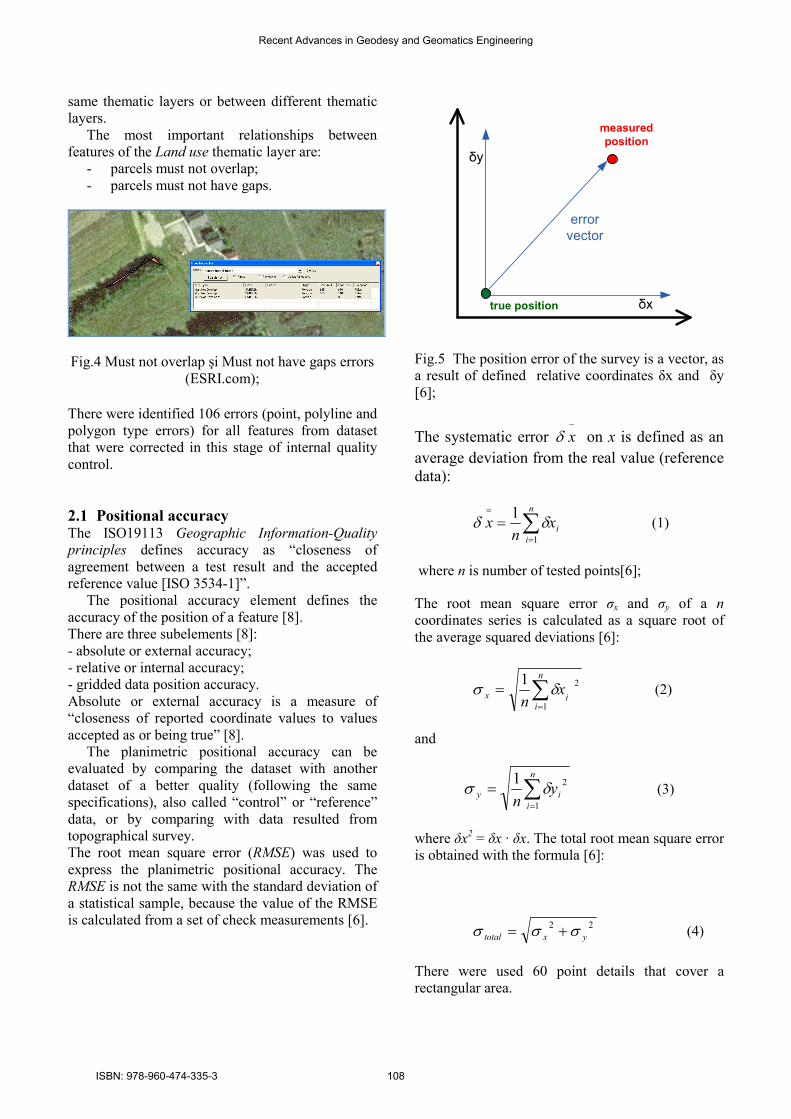
true position
measured
position
δy
δx
error
vector
Fig.5 The position error of the survey is a vector, as
a result of defined relative coordinates δx and δy
[6];
The systematic error −
xδ on x is defined as an
average deviation from the real value (reference
data):
∑=
=
=n
i
ixn
x1
1δδ (1)
where n is number of tested points[6];
The root mean square error σx and σy of a n
coordinates series is calculated as a square root of
the average squared deviations [6]:
∑=
=n
iix x
n 1
21δσ (2)
and
∑=
=n
i
iy yn 1
21δσ (3)
where δx2 = δx · δx. The total root mean square error
is obtained with the formula [6]:
22
yxtotal σσσ += (4)
There were used 60 point details that cover a
rectangular area.
Recent Advances in Geodesy and Geomatics Engineering
ISBN: 978-960-474-335-3 108
~136m
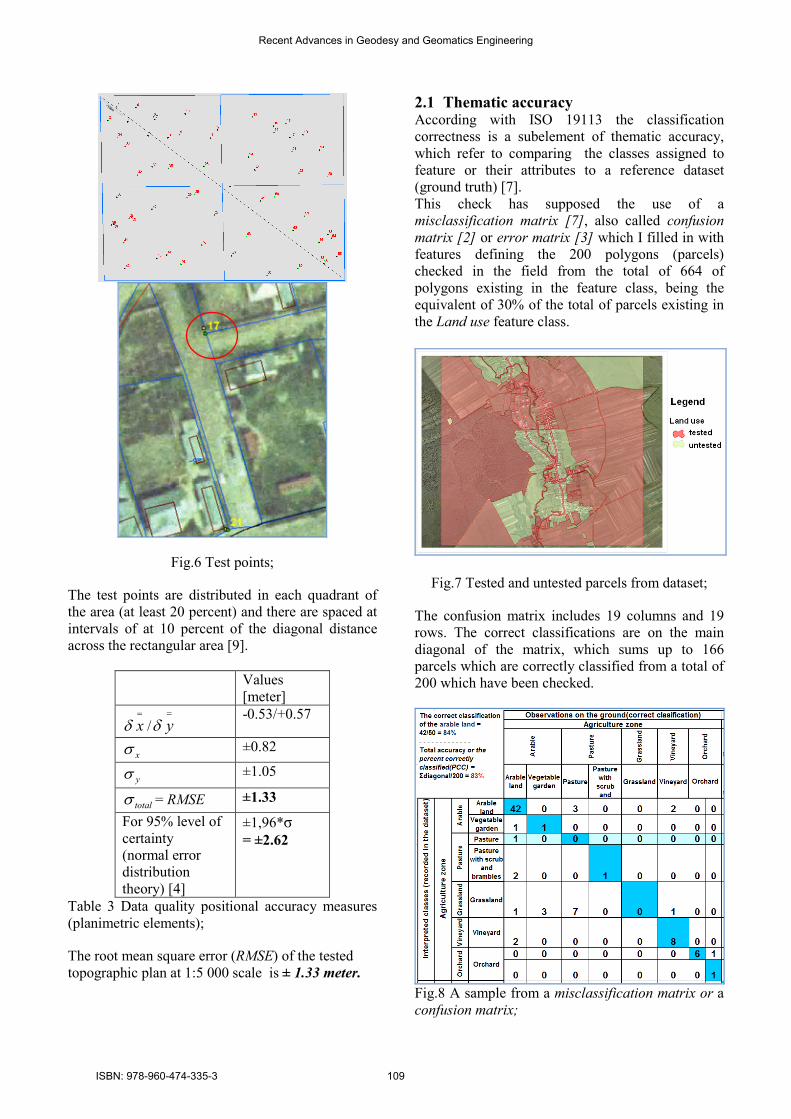
Fig.6 Test points;
The test points are distributed in each quadrant of
the area (at least 20 percent) and there are spaced at
intervals of at 10 percent of the diagonal distance
across the rectangular area [9].
Values
[meter] =
xδ /=
yδ -0.53/+0.57
xσ ±0.82
yσ ±1.05
totalσ = RMSE ±1.33
For 95% level of
certainty
(normal error
distribution
theory) [4]
±1,96*σ
= ±2.62
Table 3 Data quality positional accuracy measures
(planimetric elements);
The root mean square error (RMSE) of the tested
topographic plan at 1:5 000 scale is ± 1.33 meter.
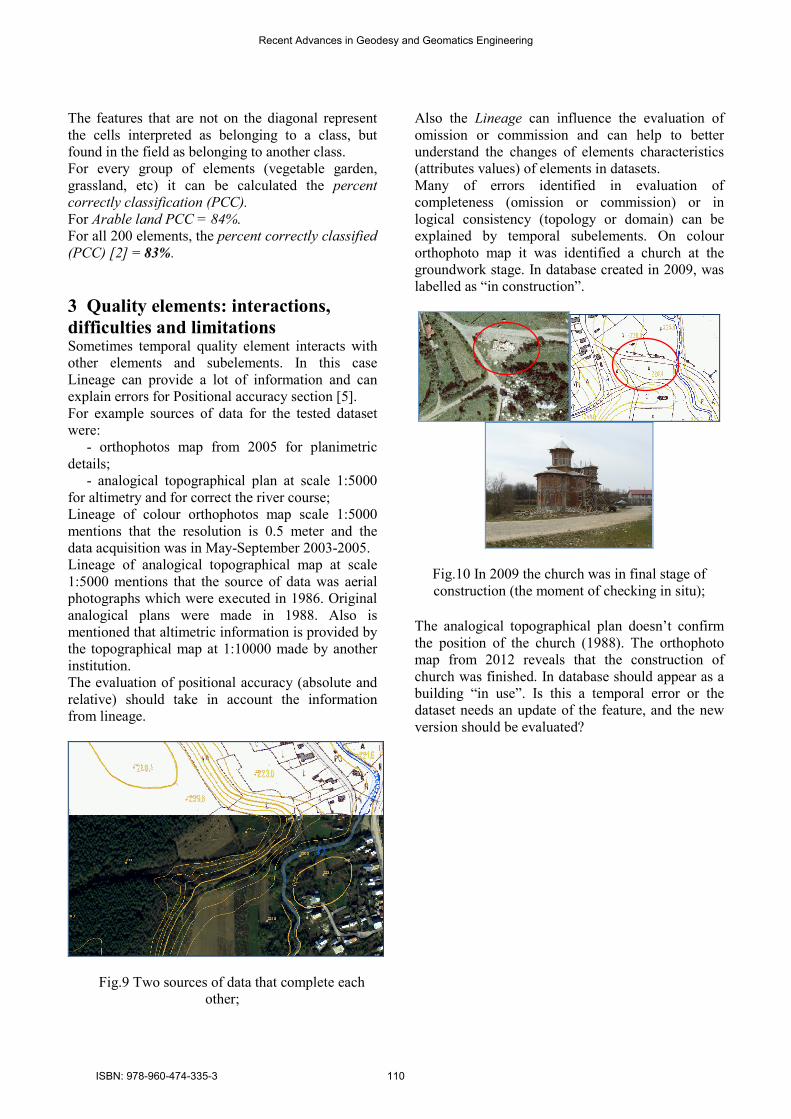
2.1 Thematic accuracy According with ISO 19113 the classification
correctness is a subelement of thematic accuracy,
which refer to comparing the classes assigned to
feature or their attributes to a reference dataset
(ground truth) [7].
This check has supposed the use of a
misclassification matrix [7], also called confusion
matrix [2] or error matrix [3] which I filled in with
features defining the 200 polygons (parcels)
checked in the field from the total of 664 of
polygons existing in the feature class, being the
equivalent of 30% of the total of parcels existing in
the Land use feature class.
Fig.7 Tested and untested parcels from dataset;
The confusion matrix includes 19 columns and 19
rows. The correct classifications are on the main
diagonal of the matrix, which sums up to 166
parcels which are correctly classified from a total of
200 which have been checked.
Fig.8 A sample from a misclassification matrix or a
confusion matrix;
Recent Advances in Geodesy and Geomatics Engineering
ISBN: 978-960-474-335-3 109
The features that are not on the diagonal represent
the cells interpreted as belonging to a class, but
found in the field as belonging to another class.
For every group of elements (vegetable garden,
grassland, etc) it can be calculated the percent
correctly classification (PCC).
For Arable land PCC = 84%.
For all 200 elements, the percent correctly classified
(PCC) [2] = 83%.
3 Quality elements: interactions,
difficulties and limitations Sometimes temporal quality element interacts with
other elements and subelements. In this case
Lineage can provide a lot of information and can
explain errors for Positional accuracy section [5].
For example sources of data for the tested dataset
were:
- orthophotos map from 2005 for planimetric
details;
- analogical topographical plan at scale 1:5000
for altimetry and for correct the river course;
Lineage of colour orthophotos map scale 1:5000
mentions that the resolution is 0.5 meter and the
data acquisition was in May-September 2003-2005.
Lineage of analogical topographical map at scale
1:5000 mentions that the source of data was aerial
photographs which were executed in 1986. Original
analogical plans were made in 1988. Also is
mentioned that altimetric information is provided by
the topographical map at 1:10000 made by another
institution.
The evaluation of positional accuracy (absolute and
relative) should take in account the information
from lineage.
Fig.9 Two sources of data that complete each
other;
Also the Lineage can influence the evaluation of
omission or commission and can help to better
understand the changes of elements characteristics
(attributes values) of elements in datasets.
Many of errors identified in evaluation of
completeness (omission or commission) or in
logical consistency (topology or domain) can be
explained by temporal subelements. On colour
orthophoto map it was identified a church at the
groundwork stage. In database created in 2009, was
labelled as “in construction”.
Fig.10 In 2009 the church was in final stage of
construction (the moment of checking in situ);
The analogical topographical plan doesn’t confirm
the position of the church (1988). The orthophoto
map from 2012 reveals that the construction of
church was finished. In database should appear as a
building “in use”. Is this a temporal error or the
dataset needs an update of the feature, and the new
version should be evaluated?
Recent Advances in Geodesy and Geomatics Engineering
ISBN: 978-960-474-335-3 110
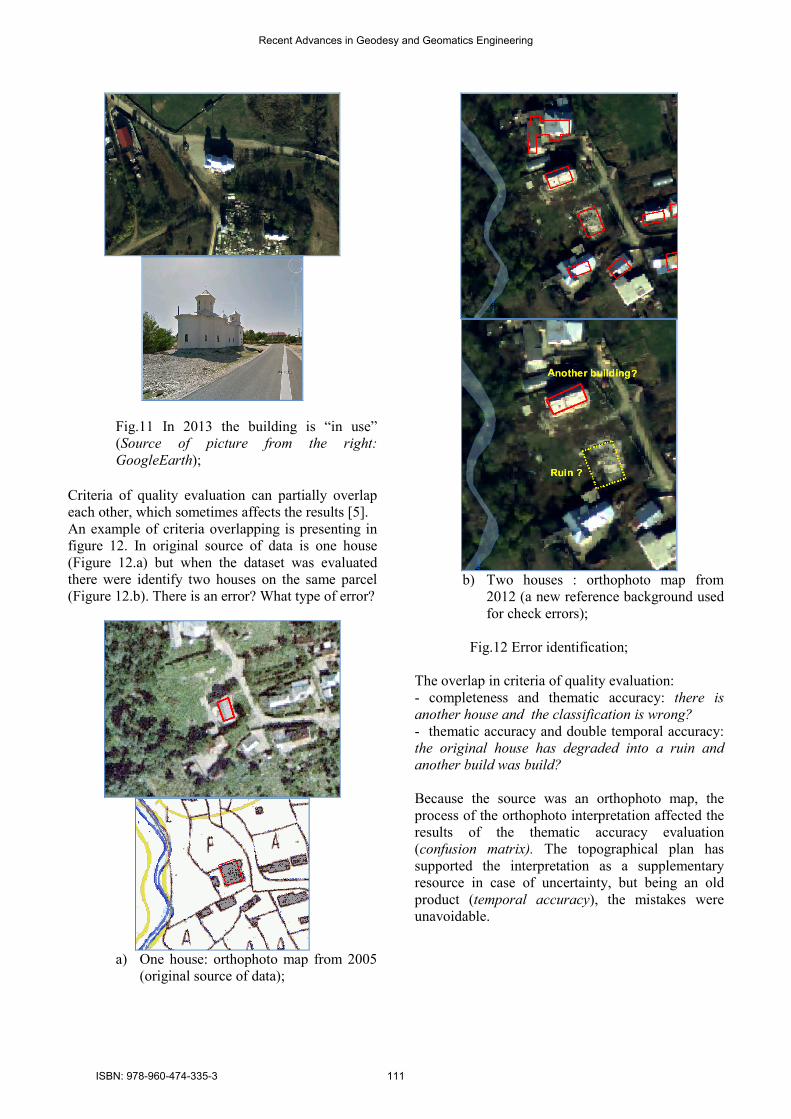
Fig.11 In 2013 the building is “in use”
(Source of picture from the right:
GoogleEarth);
Criteria of quality evaluation can partially overlap
each other, which sometimes affects the results [5].
An example of criteria overlapping is presenting in
figure 12. In original source of data is one house
(Figure 12.a) but when the dataset was evaluated
there were identify two houses on the same parcel
(Figure 12.b). There is an error? What type of error?
a) One house: orthophoto map from 2005
(original source of data);
b) Two houses : orthophoto map from
2012 (a new reference background used
for check errors);
Fig.12 Error identification;
The overlap in criteria of quality evaluation:
- completeness and thematic accuracy: there is
another house and the classification is wrong?
- thematic accuracy and double temporal accuracy:
the original house has degraded into a ruin and
another build was build?
Because the source was an orthophoto map, the
process of the orthophoto interpretation affected the
results of the thematic accuracy evaluation
(confusion matrix). The topographical plan has
supported the interpretation as a supplementary
resource in case of uncertainty, but being an old
product (temporal accuracy), the mistakes were
unavoidable.
Recent Advances in Geodesy and Geomatics Engineering
ISBN: 978-960-474-335-3 111
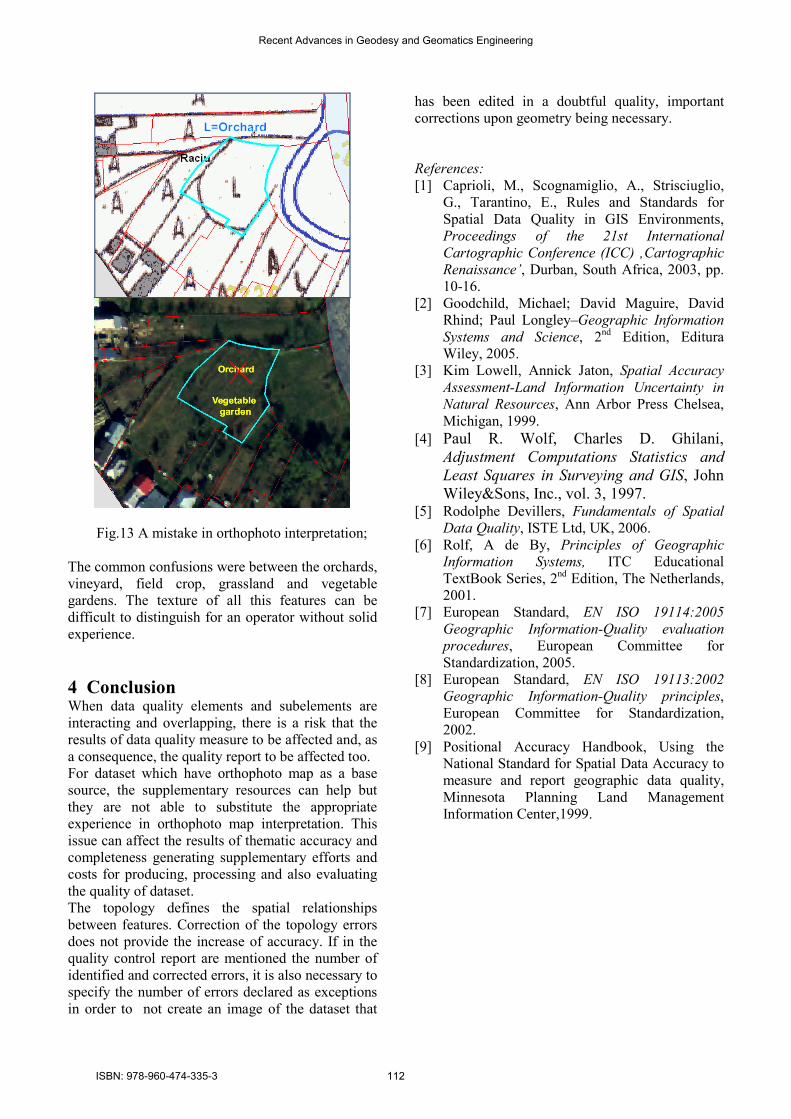
Fig.13 A mistake in orthophoto interpretation;
The common confusions were between the orchards,
vineyard, field crop, grassland and vegetable
gardens. The texture of all this features can be
difficult to distinguish for an operator without solid
experience.
4 Conclusion When data quality elements and subelements are
interacting and overlapping, there is a risk that the
results of data quality measure to be affected and, as
a consequence, the quality report to be affected too.
For dataset which have orthophoto map as a base
source, the supplementary resources can help but
they are not able to substitute the appropriate
experience in orthophoto map interpretation. This
issue can affect the results of thematic accuracy and
completeness generating supplementary efforts and
costs for producing, processing and also evaluating
the quality of dataset.
The topology defines the spatial relationships
between features. Correction of the topology errors
does not provide the increase of accuracy. If in the
quality control report are mentioned the number of
identified and corrected errors, it is also necessary to
specify the number of errors declared as exceptions
in order to not create an image of the dataset that
has been edited in a doubtful quality, important
corrections upon geometry being necessary.
References:
[1] Caprioli, M., Scognamiglio, A., Strisciuglio,
G., Tarantino, E., Rules and Standards for
Spatial Data Quality in GIS Environments,
Proceedings of the 21st International
Cartographic Conference (ICC) ‚Cartographic
Renaissance’, Durban, South Africa, 2003, pp.
10-16.
[2] Goodchild, Michael; David Maguire, David
Rhind; Paul Longley–Geographic Information
Systems and Science, 2nd
Edition, Editura
Wiley, 2005.
[3] Kim Lowell, Annick Jaton, Spatial Accuracy
Assessment-Land Information Uncertainty in
Natural Resources, Ann Arbor Press Chelsea,
Michigan, 1999. [4] Paul R. Wolf, Charles D. Ghilani,
Adjustment Computations Statistics and
Least Squares in Surveying and GIS, John
Wiley&Sons, Inc., vol. 3, 1997. [5] Rodolphe Devillers, Fundamentals of Spatial
Data Quality, ISTE Ltd, UK, 2006.
[6] Rolf, A de By, Principles of Geographic
Information Systems, ITC Educational
TextBook Series, 2nd
Edition, The Netherlands,
2001.
[7] European Standard, EN ISO 19114:2005
Geographic Information-Quality evaluation
procedures, European Committee for
Standardization, 2005.
[8] European Standard, EN ISO 19113:2002
Geographic Information-Quality principles,
European Committee for Standardization,
2002.
[9] Positional Accuracy Handbook, Using the
National Standard for Spatial Data Accuracy to
measure and report geographic data quality,
Minnesota Planning Land Management
Information Center,1999.
Recent Advances in Geodesy and Geomatics Engineering
ISBN: 978-960-474-335-3 112