Spatial clustering of sector linked industry in an urban ...
140
Portland State University Portland State University PDXScholar PDXScholar Dissertations and Theses Dissertations and Theses 1-1-1985 Spatial clustering of sector linked industry in an Spatial clustering of sector linked industry in an urban economy urban economy Colleen Greer Acres Portland State University Follow this and additional works at: https://pdxscholar.library.pdx.edu/open_access_etds Let us know how access to this document benefits you. Recommended Citation Recommended Citation Acres, Colleen Greer, "Spatial clustering of sector linked industry in an urban economy" (1985). Dissertations and Theses. Paper 356. https://doi.org/10.15760/etd.356 This Dissertation is brought to you for free and open access. It has been accepted for inclusion in Dissertations and Theses by an authorized administrator of PDXScholar. Please contact us if we can make this document more accessible: [email protected].
Transcript of Spatial clustering of sector linked industry in an urban ...

Portland State University Portland State University
PDXScholar PDXScholar
Dissertations and Theses Dissertations and Theses
1-1-1985
Spatial clustering of sector linked industry in an Spatial clustering of sector linked industry in an
urban economy urban economy
Colleen Greer Acres Portland State University
Follow this and additional works at: https://pdxscholar.library.pdx.edu/open_access_etds
Let us know how access to this document benefits you.
Recommended Citation Recommended Citation Acres, Colleen Greer, "Spatial clustering of sector linked industry in an urban economy" (1985). Dissertations and Theses. Paper 356. https://doi.org/10.15760/etd.356
This Dissertation is brought to you for free and open access. It has been accepted for inclusion in Dissertations and Theses by an authorized administrator of PDXScholar. Please contact us if we can make this document more accessible: [email protected].
[ .
SPATIAL CLUSTERING OF SECTOR LINKED INDUSTRY
IN AN URBAN ECONOMY
by
COLLEEN GREER ACRES
A dissertation submitted in partial fulfillment of the requirements for the degree of
DOCTOR OF PHILOSOPHY in
URBAN STUDIES
Portland State University
1985

TO THE OFFICE OF GRADUATE STUDIES AND RESEARCH:
The members of the Committee approve the dissertation
of Colleen Greer Acres presented May 23, 1985.
APPROVED:
S ner rpe
E. Kimbark MacColl
Kennetfi Dueker, Acting Dean, School of Urban and Public Affairs
te Studies and Research

l"
ACKNOWLEDGEMENTS
Behind this dissertation lie the efforts
of a perceptive committee, a sacrificing
family, and understanding friends.
Thank you all

TABLE OF CONTENTS
PAGE
ACKNOWLEDGEMENTS • . . . . iii
LIST OF TABLES • • vi
CHAPTER
I
II
III
IV
INTRODUCTION • • • • 0 • •
REVIEW OF THE LITERATURE • . . . Relevant Theoretical Literature
Relevant Empirical Literature
Summary of Relevant Literature •
METHODOLOGY . . . . . . . . . Conceptual Model •
Research Hypotheses.
Operational Model . . . . . . . . Measurement of Spatial Proximity • •
Cut-off of Linkage Analysis
Area Selection • •
Variable Measurement •
1
6
6
13
18
20
20
23
24
27
30
39
45
Spatial Proximity • • • • • • • 45 Linkages •••••••• ••• 47 Transportation and Utility Costs 50 Supply and Market Orientation • 51 Industry Average Firm Size • • •• 51
Conclusion • • 52
FINDINGS • • • • . . . 53
Summary of Regression Findings • • 54

CHAPTER
Regression Findings and the Research Hypotheses • • • • • •
Discussion
Conclusion •
v CONCLUSION
BIBLIOGRA:!?HY •
APPENDIX • • •
v
PAGE
73
75
82
84
90
100
TABLE
I
II
LIST OF TABLES
Spatial Concentration Information
List of Variables • • • • • • • • •
III Regression of Intra-Industry Linkage With
Covariates Including Manufacturing
Purchases. . . . . . . . IV Regression of Intra-Industry Linkage With
Covariates Including Manufacturing Sales
V Regression of First Backward Linkage With
Covariates
VI Regressions of Second Backward and Third
Backward Linkages With Covariates ••..
VII Regressions of Fourth Backward and Fifth
PAGE
31
46
55
56
57
58
Backward Linkages With Covariates. • • • 59
VIII Regressions of First and Second Backward and
First, Second, and Third Backward Linkages
with Covariates. 60
IX Regression of First Forward Linkage With
Covariates 61
X Regressions of Second Forward and Third
Forward Linkages With Covariates ••• 62
XI Regressions of Fourth Forward and Fifth
Forward Linkages with Covariates ••• 63
vii
TABLE PAGE
XII Regressions of First and Second Forward and
First, Second, and Third Forward Linkages
With Covariates ••••.
XIII Regressions of One Backward and One Forward
Linkages and One Backward and Two Forward
L'inkages With Covariates . . . XIV Regressions of One Backward and Three Forward
Linkages and Two Backward and One Forward
Linkages With Covariates . . . . . . . . XV Regression of Two Backward and TWJ Forward
Linkages and Two Backward and Three Forward
Linkages With Covariates •
XVI Regressions of Three Backward and One Forward
XVII
XVIII
XIX
XX
and Linkages and Three Backward and Two
Forward Linkages With Covariates ••
Regression of Three Backward and Three Forward
Linkages with Covariates •
Status of Industries With One Firm
Industry Revisions
Identification of Manufacturing Industries.
64
65
66
67
68
69
101
103
115
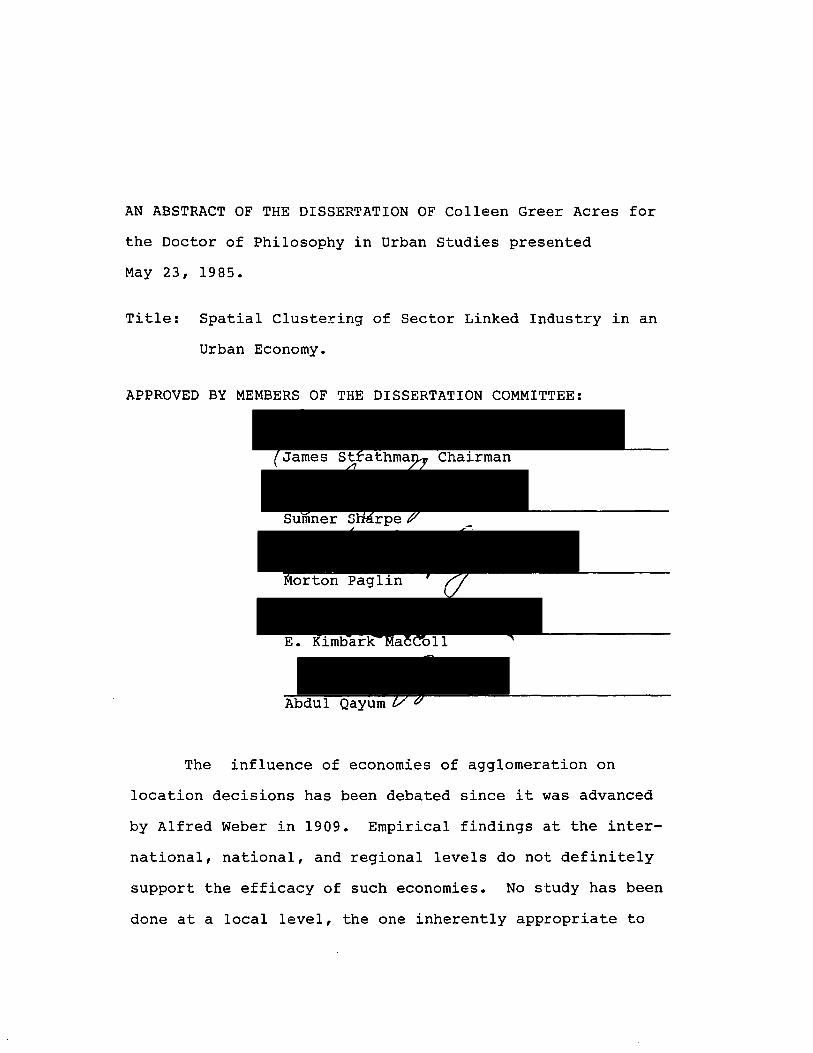
AN ABSTRACT OF THE DISSERTATION OF Colleen Greer Acres for
the Doctor of Philosophy in Urban Studies presented
May 23, 1985.
Title: Spatial Clustering of Sector Linked Industry in an
Urban Economy.
APPROVED BY MEMBERS OF THE DISSERTATION COMMITTEE:
The influence of economies of agglomeration on
location decisions has been debated since it was advanced
by Alfred Weber in 1909. Empirical findings at the inter-
national, national, and regional levels do not definitely
support the efficacy of such economies. No study has been
done at a local level, the one inherently appropriate to
'2
the Weber premise. Further, most studies have used highly
generalized manufacturing groupings.
The importance of intra-industry and inter-industry
determinants of spatial proximity in the Portland, Oregon
metropolitan area was investigated in this study. The
data base included 220 industries with 2,111 firms
employing 108,295 workers. National input-output trans
action tables were used to generate measures of intra
industry and inter-industry technological linkage at the
4 digit Standard Industrial Code classification level.
Nearest neighbor statistics were employed to measure
the spatial proximity of firms within an industry. A
spatial association measure, the local concentration
coefficient, was devised to calculate spatial proximity
among manufacturing firm pairs in various linkage
relationships. Then, multiple linear regression was
used to examine the relationships of intra- and inter
industry linkages to spatial proximity. Average firm
size, material and market orientations, and trans
portation and utility cost intensities were treated as
covariates in the analysis. A total of 25 models
involving the covariates and various combinations of
forward and backward linkages were executed.
In 23 cases, the models and effects of linkages
were insignificant. The observed influence of the
covariates was generally insignificant. Clearly,

3
economies of agglomeration have no effect on industrial
patterns in this analysis. Further, the poor performance
of the covariates suggest that application of existing
theory to localized manufacturing plan selection processes
may be misplaced. While these factors may function at the
regional or national level, they do not on an intrametro
politan level, at least in this case. Seeking the
specific factor of manufacturing linkage based economies
of agglomeration or external economies may be a rare
exception in location behavior in general and particularly
inoperative at a local level. Local development policies
which are premised on maximizing such economies are,
accordingly, not supported by this research.
CHAPTER I
INTRODUCTION
The seminal micro-theory of manufacturing location
advanced by Alfred Weber (1909) had as a major component
the effects of economies of agglomeration on the location
decisions of firms. Later theorists such as Hoover (1937,
1948) extended this notion to include cost savings
associated with close spatial proximity to complementary
as well as similar firms under the concept of economies
of concentration. For Vernon (1960), Lichtenberg (1960)
and Hoover (1967) cost savings achieved by individual firms
through their locational choices were referred to as
external economies. In contrast, Isard (1960) separated
cost reducing factors generated by inter-industry linkages
from economies of agglomeration, scale, urbanization, and
localization. Regardless of the label applied common to
all of these theorists was the contention that spatial
proximity to similar firms and transactionally linked
firms is an important consideration in the firm site
selection process.
Empirical findings have not consistently supported
this hypothesis. Alonso (1964) and Smith (1981) found that
external economies of agglomeration and inter-industry
linkages were important determinants of plant location in
advanced industrial nations while external economies were
more important in underdeveloped nations where firms
must compensate for comparatively higher costs of
transportation and other factors of production.
Conversely, Lausen (1969) in a comparative study of
industrial growth patterns in England and the European
economic community found that major firms in England
were footloose while European counterparts as extensions
of existing plants were classified as relatively immobile.
2
Studies at the regional level have also led to
inconclusive results. Inter-regional linkages rather than
intra-industry linkages are more important in understanding
the behavior of the Pacific Northwest steel industry and
manufacturing plant and industry growth in the Seattle
regional economy according to Schmidt (1973) and Beyers
.(1975). North (1955), however, attributed the development
of the Pacific Northwest to natural resource export market
demand. Bell, Lieber, and Rushton (1974) contend that some
firms will depart from agglomeration principles when local
conditions favor a centrally situated site. Recently
Tauchen and Witte (1982) note that firm proximity and
interaction produce cost savings and revenue generation
accruing directly from economies of agglomeration.
Awareness of the impacts of governmental attitudes
3
and actions beginning with Hoover in 1940 has been a
consistent theme and related subject of debate. The
interplay of community political attitudes, community
amenities, and executive personal choices in the search for
new plant locations was brought into focus by the work of
Greenhut in 1963. Holland (1976) advised communities
seeking to lessen their vulnerability to economic
fluctuations to develop a self-sustaining economic base
composed of firms large enough to stimulate linked
development through subcontracting and purchasing of
materials and components of production. S,mith (19B11~
on the other hand, tell s communi ties seeking growt:t; and .. diversification to create planned growth points~~upplied
with public services necessary to attract industry
capable of siting within the community. Tomer (19BO)
stressed the importance of understanding intra-industry
and inter-industry transactional patterns in the site .. selection process regardless of the approach taken by the
community. The result has been the development of local
economic development programs built on the enhancement of
industrial external economies and/or economies of
agglomeration.
However, this association between industrial
transaction linkage and spatial concentration has never
been conclusively sUbstantiated. Even such studies as
r·
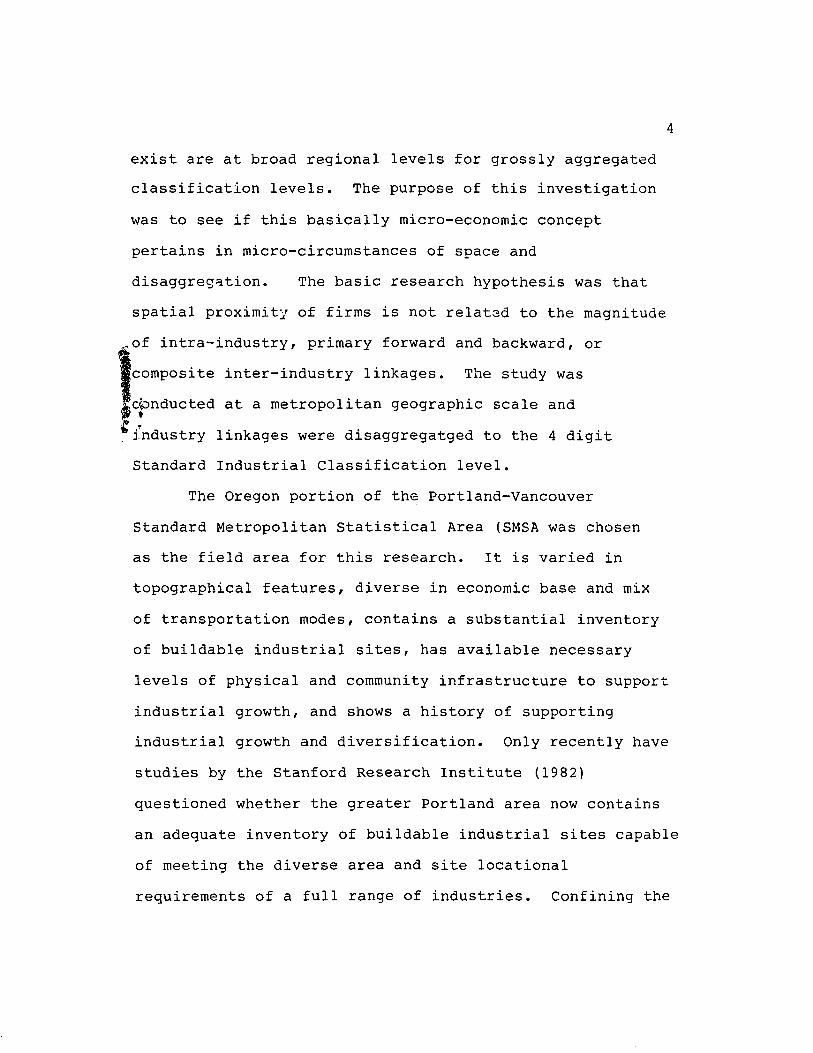
exist are at broad regional levels for grossly aggregated
classification levels. The purpose of this investigation
was to see if this basically micro-economic concept
pertains in micro-circumstances of space and
disaggreg~tion. The basic research hypothesis was that
spatial proximity of firms is not relatGd to the magnitude
__ of intra-industry, primary forward and backward, or
1composite inter-industry linkages. The study was
;cpnducted at a metropolitan geographic scale and ~ . ~industry linkages were disaggregatged to the 4 digit
Standard Industrial Classification level.
The Oregon portion of the Portland-Vancouver
Standard Metropolitan Statistical Area (SMSA was chosen
as the field area for this research. It is varied in
topographical features, diverse in economic base and mix
of transportation modes, contains a substantial inventory
of buildable industrial sites, has available necessary
4
levels of physical and community infrastructure to support
industrial growth, and shows a history of supporting
industrial growth and diversification. Only recently have
studies by the Stanford Research Institute (1982)
questioned whether the greater Portland area now contains
an adequate inventory of buildable industrial sites capable
of meeting the diverse area and site locational
requirements of a full range of industries. Confining the

5
study to the Oregon portion of the metropolitan area limits
the heterogeneity produced among subareas by differences
created in crossing State political borders.
A covariance application of the multiple regression
model was used to test the explanatory power of intra
industry and inter-industry technological linkages in the
spatial clustering of manufacturing firms. Spatial
proximity, the dependent variable, wasmeasured by the
nearest neighbor statistic for firms within an industry.
A comparable local concentration measure was developed to
calculate spatial arrangements for firms across industries
as the nearest neighbor's mathematical properties
precluded its use in the latter case. The potential
influences of firm size, transportation and utility costs,
and supply and market orientation were controlled by their
treatment as covariates within the model. The experimental
variables--within industry, forward and backward
technological linkages--were measured at the 4 digit
Standard Industrial Classification level using the 1972
national input-output commodity/industry transactions
table.
CHAPTER II
REVIEW OF THE LITERATURE
Statements on the influence of intra-industry and
inter-industry linkages on the growth and composition of
spatial agglomerations are a consistent theme in the
development of industrial location theory. Viewed
originally as cost minimizing factors, later theorists
recognized both cost reducing and/or revenue generating
variables in discussions of the determinants of industrial
spatial patterns. Lacking in the theoretical literature is
a direct and explicit evaluation of the pull which these
interdependencies could exert in competition with other
determinants of spatial form, e.g. traditional cost
variables.
RELEVANT THEORETICAL LITERATURE
Economies of agglomeration were first defined in 1909
by Weber (1929) as cost savings of firms directly
attributable to the presence of similar industries in close
spatial proximity. Resultant cost savings were viewed as
separate and distinct from economies of scale produced by
increasing levels of production or external economies
generated by minimizing costs of factors external to
production such as transportation.
The search for other cost minimizing factors
continued with the work of Hoover (1937, 1948) in his study
of the shoe and leather industry and later theoretical
formulations. Building on Weber's earlier contributions
7
Hoover noted that cost savings could also be realized by
material and market oriented firms locating in close spatial
proximity to complementary as well as similar firms. These
savings are classified as economies of concentration. Later,
Greenhut (1956) extended the analysis of cost and demand
factors of location to include revenue-generating as well
as cost-reducing factors associated with agglomeration
and deglomeration. For example, marketing products or
services in an area familiar with a firm's reputation lowers
advertising costs relative to competitor cost outlays
while increasing sales revenues. Agglomerative economies
were seen as a necessary prerequisite for the maxjmization
of possible industrial expansion.
The examination of different input price combinations
on areal variations in production costs led Isard (1960) to
explain observed firm spatial agglomerations with the use of
two types of economies--urbanization and localization. The
former arise from city characteristics of size and
composition and clustering of complementary firms. The
latter, also referred to as external economies, are achieved
by spatial clusters of similar establishments. These are
viewed as separate and distinct from economies of scale,
economies of agglomeration and cost reductions produced by
inter-industry linkages. From this classification of
economic factors linkages emerge as a competitive
determinant whose influence must be independently assessed
and then evaluated in conjunction with other factors of
location (Isard and Kuenne 1953).
For Perroux (1970) linkage as a concept applied to
the economic interdependencies of industries and regions.
Growth within a spatially bounded growth pole is
8
attributed to the presence of key industries and input
output related non-competitive industries and the occurrence
of territorial agglomeration. These active poles in turn
induce growth in other areas with relatively passive
industries. These latter areas do not possess propulsive
industries or the benefits of agglomeration- Input-output
industry transactions are recognized as one of the primary
factors in the economic growth of regions and nations.
Inter-industry linkages are seen as incre~singly
important by Stabler (1968) as the number of stages in the
production process grows and the number of industries
directly connected to natural resource inputs or final
markets decreases. The establishment and growth of
industrial complexes is attributed to industries seeking to
minimize inter-industry transfer costs and maximize

9
accessibility to both suppliers and buyers.
Rather than being industry wide Romanoff (1984) argues
that a need for spatial proximity is tied to the nature of
an industry's production process. Manufacturers who
produce goods in response to orders are seen as more
dependent upon close contact with markets than those who
who produce goods for mass consumption and in anticipation
of demand.
Other theorists use firm size and/or corporate
organizational structure to account for differences in
economically linked inter-industry spatial patterns. Small
firms are characterized as more vulnerable to external
market forces (Galbraith 1975; Holland 1976). At the same
time these firms are also more likely to be dependent upon
the local economy for their orders (O'Farrell 1985).
Therefore a location in close proximity to trading partners
is used to minimize market uncertainities and increase
accessibility to trading partners (Moomaw 1985).
Conversely, large firms are seen as having the power
necessary to control their environment. If not, an option
open to large firms is the vertical integration of product
stages as cost factors subject to economies of scale are
internalized (Hakanson 1979).
The influence of inter-industry linkages, firm size,
and other factors in the selection of plant location
was examined by the above theorists within varying spatial
scales ranging from the micro to macro levels of
development. While distinctions were generally made
between areas the applicability of the variables to the
selection of a specific site among alternatives within an
area was not addressed.
The selection of a plant location is a two tier
decision-making process according to Greenhut (1964).
Distinction is made between demand as an area-determining
and site determining locational factor. While market
proximity is a factor in the selection of an area
locations of competitors and interdependence of firms are
seen as the operational aspects of demand at the site
level.
10
A similar but more inconclusive distinction is made
by Thomas (1975) in the typology of environments within
which the firm conducts business and decisions are made.
Constraints and opportunities for growth are seen as
influenced by the characteristics of the firm, the industry,
the geographic area, and the socio-economic-political
system. Adding to this base are the works of network and
informational theorists who challenge the economic
assumption of complete knowledge and suggest that a firm
is further constrained by the a firm's planning space,
informational space, and decision space (Taylor 1979~

11
Moses and Williamson 1967; Mathur 1981; Kipnis 1984).
The integration of these two viewpoints raises the
question of whether equivalence exists between the
definition of space as used by the researcher and that used
by the individual firm or industry in the site selection
process. Clearly, there is a need for the examination of
firm interviews or other primary data a comprehensive theory
of the plant location selection process can be developed.
Finally, no treatment of interdependencies among
input/output linked firms and industries could be considered
complete without a discussion of transportation and
inventory factors. Isard (1951) called attention to the
the substitution principle whereby labor or transportation
cost savings could be used to counterbalance increased costs
of other inputs at a given location. Hakimi (1964) in his
modeling of transportation factors suggests that the
~ptimal plant location will be at the market. Louveaux,
Thisse, and Beguin (1982) argue that the optimal location
for plant location will be at inter-modal transshipment
nodes rather than at the market unless large fixed
transportation costs are evident. Even here, a market
location may not be the optimal location if, according to
these authors, the firm is dependent upon a number of
markets. Inventory costs can be treated in the same
way as transportation costs according to Louveau etal
(1982). The second and third theorems are viewed as
applicable to the determination of the effect of inventory
costs and management practices on plant location choices.
12
Empirical studies in the next section of this chapter
examine the importance of transportation costs in the site
selection process within metropolitan areas. Each of the
theorists reviewed above investigated the possible influence
transportation costs within a regional context or, as in the
case of Is~~d, at the individual firm level. No agreement
has been reached at the theoretical level.
To sum, Weber (1909) called attention to the notion
that cost savings could be generated by locating in close
spatial proximity to similar firms. Hoover (1937)
extended this premise to include cost savings generated
by firms locating in close spatial proximity to
complementary firms. These savings were variously referred
to as econow.ies of agglomeration (Weber 1929), concentration
(Hoover 1937), territorial agglomeration (Perroux 1970),
external economies (Vernon 1960), and demand factors of
location (Greenhut 1964). For other theorists, inter
industry linkages are a competitive factor in the plant
selection process and distinct from each of the above
economies (Isard 1951). Mitigating the influence of
inter-industry linkage on firm spatial proximity are
the characteristics of firms, industries, geographic

areas, and socio-economic-political systems according
to Thomas (1975). Need to differentiate area and
site determining factors is suggested by Greenhut (1964).
13
In each of these cases, inter-industry linkages receive
secondary treatment as a component within a broader
theoretical framework. Trade relationships among firms
within an industry are ignored entirely. It can be argued,
however, that inter-industry linkages include intra-industry
linkages as the latter are an artifact of the use of highly
aggregated industrial categories. By this argument intra
industry linkages become a surrogate for a set of linkages
which are beyond the precision of a given transactions table
and common definitions pertain.
This lack of theoretical focus suggests that either
inter-industry linkages are a minor locational factor or
that their influence may be easily diluted by other
locational factors. However, there is no concensus
about the importance of other locational factors such as
labor and transportation costs within a regional economy.
The purpose of this study is to directly examine the
influence of input-output linkages on spatial proximity of
manufacturing firms within an urban ~~onomy.
RELEVANT EMPIRICAL LITERATURE
Empirical studies can be classified according to

whether their focus is on the the existence of linkages or
the influence of linkages on the attractiveness of an area
for growth and diversification. These studies may be
international, national, regional, or local in their
scope. While findings are able to document the presence
of linkages they do not definitively support postulates
which associate linkages with area attractiveness or the
spatial proximity of similar or complementary firms.
Lausen in his comparative study of Britain and the
European Economic Community found that firm site choices
could not be explained by inter-industry linkage
arrangements. Manufacturing firms in England were found
to be relatively footloose. As extensions of existing
manufacturing facilities new European plants, on the
14
other hand, were found to be relatively immobile. Similar
results were found by Peschel (1982) in the study of
European economic integration. The presence of
agglomeration areas with clusters of linked industries were
not found to help or hurt the attraction of new firms or to
reduce opportunities for growth at the periphery. Auty
(1975) in a study of sugar industries in Carribean countries
found that plant size was the critical factor in the
relationships which firms established with other firms.
Small firms were also seen as embodying different
technologies than large firms.
Streit (1969) found weak relationships between
spatial association and economic alliance in his study
of industries in the united Kingdom. Linkages were
15
not found to be a binding force among transactionally
related firms. Similar results were found by Harrigan
(1982) in a study of industrial linkages and distributions
in England using clustering algorithms designed to generate
industrial and spatial clusters. External economies
based on information/communication and amenities were used
to explain concentrations of high technology industries.
For others such as aerospace, timber and lumber, and
shipbuilding labor costs and/or port proximity were used
to account for spatial clusters identified in the study.
Comparable results were found by Czamanski and Czamanski
(1977) in their study of manufacturing clusters in the
United States. Conversely, strong local linkages were found
in a study of metal industries in West Midlands, England by
Taylor and Wood (1975). These linkages were found to be
important to small firms with less than 50 employees but
not for plants with 90 or more employees. The
presence of linkages was confirmed by O'Farrell (1985)
in the study of survivillg plants in Ireland. However, the
presence of intra-national linkages which tied firms to
domestic demand slowed the growth of plants relative to that
observed in export linked firms.
The driving force for the growth of steel industries
in the Pacific Northwest was attributed to inter-regional
or export linkages by Schmidt (1973). In this same region
Beyers (1975) in a study of Puget Sound, Washington as a
growth center found weak linkages between industries
within the region. In studies of Joinville, Brazil
16
and 12 growth centers in Israel, Kipnis (1984) found the
strongest within area linkages among small and medium firms.
Multiplier effects could be traced to the growth of
these firms and their forward linkages in particular.
Among large plants only textile industries were found to
have relatively strong local linkages.
Vernon in his New York Study (1960) found that
spatial proximity was more important to small firms
taking advantage of external economies generated by
sharing the costs of support services. The clustering of
firms within the central city was attributed to firm needs
for communication/information, reduction in the costs of
uncertainity, and opportunities to take advantage of
economies not inter-industry linkages. No significant
differences were observed between the central city and
outlying areas on available space, transportation costs,
or taxes.
Birch (1970» in a comparative study of American
metropolitan areas found that manufacturing firms were

17
moving to the suburbs. Linkages could not be used to
explain their relocations. The attraction of manufacturing
firms to the young cities was attributed to the availability
of large open spaces and relatively new transportation
systems. However, a recent study by Walker (1977) in
England using analysis of variance found that spatial
clusters of industries and complementary activities existed
and tilat inter-sectoral linkages were important to the
fOImation and growth of these spatial concentrations. Less
important were the inter-industry linkages within
manufacturing.
These apparent contradictions in the literature are
attributed by Wood (1969) in his study of industrial
location and linkages as the inadequacy of traditional
theory which tI ••• regards as awkward exceptions th.e complex
agglomerations that are supposed to be based on principles
uf external economies of scale and close functional
linkage." More than ten years later Smith (1981) following
a comprehensive review of industrial location theory
and research concludes that economies of agglomeration and
inter-industry linkages will become more important in the
future for industries and firms within advanced
industrial societies. Present problems with the concepts
are dismissed essentially as problems of measurement.

SUMMARY OF RELEVANT LITERATURE
Intra-industry and inter-industry linkages represent
the transactional relationships which firms establish
through their purchase of inputs (backward linkages) and
sale of outputs (forward linkages). Plant location
18
theory postulates that cost-reducing and revenue-generating
opportunities exist for firms who locate in close spatial
proximity to suppliers and markets. Economic development
practitioners use these concepts to shape community
development and target industry programs at each level
of government. While the desired network of new firms
and economic opportunities include all sectors of the
economy the emphasis is usually placed upon the manu
facturing industries as drivers of the economy which will
create the largest impacts through the basic multiplier
effect.
In actuality, evidence on manufacturing linkage
impacts at the regional, national, and international levels
does not substantiate the importance of linkages at the
metropolitan or community level. Nor does research which
focuses on the total economy, manufacturing industry
serving, or consumer oriented sectors test the attributed
ability of manufacturing linkages to influence the spatial
patterns of production.
Assuming that a decision has been made to build a

new facility rather than utilize other options available
such as expansion of an existing plant, choices must be
made between competing areas and sites. The existing
industrial mix is a product of characteristics of both
area and site environs. If technological linkages are
important locational determinants for firms, clustering
should be observable in the landscape as linked firms
choose locations which minimize distance with respect to
the strength of linkages.
19

CHAPTER III
METHODOLOGY
This research tested hypotheses about the influence of
linkages as determinants of close spatial proximity within a
local urban economy. Variability in locational concentration
patterns associated with other factors was controlled for
by the use of a covariance model of multiple regression.
Formalization of the research hypotheses, research design,
area definition, measurement, and data collection are
addressed below.
CONCEPTUAL MODEL
The patterns of spatial proximity among firms in the
urban economy can be seen as a function of the strength of
intra-industry and inter-industry linkages, factor of supply
and market orientation, firm size, transportation costs, and
utility costs. Stated as a conceptual model:
SP=f(IL, BL, FL, SO, MO, FS, TC, UC, CAl
WHERE: SP=Spatial Proximity
IL=Intra-industry Linkages
BL= Inter-industry Backward Linkages
FL=Inter-industry Forward Linkages
SO=Supply Orientation
MO=Market Orientation
FS=Firm Size
TC=Transportation Costs
UC=Utility Costs
CA=A Vector of Community Attributes
21
Firms differ in the number and magnitude of their
transactional relationships with similar firms (IL) and
other manufacturing firms (BL/FL). Trade relationships may
be occasional, temporary, or routine. It has been assumed
that in genoral the greater the frequency and magnitude of
exchanges among given firms the more likely close spatial
proximity (SP) will produce cost reducing savings and/or
revenue generation at levels considered important to the
firm. Spatial proximity (SP) is said to facilitate the
timely exchange of goods and services, the possibility for
the externalization of inventory costs (Samuelson 1957;
Louveau, Thisse, and Beguin 1982), and establishment and
.development of informational flows and relationships (Moses
and Williamson 1967) and the minimization of uncertainity
(Webber 1972). The validity of these premises at the
metropolitan level is questionable where limited trans
portation costs are involved.
The pull exerted by suppliers or markets will depend
upon the types of inputs required in the production process
(SP), the nature and composition of firm markets (MO), and
the transportation costs (TC) involved in the movement of

22
goods and services. Obviously the greater the areal
variation in these factors both individually and in
combination, the steeper will be the cost and revenue
surfaces and the more likely firms will be to seek locations
in close proximity to firms which provide the factors to
which they are most cost or revenue sensitive. The
sensitivity of firms to these factors will also be dependent
upon the size of the firm (FS), with smaller firms having
more limited sets of options.
Traditional factors of producticn--Iand, labor, and
capital--may constrain or enhance the availability of
locational choices (Smith, 1981). The availability of
an iventory of buildable industrially zoned sites supplied
with adequate types and levels of social and physical infra
structure is necessary for the community seeking economic
growth and diversification. Availability and costs of
delivered services (UC) such as electricity, gas, water, and
sanitary sewer and appropriate transportation modes for
freight and passenger movement (TC)-roads, railroad, air,
water, and pipeline-may be critical factors in the selection
of areas and sites. Social infrastructure availability and
cost is likely to be important to firm owners, executives,
and line workers as costs will directly impact both the firm
and its labor force.
Finally, the attitudes, policies, and programs of the
community may increase or decrease area attractiveness.

23
The pursuit of business and industry is a highly competitive
process (CEDO 1983). Public infrastructure and plant
investments are the result of decisions with long term
consequences for the community and the industry. Community
attitudes, politics, and programs are a barometer of the
receptivity of the community to the industry both now and
in the future. As such they bear directly on the present
and future costs of doing business in the area and at that
site in a longitudinal framework. Unlike other costs
previously mentioned, many of the variables important to
the assessment of the community may not be amenable to
quantification in monetary terms. But, the importance of
this evaluation is well substantiated in the literature and
the practical experience of communities seeking economic
development. Through study design, variable selection
and measurement, and use of statistical procedures address
each of the elements presented in the conceptual model as
elaborated here must be addressed.
RESEARCH HYPOTHESES
Derivable from the above discussion are statements
which describe the hypothesized types and directions of
relationships expected among identified variables.
Current practice, which has accepted intrinsically micro
level theoretical statements and inferred empirical findings
at the macro level about the importance of linkages ~t the
metropolitan level. This research directly addresses the
influence of linkages in a metropolitan setting. The
research hypotheses are:
24
1. The spatial proximity of firms in an industry is
not related to the magnitude of intra-industry
technological linkages.
2. The spatial proximity of firms is not related
to the magnitude of their primary forward and
backward linkages.
3. The spatial proximity of firms is not related
to the magnitude of their composite forward and
backward linkages.
The expected aggregate impact of firm size, supply and
market orientation, transportation costs, and utility costs
will be controlled by the use of a covariance application of
multiple regression. The extraction of the variability
in the dependent variable, spatial proximity, with these
covariates will allow the measurement of effects directly
attributable to the active or experimental variables-
intra-industry and inter-industry linkages.
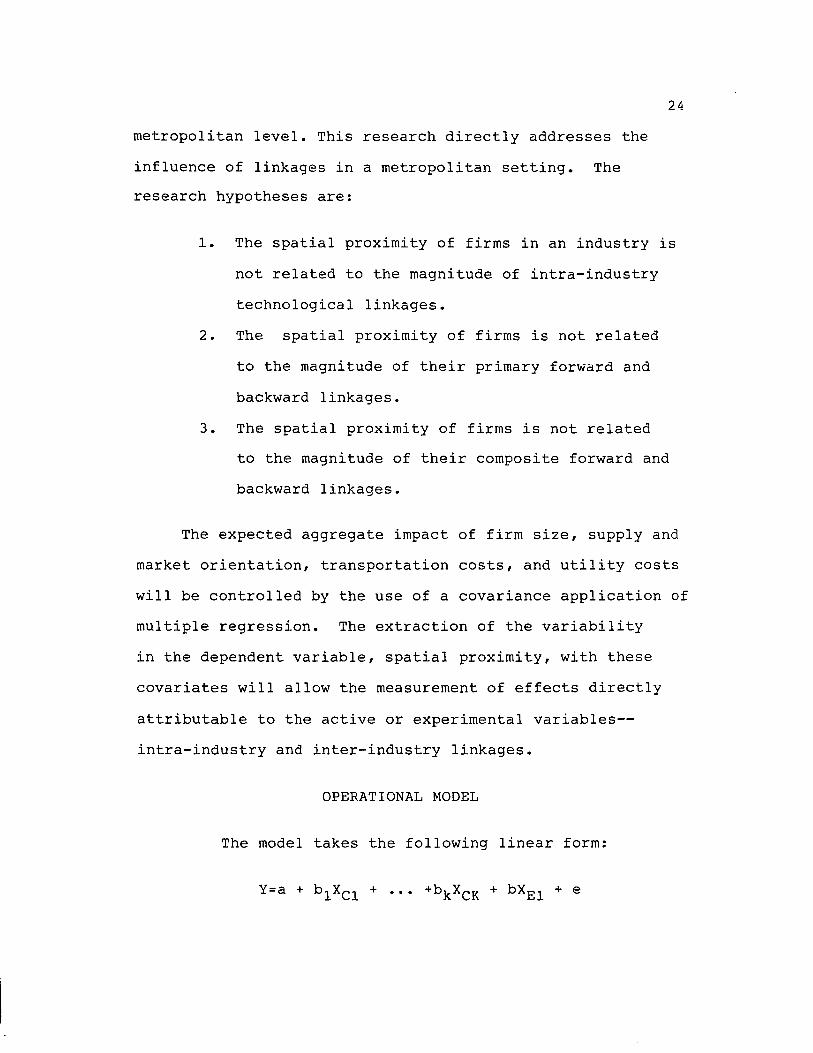
OPERATIONAL MODEL
The model takes the following linear form:
WHERE a,bi=empirically estimated parameters
XC1···XCK=covariates
XE1=Experimental Variable
e=Error Term
25
Independent variables identified as covariate
candidates include firm size, supply and market orientation,
transportation costs, utility costs, and community
attributes. The former will be included in the model as
covariates. The latter, as discussed earlier, are not
readily amenable to quantification. Variability in the
dependent variable attributable -to differences among area
geographic subunits will be controlled by the selection of
an area where differences among geographic subunits are
minimized.
Intra-industry and inter-industry linkages are the
experimental variables in the design. The contribution of
each linkage to variability in the dependent variable will
be examined individually and in linear combination.
No relationship is expected between the experimental
variables~ intra- and inter-industry linkages and the
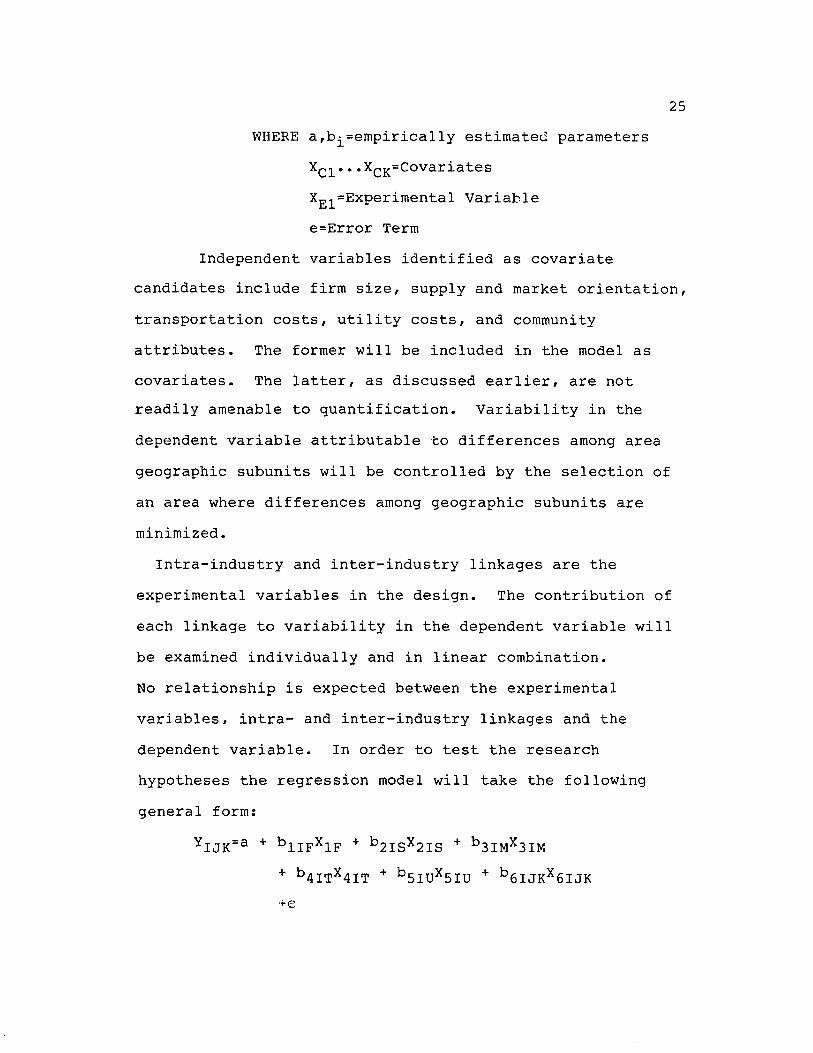
dependent variable. In order to test the research
hypotheses the regression model will take the following
general form:
YIJK=a + blIFX1F + b2ISX2IS + b3IMX3IM
+ b4ITX4IT + b5IUX5IU + b6IJKX6IJK
+e
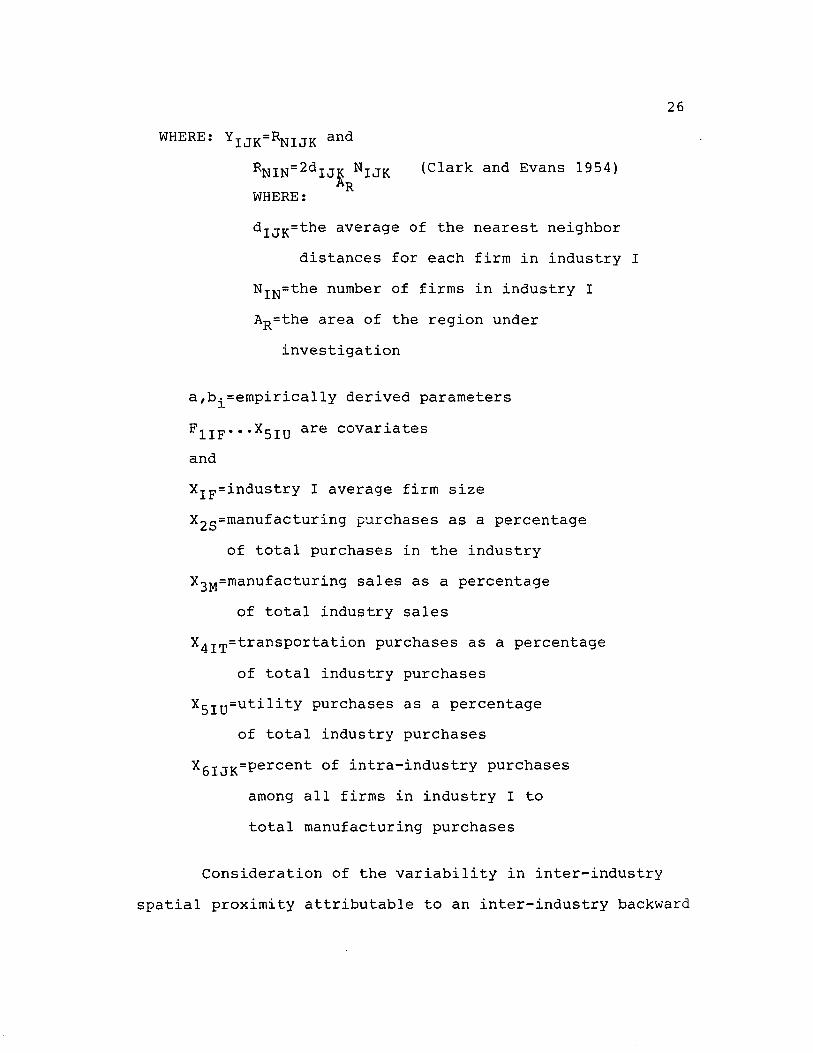
WHERE: YIJK=RNIJK and
RNIN=2dIJ~ N1JK R
WHERE:
(Clark and Evans 1954)
dIJK=the average of the nearest neighbor
distances for each firm in industry I
N1N=the number of firms in industry I
AR=the area of the region under
investigation
a,bi=empirically derived parameters
F1IF ••• X5IU are covariates
and
X1F=industry I average firm size
x2S =manufacturing p~rchases as a percentage
of total purchases in the industry
X3M=manufacturing sales as a percentage
of total industry sales
x4IT=transportation purchases as a percentage
of total industry purchases
X5IU =utility purchases as a percentage
of total industry purchases
X6IJK=percent of intra-industry purchases
among all firms in industry I to
total manufacturing purchases
Consideration of the variability in inter-industry
26
spatial proximity attributable to an inter-industry backward

or forward linkage results in substitutions in the above
equation for the dependent and experimental variables.
Combinations are treated in similar fashion.
MEASUREMENT OF SPATIAL PROXIMITY
27
Spatial proximity of firms within an industry is
measured by the use of nearest neighbor analysis. Spatial
proximity of subject industry firms to forward and backward
linkage firms is measured by the use of a new and comparable
technique devised to work with inter-industry linkages--the
local concentration coefficient.
Developed by Clark and Evans (1954) the nearest
neighbor technique calculates the mean of the distances
between all firms within an industry and their nearest
neighbor. Divided by the expected mean nearest neighbor
distance for a random arrangement the index provides a
concise measure of pattern in terms of a single value
(Ebdon 1981). The index can take a value between 0.0 (a
clustered pattern) and 2.12 (a dispersed pattern).
A value of 1.00 indicates a random arrangement of points.
Criticisms of nearest neighbor analysis have focused
on the sensitivity of the index as a direct statistic to
differences in the shape of a bounded region under
investi0ation (Hsu and Tiedemann 1968) and modifications
made to the two-dimensional Poisson model in its application
to the nearest neighbor analysis (Ingram 1978). Hsu and

Tiedemann (1968) using a hypothetical metropolitan area as
an example that a pattern identified as random within the
central city needed to be reclassified as clustered in the
area of measurement included the surrounding suburban and
urban fringe areas. Later Hsu and Mason (1972) suggested
that this problem could be handled by development of
alternative probability models.
28
These are reasonable concerns for its use as a
statistic. However, in this investigation nearest neighbor
is used only as a measurement of point array. All scores
are based on the same geographical unit.
Thus the design of this research, which focuses on a
bounded urban area with an integrated economic base and a
fixed size and shape, circumvents the need to consider
alternatives to the measurement of points in a region
originally suggested by Clark and Evans (1954).
Continued use of nearest neighbor analysis seems, at
first glance, appropriate. However, this technique requires
the use of all points within the plane. Matching of inter
industry nearest neighbor pairs means that all subject firms
as origins or destinations of goods will be included in the
analysis. But linkage firms exist on a separate plan and
will be exluded from the analysis if they are not the
nearest neighbor of their type to subject firms and some
linked firms. Therefore, the nearest neighbor technique
cannot be used.
Cluster algorithms as used by Harrigan (1982) to
identify integrated industry spatial clusters or by Walker
(1977) to determine general spatial associations among
29
establishment groupings do not measure nearest neighbor pair
distances. What is needed is a measure which is comparable
in formulation to the nearest neighbor technique and results
in the a single index of the correlation among given pairs
of points. A measurement called the Local Concentration
Coefficient (LC) is advanced to measure of general spatial
proximity of linked pairs.
The LC calculates the average length of lines between
point pairs in the 2 industry pattern and compares this to
the longest distance that could be expected to occur between
2 linked firms within the Oregon portion of the Portland-
Vancouver SMSA.
Stated formally:
klLCILJ= L b .. nB ~J
WHERE: b· ·=the distance- from the ith firm of 1.J
the kth industry to its nearest
firm; j, of linked industry 1.
n=the number of ith firms
B=the greatest possible distance from an
ith firm to an Ith partner.
The use of a referent line (B) in the equation's
denominator which is the longest distance that could be
30
expected between any two linked firms in the Oregon portion
of the Portland-Vancouver SMSA establishes a benchmark
against which measured distances among pairs can be
contrasted. The measure ranges from 0.0 indicating complete
clustering to 1.00 which indicates a completely dispersed
pattern of points within the bounded area. Again, both the
nearest neighbor technique and the local concentration
coefficient are used here strictly as measures of the
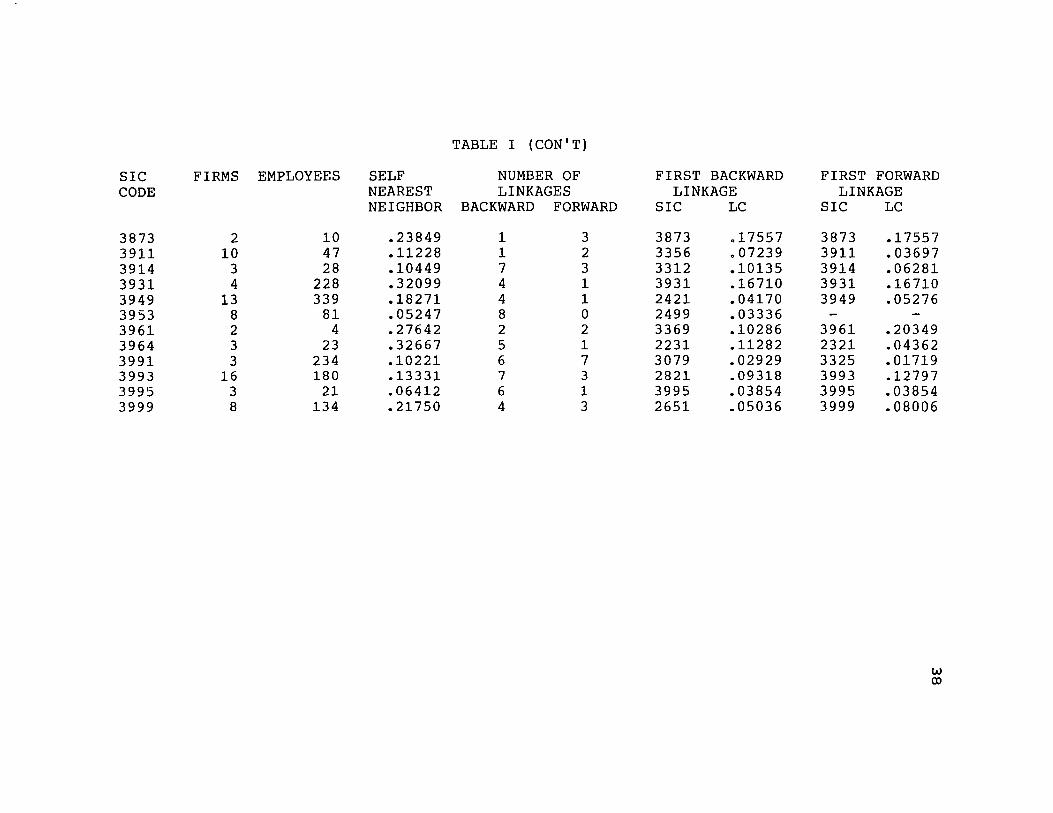
dependent variable, spatial proximity. Industry scores are
presented in Table I to allow an inspection
of concentration patterns.
CUT-OFF OF LINKAGE ANALYSIS
Linkage data are expressed as percentages of total
purchases and sales from a given kth base industry. All
industries which supplied 5 percent or more of the value
of the value of total manufacturing sales were included in
the analysis. This resulted in the identification of up to
8 backward and 9 forward linkages for a given base (k).
LCIs for all paired patterns up to 17 for a single base
industry were calculated. However, there were so few
industries with more than 5 backward or forward inter
industry linkages that the analysis of 6th, 7th, 8th, and
9th inter-industry linkages was technically impractical
by multiple linear regression.
Combinatorial concentrations were represented by
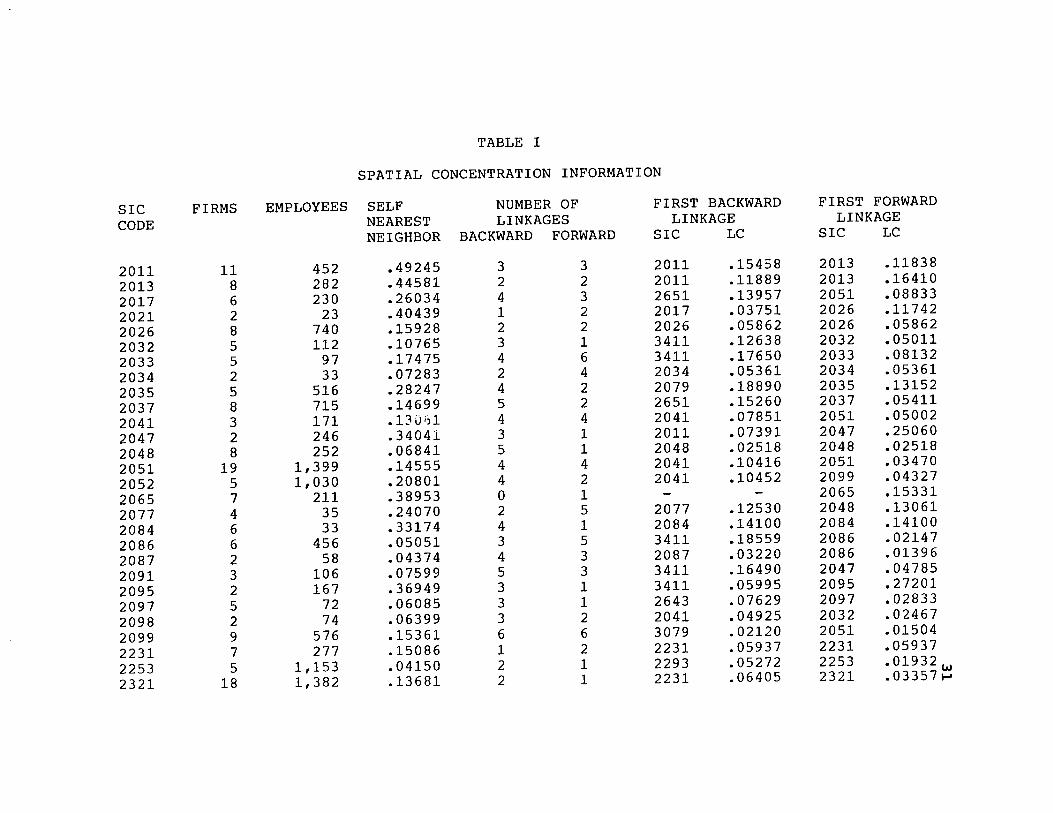
TABLE I
SPATIAL CONCENTRATION INFORMATION
SIC FIRMS EMPLOYEES SELF NUMBER OF FIRST BACKWARD FIRST FORWARD
CODE NEAREST LINKAGES LINKAGE LINKAGE NEIGHBOR BACKWARD FORWARD SIC LC SIC LC
2011 11 452 .49245 3 3 2011 .15458 2013 .11838
2013 8 282 .44581 2 2 2011 .11889 2013 .16410
2017 6 230 .26034 4 3 2651 .13957 2051 .08833
2021 2 23 .40439 1 2 2017 .03751 2026 .11742
2026 8 740 .15928 2 2 2026 .05862 2026 .05862
2032 5 112 .10765 3 1 3411 .12638 2032 .05011
2033 5 97 .17475 4 6 3411 .17650 2033 .08132
2034 2 33 .07283 2 4 2034 .05361 2034 .05361
2035 5 516 .28247 4 2 2079 .18890 2035 .13152
2037 8 715 .14699 5 2 2651 .15260 2037 .05411
2041 3 171 .13(h1 4 4 2041 .07851 2051 .05002
2047 2 246 .34041 3 1 2011 .07391 2047 .25060
2048 8 252 .06841 5 1 2048 .02518 2048 .02518
2051 19 1,399 .14555 4 4 2041 .10416 2051 .03470
2052 5 1,030 .20801 4 2 2041 .10452 2099 .04327
2065 7 211 .38953 0 1 2065 .15331
2077 4 35 .24070 2 5 2077 .12530 2048 .13061
2084 6 33 .33174 4 1 2084 .14100 2084 .14100
2086 6 456 .05051 3 5 3411 .18559 2086 .02147
2087 2 58 .04374 4 3 2087 .03220 2086 .01396
2091 3 106 .07599 5 3 3411 .16490 2047 .04785
2095 2 167 .36949 3 1 3411 .05995 2095 .27201
2097 5 72 .06085 3 1 2643 .07629 2097 .02833
2098 2 74 .06399 3 2 2041 .04925 2032 .02467
2099 9 576 .15361 6 6 3079 .02120 2051 .01504
2231 7 277 .15086 1 2 2231 .05937 2231 .05937
2253 5 1,153 .04150 2 1 2293 .05272 2253 .01932 (.oJ
2321 18 1,382 .13681 2 1 2231 .06405 2321 .03357 ....

TABLE I (CON'T)
SIC FIRMS EMPLOYEES SELF NUMBER OF FIRST BACKWARD FIRST FORWARD
CODE NEAREST LINKAGES LINKAGE LINKAGE NEIGHBOR BACKWARD FORWARD SIC LC SIC LC
2391 19 201 .16853 2 3 2231 .07599 2391 .04025
2392 5 161 .15091 1 2 2231 .05831 2392 .07026
2393 5 632 .26216 2 5 2299 .13148 2041 .11055
2394 9 95 .09543 3 4 2293 .06024 3732 .05118
2399 6 41 .17148 2 2 2231 .06715 3711 .05503
2411 67 984 .33125 3 3 3496 .35751 2421 .05503
2421 39 2,696 .35430 2 4 2411 .05816 2431 .10717
2426 2 22 .15427 3 5 2421 .01722 2511 .07717
2429 7 92 .31951 3 5 2411 .07716 2499 .19610
2431 24 879 .20799 3 3 2421 .03315 2452 .06803
2434 51 642 .28630 6 3 2435 .10115 2431 .06373
2435 10 592 .35780 2 2 2411 .04287 2435 .11951
2439 7 289 .13233 1 2 2421 .03768 3732 .07040
2448 8 177 .40073 2 4 2421 .04342 3079 .05972
2452 9 108 .35390 3 1 2421 .04122 2452 .12282
2491 5 188 .41116 3 7 2421 .05660 3079 .03128
2499 15 339 .29541 4 4 2421 .03558 2499 .07941
2511 10 281 .27585 5 2 2421 .04114 3792 .05272
2512 11 348 .36218 5 2 2231 .12948 3792 .10865
2515 11 195 .14773 5 2 3496 .04947 2515 .04637
2521 3 69 .17944 4 1 2421 .02792 2521 .10786
2531 2 59 .38974 5 2 3312 .20024 3711 .20880
2541 22 503 .21239 5 2 3079 .02876 3732 .06365
2542 2 34 .16869 3 3 3312 .10492 3312 .10492
2591 5 86 .02678 4 1 3079 .00774 2591 .01247
2599 6 120 .32583 4 2 3312 .16918 3731 .09318
2621 5 1,261 .12516 3 6 2411 .05146 2752 .03477
2641 4 757 .18115 4 2 2621 .08941 2751 .03430
2642 3 538 .09167 3 3 2621 .08639 2721 .02855 w
2643 5 429 .20337 4 2 2621 • OL~ SOO 2051 .05827 t.J
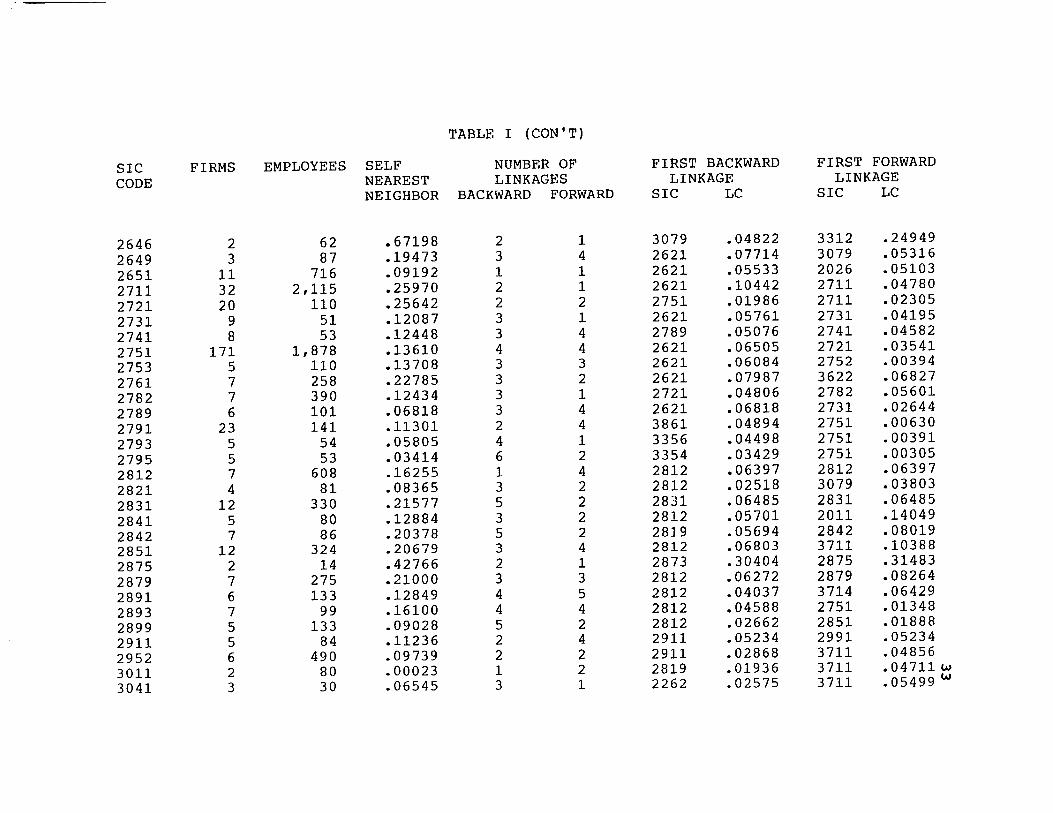
TABLE I (CON'T)
SIC FIRHS EMPLOYEES SELF NUMBER OF FIRST BACKWARD FIRST FORWARD
CODE NEAREST LINKAGES LINKAGE LINKAGE NEIGHBOR BACKWARD FORWARD SIC LC SIC LC
2646 2 62 .67198 2 1 3079 .04822 3312 .24949
2649 3 87 .19473 3 4 2621 .07714 3079 .05316
2651 11 716 .09192 1 1 2621 .05533 2026 .05103
2711 32 2,115 .25970 2 1 2621 .10442 2711 .04780
2721 20 110 .25642 2 2 2751 .01986 2711 .02305
2731 9 51 .12087 3 1 2621 .05761 2731 .04195
2741 8 53 .12448 3 4 2789 .05076 2741 .04582
2751 171 1,878 .13610 4 4 2621 .06505 2721 .03541
2753 5 110 .13708 3 3 2621 .06084 2752 .00394
2761 7 258 .22785 3 2 2621 .07987 3622 .06827
2782 7 390 .12434 3 1 2721 .04806 2782 .05601
2789 6 101 .06818 3 4 2621 .06818 2731 .02644
2791 23 141 .11301 2 4 3861 .04894 2751 .00630
2793 5 54 .05805 4 1 3356 .04498 2751 .00391
2795 5 53 .03414 6 2 3354 .03429 2751 .00305
2812 7 608 .16255 1 4 2812 .06397 2812 .06397
2821 4 81 .08365 3 2 2812 .02518 3079 .03803
2831 12 330 .21577 5 2 2831 .06485 2831 .06485
2841 5 80 .12884 3 2 2812 .05701 2011 .14049
2842 7 86 .20378 5 2 2819 .05694 2842 .08019
2851 12 324 .20679 3 4 2812 .06803 3711 .10388
2875 2 14 .42766 2 1 2873 .30404 2875 .31483
2879 7 275 .21000 3 3 2812 .06272 2879 .08264
2891 6 133 .12849 4 5 2812 .04037 3714 .06429
2893 7 99 .16100 4 4 2812 .04588 2751 .01348
2899 5 133 .09028 5 2 2812 .02662 2851 .01888
2911 5 84 .11236 2 4 2911 .05234 2991 .05234
2952 6 490 .09739 2 2 2911 .02868 3711 .04856
3011 2 80 .00023 1 2 2819 .01936 3711 .04711w
3041 3 30 .06545 3 1 2262 .02575 3711 .05499 w
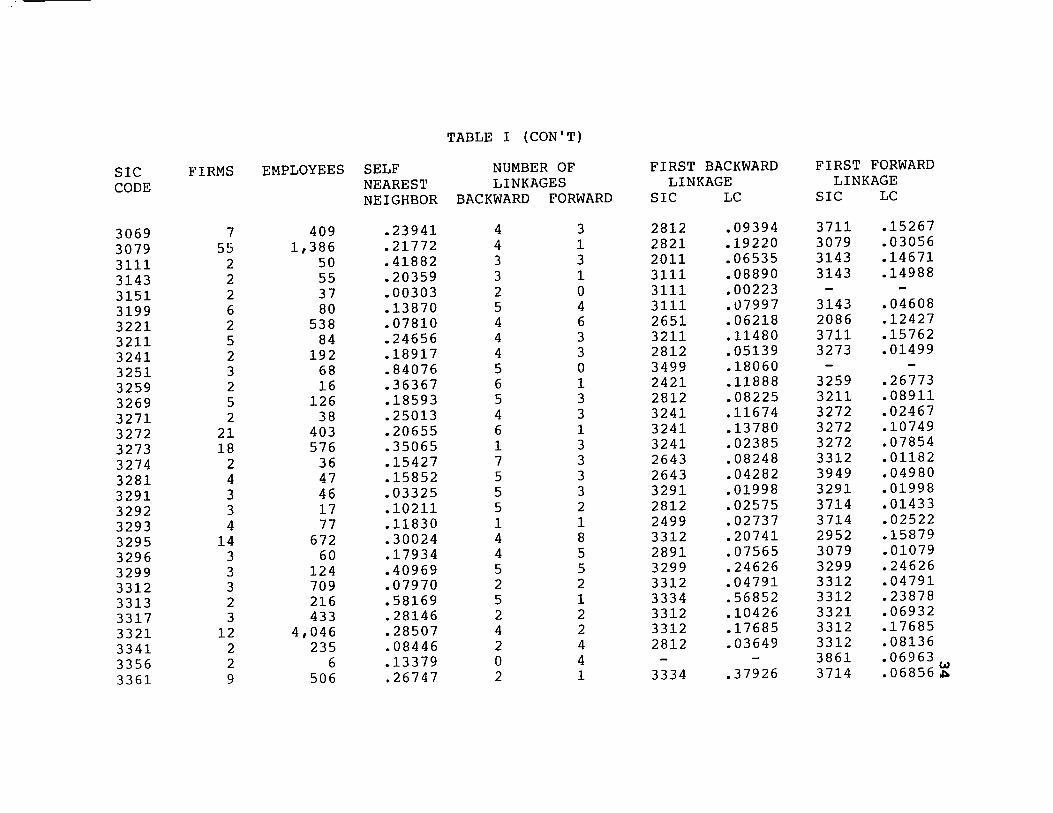
TABLE I (CON'T)
SIC FIRMS EMPLOYEES SELF NUMBER OF FIRST BACKWARD FIRST FORWARD
CODE NEAREST LINKAGES LINKAGE LINKAGE NEIGHBOR BACKWARD FORWARD SIC LC SIC LC
3069 7 409 .23941 4 3 2812 .09394 3711 .15267
3079 55 1,386 .21772 4 1 2821 .19220 3079 .03056
3111 2 50 .41882 3 3 2011 .06535 3143 .14671
3143 2 55 .20359 3 1 3111 .08890 3143 .14988
3151 2 37 .00303 2 0 3111 .00223
3199 6 80 .13870 5 4 3111 .07997 3143 .04608
3221 2 538 .07810 4 6 2651 .06218 2086 .12427
3211 5 84 .24656 4 3 3211 .11480 3711 .15762
3241 2 192 .18917 4 3 2812 .05139 3273 .01499
3251 3 68 .84076 5 0 3499 .18060
3259 2 16 .36367 6 1 2421 .11888 3259 .26773
3269 5 126 .18593 5 3 2812 .08225 3211 .08911
3271 2 38 .25013 4 3 3241 .11674 3272 .02467
3272 21 403 .20655 6 1 3241 .13780 3272 .10749
3273 18 576 .35065 1 3 3241 .02385 3272 .07854
3274 2 36 .15427 7 3 2643 .08248 3312 .01182
3281 4 47 .15852 5 3 2643 .04282 3949 .04980
3291 3 46 .03325 5 3 3291 .01998 3291 .01998
3292 3 17 .10211 5 2 2812 .02575 3714 .01433
3293 4 77 .11830 1 1 2499 .02737 3714 .02522
3295 14 672 .30024 4 8 3312 .20741 2952 .15879
3296 3 60 .17934 4 5 2891 .07565 3079 .01079
3299 3 124 .40969 5 5 3299 .24626 3299 .24626
3312 3 709 .07970 2 2 3312 .04791 3312 .04791
3313 2 216 .58169 5 1 3334 .56852 3312 .23878
3317 3 433 .28146 2 2 3312 .10426 3321 .06932
3321 12 4,046 .28507 4 2 3312 .17685 3312 .17685
3341 2 235 .08446 2 4 2812 .03649 3312 .08136
3356 2 6 .13379 0 4 3861 .06963 w 3361 9 506 .. 26747 2 1 3334 .37926 3714 • 06856 ~
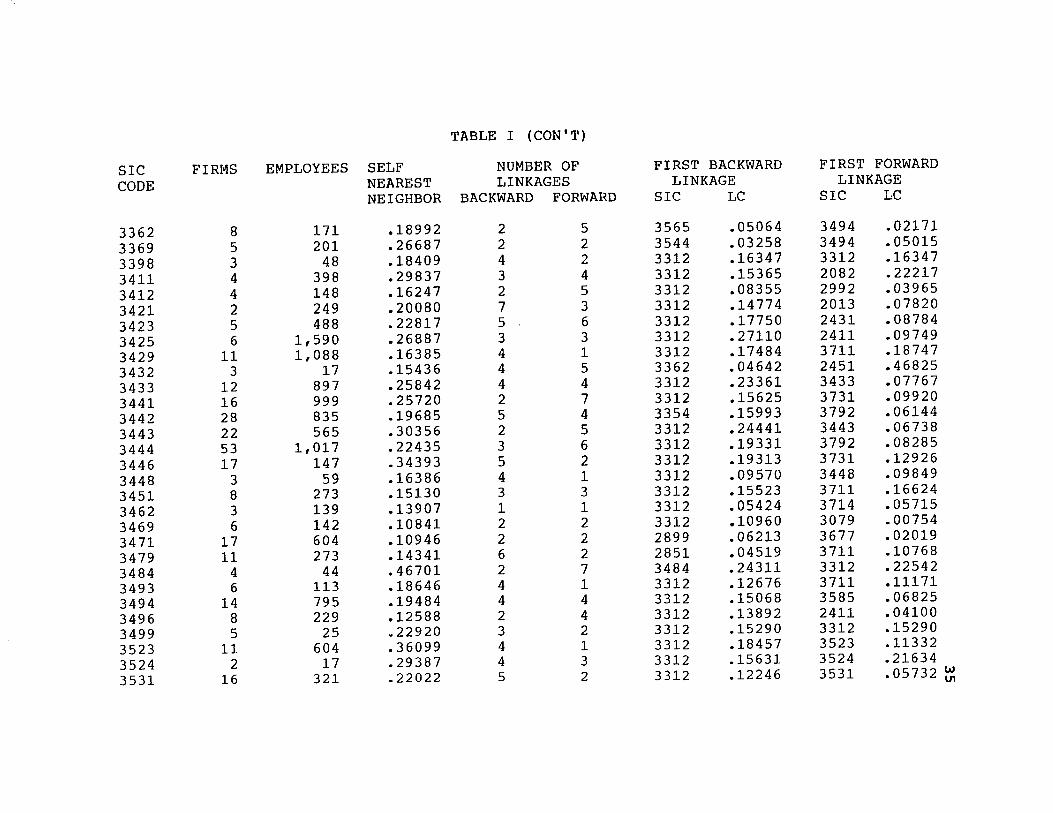
TABLE I (CON'T)
SIC FIRMS EMPLOYEES SELF NUMBER OF FIRST BACKWARD FIRST FORWARD
CODE NEAREST LINKAGES LINKAGE LINKAGE NEIGHBOR BACKWARD FORWARD SIC LC SIC LC
3362 8 171 .18992 2 5 3565 .05064 3494 .02171
3369 5 201 .26687 2 2 3544 .03258 3494 .05015
3398 3 48 .18409 4 2 3312 .16347 3312 .16347
3411 4 398 .29837 3 4 3312 .15365 2082 .22217
3412 4 148 .16247 2 5 3312 .08355 2992 .03965
3421 2 249 .20080 7 3 3312 .14774 2013 .07820
3423 5 488 .22817 5 6 3312 .17750 2431 .08784
3425 6 1,590 .26887 3 3 3312 .27110 2411 .09749
3429 11 1,088 .16385 4 1 3312 .17484 3711 .18747
3432 3 17 .15436 4 5 3362 .04642 2451 .46825
3433 12 897 .25842 4 4 3312 .23361 3433 .07767
3441 16 999 .25720 2 7 3312 .15625 3731 .09920
3442 28 835 .19685 5 4 3354 .15993 3792 .06144
3443 22 565 .30356 2 5 3312 .24441 3443 .06738
3444 53 1,017 .22435 3 6 3312 .19331 3792 .08285
3446 17 147 .34393 5 2 3312 .19313 3731 .12926
3448 3 59 .16386 4 1 3312 .09570 3448 .09849
3451 8 273 .15130 3 3 3312 .15523 3711 .16624
3462 3 139 .13907 1 1 3312 .05424 3714 .05715
3469 6 142 .10841 2 2 3312 .10960 3079 .00754
3471 17 604 .10946 2 2 2899 .06213 3677 .02019
3479 11 273 .14341 6 2 2851 .04519 3711 .10768
3484 4 44 .46701 2 7 3484 .24311 3312 .22542
3493 6 113 .18646 4 1 3312 .12676 3711 .11171
3494 14 795 .19484 4 4 3312 .15068 3585 .06825
3496 8 229 .12588 2 4 3312 .13892 2411 .04100
3499 5 25 .22920 3 2 3312 .15290 3312 .15290
3523 11 604 .36099 4 1 3312 .18457 3523 .11332
3524 2 17 .29387 4 3 3312 .15631 3524 .21634
3531 16 321 .22022 5 2 3312 .12246 3531 .05732 ~

TABLE I (CON'T)
SIC FIRMS EMPLOYEES SELF NUMBER OF FIRST BACKWARD FIRST FORWARD
CODE NEAREST LINKAGES LINKAGE LINKAGE NEIGHBOR BACKWARD FORWARD SIC LC SIC LC
3532 3 625 .25410 4 4 3312 .17489 3732 .15724
3534 2 29 .12787 3 4 3312 .07391 3731 .02363
3535 9 314 .18509 3 3 3312 .18937 3531 .06425
3536 5 218 .18490 4 4 3312 .24245 3731 .16060
3537 15 1,907 .20408 4 5 3312 .16363 3537 .05486
3541 4 71 .08638 6 5 3531 .04496 3541 .04496
3544 19 173 .21058 5 1 3312 .19279 3544 .05030
3546 4 210 .37340 4 4 3544 .04980 2411 .02843
3551 4 32 .13985 4 1 3312 .11297 3551 .07280
3553 34 1,635 .15307 4 7 3544 .05911 2411 .05571
3554 5 187 .23648 6 3 3554 .11011 3554 .11011
3555 2 80 .13100 5 5 355~j .09644 3555 .09644
3559 8 342 .18405 6 4 3312 .17692 2812 .08141
3561 6 1,097 .06059 3 5 3324 .02290 3312 .09926
3564 6 822 .23610 2 7 3312 .18774 3585 .06783
3565 12 134 .13850 5 3 2421 .03716 3324 .04377
3566 3 33 .19008 5 3 3312 .10637 3531 .07497
3567 5 136 .18674 3 4 3312 .15889 3567 .08695
3569 5 94 .20801 4 2 3312 .13837 2812 .06557
3573 5 1,904 .25576 3 1 3573 .11908 3573 .11908
3576 2 14 .13379 6 3 3079 .03751 3576 .09849
3579 2 5 .29387 4 2 3312 .20778 3579 .21634
3581 2 18 .25013 7 3 3312 .14029 3581 .18414
3585 5 156 .17850 3 2 3585 .08311 3585 .08311
3589 7 190 .25981 3 5 3312 .23709 3589 .10224
3592 2 201 .45372 6 3 3312 .25266 3711 .20983
3599 103 1,821 .18825 3 2 3599 .01948 3599 .01948
3612 4 435 .28908 2 2 3312 .16328 3646 .08620
3613 8 412 .26985 2 3 3622 .07714 3743 .11327 w
3622 9 135 .25579 5 4 3622 .08877 3585 .10831 0'1

TABLE I (CON'T)
SIC FIRMS EMPLOYEES SELF NUMBER OF FIRST BACKWARD FIRST FORWARD
CODE NEAREST LINKAGES LINKAGE LINKAGE NEIGHBOR BACKWARD FORWARD SIC LC SIC LC
3643 4 150 .24375 3 6 3312 .20773 3661 .10385
3645 7 79 .13843 6 3 3612 .06428 3711 .10099
3691 9 318 .20643 3 2 3672 .12898 3711 .12993
3661 3 465 .32183 4 1 3661 .19345 3661 .19345
3662 11 333 .22953 3 3 3667 .02591 3662 .07205
3674 4 2,812 .17284 5 5 3677 .03374 3662 .04235
3677 16 1,184 .23207 4 6 3677 .06040 3662 .06360
3691 6 379 .25027 4 2 2819 .10178 3711 .19379
3693 6 203 .18821 5 9 3672 .14600 3693 .07999
3694 7 176 .23407 2 3 3694 .09211 3711 .16185
3713 7 170 .30409 6 4 3711 .11658 3711 .11658
3714 33 972 .19645 4 2 3312 .17795 3711 .18950
3715 16 619 .23355 4 2 3714 .05183 3713 .04836
3728 4 1,634 .46997 5 1 3728 .24465 3728 .24465
3731 13 2,493 .09660 2 1 3312 .09411 3731 .02789
3732 17 84 .23316 2 1 3211 .10054 3732 .05887
3743 3 1,430 .19359 3 2 3743 .11636 3743 .11636
3751 5 127 .24105 5 1 3731 .11223 3751 .11223
3792 13 166 .30879 5 1 3714 .07152 3792 .08916
3799 4 60 .08136 4 6 3312 .21202 3799 .04235
3811 6 141 .30897 4 3 3677 .04893 3811 .12561
3822 2 284 .02327 4 2 3079 .03109 3585 .11674
3823 3 368 .28744 2 3 3679 .04785 3711 .16061
3825 6 15,562 .15543 5 3 3679 .04499 3825 .06606
3832 3 19 .08445 5 2 3832 .05076 3832 .05076
3841 10 609 .12700 5 3 3079 .01353 3842 .21708
3842 10 89 .09459 6 1 2231 .05699 3842 .03114
3843 8 148 .23786 2 1 3356 .18902 3843 .08755
3851 8 174 .11797 5 3 3851 .04342 3851 .04342 w
3861 6 900 .10337 7 3 2812 .07711 3861 .04394 ~
SIC FIRMS EMPLOYEES SELF CODE NEAREST
NEIGHBOR
3873 2 10 .23849 3911 10 47 .11228 3914 3 28 .10449 3931 4 228 .32099 3949 13 339 .18271 3953 8 81 .05247 3961 2 4 .27642 3964 3 23 .32667 3991 3 234 .10221 3993 16 180 .13331 3995 3 21 .06412 3999 8 134 .21750
TABLE I (CON'T)
NUMBER OF LINKAGES
BACKWARD FORWARD
1 3 1 2 7 3 4 1 4 1 8 0 2 2 5 1 6 7 7 3 6 1 4 3
FIRST BACKWARD LINKAGE
SIC LC
3873 .17557 3356 007239 3312 .10135 3931 .16710 2421 .04170 2499 .03336 3369 .10286 2231 .11282 3079 .02929 2821 .09318 3995 .03854 2651 .05036
FIRST FORWARD LINKAGE
SIC
3873 3911 3914 3931 3949
3961 2321 3325 3993 3995 3999
LC
.17557
.03697
.06281
.16710
.05276
.20349
.04362
.01719
.12797
.03854
.08006
w (l)

39
adding the LCls of appropriate linked sectors. Again,
limitations in the number of industries with more than 5
backward or forward linkages forced the exclusion of inter
industry linkages 6, 7, 8, and 9 from inclusion in the
combinatorial analysis.
AREA SELECTION
Nations, regions, metropolitan areas, and local
communities compete for the siting of new manufacturing
facilities. Firms begin their search at the broadest
geographical levels and eventually narrow their choices to
local areas and sites. Trade-offs will be evaluated as each
area and site will individually and in combination offer a
different bundle of opportunities and constraints.
But in the end it is the local regions and communities which
furnish the sites on which the new facilities will be
constructed. Therefore plant location theoretical
formulations and empirical studies must include an
examination of the siting process at the site, local, and
regional levels.
Empirical studies have investigated the site
selection process at the macro and micro levels of analysis.
It is clearly recognized that it is inappropriate to
generalize findings from the site to area level (Stanford
Research Institute 1982). The findings at the macro level
have been applied to the local area level by policy-makers

40
and practitioners as the search goes on for propulsive or
magnet industries which will stimulate development in the
local economy, attract suppliers, and develop localized
markets for goods and services (Oregon Economic Development
Department 1977, Oregon Department of Land Conservation and
Development 1973, Mu1tnomah County 1977, and Bate11e
Memorial Institute 1967, 1975). The question is whether
these policies and programs justified by empirical findings
at the international, national and regional levels will work
at the metropolitan scale. Recent findings by research/
practitioners have found that the attraction of associated
industry to the community may not have the magnitude of
impact expected (Sommers 1984). This study focused on
the relevancy of hypotheses generated in the literature
through micro level theory development and empirical •
studies done at various levels, with the exception of the
micro one.
Most manufacturing firms prefer a site within a metro
politan area (U.S. Department of Commerce 1973). Sites
selected present a picture of the end result of the
locationa1 search process. The metropolitan area chosen for
study must have the following attributes if the influences
of intra-industry and inter-industry linkages are to be
assessed.
1. Subarea differences on influential variables

other than the linkage variables should be
minimal.
41
2. Multi-modal transshipment nodes should be available
and transportation infrastructure offer a choice
of transportation modes at competitive costs
3. Utilities should be available and costs of
delivered services competitive
4. An inventory of buildable sites must have been
available across time.
5. A diversified manufacturing base with a relatively
large number of firms capable of supporting
intra-industry and inter-industry networks
6. A stable community framework which supports
economic growth and diversification
The Oregon portion of the Portland-Vancouver SMSA
meets these requirements. Subarea cost variations for land,
labor, and capital are minimal although the usual
differences between the central city and suburban fringe do
exist. These differences do not, however, distinguish the
Portland metropolitan area from other medium sized metro
politan areas. A full range of industrial sites with
varying locational features and levels of public infra
structure have been historically available within the urban
and urbanizable portions of the area (Baldwin, 1982)
although a recent study (Stanford Research Institute 1982)
questions the validity of this assertion in the 1980's for
42
the attraction of a full range of industry.
The Portland-Vancouver SMSA was credited with having
the eleventh most diversified manufacturing base of all metro
politan areas in 1975 and ranked eighth in volume of tonnage
shipped and received in 1977 (Multnomah County 1977). The
Counties of Multnomah, Clackamas, and Washington which
make-up the Oregon portion of the SMSA contains identified
220 4 digit Standard Industrial Classification manufacturing
industries representing an estimated 2,111 firms with an
estimated combined labor force of 108,295 in 1977.
The Portland-Vancouver SMSA serves as the State's
commercial and distribution center. Its strategic location
on the Columbia River fostered its development as a
transshipment point for goods to and from the inland areas.
utility costs, particularly for electricity, are
comparatively low (Stanford Research Institute 1982).
Capital for development has been historically available
although until recently natural resource oriented industries
were favored by local investors over high technology
economic activities (First Interstate Bank, 1977).
Historically, public land use policies and
regulations have been flexible, allowing industry to locate
where site requirements could be met with minimal publicly
imposed constraints (Baldwin 1982). Until recently the
availability of federal grants to support public infra
structure development allowed local communities to keep
43
pace with industries' demand for physical and social
infrastructure. Differences in political policy, taxation,
transportation freight rates, and utility costs required the
deletion of Clark County Washington, the fourth County of the
metropolitan area from this study.
The time chosen for the study was 1977. Major
changes in public policies and regulations came about with
the adoption of the Statewide Land Use Planning Goals and
Urban Growth Boundary Strategies in 1973 and the first of
the major jurisdictional comprehensive land use in
compliance with new Statewide requirements. The impact of
these regulations and resulting land use plans are a matter
of some controversy. A study done by 1000 Friends of Oregon
(1982) concludes that the inventory of buildable and
industrially zoned sites increased substantially as a
result of these plans. As has already been discussed the
Stanford Research Institute (1982) questions the adequacy
of current industrial site inventories. In addition, the
current economic recession which took hold on the
metropolitan area economy in 1979 and federal policy changes
in the 1980's have created sUbstantial shifts in the
marketplace and availability of infrastructure capital.
The post 1977 period represents a time of changing
conditions for the regional, state, and metropolitan area
economies. Local governments have adopted comprehensive
land use plans and implementing ordinances under the

44
Statewide Planning Goals and Guidelines. Demand for Oregon
wood products has declined affecting the employment bases
of many Oregon communities as more than 40 percent of the
State's manufacturing employment is dependent upon the
lumber and wood products industries (Multnomah County 1977).
The majority of the growth in the high technology
instruments industrial grouping has occurred in the late
1970's and 1980's. Federal funding for new infrastructure
development is being severely curtailed at a time when Oregon
communities are now under a 1983 legislative directive to
develop long range public facilities and services plans
(Oregon Legislature 1983). The national recession which hit
Oregon in 1979 and still cripples much of the State's
economy has led to increased efforts to develop a Statewide
approach to economic development (Oregon Legislature 1983).
How these shifts in the marketplace, resource
availability, new political approaches, and land use
regulations will affect future opportunities for economic
growth and diversification in the long run is not yet known.
This dissertation in its investigation of the influence of
intra- and inter-industry linkages on firm spatial proximity
at the metropolitan level, depending on the results obtained,
will suggest the continued use or reassessment of a strategy
applied locally in an attempt to overcome existing economic
conditions.
45
VARIABLE MEASUREMENT
Spatial Proximity
The intra-industry spatial proximity of firms is
measured with the use of the Nearest Neighbor coefficients
and inter-industry firm spatial proximity by the use of
Local Concentration coefficients. The areal dimensions for
both equations take into account the actual area in which
manufacturing firms could site by the subtraction of
subareas within the 3 Counties within federal and state
national forests and recreation areas such as the Mt. Hood
National Forest. The inclusion of natural resource and
urban oriented manufacturing industries precluded
the need for further modification of area measurements to
differentiate between urban and rural areas.
Firms were mapped by industry and by plant address on
milar overlays over a 1"=2000 ft. base scale map of the
Portland metropolitan area. A list of firms and employment
by industry is displayed in Table I. Inter-firm distance
measures were made and rounded to the nearest tenth of an
inch and then converted into miles and feet. A reliability
check on a randomly selected 10 percent sample of measures
indicated that over 99 percent of the measurements were
accurate within one-tenth of an inch on the base map.
Table II lists the study variables and gives definitions
for each one used.
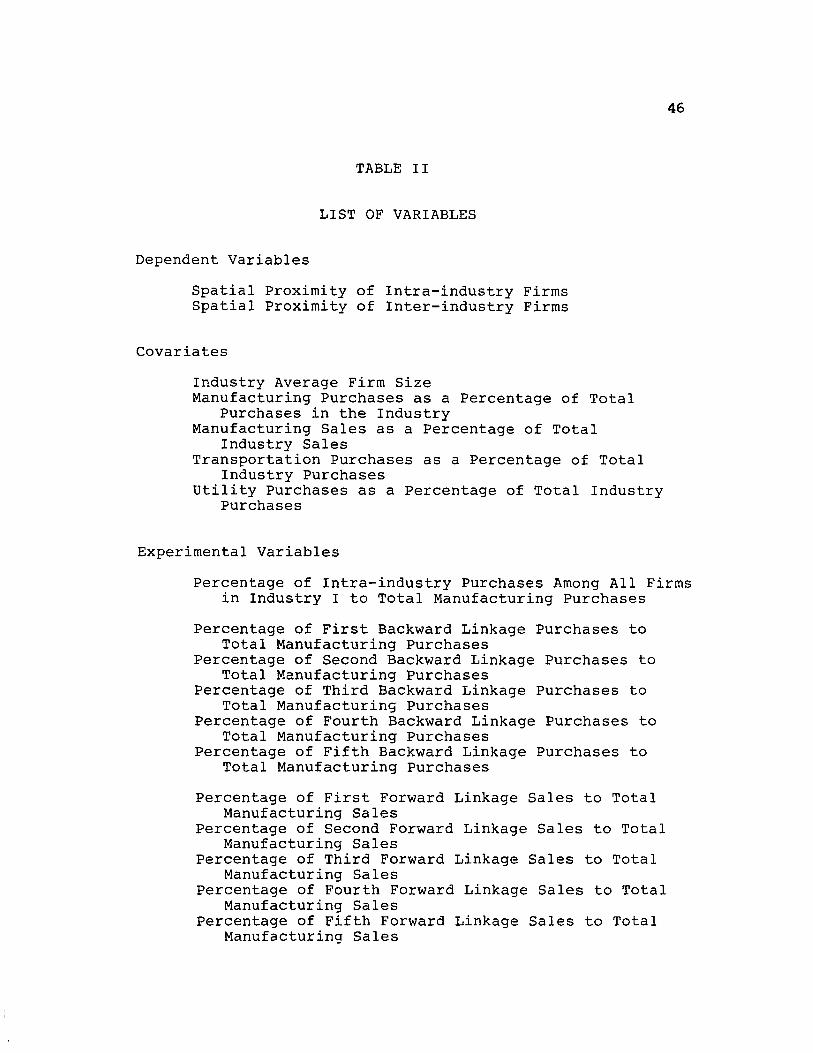
TABLE II
LIST OF VARIABLES
Dependent Variables
Spatial Proximity of Intra-industry Firms Spatial Proximity of Inter-industry Firms
Covariates
Industry Average Firm Size Manufacturing Purchases as a Percentage of Total
Purchases in the Industry Manufacturing Sales as a Percentage of Total
Industry Sales Transportation Purchases as a Percentage of Total
Industry Purchases Utility Purchases as a Percentage of Total Industry
Purchases
Experimental Variables
46
Percentage of Intra-industry Purchases Among All Firms in Industry I to Total Manufacturing Purchases
Percentage of First Backward Linkage Purchases to Total Manufacturing Purchases
Percentage of Second Backward Linkage Purchases to Total Manufacturing Purchases
Percentage of Third Backward Linkage Purchases to Total Manufacturing Purchases
Percentage of Fourth Backward Linkage Purchases to Total Manufacturing Purchases
Percentage of Fifth Backward Linkage Purchases to Total Manufacturing Purchases
Percentage of First Forward Linkage Sales to Total Manufacturing Sales
Percentage of Second Forward Linkage Sales to Total Manufacturing Sales
Percentage of Third Forward Linkage Sales to Total Manufacturing Sales
Percentage of Fourth Forward Linkage Sales to Total Manufacturing Sales
Percentage of Fifth Forward Linkage Sales to Total Manufacturing Sales

47
Linkages
To identify within and between industry trade flows
theorists and researchers have traditionally used location
quotients and input-output transactions tables. These
tables identify inter-industry transactional flows (Leontief
1951), analyze industry interlocking dependencies and derive
estimates how changes in one industry will impact other
industries and sectors of the economy (Nourse 1968;
Richardson 1972; Hewings 1977).
The use of input-output transactional tables at the
4 digit SIC level of disaggregation is most appropriate for
this study. The problems of the use of more aggregated
data are already noted and the use of a finer screen requires
the grouping of firms into too great a number of categories
for use at the metropolitan level of analysis. Input-output
transactional tables describe the magnitude of inter-industry
industry exchanges of goods and services in dollars--the
information needed to develop intra-industry and inter
industry linkages. Level of product export is not relevant
for this study as the focus is upon within area intra
industry and inter-industry linkage networks and
participants. Industries were excluded from the firm set
if no production facilities were present locally.
Headquarters facilities were also excluded although any
local production facilites were included in the industry set.
Inter-industry technological coefficients are used to

48
describe the magnitude of product and service exchanges among
established inter-industry trading partners. Stability of
measurement rather than fluctuations in relationships
sensitive to short-term changing market conditions is the
issue. Stability is an assumption on which input-output
models is based although Walker (1982) notes that adjustments
may be needed to apply national or regional coefficients at
the local level. Tiebout (1962) suggested a questionnaire
method which could be used to make these adjustments and
apply this analysis technique at the local level. Ettlinger
(1984) criticizes conventional Kenseyian multiplier base
linkages because of the organizational factors of firms
which inhibit local linkages. Gibson and Worden (1981)
suggest that the minimum requirements approach gives the
best estimate of census survey multipliers. Tiebout
(1956) and Isard (1960) recognizing the greater stability
of the national coefficients over time caution researchers
using a longitudinal time frame in the research design
about the compounding of measurement problems likely with
the use of regional rather than national measures.
This study although using a 1977 cross~sectional
data bank about plant location is using input-output
locational coefficients to describe established inter
industry linkages most likely to lead to cost-reductions
or revenue generation and be considered as a location factor
by firms. These inter-industry measures are treated as

technological linkages rather than reflectors of actual
transactional flow patterns within the Portland regional
economy.
49
The Detailed Input-Output Structure of the u.s
Economy 1972 (U.S. Department of Commerce, Bureau of
Economic Analysis 1979) Use of Commodities by Industry
table was used to obtain intra-industry and inter-industry
records of purchases and sales. Firms are grouped into
commodity/industrial classes equivalent in almost all cases
to a 4 digit SIC category. Table I lists the number of
industries, firms, and employment in the metropolitan area
within each commodity/industry class and SIC categorical
equivalences.
Industries with no plant in the region were dropped
from the analysis and plants missing from the original
data set were added. Table XIX in the Appendix lists by
industry and employment 223 firms added to the original
firm list. Total firm deletions were 106: 44 were out of
area; 41 could not be located, and 21 firms were actually
headquarters facilities or closed.
Additions resulted in a regional manufacturing
employment estimate of 108,295 with a net increase of 3,640
due to firm list refinement. Sixteen industries with only
one facility in the region were used in the analysis as a
supplier of inputs or purchaser of outputs but could not be
treated directly as a subject firm due to measurement
50
requirements of the Nearest Neighbor and Local Concentration
formulations. The data base was composed of 220 industries
with 2,111 firms.
Norcliffe (1975) found that the use of a modified
location quotient produced scores which were roughly
equivalent in their magnitude to input-out coefficients
with a data base organized at the 4 digit Standard
Industrial Classification level. In a similar study
Isserman (1977) found that much of the unreliability of
location quotients in previous research was associated,
again, with the heterogeneity of industrial categories
used. Input-output coefficients were used in this
study at the 4 digit SIC level.
Transportation and Utility Costs
Expenditures on transportation and related services
and utilities were obtained from the input-output
transactions table (U. S. Department of Commerce, Bureau of
Economic Analysis 1979). Total transportation costs
include expenditures for passenger miles and commodity
movement by highway, truck, rail, air, water, and pipeline
and related transportation services. utilities include
expenditures for water, sanitary sewer, gas, and electricity.
For each the subcategories were summed and defined in terms
of the percentage of total industry purchases they
represented.
Supply and Market Orientation
Manufacturing supply (material) orientation is the
percent of total expenditures made spent for manufacturing
inputs. Market orientation is the percent of total sales
made to manufacturing firms. Industries vary in the
proportion of their purchases and sales that are made with
other manufacturing plants.
51
The location of other manufacturing facilities would
not be expected to be important for other firms who
purchase or sell a majority of their inputs and outputs
outside the manufacturing sector of the economy. As with
transportation and utility costs these variables are
treated as covariates within the model.
Industry Average Firm Size
The prepondence of the studies in location theory which
have included firm size as a variable have found effects
attributable to firm size. Industry average firm size
equals the total number of employers in the industry
divided by the number of firms. The purpose of this
variable's inclusion as a covariate is to account for the
variability in the dependent variable, spatial proximity,
attributable to firm size.
The smallest firm in the firm subset had 1 employee
and the largest just over 9,000. The smallest subject
industry had 4 employees and the largest 15,562. The largest

number of firms per industry was 171 (Table I).
CONCLUSION
To summarize, it is hypothesized that intra-industry
and primary inter-industry linkages are not significant
determinants of firm location within a metropolitan
economy. It is also expected that spatial proximity of
firms is not related to the magnitude of their composite
forward and backward linkages. Failure to reject the
null hypotheses will provide support for the research
hypotheses as stated earlier in this chapter.
52

CHAPTER IV
FINDINGS
Multiple regression covariance applications were
used to examine the relationships of intra-industry and
inter-industry linkages to firm spatial proximity.
variation in the dependent variable attributable to inter
industry linkages was also examined for combinations of
backward and forward linkages.
The treatment of average firm size, supply and
market orientations, and transportation and utility industry
intensities as covariates allowed their aggregate influence
on the dependent variable to be controlled prior to
measurement of the impacts of the experimental variables.
The utility cost index is composed of water, electric, and
sanitary sewer services purchases. The transportation cost
composite index covers expenditures for passenger travel and
movement of commodities by truck, water, air, rail, and
pipleline. Colinearity between the covariates and the
experimental variables was not an issue in this
study. Considering all regression runs, association among
covariates and experimental variables ranged from a low
of -.2606 between the first forward linkage and market
orientation in the first forward linkage model to .37109
between the second backward linkage and transportation
purchases in the three backward and three forward linkage
model.
54
To reiterate, the research hypotheses of this study are:
1. The spatial proximity of firms in an industry
is not related to the magnitude of intra-industry
technological linkages.
2. The spatial proximity of firms is not related to
the magnitude of their primary forward and
backward linkages.
3. The spatial proximity of firms is not related to
magnitude of their composite forward and backward
linkages.
SUMMARY OF REGRESSION FINDINGS
Applications were considered for intra-industry
linkages (Table III and IV), 5 backward linkages (Tables V
VII), 2 backward combinations (Table VIII), 5 forward
linkages (Tables IX-XI), 2 forward combinations (Table XII) ,
and 9 combinations of up to 3 forward and backward linkages
(Tables XIII-XVII). Attrition of industries when using
inter-industry linkages in combination precluded the use of
4th and 5th linkages together with the other inter-industry
linkages.
Two multiple regression models had a overall F ratio
significant at the .05 level: 1) intra-industry linkages
when the covariate market orientation rather than supply

VARIABLE
utility Purchases
Manufacturing Purchases
Average Firm Size
Transportation Purchases
Intra-Industry Transactions
Constant
TABLE III
REGRESSION OF INTRA-INDUSTRY LINKAGE WITH COVARIATES INCLUDING MANUFACTURING
PURCHASES
REGRESSION STANDARD COEFFICIENT ERROR B
1.3495 0.5369
0.0203 0.0671
-0.0011 0.0041
0.0439 0.3861
0.0296 0.0539
17.9119
R2=0.0392 ADJUSTED R2=O.0168 F=1. 7481 STANDARD ERROR=11.5597
*** Significant at the .001 level
N=220
F, REGRESSION COEFFICIENT
6.319***
0.092
0.071
0.013
0.301
Ul V1
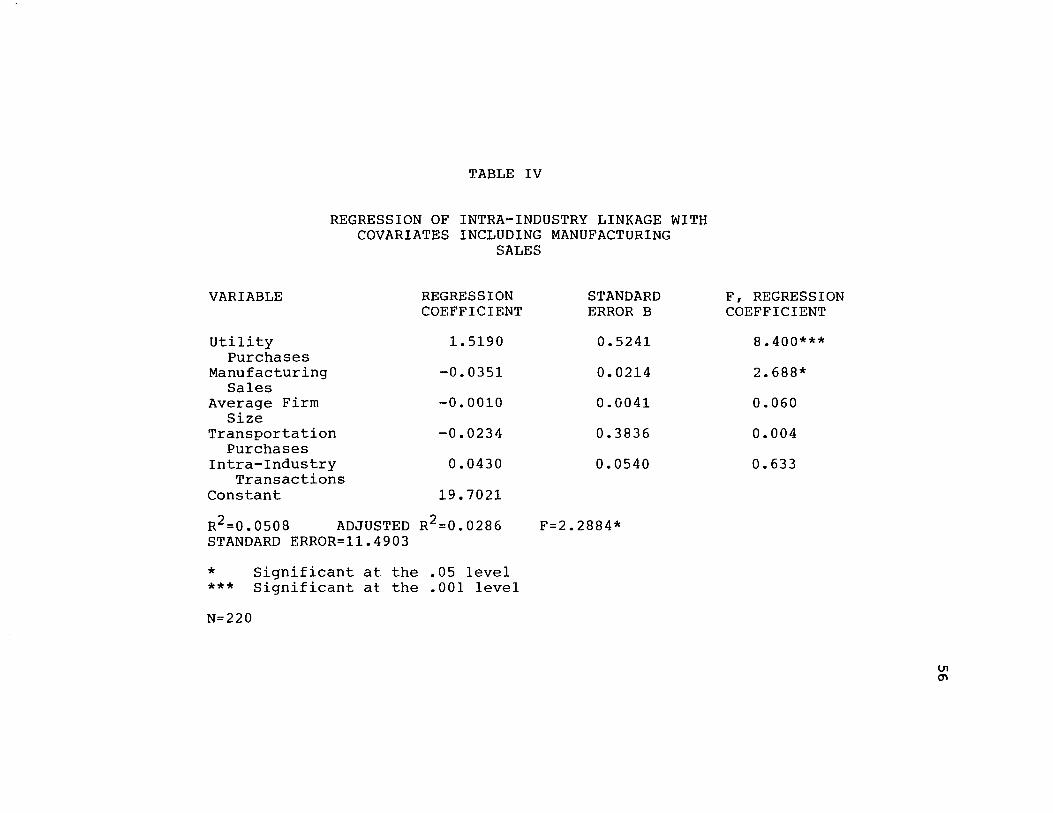
TABLE IV
REGRESSION OF INTRA-INDUSTRY LINKAGE WITH COVARIATES INCLUDING MANUFACTURING
SALES
VARIABLE REGRESSION STANDARD COEFFICIENT ERROR B
Utility 1.5190 0.5241 Purchases
Manufacturing -0.0351 0.0214 Sales
Average Firm -0.0010 0.0041 Size
Transportation -0.0234 0.3836 Purchases
Intra-Industry 0.0430 0.0540 Transactions
Constant 19.7021
R2=0.OS08 ADJUSTED R2=0.0286 F=2.2884* STANDARD ERROR=11.4903
* Significant at the .05 level *** Significant at. the .001 level
N=220
F, REGRESSION COEFFICIENT
8.400***
2.688*
0.060
0.004
0.633
111
'"
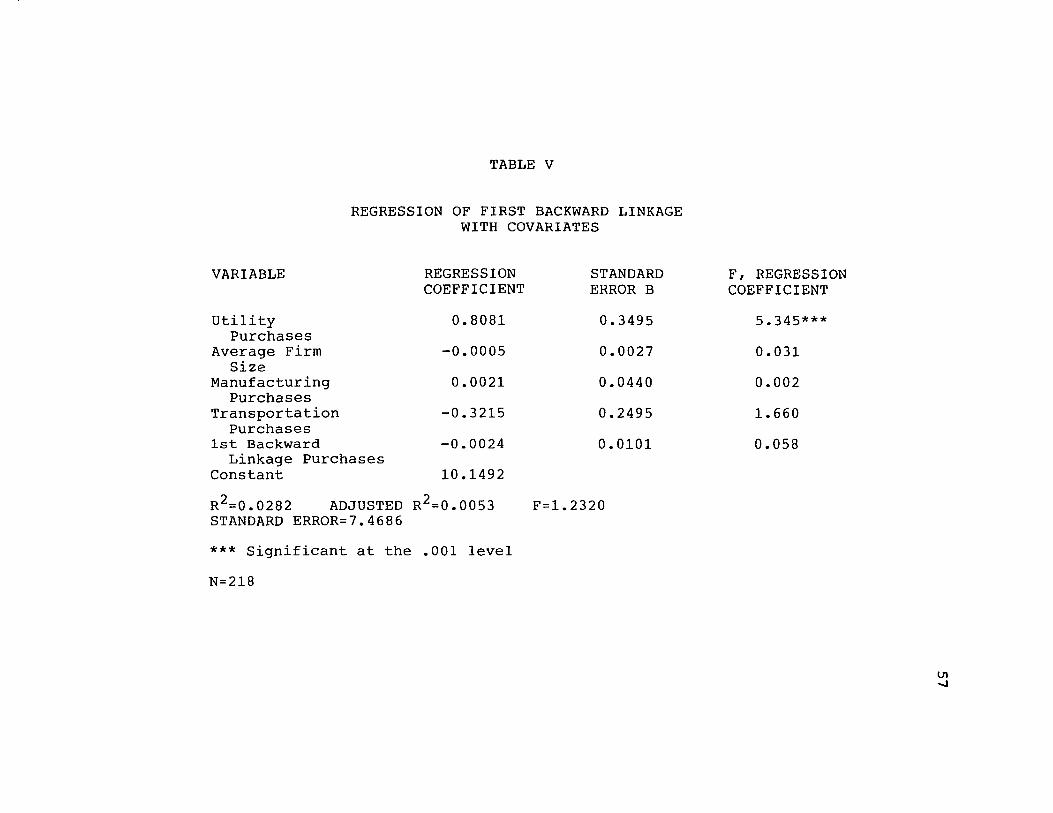
TABLE V
REGRESSION OF FIRST BACKWARD LINKAGE WITH COVARIATES
VARIABLE REGRESSION STANDARD COEFFICIENT ERROR B
Utility 0.8081 0.3495 Purchases
Average Firm -0.0005 0.0027 Size
Manufacturing 0.0021 0.0440 Purchases
Transportation -0.3215 0.2495 Purchases
1st Backward -0.0024 0.0101 Linkage Purchases
Constant 10.1492
R2=0.0282 ADJUSTED R2=0.0053 F=1. 2320 STANDARD ERROR=7.4686
*** Significant at the .001 level
N=218
F, REGRESSION COEFFICIENT
5.345***
0.031
0.002
1.660
0.058
U'I .....,
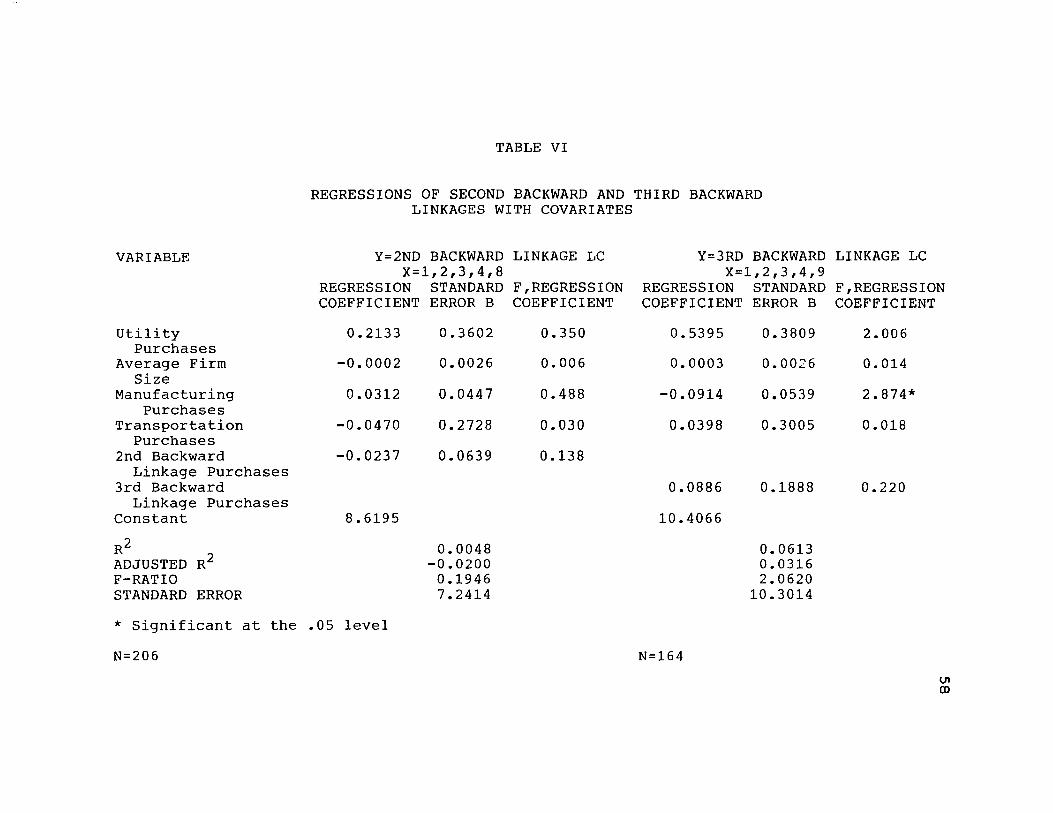
VARIABLE
Utility Purchases
Average Firm Size
Manufacturing Purchases
Transportation Purchases
2nd Backward Linkage Purchases
3rd Backward Linkage Purchases
Constant
R2 ADJUSTED R2 F-RATIO STANDARD ERROR
TABLE VI
REGRESSIONS OF SECOND BACKWARD AND THIRD BACKWARD LINKAGES WITH COVARIATES
Y=2ND BACKWARD LINKAGE LC Y=3RD BACKWARD LINKAGE LC X=1,2,3,4,8 X=1,2,3,4,9
REGRESSION STANDARD F,REGRESSION REGRESSION STANDARD F,REGRESSION COEFFICIENT ERROR B COEFFICIENT COEFFICIENT ERROR B COEFFICIENT
0.2133 0.3602 0.350 0.5395 0.3809 2.006
-0.0002 0.0026 0.006 0.0003 0.0026 0.014
0.0312 0.0447 0.488 -0.0914 0.0539 2.874*
-0.0470 0.2728 0.030 0.0398 0.3005 0.018
-0.0237 0.0639 0.138
0.0886 0.1888 0.220
8.6195 10.4066
0.0048 0.0613 -0.0200 0.0316
0.1946 2.0620 7.2414 10.3014
* Significant at the .05 level
N=206 N=164
(J1 (X)
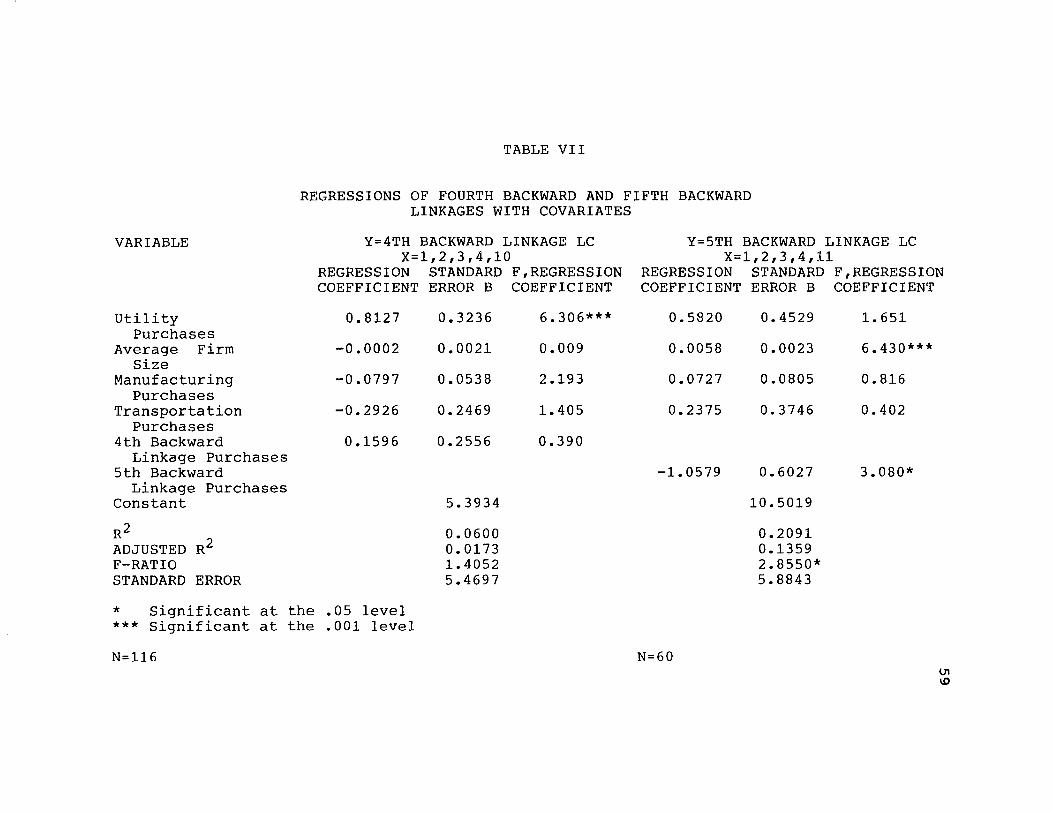
VARIABLE
TABLE VII
REGRESSIONS OF FOURTH BACKWARD AND FIFTH BACKWARD LINKAGES WITH COVARIATES
Y=4TH BACKWARD LINKAGE LC Y=5TH BACKWARD LINKAGE LC X=1,2,3,4,10 X=1,2,3,4,11
REGRESSION STANDARD F,REGRESSION REGRESSION STANDARD F,REGRESSION COEFFICIENT ERROR B
Utility Purchases
Average Firm Size
Manufacturing Purchases
Transportation Purchases
4th Backward Linkage Purchases
5th Backward Linkage Purchases
Constant
R2 ADJUSTED R2 F-RATIO STANDARD ERROR
0.8127
-0.0002
-0.0797
-0.2926
0.1596
* Significant at the .05 level *** Significant at the .001 level
N=116
0.3236
0.0021
0.0538
0.2469
0.2556
5.3934
0.0600 0.0173 1.4052 5.4697
COEFFICIENT
6.306***
0.009
2.193
1.405
0.390
COEFFICIENT ERROR B
0.5820 0.4529
0.0058 0.0023
0.0727 0.0805
0.2375 0.3746
-1. 0579 0.6027
10.5019
0.2091 0.1359 2.8550* 5.8843
N=60
COEFFICIENT
1.651
6.430***
0.816
0.402
3.080*
\.1l \0
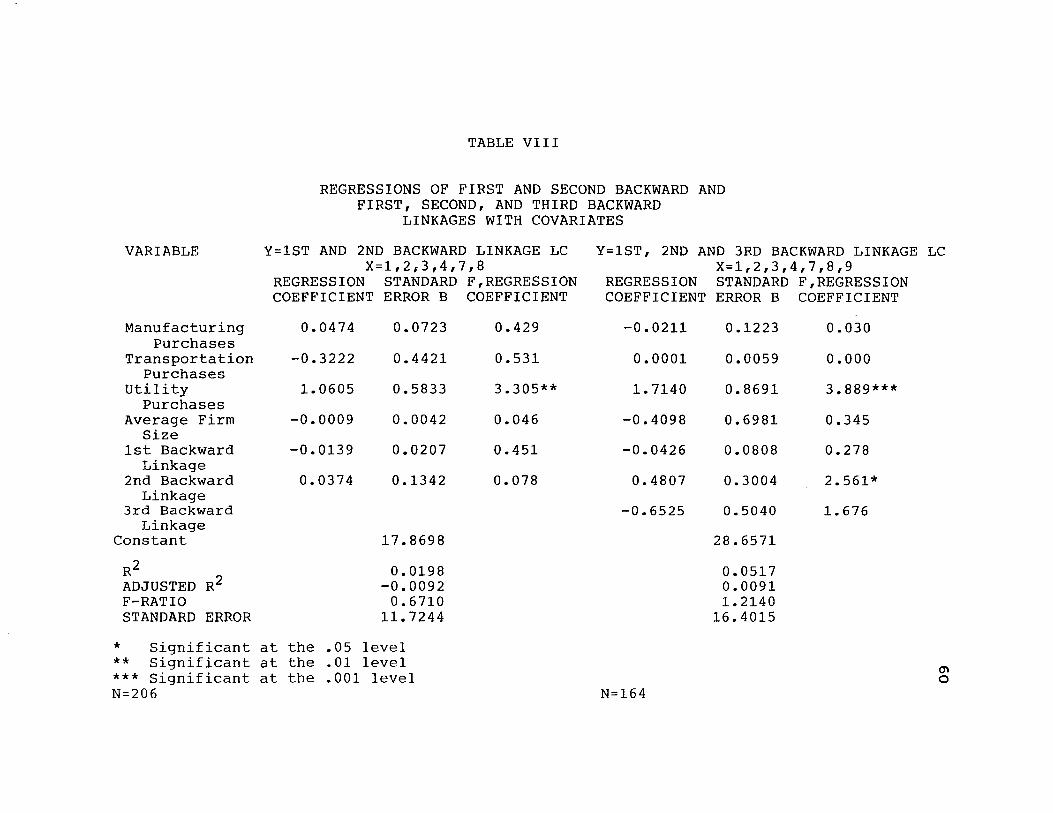
TABLE VIII
REGRESSIONS OF FIRST AND SECOND BACKWARD AND FIRST, SECOND, AND THIRD BACKWARD
LINKAGES WITH COVARIATES
VARIABLE
Manufacturing Purchases
Transportation Purchases
Utility Purchases
Average Firm Size
1st Backward Linkage
2nd Backward Linkage
3rd Backward Linkage
Constant
R2 ADJUSTED R2 F-RATIO STANDARD ERROR
Y=lST AND 2ND BACKWARD LINKAGE LC X=1,2,3,4,7,8
REGRESSION STANDARD F,REGRESSION COEFFICIENT ERROR B COEFFICIENT
0.0474 0.0723 0.429
-0.3222 0.4421 0.531
1.0605 0.5833 3.305**
-0.0009 0.0042 0.046
-0.0139 0.0207 0.451
0.0374 0.1342 0.078
17.8698
0.0198 -0.0092
0.6710 11.7244
* Significant at the .05 level ** Significant at the .01 level *** Significant at the .001 level N=206
Y=lST, 2ND AND 3RD BACKWARD LINKAGE LC X=1,2,3,4,7,8,9
REGRESSION STANDARD F,REGRESSION COEFFICIENT ERROR B COEFFICIENT
-0.0211 0.1223
0.0001 0.0059
1.7140 0.8691
-0.4098 0.6981
-0.0426 0.0808
0.4807 0.3004
-0.6525 0.5040
28.6571
0.0517 0.0091 1.2140
16.4015
N=164
0.030
0.000
3.889***
0.345
0.278
2.561*
1. 676
0' o

VARIABLE
Average Firm Size
Manufacturing Sales
Transportation Purchases
Utility Purchases
1st Forward Linkage Sales
Constant
TABLE IX
REGRESSION OF FIRST FORWARD LINKAGE WITH COVARIATES
REGRESSION STANDARD COEFFICIENT ERROR B
0.0002 0.0024
-0.0124 0.0127
-0.0878 0.2277
0.3665 0.3350
-0.0001 0.0003
9.2594
R2=0.0082 ADJUSTED R2=-0.0153 F=0.3499 STANDARD ERROR=6.7763
N=217
F, REGRESSION COEFFICIENT
0.004
0.965
0.149
1.197
0.127
<n ~
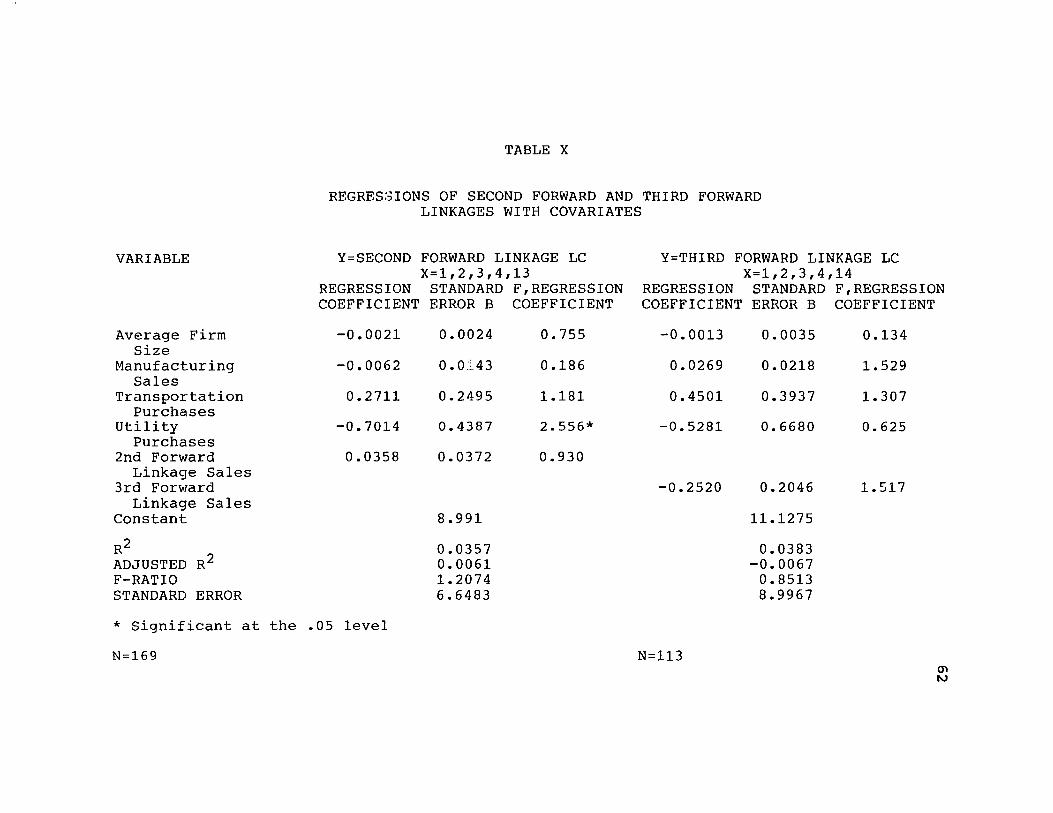
VARIABLE
Average Firm Size
Manufacturing Sales
Transportation Purchclses
Utility Purchases
2nd Forward Linkage Sales
3rd Forward Linkage Sales
Constant
R2 ADJUSTED R2 F-RATIO STANDARD ERROR
TABLE X
REGRES:3IONS OF SECOND FORWARD AND THIRD FORWARD LINKAGES WITH COVARIATES
Y=SECOND FORWARD LINKAGE LC Y=THIRD FORWARD LINKAGE LC X=1,2,3,4,13 X=1,2,3,4,14
REGRESSION STANDARD F,REGRESSION REGRESSION STANDARD F,REGRESSION COEFFICIENT ERROR B COEFFICIENT COEFFICIENT ERROR B COEFFICIENT
-0.0021 0.0024 0.755 -0.0013 0.0035 0.134
-0.0062 0.0::'43 0.186 0.0269 0.0218 1.529
0.2711 0.2495 1.181 0.4501 0.3937 1.307
-0.7014 0.4387 2.556* -0.5281 0.6680 0.625
0.0358 0.0372 0.930
-0.2520 0.2046 1.517
8.991 11.1275
0.0357 0.0383 0.0061 -0.0067 1.2074 0.8513 6.6483 8.9967
* Significant at the .05 level
N=169 N=113 en ~
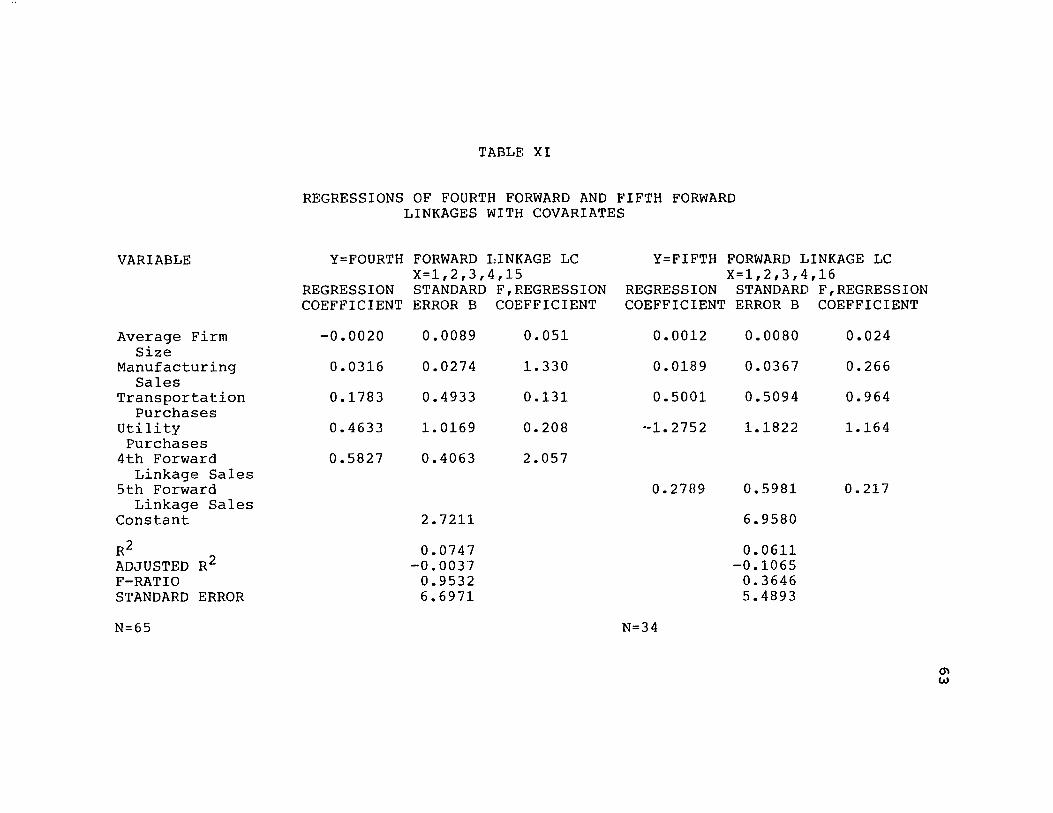
VARIABLE
Average Firm Size
Manufacturing Sales
Transportation Purchases
Utility Purchases
4th Forward Linkage Sales
5th Forward Linkage Sales
Constant
R2 ADJUSTED R2 F-RATIO STANDARD ERROR
N=65
TABLE XI
REGRESSIONS OF FOURTH FORWARD AND FIFTH FORWARD LINKAGES WITH COVARIATES
Y=FOURTH FORWARD LINKAGE LC Y=FIFTH FORWARD LINKAGE LC X=1,2,3,4,15 X=1,2,3,4,16
REGRESSION STANDARD F,REGRESSION REGRESSION STANDARD F,REGRESSION COEFFICIENT ERROR B COEFFICIENT COEFFICIENT ERROR B COEFFICIENT
-0.0020 0.0089 0.051 0.0012 0.0080 0.024
0.0316 0.0274 1.330 0.0189 0.0367 0.266
0.1783 0.4933 0.131 0.5001 0.5094 0.964
0.4633 1.0169 0.208 --1. 2752 1.1822 1.164
0.5827 0.4063 2.057
0.2709 0.5981 0_217
2.7211 6.9580
0.0747 0.0611 -0.0037 -0.1065
0.9532 0.3646 6.6971 5.4893
N=34
en w

VARIABLE
utility Purchases
Average Firm Size
Manufacturing Sales
Transportation Purchases
1st Forward Linkage
2nd Forward Linkage
3rd Forward Linkage
Constant
R2 ADJUSTED R2 F-RATIO STANDARD ERROR
TABLE XII
REGRESSIONS OF FIRST AND SECOND FORWARD AND FIRST, SECOND, AND THIRD FORWARD
LINKAGES WITH COVARIATES
Y=lST AND 2ND FORWARD LINKAGE LC X=1,2,3,4,12,13
REGRESSION STANDARD F,REGRESSION COEFFICIENT ERROR B COEFFICIENT
-0.9272 0.6630 1.956
-0.0031 0.0037 0.698
-0.0062 0.0216 0.082
0.0619 0.3765 0.027
0.0002 0.0004 0.149
0.0242 0.0631 0.147
18.8327
0.0266 -0.0095
0.7364 10.0182
Y=lST, 2ND AND 3RD FORWARD LINKAGE LC X=l,2,3,4,12,13,14
REGRESSION STANDARD F,REGRESSION COEFFICIENT ERROR B COEFFICIENT
-1.7375 1.1457 2.300*
-0.0052 0.0059 0.785
0.0352 0.0378 0.863
0.8133 0.6745 1.454
0.0445 0.0823 0.292
-0.0785 0.1523 0.266
-0.0273 0.3774 0.005
27.2431
0.0381 -0.0260
0.5940 15.4057
*Significant at the .05 level
N=169 N=113 0\ ~
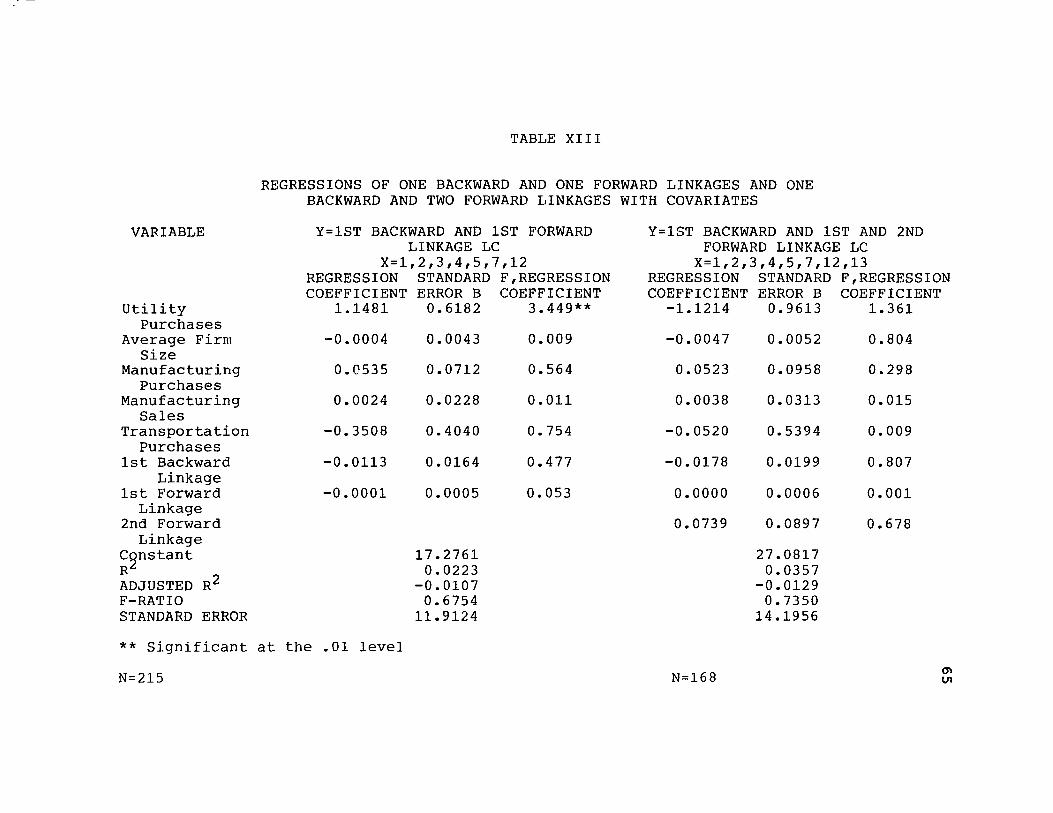
VARIABLE
Utility Purchases
Average Firm Size
Manufacturing Purchases
Manufacturing Sales
Transportation Purchases
1st Backward Linkage
1st Forward Linkage
2nd Forward Linkage
c~nstant R ADJUSTED R2 F-RATIO STANDARD ERROR
TABLE XIII
REGRESSIONS OF ONE BACKWARD AND ONE FORWARD LINKAGES AND ONE BACKWARD AND TWO FORWARD LINKAGES WITH COVARIATES
Y=lST BACKWARD AND 1ST FORWARD LINKAGE LC
X=1,2,3,4,5,7,12 REGRESSION STANDARD F,REGRESSION COEFFICIENT ERROR B COEFFICIENT
1.1481 0.6182 3.449**
-0.0004
0.0535
0.0024
-0.3508
-0.0113
-0.0001
0.0043
0.0712
0.0228
0.4040
0.0164
0.0005
17.2761 0.0223
-0.0107 0.6754
11. 9124
0.009
0.564
0.011
0.754
0.477
0.053
Y=lST BACKWARD AND 1ST AND 2ND FORWARD LINKAGE LC
X=1,2,3,4,5,7,12,13 REGRESSION STANDARD F,REGRESSION COEFFICIENT ERROR B COEFFICIENT
-1.1214 0.9613 1.361
-0.0047 0.0052 0.804
0.0523 0.0958 0.298
0.0038 0.0313 0.015
-0.0520 0.5394 0.009
-0.0178 0.0199 0.807
0.0000 0.0006 0.001
0.0739 0.0897 0.678
27.0817 0.0357
-0.0129 0.7350
14.1956
** Significant at the .01 level
N=215 N=168 0\ VI

VARIABLE
Utility Purchases
Average Firm Size
Manufacturing Purchases
Manufacturing Sales
Transportation Purchases
1st Backward Linkage
1st Forward Linkage
2nd Backward Linkage
2nd Forward Linkage
3rd Forward Linkage
c~nstant R ADJUSTED R2 F-RATIO STANDARD ERROR
TABLE XIV
REGRESSIONS OF ONE BACKWARD AND THREE FORWARD LINKAGES AND TWO BACKWARD AND ONE FORWARD LINKAGES WITH COVARIATES
Y=lST BACKWARD AND 1ST, 2ND AND Y=lST AND 2ND BACKWARD AND 1ST THIRD FORWARD LINKAGE LC FORWARD LINKAGE LC X=1,2,3,4,5,7,12,13,14 X=1,2,3,4,5,7,8,12
REGRESSION STANDARD F,REGRESSION REGRESSION STANDARD F,REGRESSION COEFFICIENT ERROR B COEFFICIENT COEFFICIENT ERROR B COEFFICIENT
-2.2026 1.4911 2.182* 1.0334 0.8642 1. 430
-0.0083 0.0075 1.212 -0.0010 0.0056 0.030
0.0177 0.1566 0.013 0.1140 0.0985 1. 339
0.0481 0.0493 0.954 0.0251 0.0308 0.661
0.8440 0.8689 0.944 -0.2331 0.6020 0.150
-0.0206 0.0283 0.530 -0.0241 0.0282 0.728
0.0344 0.1050 0.107 -0.0002 0.0006 0.129
0.0312 0.1806 0.030
-0.0563 0.1936 0.085
0.1037 0.4837 0.046
37.0372 24.0940 0.0424 0.0225
-0.0421 -0.0178 0.5016 0.5589
19.5740 15.7316 m * Significant at the .05 level N=112 N=203
m

VARIABLE
TABLE XV
REGRESSIONS OF TWO BACKWARD AND TWO FORWARD LINKAGES AND TWO BACKWARD AND THREE FORWARD LINKAGES WITH COVARIATES
Y=lST AND 2ND BACKWARD AND Y=lST AND 2ND BACKWARD AND 1ST FORWARD LINKAGE LC 2ND AND 3RD FORWARD LINKAGE LC
X=1,2,3,4,5,7,B,12,13 X=1,2,3,4,5,7,B,12,13,14 REGRESSION STANDARD F,REGRESSION REGRESSION STANDARD F,REGRESSION
Utility Purchases
Average Firm Size
Manufacturing Purchases
Manufacturing Sales
Transportation Purchases
1st Backward Linkage
1st Forward Linkage
2nd Backward Linkage
2nd Forward Linkage
3rd Forward Linkage
c~nstant R ADJUSTED R2 F-RATIO STANDARD ERROR N=159
COEFFICIENT ERROR B -1. 7342 1.3248
-0.0056 0.0067
0.1080 0.1286
0.0275 0.0407
0.1329 0.7974
-0.0318 0.0353
-0.0000 0.0008
0.0658 0.2434
0.0658 0.1166
18.1693 0.0375
-0.0206 0.6454
18.1693
COEFFICIENT 1. 713
0.715
0.706
0.456
0.028
0.812
0.004
0.073
0.318
COEFFICIENT ERROR B COEFFICIENT -2.3910 2.0219 1.398
-0.0101 0.0092 1.223
0.0571 0.1952 0.086
0.0735 0.0597 1. 513
0.8156 1.3071 0.389
-0.0483 0.0543 0.791
0.0376 0.1296 0.084
0.1908 0.4162 0.210
-0.0373 0.2382 0.024
0.1410 0.6015 0.055
23.6161 0.0465
-0.0508 0.4783
23.6161 Ol ...,J
N=109

TABLE XVI
REGRESSIONS OF THREE BACKWARD AND ONE FORWARD LINKAGES AND THREE BACKWARD AND TWO FORWARD LINKAGES WITH COVARIATES
VARIABLE
Utility Purchases
Average Firm Size Manufacturing
Purchases Manufacturing
Sales Transportation
Purchases 1st Backward
Linkage 1st Forward
Linkage 2nd Backward
Linkage 2nd Forward
Linkage 3rd Backward
Linkage c~nstant R ADJUSTED R2 F-RATIO STANDARD ERROR
Y=lST, 2ND AND 3RD BACKWARD AND 1ST FORWARD LINKAGE LC X=1,2,3,4,5,7,8,9,12
REGRESSION STANDARD F,REGRESSION COEFFICIENT ERROR B COEFFICIENT
1.0941 1.1948 0.839
0.0009 0.0141
0.0571
-0.2731
-0.0968
0.0827
0.4207
-0.6970
0.0072 0.1495
0.0546
0.8572
0.1017
0.0541
G.3680
0.6247
34.3197 0.0489
-0.0074 0.8690
19.9027
0.016 0.009
1. 092
0.101
0.905
2.337*
1.3307
1. 245
* Significant at the .05 level N=162
Y=lST, 2ND AND 3RD BACKWARD AND 1ST AND 2ND FORWARD LINKAGE LC
X=1,2,3,4,5,7,8,9,12,13 REGRESSION STANDARD F,REGRESSION COEFFICIENT ERROR B COEFFICIENT
-1.9361 1.6597 1.361
-0.0065 0.0444
0.0236
-0.0003
-0.0465
0.0056
0.7827
0.1627
-1.0336
0.0079 0.1782
0.0676
1. 0511
0.1176
0.0876
0.4623
0.1689
0.7316
43.3098 0.0597
-0.0207 0.7430
21.2733
0.670 0.062
0.122
0.000
0.156
0.004
2.866**
0.929
1. 996*
** Significant at the .01 level N=128
~ CD

TABLE XVII
REGRESSION OF THREE BACKWARD AND THREE FORWARD LINKAGES WITH COVARIATES
VARIABLE REGRESSION STANDARD F, REGRESSION COEFFICIENT ERROR B COEFFICIENT
Utility -2.2396 2.3859 0.881 Purchases
Average Firm -0.0135 0.0103 1. 713 Size
Manufacturing -0.0022 0.2489 0.000 Purchases
Manufacturing 0.1553 0.0990 2.463** Sales
Transportation -0.5201 1.6012 0.106 Purchases
1st Backward 0.0006 0.1790 0.000 Linkage
1st Forward 0.0800 0.1549 0.266 Linkage
2nd Backward 1. 6468 0.7408 4.942*** Linkage
2nd Forward 0.1166 0.2800 0.173 Linkage
3rd Backward -1. 3361 1.1215 1.419 Linkage
3rd Forward 0.4478 0.7695 0.339 Linkage
Constant 37.6609
R2=0.1325 ADJUSTED R2=0.0117 F-RATIO=1.0966 STANDARD ERROR=26.269 ** Significant at the .01 level *** Significant at the .001 level N=91
0\ \0
70
orientation was utilized and the inter-industry 5th backward
linkage. (Tables III and VI). In the former case the
experimental variable did not have a significant F ratio
while in the latter the experimental variable, the 5th
backward linkage, was significant at the .05 level. Little
variability in the dependent variable was accounted for by
the covariates and experimental variables in these two runs
with multiple coefficients of determination of 0.0508 and
0.2091 respectively.
Statistically significant relationships between
experimental variables and the dependent variable existed
only for the 5th backward linkage when intra-industry and
inter-industry linkages were considered individually (Table
VII). In forward/backward inter-industry linkage
combinations the 1st forward linkage was significant at the
the 2nd and 3rd backward linkages in the 3 backward/2 forward
run (Table XVI)~ and the backward linkage in the 3 backward
and forward combination (Table XVII).
No consistent pattern emerged between inter-industry
firm spatial proximity and the experimental variables with
statistically significant regression coefficients.
Increases in purchases of inputs from the 5th inter-industry
linkage are associated with a more dispersed array of
subject firms and suppliers (Table VII). This tendency
towards randomness is also evidenced in the relationship
71
between the first forward linkage and firm spatial
proximity when considered in combination with the first
three backward linkages. As the magnitude of the third
backward linkage in an array that includes three backward
and two forward linkage firms increases inter-industry firm
spatial proximity decreases (Tables XV and XVI). Increases
in the purchases of inputs from the third largest supply
source results in a more concentrated distribu~ion of firms
among the purchaser, three largest suppliers and two
manufacturing industry markets (Table XVI). The second
largest supply source exerts pressures towards concentration
for firm grG~~ings composed of a subject industry with its
three largest suppliers and output buyers (Table XVII).
These statistically significant dependent and
experimental variable relationships occurred in models with
extremely small multiple coefficients of determination.
The experimental variables and covariates working together
could account for no more than 13 percent of the
variability in the dependent variable in any of these
applications. The result is statistically significant
relationships among a few of the experimental variables and
the dependent variable which have little explanatory power.
Among the covariates only utility costs, market
orientation and average firm size were significant at the
~I.
statistically significant relationships between covariates
and intra-industry or inter-industry spatial proximity
appeared only in applications with extremely small overall
multiple coefficients of determination.
72
utility costs were positively related to firm spatial
proximity for the intra-industry and individual backward
linkages and significant at the .01 level or greater for
the intra-industry (market orientation covariate), 1st and
4th backward and combination backward linkage runs. The
direction of the industry utility intensiveness with spatial
proximity for the forward and backward and forward
combinations was not consistent. Percent of industry
expenditures spent on utilities was significant at the .05
level or greater for the 2nd forward; 1st, 2nd and 3rd
forward combination; and three forward/backward
combinations. utility costs were inversely related to
spatial proximity in the 2nd forward, forward combination,
and 1 backward/ 3 forward linkage combination models.
Utility costs were positively related to the dependent
variable in the run which used 1 backward and 1 forward
linkage.
Market orientation (percent of manufacturing sales of
all sales) was negatively related to spatial proximity at
the .05 level of significance for the intra-industry linkage
run containing the covariate and the 3rd backward linkage
application (Tables IV and VI) In the model which combined
73
the first 3 backward and forward linkages market orientation
was positively related to the dependent variable at the .01
level (TABLE XVI). Average firm size was positively related
to inter-industry firm spatial proximity and significant at
the .001 level for the 5th backward linkage application
(Table VII). No consistent patterns were found between
average firm size except as specified and transportation
costs with the dependent variable for the covariance
applications.
REGRESSION FINDINGS AND THE RESEARCH HYPOTHESES
The first hypothesis anticipated no relationship
between intra-industry technological linkages and intra
industry firm spatial proximity. No statistically
significant regression coefficients were produced in either
of the intra-industry linkage models. The first model used
percent of manufacturing inputs to total inputs purchased.
In the second application percent of manufacturing outputs
to total outputs was substituted for the former in the
covariate sequence. Failure to reject the null hypothesis
lends support for the research hypothesis of no relationship
between intra-industry linkages and intra-industry firm
spatial proximity within an urban economy.
The second research hypothesis stipulated no
74
association between inter-industry backward and forward
linkages and related inter-industry firm spatial proximity.
The research hypothesis was supported with the retention of
the null hypothesis of no difference for the first four
backward and all five forward inter-industry technological
linkages. An inverse and statistically significant
relationship was found between the 5th backward inter
industry linkage and inter-industry firm spatial proximity
for the subject firm and its 5th largest supply source. As
the percentage of manufacturing inputs from this supplier
increased spatial distance between purchasing and supplier
firms decreased. However, less than 6 percent of the
variability in the dependent variable is attributable to the
workings of the covariates and experimental variable in this
model.
No association was predicted for the relationship
between forward and backward technological linkage
combinations and the appropriate combination of inter
industry firm spatial array in the third research hypothesis.
Of the 9 possible combinations for 3 backward and 3 forward
inter-industry linkages the null hypothesis was retained in
6 applications. In the remaining models the 1st forward
linkage was positively related to the dependent variable in
the 3 backward/l forward combination. The 2nd backward
linkage had a statistically significant relationship to the
dependent variable in a positive direction in the 3
backward/2 forward combination and a negative direction in
the 3 backward/3 forward combination. A negative and
statistically significant relationship exists between the
3rd backward technological linkage and the dependent
variable in the 3 backward/2 forward linkage combination
appli~ation. In each of these cases less than 14 percent
75
of the variability in inter-industry firm spatial proximity
is explained by all covariates and experimental variables in
each of the combination applications.
DISCUSSION
The null hypothesis of no difference for the
experimental variables was retained in twenty-one out of
twenty-five of the multiple regression covariance
applications. This statistical hypothesis was rejected for
the 5th backward linkage in the 5th backward linkage model;
1st forward linkage in the 3 backward/l forward combination run;
2nd and 3rd backward linkages in the 3 backward/2 forward
combination; and 2nd backward linkage in the 3 backward/3
forward linkage combination application. Only for the
intra-industry linkage (with the market orientation
covariate) and the 5th backward linkage models were
statistically significant multiple coefficients of
determination produced. In neither application using intra
industry linkages were statistically significant regression
76
coefficients produced for the experimental variable. Even in
inter-industry applications where statistically significant
results were obtained the amount of variability accounted
for by the covariates and experimental variabilities working
in concert was inconsequential.
The interpretation of results from the applications
where the appropriate null hypothesis was retained is
relatively straightforward. Technological linkages within
an industry and among industries are not determinants of
firm location in an urban economy. For the models in which
the experimental variables were statistically significant
th~ interpretation is not as clear cut.
In these latter instances if the multiple
coefficients of determination had been substantial and the
contributions made by the experimental variables relatively
large, then variability in the dependent variable could have
been accounted for in large measure by the influence of the
experimental factors. This was not the case. The multiple
coefficients were so low that little variability in the
dependent variable could be attributed to the influence of
the covariates working in aggregate and/or the experimental
variables.
For the statistically significant experimental
variables the question, given their measured lack of impact,
is whether these results could have been obtained as a
result of the variables or statistically procedures
utilized. By extension if these factors unduly influenced
the results obtained for the statistically significant
experimental variables then the same forces would be in
operation on the other independent variables used in this
study.
77
The definition and operationalization of the variables
in this study were commented on length in the literature
review and methodology chapters. To review, input and
output coefficients are standardly utilized in the study of
economic systems and the inter-relationships of sectors and
industries (Leontief 1951; Miernyk 1965; Smith 1981).
Following the advice of Tiebout (l956) and Isard (1960)
national coefficients were used because of the greater
stability of these measures over regional coefficients since
the study design is cross-sectional but is the result of a
longtitudinal decision-making process. The effects of
secondary products have been controlled in the 1972 national
transactional tables to provide better information on
industry input requirements and input/output relationships
(Ritz 1979). Finally within industry homogeneity has been
enhanced while betweell industry heterogeneity is preserved
through the use of the Standard Industry Classification/
Commodity system at the 4 digit level of disaggregation
(Norcliffe 1975).

78
Debate on the use of the nearest neighbor procedure
focuses on its use as a statistic in the classification of
firm spatial arrays and the effect of area size and shape
on measurements obtained (Lloyd and Dicken 1972). In this
study the use of nearest neighbor is limited to its use as
a measure of firm spatial proximity. Area size and shape
arguments are not pertinent as the area in this research is
fixed and its shape conforms to the Oregon portion of the
metropolitan region. It is within these fixed boundaries
that the determination of firm spatial proximity is made.
The straight line distance between each firm and its
nearest neighbor within the defined area is used to
calculate the nearest neighbor measure. This method can be
followed when investigating firm spatial arrays within an
industry. When the array is composed of an industry and
its trading partner(s) and the task is to determine the
nearest linked industry firm to the subject industry the
methodology required by nearest neighbor cannot be followed.
It is likely that one or more linked firm will be a ~nearest
neighbor' to any of the subject firms and will therefore be
excluded from consideration. Therefore the requirement that
all firms be included is violated and the technique cannot
be utilized.
The local concentration index was developed to provide
a means for measuring the straight line distance between
79
subject industry firms and the closest firm within a linked
industry. As with the nearest neighbor the use of the local
concentration technique as a measurement circumvents the
question of the influence of different area sizes and shapes
upon the measurement because of the fixed areal base used
in this study. The shape of the distribution of the
local concentration measures is relevant to the question
of its interpretation as a statistic but not to its more
limited use as a measure of spatial distance among two
firms within a defined space. The question asked in the
study is whether intra-industry and inter-industry linkages
can be used to explain tendencies to minimize distance
among firms in technologically linked industries.
The performance of the covariates in the regression
models suggests that the variability observed in the
dependent variable can be influenced by variables
constructed in the same way as the experimental variables.
Inspection of the distribution of scores for the 220
industries used on the independent and dependent variables
indicates that lack of score range and variability cannot
be used to explain the absence of impact by the selected
variables on firm spatial proximity.
The other possibility for lack of significant multiple
coefficients of determination other than the research
hypotheses is the violation of the assumptions of multiple
80
linear regression. These are the use of interval data from
a population without bias where each variable is normally
distributed and variances equal and the independent
variables are orthogonal to each other (Rabiega 1984).
Each of these aspects is examined in turn.
Clearly the data is interval level and and cases were
drawn from a population without bias. Variances were
equalized through the conversion of variable scores into
percentages for use in the model. Lack of colinearity among
the independent variables was evidenced in the low
coefficients exhibited in the variable correlation matrix.
The highest correlation coefficient, 0.4353, was achieved by
the composite transportation and utility cost variables.
Association values among each other pair of independent
variables was less than 0.2900.
The remaining assumption of normal distribution of
variables was violated in this study. Each variable as
indicated by the mean and standard deviation had a slight
right skew associated with the presence of a few extreme
scores. This skew was slight and consistent across all
variables in the model with the greatest skew being
produced by average firm size. Skews may result in the
slight inflation of the F ratio. Since lack of
statistically significant multiple coefficients of
determination was common in this study it is clear that
81
the violation of this assumption was not problematic for the
study's outcomes.
The final point which needs addressing in this section
is the presence of statistically significant regression
coefficients for variables within models without
statistically significant F ratios and very low multiple
coefficients of determination. While these results help to
sUbstantiate the validity of the model used their
substantive importance as locational factors must continue
to be questioned when so little variability in the dependent
variable can be attributed to their influence. The presence
of one or two statistically significant experimental
variables within the more complex inter-industry
combination applications suggests that more research may be
needed into the spatial relationships of manufacturing firms
within industrial clusters on a firm to firm basis. As an
input the swing in the direction of relationship between
industry utility intensiveness and inter-industry firm
spatial proximity from positive in the input applications
to negative in the forward linkage models is consistent
with the expected operation of the model. Both in the case
of utilities and transportation the contention by Norcliffe
(1975) of the importance of the availability of needed types
of infrastructure may be at least as important as cost
differentials associated with site selection within a

82
metropolitan or local level urban economy.
CONCLUSION
The research hypotheses were supported in twenty-one
out of twenty-five applications of the model. Intra-industry
technological linkages were not found to be important
determinants of within industry firm spatial proximity in
a metropolitan region. Inter-industry technological linkages
were likewise not found to be important locational
determinants except in the case of the 5th backward linkage
when considered individually. Statistically significant
associations were found between the 1st forward linkage in
the 3 backward/1 forward linkage application; the 2nd
backward linkage in the 3 backward/2 forward and 3 backward
and forward combination runs; and the 3rd backward linkage
in the 3 backward/2 forward linkage model. These
experimental variables were, however, able to account for
little of the variability in the dependent variable when
considered individually or working in concert with the
covariates in the model. In these latter cases statistical
significance was not associated with substantive importance.
Alternative hypotheses which would have attributed
results obtained to the study's design and implementation
were examined. F~ilure to reject the null hypotheses and
lack of explanatory power of alternative hypotheses lends

83
support for the research hypotheses. Intra-industry and
inter-industry technological linkages have not been shown to
be important factors in the search for sites by
manufacturing industries within a metropolitan economy.

CHAPTER V
CONCLUSION
Manufacturing intra-industry and inter-industry
technological linkages are rejected as important
determinants of the spatial distribution of manufacturing
firms in an urban economy. Spatial proximity of firms in
an industry was not found to be related to the magnitude
of intra-industry linkages. The strength of primary
backward and forward manufacturing linkages could also not
be used to explain the degree of spatial concentration found
among manufacturing industries in the metropolitan area.
There are several implications of these findings for
plant location theory. Clearly economies of agglomeration
and external economies have no effect on industrial patterns
in this analysis. Second, that the poor performance of
covariates suggest that application of existing theory to
localized manufacturing plant selection processes may be
misplaced. Third, that the distinction between economies of
agglomeration and external economies may be easily made at
the theoretical level but for empirical investigation
this differentiation is elusive and questionable. Finally,
that a reappraisal of the factors of manufacturing plant site
selection at the metropolitan level
85
is needed. In this study industry spatial patterns were
found to be random not only with respect to linkage
variables but also to the traditionally used variables of
firm size, manufacturing supply and market dependencies, and
transportation and utility cost sensitivity.
The first implication is strongly supported by the
current research. It is the major research hypothesis
which has been confirmed. These findings do not, however,
challenge the viability of linkages as explanatory factors
at the larger regional, national, or international levels.
Nor do these results question the importance of linkages
found at the metropolitan level by studies such as Harrigan
and Walker between manufacturing industries and other sectors
of the economy such as commerce. They simply say in a pure
manufacturing location situation at a local level that
agglomeration and external economies as elaborated in this
research are not operative.
Though no attempt to infer to broader geographical
scales the experience here connotes the following for larger
scale studies: 1) industry disaggregation to the maximum
level feasible is advisable; 2) all pertinent variables
need to be included in multiple variable or covariate
models; and 3) there is substantial support for
previous research efforts and theoretical frameworks which
minimize the importance of manufacturing based linkage
agglomerations at the metropolitan level. As stated earlier,

however, these results do not challenge the influence of
inter-sectoral linkages on manufacturing plant location
at this scale of development.
86
The utility of a distinction between intra-industry and
inter-industry linkage patterns and the associated
differentiation between linkage produced economies of
agglomeration and external economies cannot be supported.
Industries in this study were classified according to their
4 digit Standard Industrial Classification. Spatial
proximity was measured between firms. Even at this level of
disaggregation intra-industry technological patterns did
not distinguish themselves in performance from inter
industry technological linkages. Ordering of intra-industry
and forward and backward linkages based on magnitude of the
relationship resulted in no systematic positioning of the
intra-industry linkages with respect to other principals.
The former concept may have utility when reserved to describe
transactional patterns in a vertically integrated corporation
where savings are generated through the internalization of
costs associated with the acquisition of goods and services
and to study the site selection process of an individual
firm.
Variability in the spatial proximity of firms across
manufacturers in the metropolitan area could not be
accounted for by manufacturing inter-industry linkages,
industrial supply and market orientations, or transportation

87
and utility cost sensitivity. While there can be and
probably are some individual manufacturing industries where
some or all of these variables may have a measurable effect
the lack of positive systematic findings across industries
suggests that other factors must be used to describe
localized plant site patterns.
Norcliffe (1975) contends that infrastructure
availability, internal and external economies, contact, and
linkages are the most important site locational factors.
The Standard Research Institute study of Portland (1982)
stressed the need for the maintenance of an inventory of
industrial zoned sites with varying mixtures and levels of
physical and social infrastructure capable of meeting the
needs of diverse locational needs of a multiplicity of
industries if recruitment efforts were to be successful.
Taken together these studies provide the basis of a list of
site locational factors which need to be pursued when
linkages are used to describe firm relationships across
sectors of the economy. Such an approach would be
consistent with the work of Greenhut (1964) and Thomas
(1979) who make distinctions among firm, industry, site,
geographic area, and socio-political-economic locational
factors. '."!I .....
For economic practitioners, industrial recruiters, and
planners the study findings suggest that a re-evaluation of
policies which stress ties among manufacturers as a primary

88
tool for the creation of a new or expanded community
employment base should be made. The expenditure of resources
on the identification of inter-industry linkages and
recruitment of identified target industries may better be
spent on the preparation of adequately served developable
industrial sites. Such an approach does not, however,
negate the need of the community to assess its economic
strengths and weaknesses and develop a local strategy
likely to attract industries and firms seeking advantages
which the community can afford to offer. In weighing the
likely impacts of alternative industrial choices on the
community careful inspection of estimates of indirect
employment impact will obviously need to be made as firm
candidates mayor may not depend on the local economy for
purchase of inputs or sale of products.
Inferred from the study can be support for the use of a
joint economic development approach for the communities of
a regional economic unit. Linkage relationships are not
operative at the localized manufacturing plant site
selection level. Spatial proximity to manufacturing linked
firms is not required. For industries which are not
linkage sensitive local resources can be combined to assure
that within the region attractive sites are available. For
industries which are linkage sensitive the limited number
of sites available in close proximity to other manufacturers
can be preserved. The necessary follow-up to this study for

industrial recruiters is the identification of those
specific industries which are dependent upon locations in
close spatial proximity to linked firms.
89

BIBLIOGRAPHY
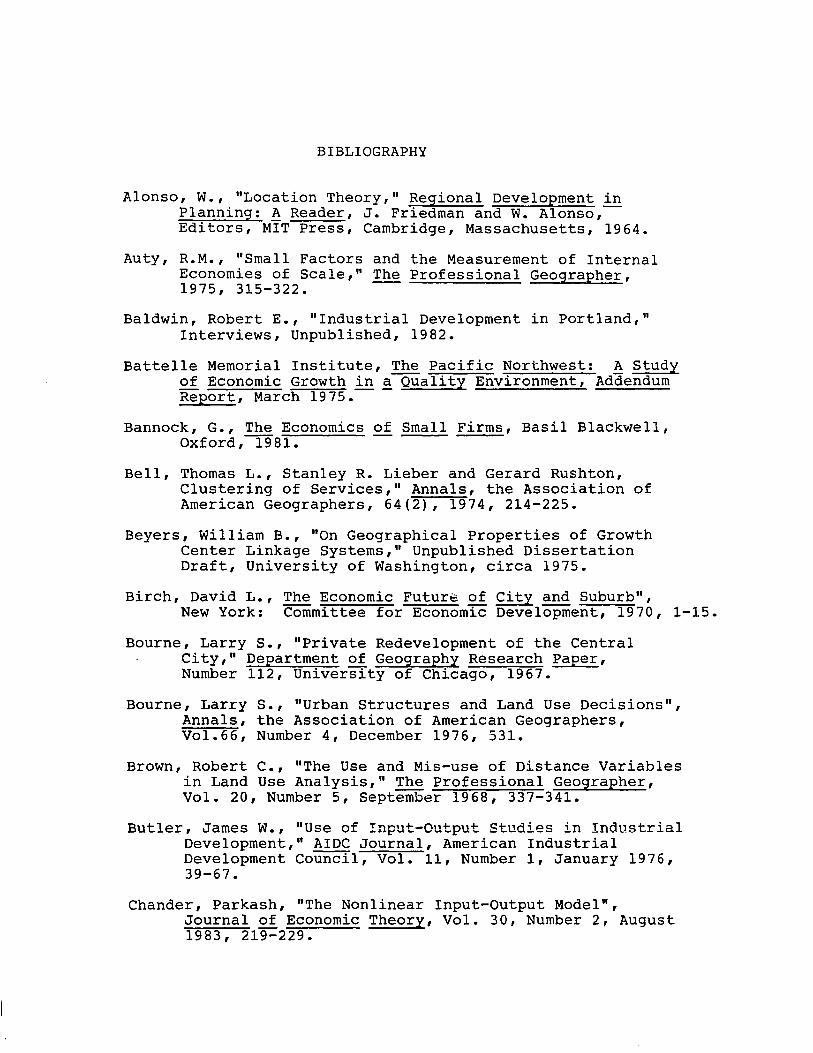
BIBLIOGRAPHY
Alonso, W., "Location Theory," Regional Development in Planning: ~ Reader, J. Friedman and W. Alonso,-Editors, MIT Press, Cambridge, Massachusetts, 1964.
Auty, R.M., "Small Factors and the Measurement of Internal Economies of Scale," The Professional Geographer, 1975, 315-322.
Baldwin, Robert E., "Industrial Development in Portland," Interviews, Unpublished, 1982.
Battelle Memorial Institute, The Pacific Northwest: ~ Study of Economic Growth in a Quality Environment, Addendum Report, March 1975.
Bannock, G., The Economics of Small Firms, Basil Blackwell, Oxford,-r981.
Bell, Thomas L., Stanley R. Lieber and Gerard Rushton, Clustering of Services," Annals, the Association of American Geographers, 64(2), 1974, 214-225.
Beyers, William B., "On Geographical Properties of Growth Center Linkage Systems," Unpublished Dissertation Draft, University of Washington, circa 1975.
Birch, David L., The Economic Future of City and Suburb", New York: Committee for Economic Development, 1970, 1-15.
Bourne, Larry S., "Private Redevelopment of the Central City," Department of Geography Research Paper, Number 112, University of Chicago, 1967.
Bourne, Larry S., "Urban Structures and Land Use Decisions", Annals, the Association of American Geographers, Vol.66, Number 4, December 1976, 531.
Brown, Robert C., "The Use and Mis-use of Distance Variables in Land Use Analysis," The Professional Geographer, Vol. 20, Number 5, September 1968, 337-341.
Butler, James W., "Use of Input-Output Studies in Industrial Development," AIDC Journal, American Industrial Development Council, Vol. 11, Number 1, January 1976, 39-67.
Chander, Parkash, "The Nonlinear Input-Output Model", Journal of Economic Theory, Vol. 30, Number 2, August 1983, 219-229.

92
Clark, P.J. and F.C. Evans, "Distance to Nearest Neighbor as a Measure of Spatial Relationships in Population", Ecology, 35, 1954, 445-453.
Collins, L. and D. F. Walker, Editors, Locationa1 Dynamics of Manufacturing Activity, John Wiley Press, New York, 1975.
Czamanski, Daniel and Stan Czamanski, "Industrial Complexes: Their Typology, Structure, and Relation to Economic Development", Papers, Regional Science Association, 38, 1977. 93-111.
Council for Economic Development of Oregon, Development Reporter, Vol. 2, Number 1, 1983.
Ebdon, David, "Spatial Statistics," Statistics in Geography, A Practical Approach, Basic Blackwell, Oxford, 1980, 106-127.
Ettlinger, N., "Comments on the Concept of Linkages from the Perspective of Corporate Organization in the Modern Capitalist System," Tijdschrift voor Economische en Sociale Geografie, 75, 1984, 285-291.
Evans, Alan W., "The Pure Theory of City Size in an Industrial Economy," Urban Studies, February 1972, 49-77.
Executive Office of the President, Office of Management and Budget, Standard Industrial Classification Manual 1972, U. S. Government Printing Office, Catalogue Number PREX 2.6/2:IN27/972, 1972.
First Interstate Bank, "Capital Availability in the Pacific Northwest," Multnomah County Economic Development Advisory Commission, Unpublished Report, Winter 1977.
Galbraith, J. K., Economics and the Public Purpose, Penguin Press, Harmondsworth, 1975.
Getis, Arthur, "On the Use of the Term "Random" in Spatial Analysis," The Professional Geographer, Vol. 29, Number 1, February 1977, 58-61.
Gibson, L. J. and Marshall A. Worden, "Estimating the Economic Base Multiplier: A Test of Alternative Procedures," Economic Geography, 57, 1981, 146-159.
Green, D. Howard, "Industrialists Information Levels of Regional Incentives, Regional Studies, Vol. 11, 1977, 7-18.

93
Greenhut, Melvin L., Plant Location in Theory and Practice, University of North Carolina Press, Chapel Hill, 1956.
Greenhut, Melvin L., Microeconomics and the Space Economy, Scott Foresman Press, Chicago,-yg6~
Greenhut, Melvin L., "When Is the Demand Factor of Location Important?", Land Economics, 40, 1964, 175-184.
Greenhut, Melvin L., "Needed--A Return to the Classics in Regional Economic Development Theory," Kyk1os, XIX, 1966, 461-478.
Griffith, Daniel A., "A Note on Spatial Autocorrelation," The Professional Geographer, Vol. 27, Number 4, November 1975, 470-474.
Gue1ke, Leonard, "Regional Geography,". The Professional Geographer, Vol. 29, Number 1, February 1977, 1-7.
Hakanson, L., "Towards a Theory of Location and Corporate Growth", Spatial Analysis, Industry, and the Industrial Environment, Vol. 1, Industrial Systems, John Wiley, 1979, 115-138.
Hakimi, S. L., "Optimum Location of Switching Centers and the Absolute Centers and Medians of a Graph", Operations Research, 12, 1964, 450-459.
Harrigan, F. J., "The Relationship between Industrial and Geographical Linkages: A Case Study of the United Kingdom," Journal of Regional Science, Vol. 22, Number 1, 1982, 19-31.
Harvey, D., "The Geography of Capital Accumulation: A Reconstruction of the Marxian Theory," Antipode, Vol. 7, Number 2, 1975, 9-21.
Herr, J. Paul, "Local Governmental Competition for Business Activity: An Urban Case Study," The Professional Geographer, Vol. 31, Number 3, August 1979, 292-298.
Hewings, Geoffrey, "A Note on Forecasting the Economic Base," The Professional Geographer, Vol. 21, Number 5, September 1969, 315-318.
Hewings, Geoffrey, Regional Industrial Analysis and Development, Methuen Press, London 1977.
Hewings, Geoffrey, "The Role of Prior Information in Updating Regional Input-Output Models", SocioEconomic Planning Sciences, Vol. 18, Number 5, 1984, 319-336.

Holland, S. K., Capital Versus the Regions, Macmillan Press, London, 1976.
Holland, S. K., The Regional Problem, Macmillan Press, London, 19 7 6 •
94
Holzner, Lutz, "Urban Geography Without a Regional System," The Professional Geographer, Vol. 18, Number 3, May 1966, 129-131.
Hoover, E. M., Location Theory and the Shoe and Leather Industries, Harvard University Press, Cambridge, Massachusetts, 1937.
Hoover, E. M., The Location of Economic Activity, McGraw-Hill Press, New York, 1948.
Hoover, E. M., "Some Programmed Models for Industry Location", Land Economics, Vol. 43, 1967, 303-311.
Hsu Shin-yi and Clifford E. Tiedemann, "A Rational Method of Delimiting Study Areas for Unevenly Distributed Point Phenomena," The Professional Geographer, Vol. 20, Number 6, November 6, 1968, 376-381.
Hsu, Shin-yi and J. D. Mason, "Towards a Better Understanding of the Boundary Effect on the Decision-Making Process in the Poisson Model of Point Distribution in Bounded Two-Dimensional Space," Proceedings, Association of American Geographers, 4, 1972, 46-49.
Imai, Haruo, "CBD Hypothesis and Economies of Agglomeration", Jou~nal of Economic Theory, Vol. 28, 1982, 275-299.
Ingram, David R., "An Evaluation of Procedures Utilized in Nearest Neighbor Analysis," Geografiska Annaler, Vol. 60, 1978, 65-70.
Isard, W., "Distance Inputs and the Space Economy", Quarterly Journal of Economics, 65, 1951, 181-198.
Isard, W. and Robert E. Kuenne, "The Impact of Steel Upon the Greater New York-Philadelphi~ Industrial Region: A Study in Agglomeration Projection", Review of Economics and Statistics, 35, 1953.
Isard, W., Location and Space Economy, MIT Press, Cambridge, Massachusetts, 1956.
Isard, W., Methods of Regional Analysis, MIT Press, Cambridge; Massachusetts, 1960.

Isserman, A. M., "Regional Employment Multiplier: A New Approach: A Comment,". Land Economics, Vol. 51, 1975, 290-293. --
Isserman, A. M., "The Location Quotient Approach to Measuring Regional Economic Impacts," Journal of the American Institute of Planners, 1977, 33-41:
Isserman, A. M., "Estimating Export Activity in a Regional Economy: A Theoretical and Empirical Analysis of Alternate Methods," International Regional Science Review, Vol. 5, 1980, 155-184.
Johnson, Harry G., "The Economic Approach to Social Questions, National Affairs, Vol. 12, 1968, 15-23.
Kiel, Stanley, "Input/Output Approach to Predicting Comparative of Industry," Growth and Change, Vol. 11, 1980,
Kipnis, Baruch A., "Plant Size and Urban Development," Urban Studies, 21, 1984, 53-61.
95
Lahiri, Sajal, "On Reconciling Purchases and Sales Estimates of a Regional Input-Output Table," Socio-Economic Planning Sciences, Vol. 18, Number 5, 1984, 337-342.
Lausen, J. R., "On Growth Poles," Urban Studies, Vol. 6, 1969, 137-161.
Lemelin, Andre, "Relatedness in the Patterns of Interindustry Diversification," The Review of Economics and Statistics, 1982, 646-656. -
Leontief, w. W., "Input-Outp~t Economics," Scientific American, Vol. 185, 1951, 15-21.
Lichtenberg, R. M., One-tenth of a Nation, Harvard University Press, Cambridge~ Massachusetts, 1960.
Lloyd, Peter E. and Peter Dicken, Location in Space, Harper and Row, 1972.
Losch, A., "The Nature of Economic Regions," Southern Economic Journal, Vol. 5, 1938, 71-78.
Louveaux, Francois, Jacques-Francois Thisse and Hubert Beguin, "Location Theory and Transportation Costs;" Regional Science and Urban Economics, Vol. 12, 1982, 529-545.
Mai, Chao-cheng, "Optimum Location and the Theory of the

Firm Under Demand Uncertainity," Regional Science and Urban Economics, Vol. 11, 1981, 549-557.
Mai, Chao-Cheng, "Demand Function and Location Theory of the Firm Under Price Uncertainity", Urban Studies, 21, 1984, 459-464.
Mathur, V. K., "Location Theory of a Firm Under Price Uncertainity," Regional Science and Urban Economics, Vol. 11, 1981/82, 529-547.
Miernyk, W., The Elements of Input-Output Analysis, Random House Press, New York, 1965.
Moomaw, Ronald, "Firm Location and City Size: Reduced Productivity Advantages as a Factor in the Decline of Manufacturing in Urban Areas", Journal of Urban Economics, 17, 1985, 73-79.
Moore, C. L., "A New Look at the Minimum Requirements Approach to Regional Economic Analysis", Economic Geography, 51, 1975, 350-356.
96
Moses, Leon and Harold F. Williamson, Jr., "The Location of Economic Activity in Cities," American Economic Review, Papers and Proceedings, May 1967, 211-222.
Multnomah County, Overall Economic Development Plan I, Colleen Greer Acres, Project Director, Multnomah County Department of Environmental Services, Division of Planning and Development, 1977.
Norcliffe, G. B., "Using Location Quotients to Estimate the Economic Base and Trade Flows," Regional Studies, Vol. 17, 1983, 161-168.
Norcliffe, G. B., "A Theory of Manufacturing Places", Locational Dynamics of Manufacturing Activity, L. Collins and D. F. Walker, Editors, John Wiley Press, New York, 1975, 19-57.
North, Douglas D., "Location Theory and Regional Economic Growth," Journal of Political Economy, Vol. 63, 1955, 240-255.
Nourse, H. 0., Regional Economics, McGraw-Hill Press, New York, 1968.
O'Farrell, P. N., "Employment Change in Manufacturing: The Case of Surviving Plants", Urban Studies, 22, 1985, 57-68.
Openshaw, S., "Ecological Fallacies and the Analysis of

Areal Census Data", Environment and Planning A, Vol. 16, 1984, 17-31.
97
Oregon Legislature, Senate Bill 2295, 62nd Oregon Legislative Assembly, 1983,
Oregon Legislature, Senate Bill 534, 62nd Oregon Legislative Assembly, 1983.
Oregon Department of Land Conservation and Development, Statewide Land Use Planning Goals and Guidelines, 1983 revised.
Ostrom, Vincent, Charles M. Tiebout and Robert Warren, "The Organization of Government in Metropolitan Areas: A Theoretical Inquiry," The Organization of Metropolitan Government, 1960, 542-553.
Perroux, F., "Economic Space Theory and Applications," Quarterly Journal of Economics, Vol. 64, 1950, 89-104.
Perroux, F., "Note on the Concept of "Growth Poles"," Regional Economics, David L. McKee, Robert D. Dean, and William H. Leahy, Editors, The Free Press, 1970, 93-103.
Peschel, Karin, "International Trade and Industrial Location", Regional Science and Urban Economics, Vol. 12, 1982 247-269.
Rabiega, William A., Straight Talk About Statistical Analysis, Unpublished, 1985.
Rees, J., "Decision-making: The Growth of the Firm and the Business Environment", Spatial Perspectives on Industrial Organization and Decision-making, F. E. I. Hamilton, Editor, John Wiley Press, London, 189-212.
Richardson, H., Regional Economics, Weidenfeld and Nicolson Press, London, 1969.
Richardson, H., Input-Output Analysis and Regional Economies, John Wiley Press, 1972, pp. 85-138.
Ritz, Philip M., "The Input-Output Structure of the U. S. Economy, 1972," Survey of Current Business, Vol. 59, Number 2, February 1979, 34-72.
Romanoff, Eliahu, "Interindustry Analysis for Regional Growth and Development: The Dynamics of Manpower Issues", Socio-Economic Planning Sciences, Vol. 18, Number 5, 1984, 353-363.

Rose, Adam, "Technological Change and Input-Output Analysis: An Appraisal", Socio-Economic Planning Sciences, Vol. 18, Number 5, 1984, 305-318.
Samuelson, P. A., "Intertemporal Price Equilbrium: A Prologue to the Theory of Speculation", Weltwirtschaftliches Archives, Vol. 79, 1957, 181-221.
98
Schmidt, C. G., "Spatial Structure of Industrial Linkages and Regional Economic Growth: An Analysis of Linkage Stability Among Pacific Northwest Steel Firms, 1963-1970, Unpublished Dissertation, University of Washington, Seattle, 1973.
Smith, David M., Industrial Location, An Economic Geographical Analysis, Second EdItion, John Wiley and Sons Inc., New York, Chichester, Brisbane, Toronto, 1981.
Sommers, Gail, "The Effects of Economic Shifts: How a Small City Copes," Urban Affairs Annual Assocation Meeting Paper, Portland Oregon, March 1984.
Stabler, J. C., "Exports and Evolution: The Process of Regional Change", Land Economics, XLIV, Number 1, 1968, 11-23. ----
Stanford Research Institute, "Strengths and Weaknesses of the Portland Area as an Industrial Location", Stanford Research Institute, Phase I Report, July 1982.
Streit, M. E., "Spatial Associations and Economic Linkages between Industries", Journal of Regional Science, 9, 1969, 177-188.
Swoveland, C., "A Deterministic Multi-Period Production Planning Model with Piecewide Concave Production and Holding Backorder Costs," Management Science, Vol. 21, 1975, 1007-1013.
Tauchen, Helen and Ann D. Witte, "Office Building Costs and Location," Land Economics, Vol. 59, University of Wisconsin Press, 1983, 324-336.
Taylor, M. J., "Organizational Growth, Spatial Interaction and an6 Location Decision-making," Regional Studies, Vol. 91, 1979, 313-323.
Thomas, M. D., "Explanatory Frameworks for Growth and Change in Uninational and Multinational Firms," Commission of Industrial Systems, 1979 Symposium, Rotterdam, Unpublished Conference Paper.

Thomas, Wilbur R., "Internal and External Factors in the Development of Urban Economies," Issues in Urban Economics, H. S. Perloff and L. Wingo, Editors, John Hopkins Press, Baltimore, 1975, 43-62.
99
Tiebout, C. M., "Exports and Regional Economic Growth," Journal of Political Economy, Vol. 64, 1956, 256-260.
Tiebout, C. M., "Regional and Interregional Input-Output Models~ An Appraisal," Southern Economic Journal, Vol. 24, 1957, 140-147.
Tiebout, C. M., The Community Economic Base Study, Committee for Economic Development, Supplementary Paper, Number 16, 'December 1962.
Tomer, John F., "Community Control and the Theory of the Firm. Review of Social Economics, Vol. 38, 1980, 191.
U. S. Department of Commerce, Industrial Location Detriments 1971-1975, William W. Blunt Jr., Acting Assistant Secretary for Economic Development, February 1973.
Vernon, R., Metropolis 1985, Harvard University Press, Cambridge, Massachusetts, 1960.
Walker, Susanne R., "Linkage Structures in an Urban Economy", Regional Studies, Vol. 11, 1977, 263-273.
Webber, M. J., The Impact of Uncertainity £g Location, MIT Press, Cambridge, Massachusetts, 1972.
Weber, A., Alfred Weber's Theory of the Location of Industries, translated by C. J. Friedrich, from Uber den Standort der Industrien 1909, University of. Chicago Press, Chicago, 1929.
White, Michelle J., "Firm Suburbanization and Urban Subcenters", Journal of Urban Economics, 3, 1976, 323-343.
Wood, P. A., "Industrial Location and Linkage", Area, 2, 1969, 32-39.
Wood, P. A., "Are Behavioral Approaches to Industrial Location Theory Doomed to be Descriptive?," Industrial Alternative Frameworks, D. B. Massey and W. I. Morrison Editors, Center for Environmental Studies, London, 1975, 41-48.

APPENDIX
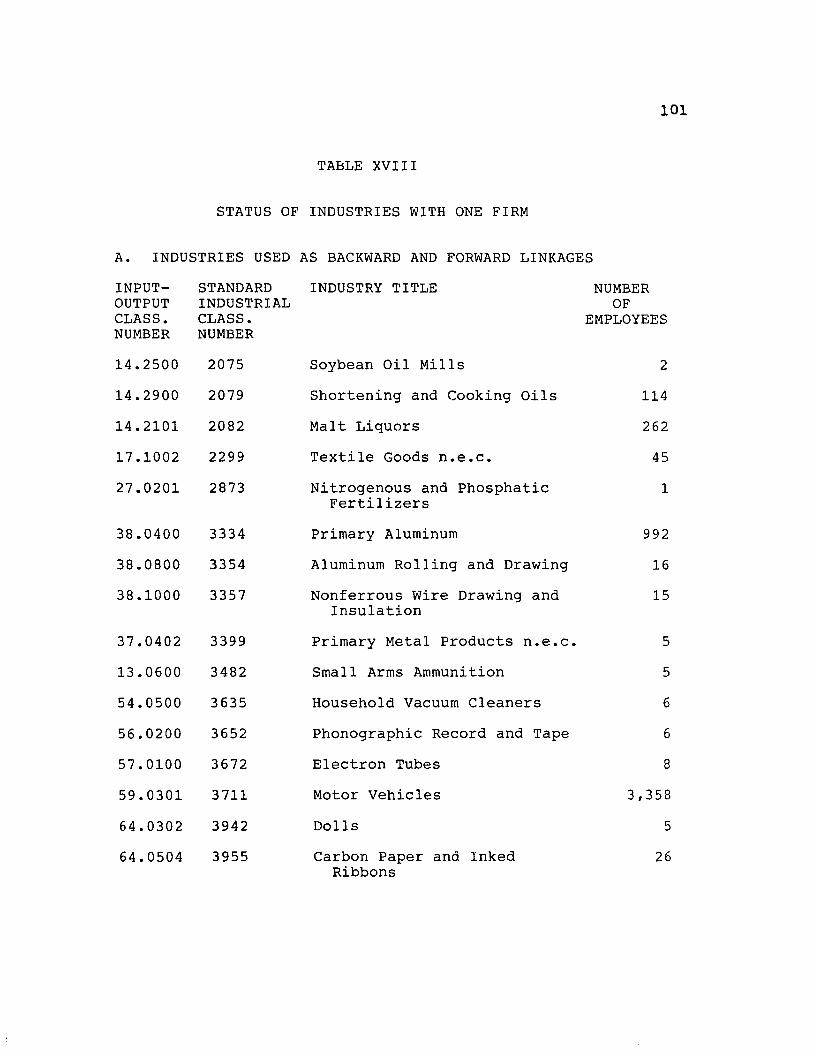
101
TABLE XVIII
STATUS OF INDUSTRIES WITH ONE FIRM
A. INDUSTRIES USED AS BACKWARD AND FORWARD LINKAGES
INPUTOUTPUT CLASS. NUMBER
14.2500
14.2900
14.2101
17.1002
27.0201
38.0400
38.0800
38.1000
37.0402
13.0600
54.0500
56.0200
57.0100
59.0301
64.0302
64.0504
STANDARD INDUSTRIAL CLASS. NUMBER
2075
2079
2082
2299
2873
3334
3354
3357
3399
3482
3635
3652
3672
3711
3942
3955
INDUSTRY TITLE
Soybean Oil Mills
Shortening and Cooking Oils
Malt Liquors
Textile Goods n.e.c.
Nitrogenous and Phosphatic Fertilizers
Primary Aluminum
Aluminum Rolling and Drawing
Nonferrous Wire Drawing and Insulation
Primary Metal Products n.e.c.
Small Arms Ammunition
Household Vacuum Cleaners
Phonographic Record and Tape
Electron Tubes
Motor Vehicles
Dolls
Carbon Paper and Inked Ribbons
NUMBER OF
EMPLOYEES
2
114
262
45
1
992
16
15
5
5
6
6
8
3,358
5
26

102
TABLE XVIII (CON'T)
B. EXISTING SINGLE FIRM INDUSTRIES BELOW LINKAGE THRESHOLD CUTOFF
INPUT- STANDARD INDUSTRY TITLE NUMBER OUTPUT INDUSTRIAL OF CLASS. CLASS. EMPLOYEES NUMBER NUMBER
14.2104 2085 Distilled Liquor except 10 Brandy
24.0300 2631 Paperboard Mills 55
34.0303 3171 Women's Handbags and Purses 58
36.1400 3275 Gypsum Products 65
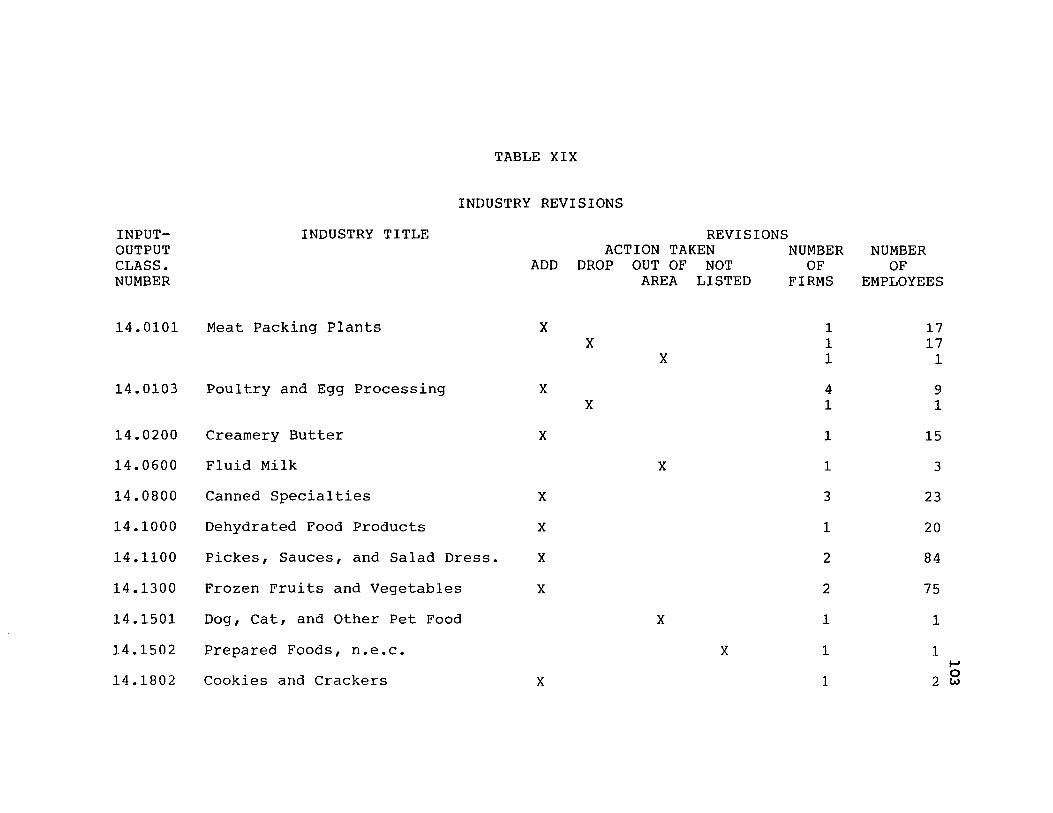
TABLE XIX
INDUSTRY REVISIONS
INPUT- INDUSTRY TITLE REVISIONS OUTPUT ACTION TAKEN NUMBER NUMBER CLASS. ADD DROP OUT OF NOT OF OF NUMBER AREA LISTED FIRMS EMPLOYEES
14.0101 Meat Packing Plants X 1 17 X 1 17
X 1 1
14.0103 Poultry and Egg Processing X 4 9 X 1 1
14.0200 Creamery Butter X 1 15
14.0600 Fluid Milk X 1 3
14.0800 Canned Specialties X 3 23
14.1000 Dehydrated Food Products X 1 20
14.1100 Pickes, Sauces, and Salad Dress. X 2 84
14.1300 Frozen Fruits and Vegetables X 2 75
14.1501 Dog, Cat, and Other Pet Food X 1 1
14.1502 Prepared Foods, n.e.c. X 1 1 .... 14.1802 Cookies and Crackers X 1 2 8

TABLE XIX (CON'T)
INPUT- INDUSTRY TITLE REVISIONS OUTPUT ACTION TAKEN NUMBER. NUMBER CLASS. ADD DROP OUT OF NOT OF OF NUMBER AREA LISTED FIRMS EMPLOYEES
14.2021 Confectionery Products X 3 11 X 1 3
14.2700 Animal and Marine Fats and Oils X 2 27 X 1 17
14.2103 Wines, Brandy and Brandy Spirits X 4 15 X 1 3
14.2200 Bottled and Canned Soft Drinks X 2 255
14.0700 Canned and Cured Seafoods X 2 32
14.2800 Roasted Coffee X 1 40
14.3000 Manufactured Ice X 4 56
14.3100 Macaroni and Spaghetti X 1 45
14.3200 Food Preparations X 2 220
16.0100 Broadwoven Fabric Mills X 1 240
19.0301 Textile Bags X 1 8
.... 0 ~
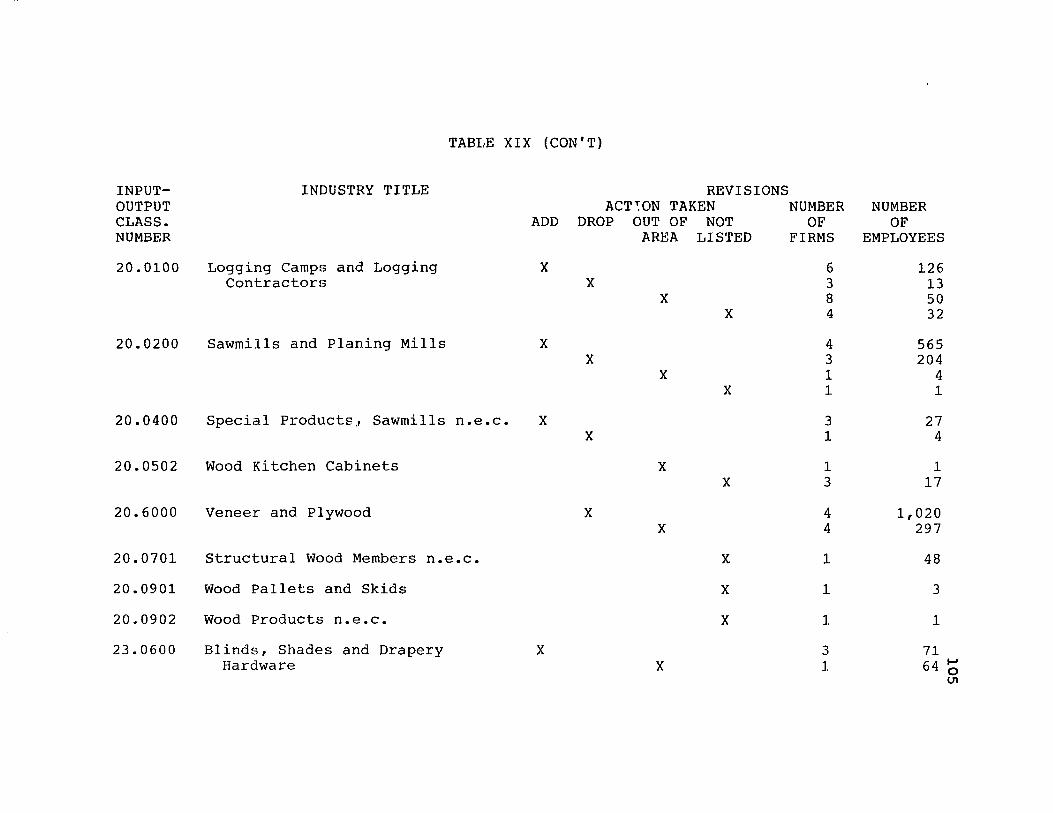
TABI.·E XIX (CON'T)
INPUT- INDUSTRY TITLE REVISIONS OUTPUT ACT:ON TAKEN NUMBER NUMBER CLASS. ADD DROP OUT OF NOT OF OF NUMBER AREA LISTED FIRMS EMPLOYEES
20.0100 Logging Camps and Logging X 6 126 Contractors X 3 13
X 8 50 X 4 32
20.0200 Sawmills and Planing Mills X 4 565 X 3 204
X 1 4 X 1 1
20.0400 Special Products, Sawmills n.e.c. X 3 27 X 1 4
20.0502 Wood Kitchen Cabinets X 1 1 X 3 17
20.6000 Veneer and Plywood X 4 1,020 X 4 297
20.0701 Structural Wood Members n.e.c. X 1 48
20.0901 Wood Pallets and Skids X 1 3
20.0902 Wood Products n.e.c. X 1 1
23.0600 Blinds, Shades and Drapery X 3 71 Hardware X 1 64 ....
0 lJ1
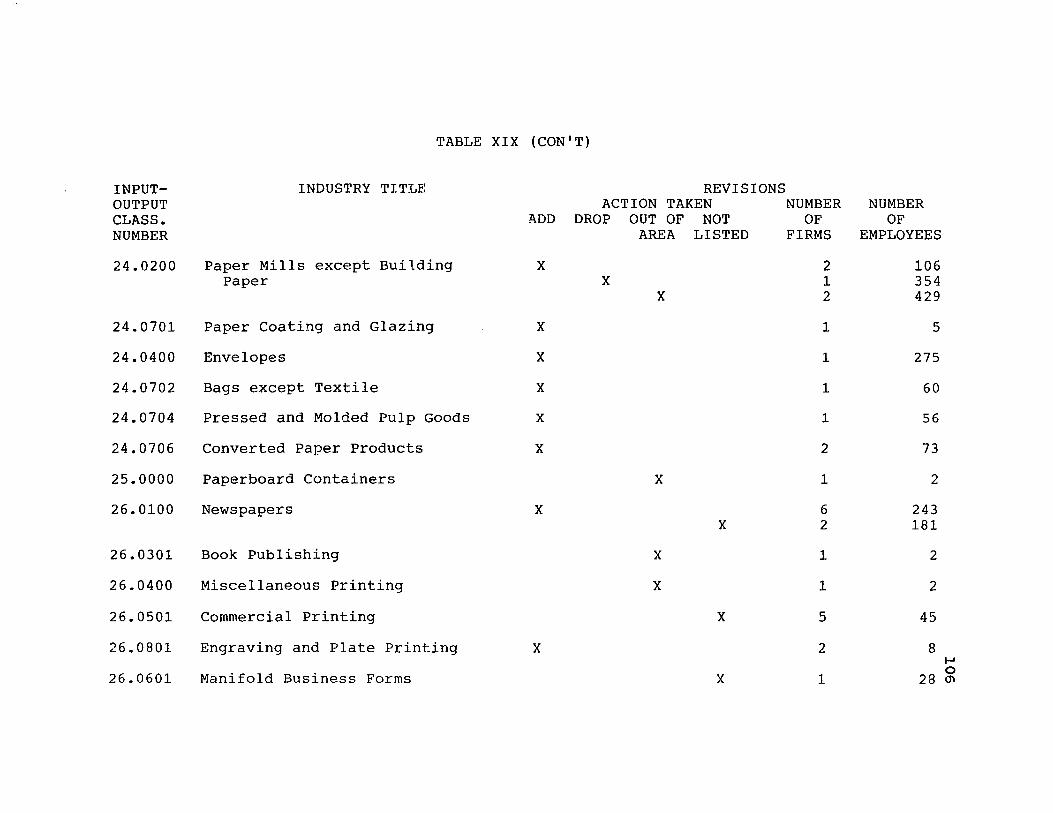
TABLE XIX (CON'T)
INPUT- INDUSTRY TITLE REVISIONS OUTPUT ACTION TAKEN NUMBER NUMBER CLASS. ADD DROP OUT OF NOT OF OF NUMBER AREA LISTED FIRMS EMPLOYEES
24.0200 Paper Mills except Building X 2 106 Paper X 1 354
X 2 429
24.0701 Paper Coating and Glazing X 1 5
24.0400 Envelopes X 1 275
24.0702 Bags except Textile X 1 60
24.0704 Pressed and Molded Pulp Goods X 1 56
24.0706 Converted Paper Products X 2 73
25.0000 Paperboard Containers X 1 2
26.0100 Newspapers X 6 243 X 2 181
26.0301 Book Publishing X 1 2
26.0400 Miscellaneous Printing X 1 2
26.0501 Commercial Printing X 5 45
26.0801 Engraving and Plate Printing X 2 8 .... 26.0601 Manifold Business Forms X 1
0 28 (jI
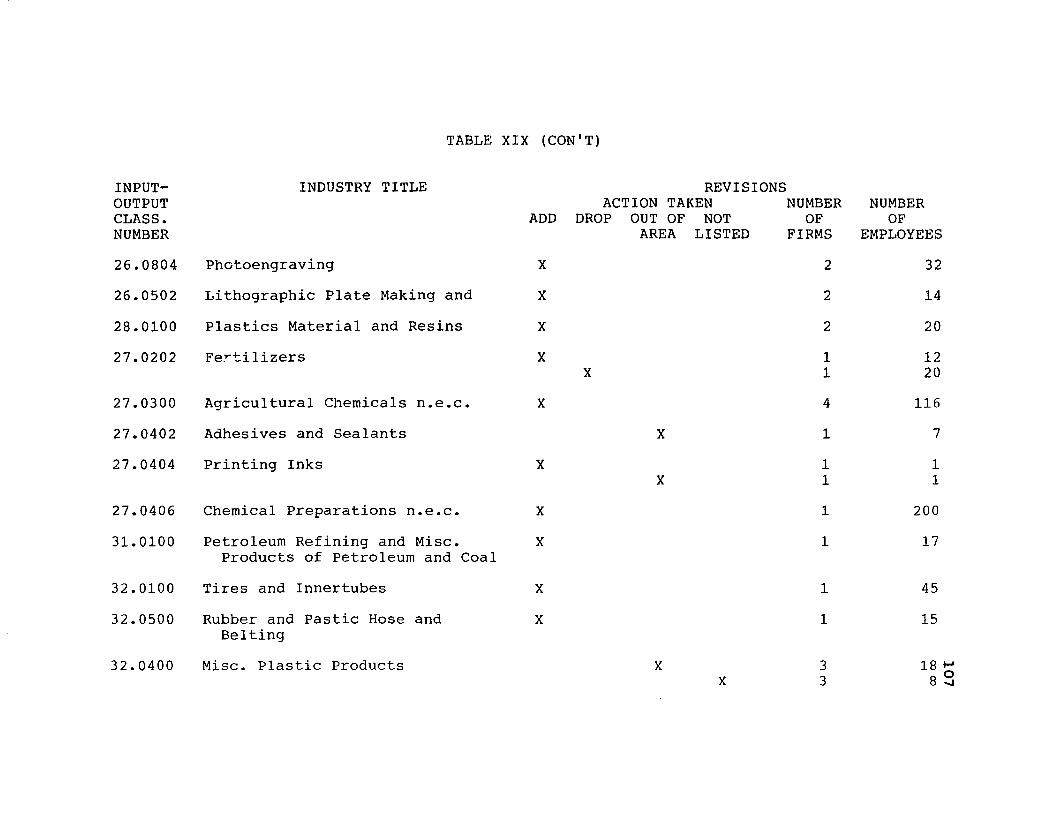
TABLE XIX (CON I T)
INPUT- INDUSTRY TITLE REVISIONS OUTPUT ACTION TAKEN NUMBER NUMBER CLASS. ADD DROP OUT OF NOT OF OF NUMBER AREA LISTED FIRMS EMPLOYEES
26.0804 Photoengraving X 2 32
26.0502 Lithographic Plate Making and X 2 14
28.0100 Plastics Material and Resins X 2 20
27.0202 Fertilizers X 1 12 X 1 20
27.0300 Agricultural Chemicals n.e.c. X 4 116
27.0402 Adhesives and Sealants X 1 7
27.0404 Printing Inks X 1 1 X 1 1
27.0406 Chemical preparations n.e.c. X 1 200
31.0100 Petroleum Refining and Misc. X 1 17 Products of Petroleum and Coal
32.0100 Tires and Innertubes X 1 45
32.0500 Rubber and Pas tic Hose and X 1 15 Belting
32.0400 Misc. Plastic Products X 3 18 I-'
X 3 8~
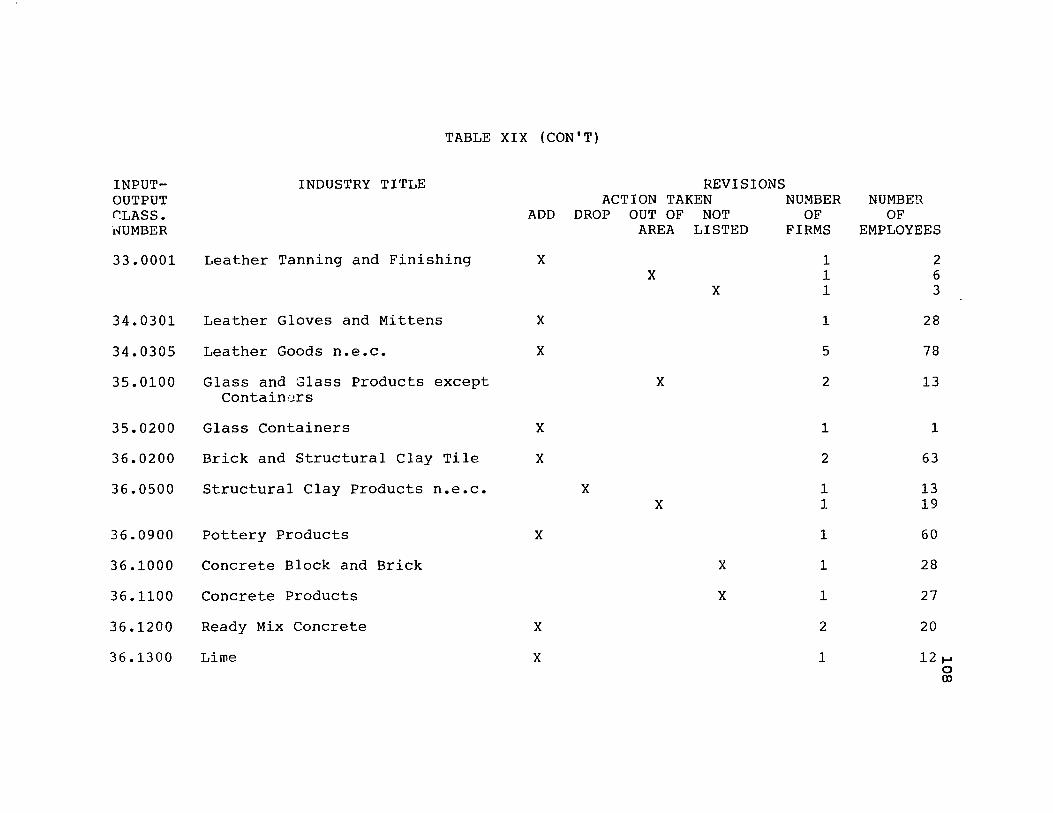
TABLE XIX (CON'T)
INPUT- INDUSTRY TITLE REVISIONS OUTPUT ACTION TAKEN NUMBER NUMBEH t:LASS. ADD DROP OUT OF NOT OF OF l-lUMBER AREA LISTED FIRMS EMPLOYEES
33.0001 Leather Tanning and Finishing X 1 2 X 1 6
X 1 3
34.0301 Leather Gloves and Mittens X 1 28
34.0305 Leather Goods n.e.c. X 5 78
35.0100 Glass and Glass Products except X 2 13 containi'.!rs
35.0200 Glass Containers X 1 1
36.0200 Brick and Structural Clay Tile X 2 63
36.0500 Structural Clay Products n.e.c. X 1 13 X 1 19
36.0900 Pottery Products X 1 60
36.1000 Concrete Block and Brick X 1 28
36.1100 Concrete Products X 1 27
36.1200 Ready Mix Concrete X 2 20
36.1300 Lime X 1 12 .... 0 00
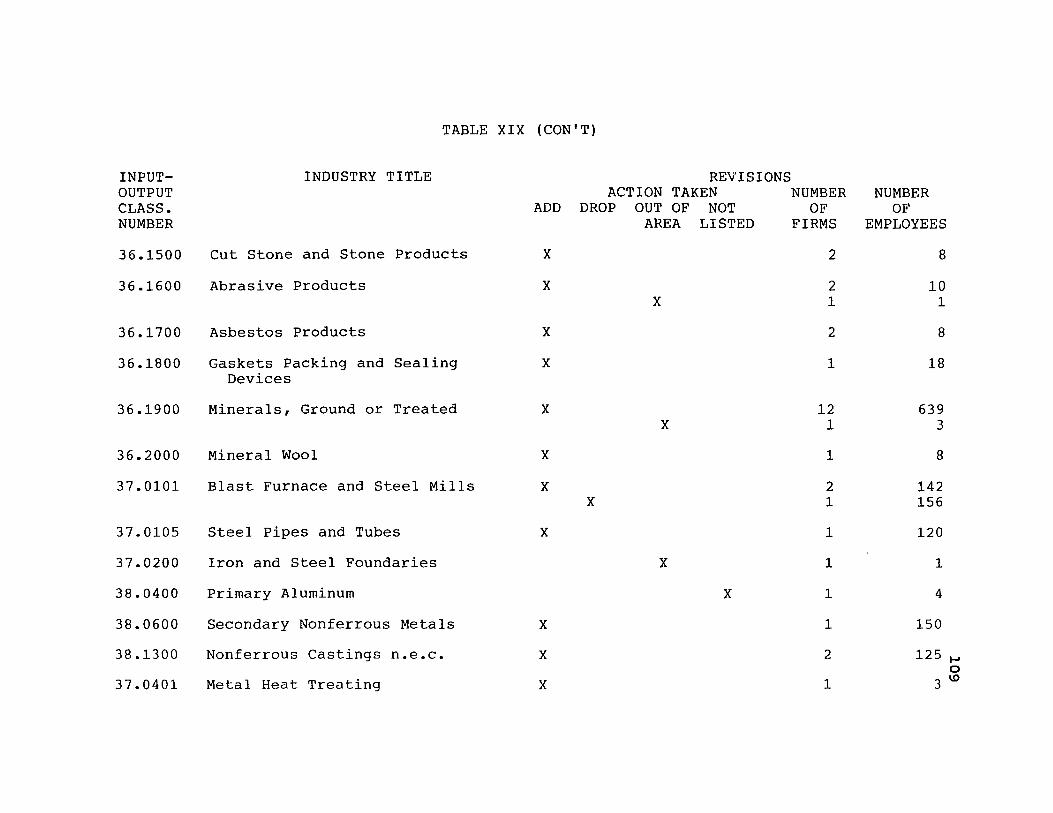
TABLE XIX (CON'T)
INPUT- INDUSTRY TITLE REVISIONS OUTPUT ACTION TAKEN NUMBER NUMBER CLASS. ADD DROP OUT OF NOT OF OF NUMBER AREA LISTED FIRMS EMPLOYEES
36.1500 Cut Stone and Stone Products X 2 8
36.1600 Abrasive Products X 2 10 X 1 1
36.1700 Asbestos Products X 2 8
36.1800 Gaskets Packing and Sealing X 1 18 Devices
36.1900 Minerals, Ground or Treated X 12 639 X 1 3
36.2000 Mineral Wool X 1 8
37.0101 Blast Furnace and Steel Mills X 2 142 X 1 156
37.0105 Steel Pipes and Tubes X 1 120
37.0200 Iron and Steel Foundaries X 1 1
38.0400 Primary Aluminum X 1 4
38.0600 Secondary Nonferrous Metals X 1 150
38.1300 Nonferrous Castings n.e.c. X 2 125 ..... 0
37.0401 Metal Heat Treating X 1 3 \0
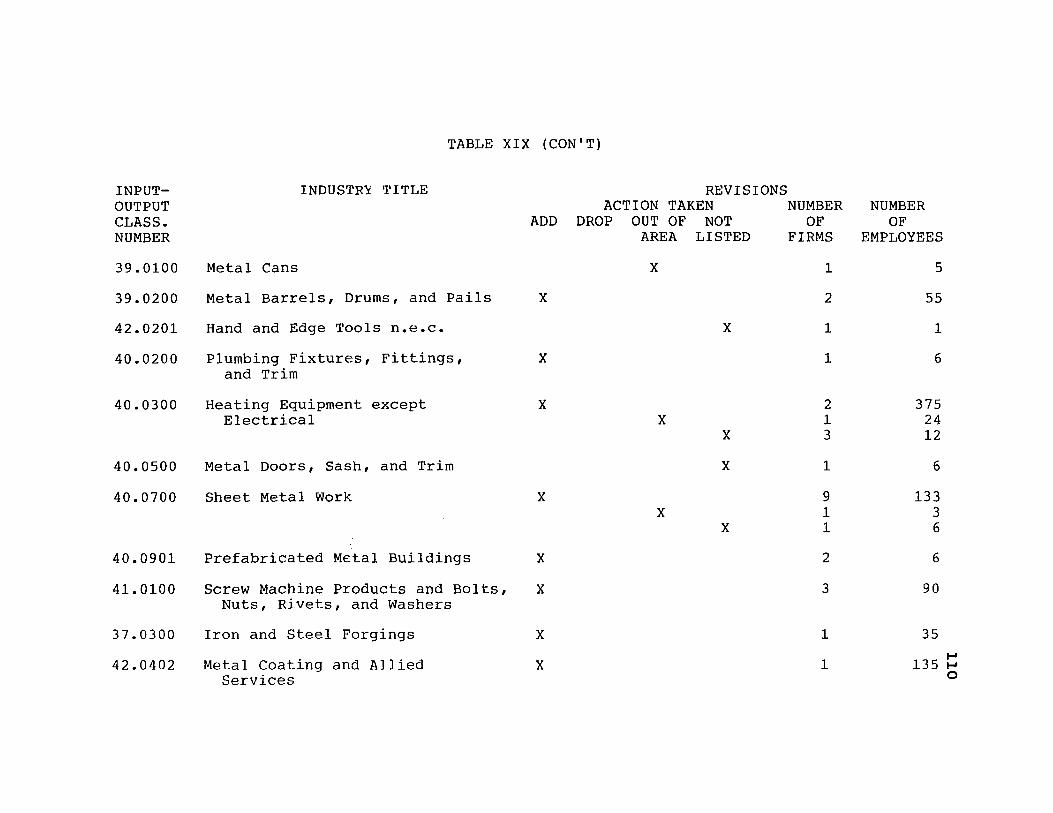
INPUTOUTPUT CLASS. NUMBER
39.0100
39.0200
42.0201
40.0200
40.0300
40.0500
40.0700
40.0901
41. 0100
37.0300
42.0402
TABLE XIX (CON'T)
INDUSTRY TITLE
Metal Cans
Metal Barrels, Drums, and Pails
Hand and Edge Tools n.e.c.
Plumbing Fixtures, Fittings, and Trim
Heating Equipment except Electrical
Metal Doors, Sash, and Trim
Sheet Metal Work
Prefabricated Metal Buildings
Screw Machine Products and Bolts, Nuts, Rivets, and Washers
Iron and Steel Forgings
Metal Coating and Allied Services
ADD
X
X
X
x
x
x
X
x
REVISIONS ACTION TAKEN NUMBER
DROP OUT OF NOT OF AREA LISTED FIRMS
X
X
X x
x
X X
1
2
1
1
2 1 3
1
9 1 1
2
3
1
1
NUMBER OF
EMPLOYEES
5
55
1
6
375 24 12
6
133 3 6
6
90
35
135 ::: o
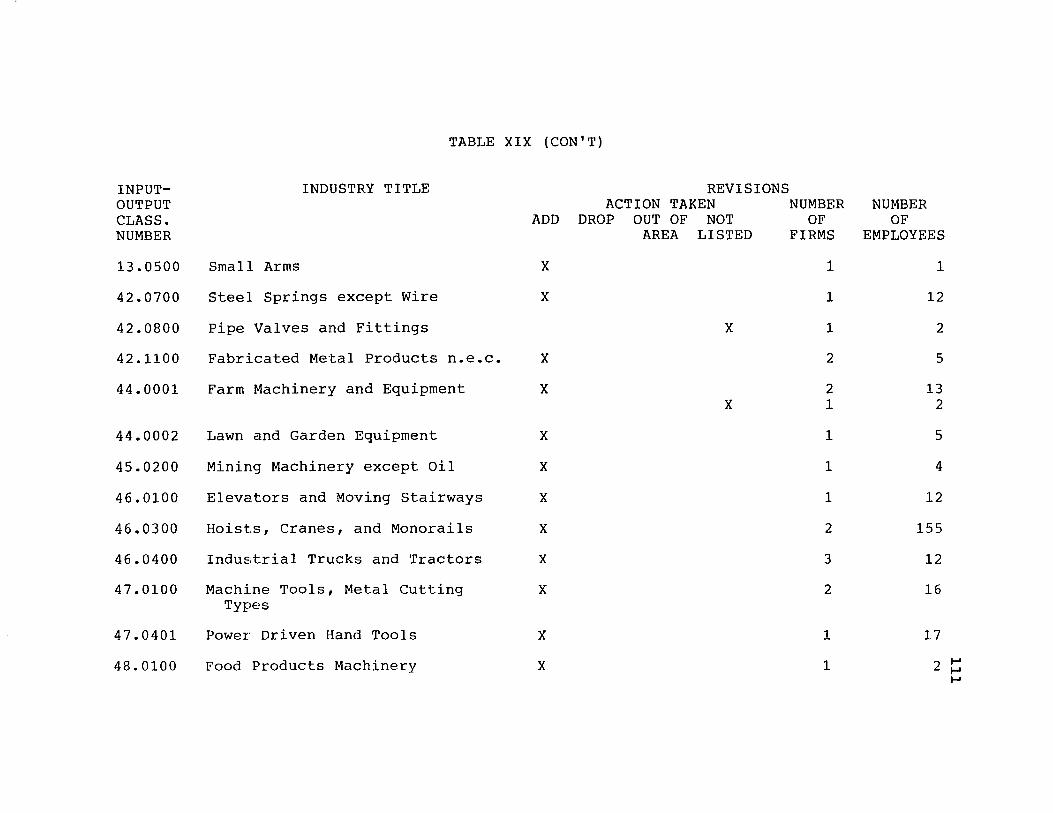
TABLE XIX (CON'T)
INPUT- INDUSTRY TITLE REVISIONS OUTPUT ACTION TAKEN NUMBER NUMBER CLASS. ADD DROP OUT OF NOT OF OF NUMBER AREA LISTED FIRMS EMPLOYEES
13.0500 Small Arms X 1 1
42.0700 Steel Springs except Wire X 1 12
42.0800 Pipe Valves and Fittings X 1 2
42.1100 Fabricated Metal Products n.e.c. X 2 5
44.0001 Farm Machinery and Equipment X 2 13 X 1 2
44.0002 Lawn and Garden Equipment X 1 5
45.0200 Mining Machinery except Oil X 1 4
46.0100 Elevators and Moving Stairways X 1 12
46.0300 Hoists, Cranes, and Monorails X 2 155
46.0400 Industrial Trucks and Tractors X 3 12
47.0100 Machine Tools, Metal Cutting X 2 16 Types
47.0401 Power Driven Hand Tools X 1 17
48.0100 Food Products Machinery X 1 2 .... .... ....
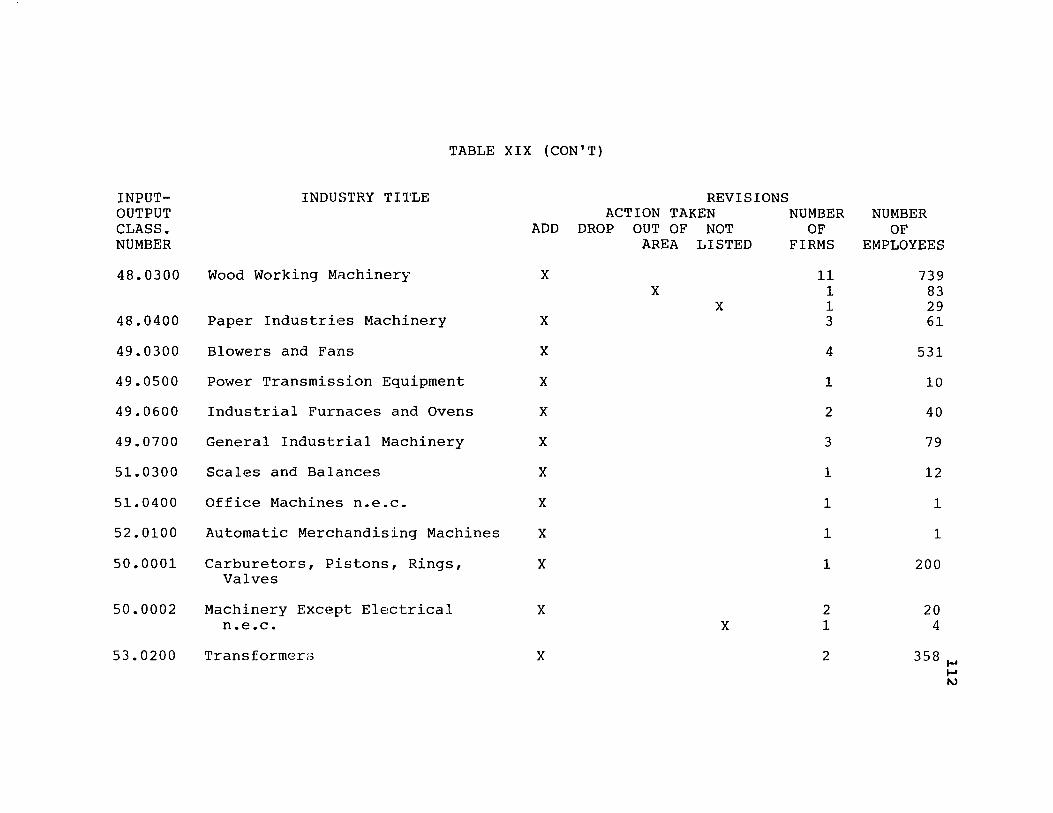
INPUTOUTPUT CLASS. NUMBER
48.0300
48.0400
49.0300
49.0500
49.0600
49.0700
51.0300
51.0400
52.0100
50.0001
50.0002
53.0200
TABLE XIX (CON'T)
INDUSTRY TITLE
Wood Working Machinery
Paper Industries Machinery
Blowers and Fans
Power Transmission Equipment
Industrial Furnaces and Ovens
General Industrial Machinery
Scales and Balances
Office Machines n.e.c.
Automatic Merchandising Machines
Carburetors, Pistons, Rings, Valves
Machinery Except Electrical n.e.c.
Transformers
ADD
X
X
X
X
X
X
X
X
X
X
X
X
REVISIONS ACTION TAKEN NUMBER
DROP OUT OF NOT OF AREA LISTED FIRMS
11 X 1
X 1 3
4
1
2
3
1
1
1
1
2 X 1
2
NUMBER OF
EMPLOYEES
739 83 29 61
531
10
40
79
12
1
1
200
20 4
358 I-'
I-' t\)
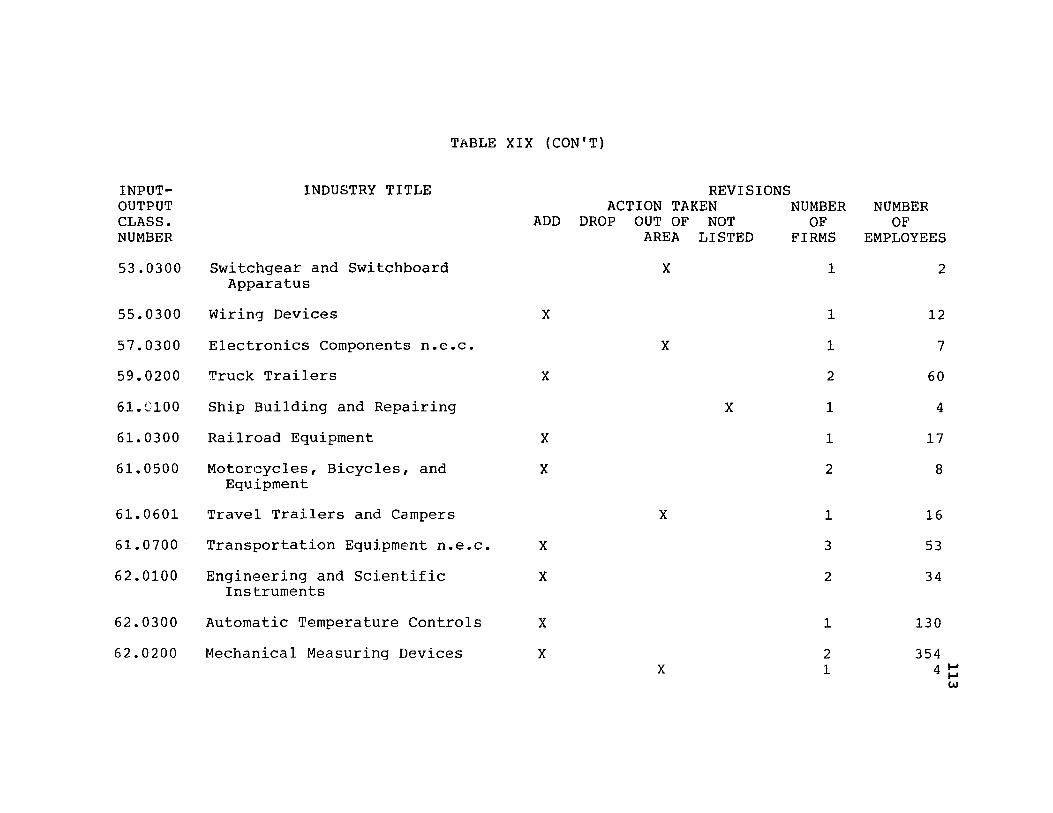
TABLE XIX (CON'T)
INPUT- INDUSTRY TITLE REVISIONS OUTPUT ACTION TAKEN NUMBER NUMBER CLASS. ADD DROP OUT OF NOT OF OF NUMBER AREA LISTED FIRMS EMPLOYEES
53.0300 Switchgear and Switchboard X 1 2 Apparatus
55.0300 Wiring Devices X 1 12
57.0300 Electronics Components n.e.c. X 1 7
59.0200 Truck Trailers X 2 60
61.(100 Ship Building and Repairing X 1 4
61. 0300 Railroad Equipment X 1 17
61. 0500 Motorcycles, Bicycles, and X 2 8 Equipment
61. 0601 Travel Trailers and Campers X 1 16
61. 0700 Transportation Equipment n.e.c. X 3 53
62.0100 Engineering and Scientific X 2 34 Instruments
62.0300 Automatic Temperature Controls X 1 130
62.0200 Mechanical Measuring Devices X 2 354 X 1 4~
~ w
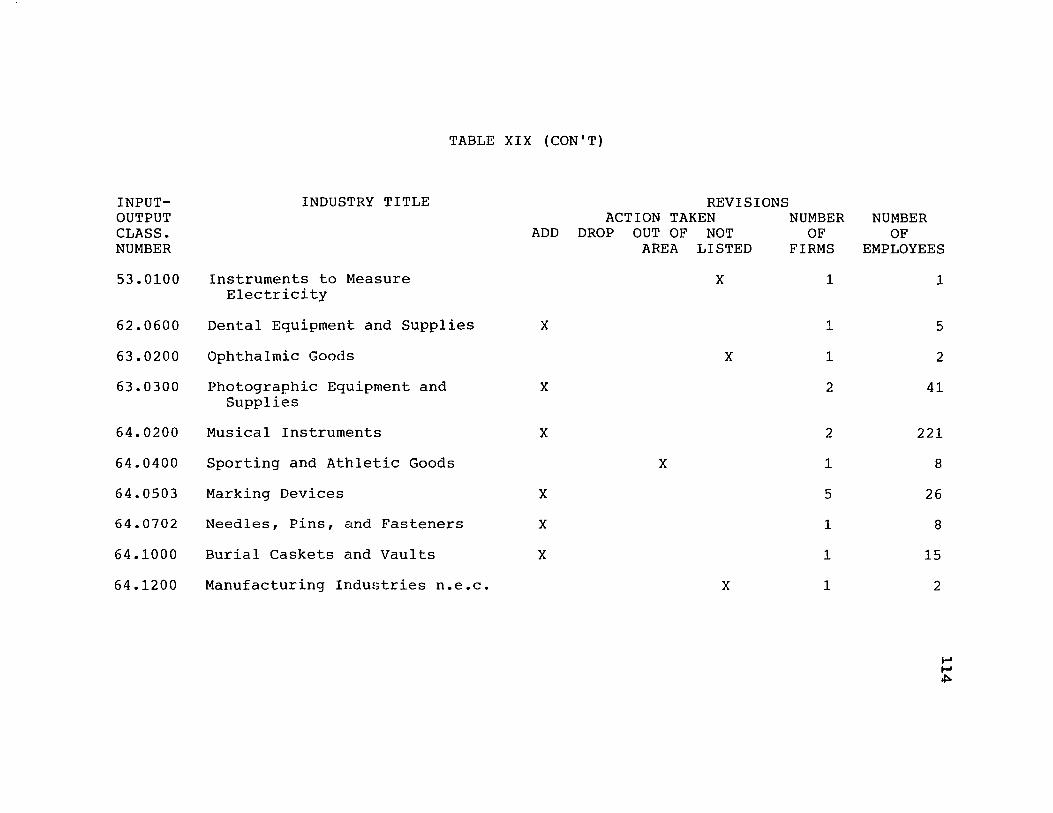
TABLE XIX (CON'T)
INPUT- INDUSTRY TITLE REVISIONS OUTPUT ACTION TAKEN CLASS. ADD DROP OUT OF NOT NUMBER AREA LISTED
53.0100 Instruments to Measure X Electricity
62.0600 Dental Equipment and Supplies X
63.0200 Ophthalmic Goods X
63.0300 Photographic Equipment and X Supplies
64.0200 Musical Instruments X
64.0400 Sporting and Athletic Goods X
64.0503 Marking Devices X
64.0702 Needles, Pins, and Fasteners X
64.1000 Burial Caskets and Vaults X
64.1200 Manufacturing Industries n.e.c. X
NUMBER OF
FIRMS
1
1
1
2
2
1
5
1
1
1
NUMBER OF
EMPLOYEES
1
5
2
41
221
8
26
8
15
2
.... .... ~
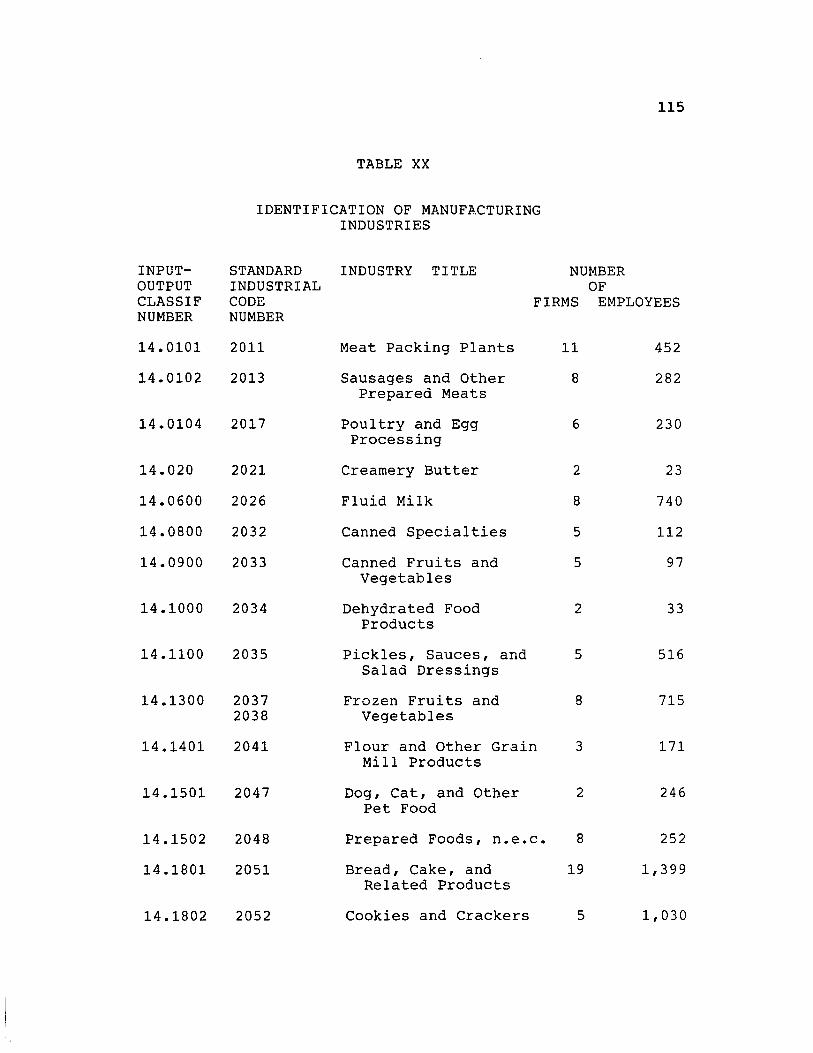
TABLE XX
IDENTIFICATION OF MANUFACTURING INDUSTRIES
STANDARD INDUSTRY TITLE INDUSTRIAL
NUMBER OF
115
INPUTOUTPUT CLASSIF NUMBER
CODE FIRMS EMPLOYEES NUMBER
14.0101 2011
14.0102 2013
14.0104 2017
14.020 2021
14.0600 2026
14.0800 2032
14.0900 2033
14.1000 2034
14.1100 2035
14.1300 2037 2038
14.1401 2041
14.1501 2047
14.1502 2048
14.1801 2051
14.1802 2052
Meat Packing Plants 11
Sausages and Other 8 Prepared Meats
Poultry and Egg 6 Processing
Creamery Butter 2
Fluid Milk 8
Canned Specialties 5
Canned Fruits and 5 Vegetables
Dehydrated Food 2 Products
Pickles, Sauces, and 5 Salad Dressings
Frozen Fruits and 8 Vegetables
Flour and Other Grain 3 Mill Products
Dog, Cat, and Other 2 Pet Food
Prepared Foods, n.e.c.
Bread, Cake, and Related Products
Cookies and Crackers
8
19
5
452
282
230
23
740
112
97
33
516
715
171
246
252
1,399
1,030
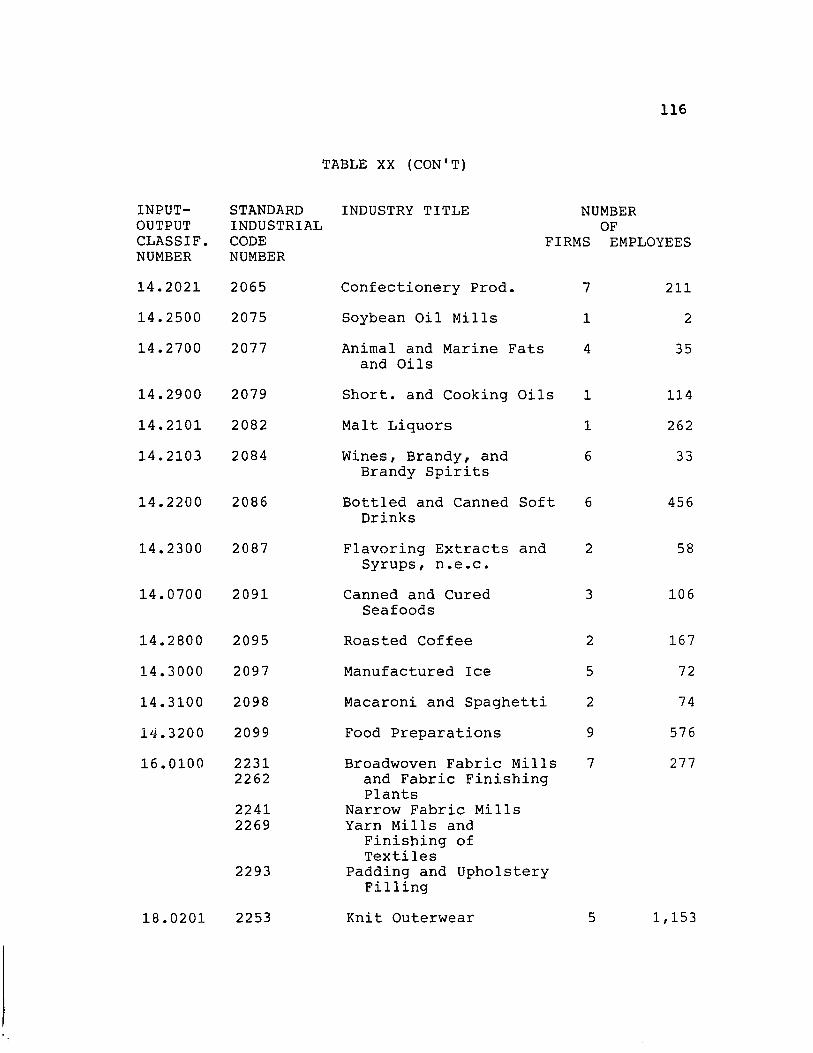
116
TABLE XX (CON'T)
INPUT- STANDARD INDUSTRY TITLE NUMBER OUTPUT INDUSTRIAL OF CLASSIF. CODE FIRMS EMPLOYEES NUMBER NUMBER
14.2021 2065 Confectionery Prod. 7 211
14.2500 2075 Soybean Oil Mills 1 2
14.2700 2077 Animal and Marine Fats 4 35 and Oils
14.2900 2079 Short. and Cooking Oils 1 114
14.2101 2082 Malt Liquors 1 262
14.2103 2084 Wines, Brandy, and 6 33 Brandy Spirits
14.2200 2086 Bottled and Canned Soft 6 456 Drinks
14.2300 2087 Flavoring Extracts and 2 58 Syrups, n.e.c.
14.0700 2091 Canned and Cured 3 106 Seafoods
14.2800 2095 Roasted Coffee 2 167
14.3000 2097 Manufactured Ice 5 72
14.3100 2098 Macaroni and Spaghetti 2 74
14.3200 2099 Food Preparations 9 576
16.0100 2231 Broadwoven Fabric Mills 7 277 2262 and Fabric Finishing
Plants 2241 Narrow Fabric Mills 2269 Yarn Mills and
Finishing of Textiles
2293 Padding and Upholstery Filling
18.0201 2253 Knit Outerwear 5 1,153

117
TABLE XX (CON'T)
INPUT- STANDARD INDUSTRIAL TITLE NUMBER OUTPUT INDUSTRIAL OF CLASSIF. CODE FIRMS EMPLOYEES NUMBER NUMBER
17.1002 2299 Textile Goods, n.e.c. 1 45
18.0400 2321 Apparel Made from 8 1,382 2329 Purchased Materials 2331 2337 2339 2369 2381 2385 2386
19.0100 2391 Curtains and Draperies 19 201
19.0200 2392 House Furnishings, n.e.c. 5 161
19.0301 2393 Textile Bags 5 632
19.0302 2394 Canvas Products 9 95
19.0306 2399 Fabricated Textile 6 41 Products
20.0100 2411 Logging Camps and 67 984 Logging Contractors
20.0200 2421 Sawmills and Planing 39 2,696 Mills, General
20.0300 2426 Hardwood Dimension and 2 22 Flooring Mills
20.0400 2429 Special Products 7 92 Sawmills, n.e.c.
20.0501 2431 Millwork 24 879
20.0502 2434 Wood Kitchen Cabinets 51 642
20.0600 2435 Veneer and Plywood 10 592 2436
20.0701 2439 Structural Wood Members 7 289
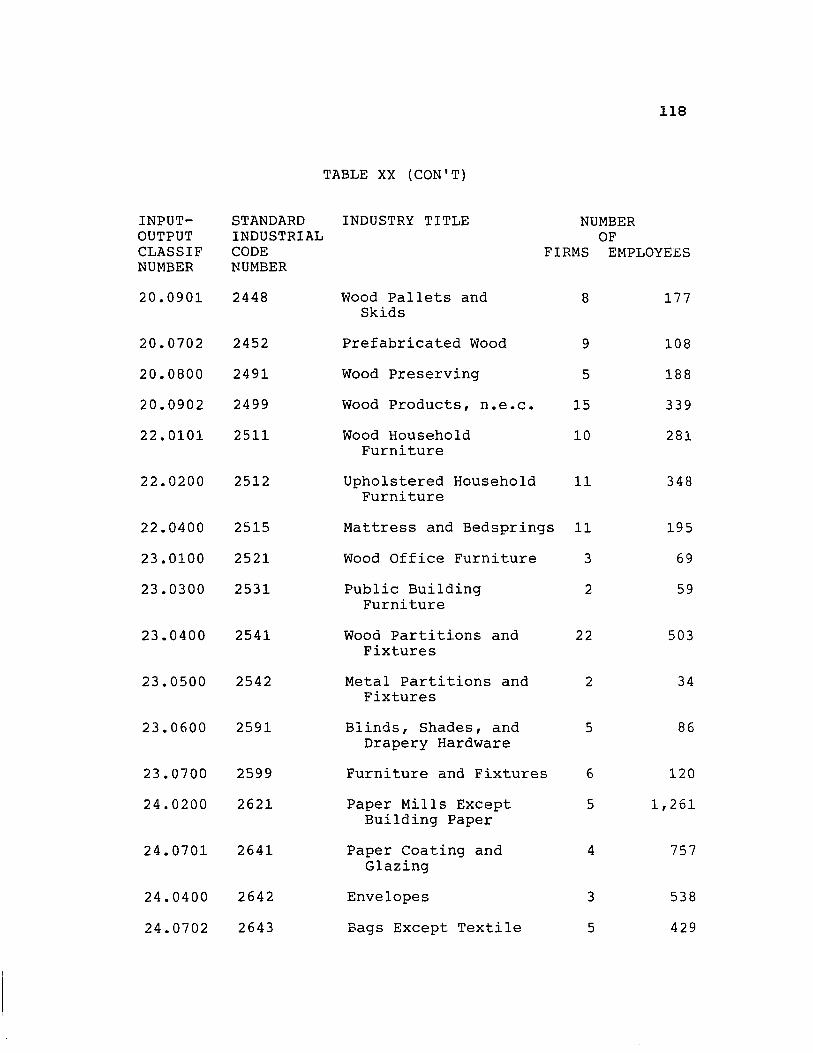
INPUTOUTPUT CLASSIF NUMBER
20.0901
20.0702
20.0800
20.0902
22.0101
22.0200
22.0400
23.0100
23.0300
23.0400
23.0500
23.0600
23.0700
24.0200
24.0701
24.0400
24.0702
118
TABLE XX (CON'T)
STANDARD INDUSTRY TITLE NUMBER OF INDUSTRIAL
CODE NUMBER
2448
2452
2491
2499
2511
2512
2515
2521
2531
2541
2542
2591
2599
2621
2641
2642
2643
FIRMS EMPLOYEES
Wood Pallets and Skids
Prefabricated Wood
Wood Preserving
Wood Products, n.e.c.
8
9
5
15
Wood Household 10 Furniture
Upholstered Household 11 Furniture
Mattress and Bedsprings 11
Wood Office Furniture 3
Public Building 2 Furniture
Wood Partitions and 22 Fixtures
Metal Partitions and 2 Fixtures
Blinds, Shades, and 5 Drapery Hardware
Furniture and Fixtures 6
Paper Mills Except 5 Building Paper
Paper Coating and 4 Glazing
Envelopes 3
Bags Except Textile 5
177
108
188
339
281
348
195
69
59
503
34
86
120
1,261
757
538
429
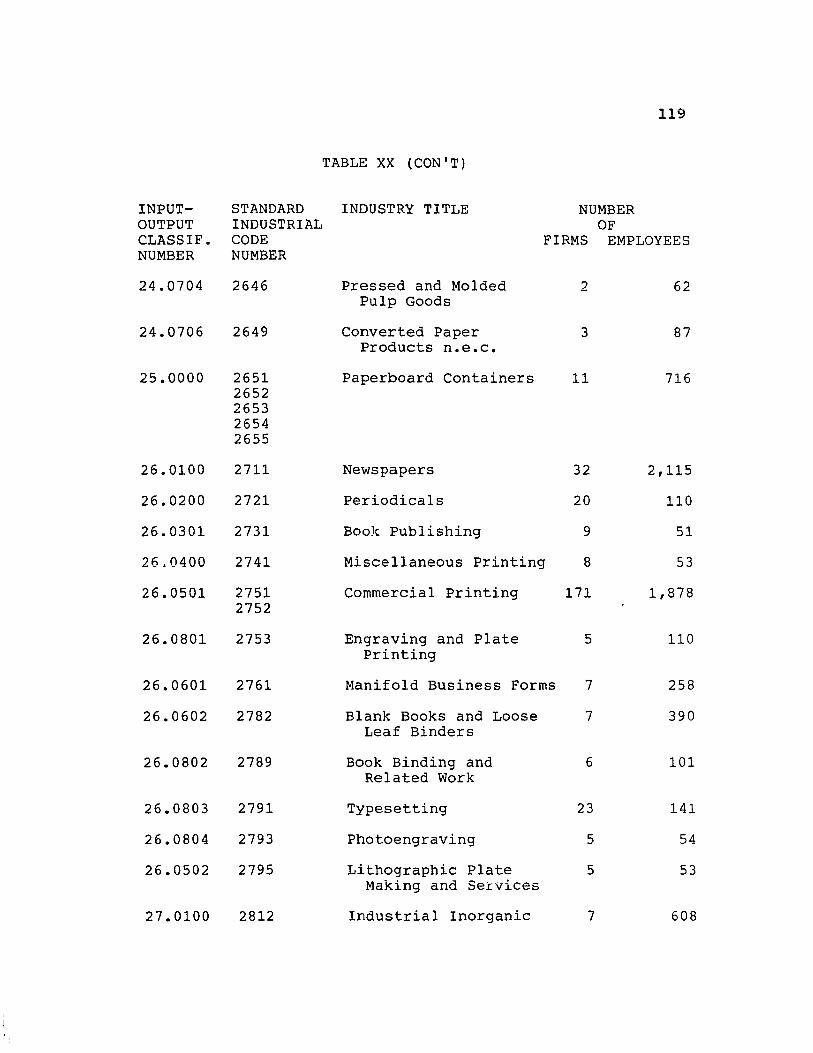
119
TABLE XX (CON'T)
INPUT- STANDARD INDUSTRY TITLE NUMBER OUTPUT INDUSTRIAL OF CLASSIF. CODE FIRMS EMPLOYEES NUMBER NUMBER
24.0704 2646 Pressed and Molded 2 62 Pulp Goods
24.0706 2649 Converted Paper 3 87 Products n.e.c.
25.0000 2651 Paperboard Containers 11 716 2652 2653 2654 2655
26.0100 2711 Newspapers 32 2,115
26.0200 2721 Periodicals 20 110
26.0301 2731 Book Publishing 9 51
26"0400 2741 Miscellaneous Printing 8 53
26.0501 2751 Commercial Printing 171 1,878 2752
26.0801 2753 Engraving and Plate 5 110 Printing
26.0601 2761 Manifold Business Forms 7 258
26.0602 2782 Blank Books and Loose 7 390 Leaf Binders
26.0802 2789 Book Binding and 6 101 Related Work
26.0803 2791 Typesetting 23 141
26.0804 2793 Photoengraving 5 54
26.0502 2795 Lithographic Plate 5 53 Making and Services
27.0100 2812 Industrial Inorganic 7 608
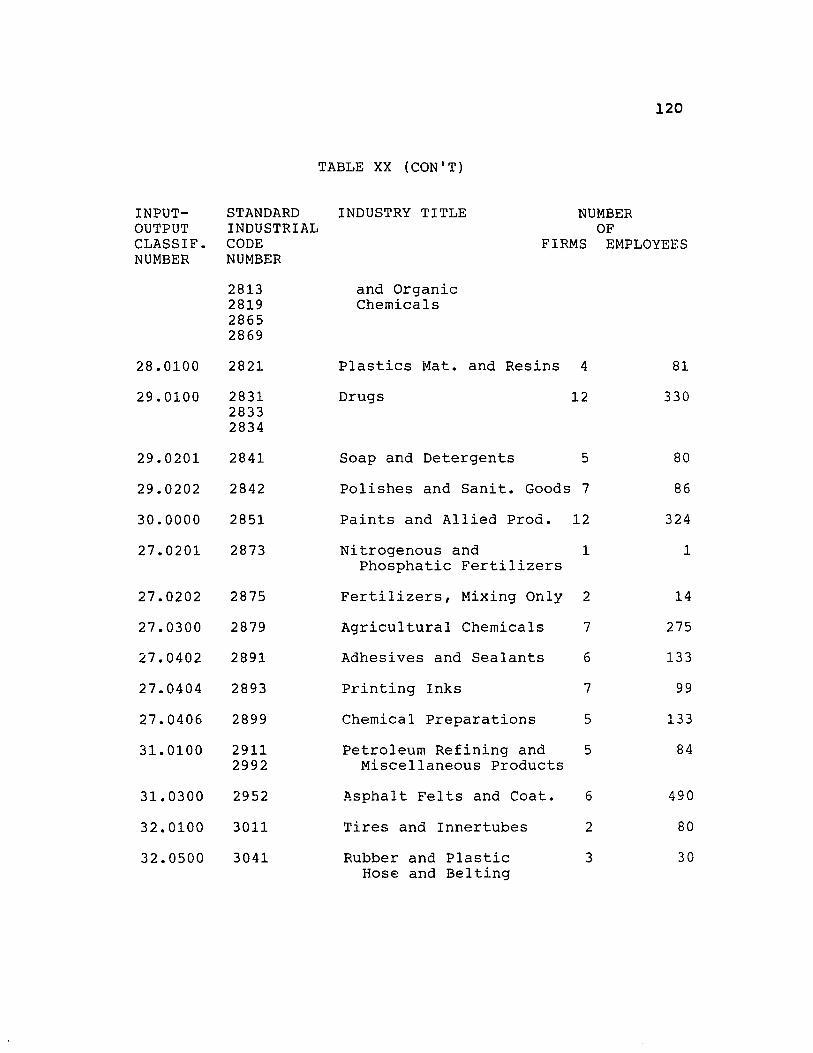
120
TABLE XX (CON'T)
INPUT- STANDARD INDUSTRY TITLE NUMBER OUTPUT INDUSTRIAL OF CLASSIF. CODE FIRMS EMPLOYEES NUMBER NUMBER
2813 and Organic 2819 Chemicals 2865 2869
28.0100 2821 Plastics Mat. and Resins 4 81
29.0100 2831 Drugs 12 330 2833 2834
29.0201 2841 Soap and Detergents 5 80
29.0202 2842 Polishes and Sanit. Goods 7 86
30.0000 2851 Paints and Allied Prod. 12 324
27.0201 2873 Nitrogenous and 1 1 Phosphatic Fertilizers
27.0202 2875 Fertilizers, Mixing Only 2 14
27.0300 2879 Agricultural Chemicals 7 275
27.0402 2891 Adhesives and Sealants 6 133
27.0404 2893 Printing Inks 7 99
27.0406 2899 Chemical Preparations 5 133
31. 0100 2911 Petroleum Refining and 5 84 2992 Miscellaneous Products
31. 0300 2952 Asphalt Felts and Coat. 6 490
32.0100 3011 Tires and Innertubes 2 80
32.0500 3041 Rubber and Plastic 3 30 Hose and Belting
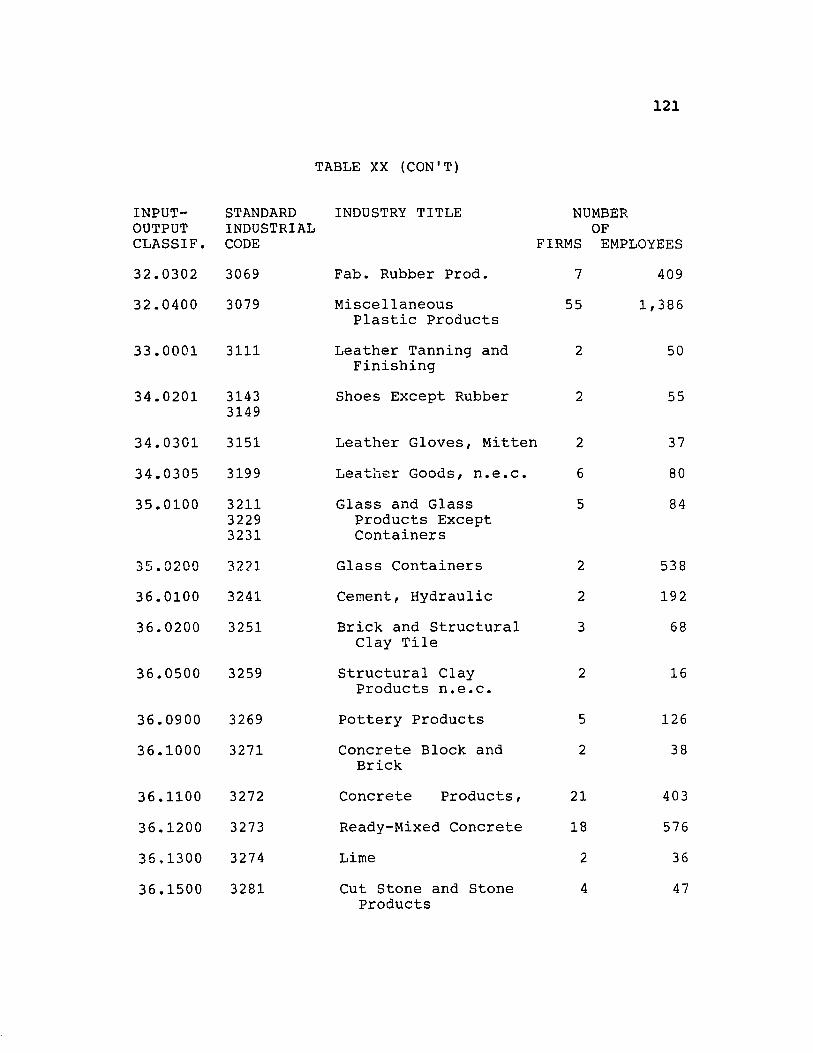
TABLE XX (CON'T)
INPUTOUTPUT CLASSIF.
STANDARD INDUSTRY TITLE INDUSTRIAL CODE
32.0302 3069
32.0400 3079
33.0001 3111
34.0201 3143 3149
Fab. Rubber Prod.
Miscellaneous Plastic Products
Leather Tanning and Finishing
Shoes Except Rubber
NUMBER OF
121
FIRMS EMPLOYEES
7 409
55 1,386
2 50
2 55
34.0301 3151 Leather Gloves, Mitten 2
6
37
34.0305 3199
35.0100 3211 3229 3231
35.0200 32?1
36.0100 3241
36.0200 3251
36.0500 3259
36.0900 3269
36.1000 3271
36.1100 3272
36.1200 3273
36.1300 3274
36.1500 3281
Leather Goods, n.e.c.
Glass and Glass Products Except Containers
Glass Containers
Cement, Hydraulic
Brick and Structural Clay Tile
Structural Clay Products n.e.c.
Pottery Products
Concrete Block and Brick
Concrete Products,
Ready-Mixed Concrete
Lime
cut Stone and Stone Products
80
5 84
2 538
2 192
3 68
2 16
5 126
2 38
21 403
18 576
2 36
4 47

122
TABLE XX (CON'T)
INPUT- STANDARD INDUSTRY TITLE NUMBER OUTPUT INDUSTRIAL OF CLASSIF. CODE FIRMS EMPLOYEES NUMBER NUMBER
36.1600 3291 Abrasive Products 3 46
36.1700 3292 Asbestos Products 3 17
36.1800 3293 Gaskets, Packing and 4 77 Sealing Devices
36.1900 3295 Minerals, Ground or 14 672 Treated
36.2000 3296 Mineral Wool 3 60
36.2200 3299 Nonmetallic Mineral 3 124 Products, n.e.c.
37.0101 3312 Blast Furnaces and 3 709 Steel Mills
37.0102 3313 Electrometallurgical 2 216 Products
37.0105 3317 Steel Pipes and Tubes 3 433
37.0200 3321 Iron and Steel 12 4,046 3324 Foundries 3325
38.0400 3334 Primary Aluminum 1 992
38.0600 3341 Secondary Nonferrous 2 235 Metals
38.0800 3354 Aluminum Rolling and 1 16 Drawing
38.0900 3356 Nonferrous Rolling and 2 6 Drawing, n.e.c.
38.1000 3357 Nonferrous Wire Drawing 1 15 and Insulating
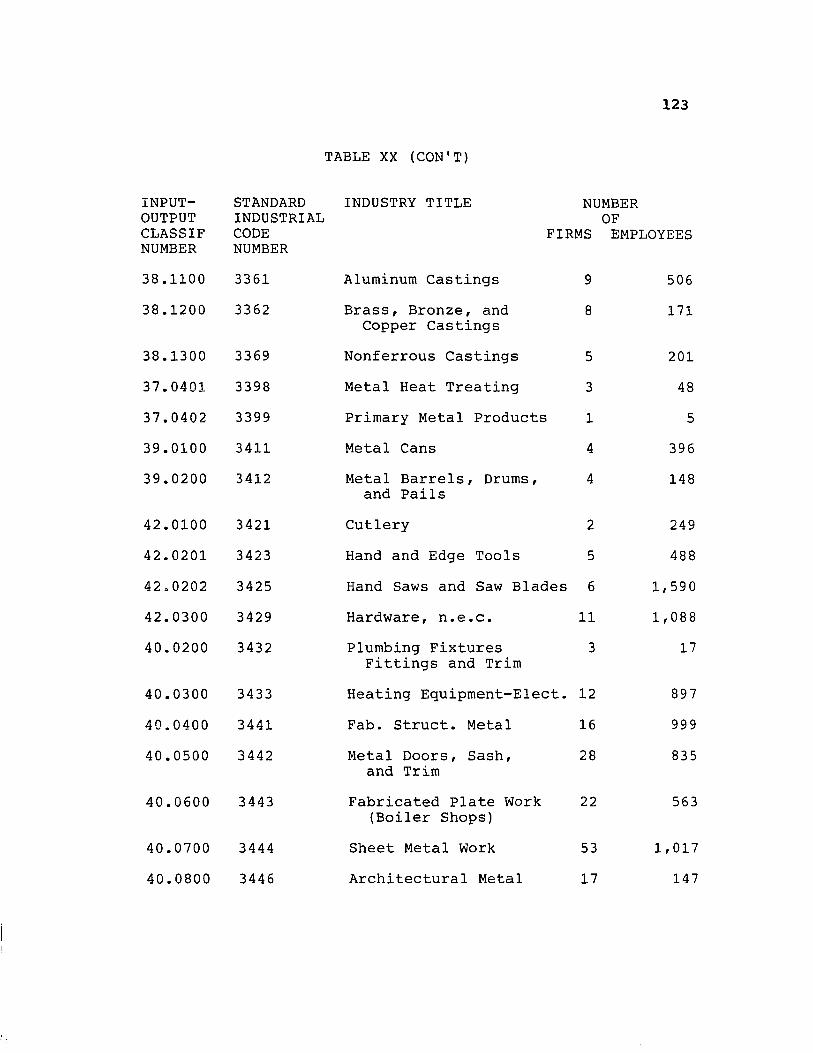
123
TABLE XX (CON'T)
INPUT- STANDARD INDUSTRY TITLE NUMBER OUTPUT INDUSTRIAL OF CLASSIF CODE FIRMS EMPLOYEES NUMBER NUMBER
38.1100 3361 Aluminum Castings 9 506
38.1200 3362 Brass, Bronze, and 8 171 Copper Castings
38.1300 3369 Nonferrous Castings 5 201
37.0401 3398 Metal Heat Treating 3 48
37.0402 3399 Primary Metal Products 1 5
39.0100 3411 Metal Cans 4 396
39.0200 3412 Metal Barrels, Drums, 4 148 and Pails
42.0100 3421 Cutlery 2 249
42.0201 3423 Hand and Edge Tools 5 488
42.0202 3425 Hand Saws and Saw Blades 6 1,590
42.0300 3429 Hardware, n.e.c. 11 1,088
40.0200 3432 Plumbing Fixtures 3 17 Fittings and Trim
40.0300 3433 Heating Equipment-Elect. 12 897
40.0400 3441 Fab. Struct. Metal 16 999
40.0500 3442 t-letal Doors, Sash, 28 835 and Trim
40.0600 3443 Fabricated Plate Work 22 563 (Boiler Shops)
40.0700 3444 Sheet Metal Work 53 1,017
40.0800 3446 Architectural Metal 17 147
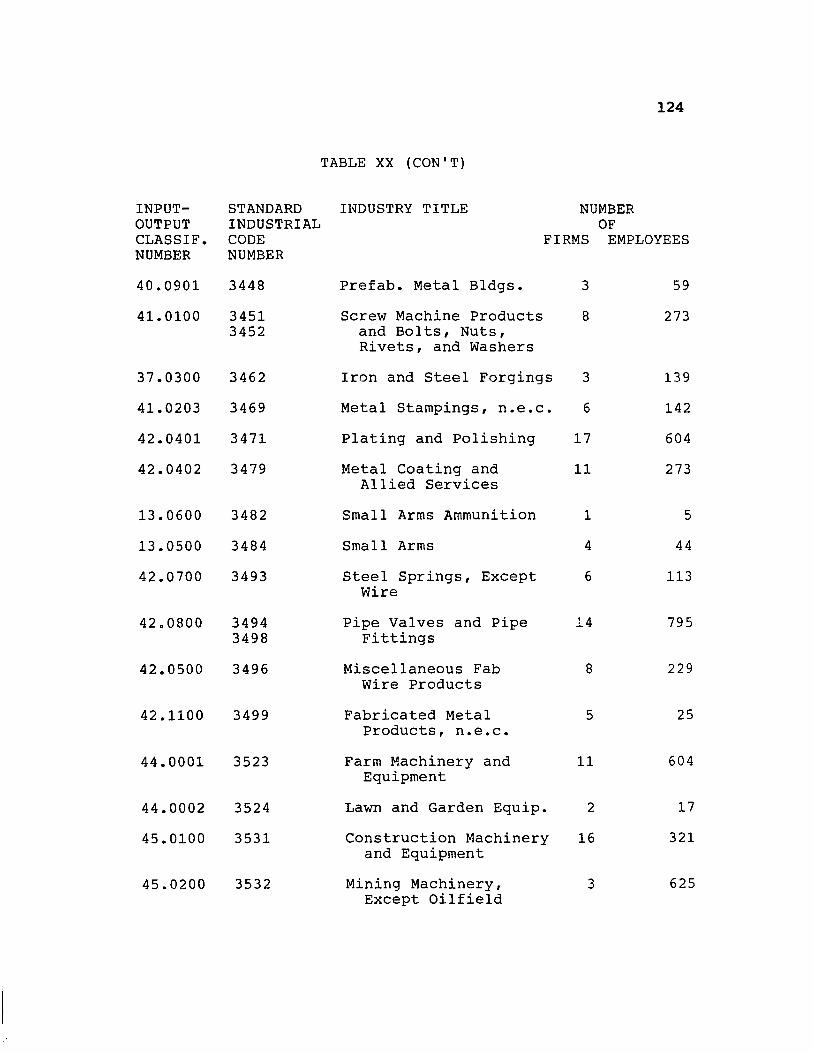
124
TABLE XX (CON'T)
INPUT- STANDARD INDUSTRY TITLE NUMBER OUTPUT INDUSTRIAL OF CLASSIF. CODE FIRMS EMPLOYEES NUMBER NUMBER
40.0901 3448 Prefab. Metal Bldgs. 3 59
41. 0100 3451 Screw Machine Products 8 273 3452 and Bolts, Nuts,
Rivets, and Washers
37.0300 3462 Iron and Steel Forgings 3 139
41.0203 3469 Metal Stampings, n.e.c. 6 142
42.0401 3471 Plating and Polishing 17 604
42.0402 3479 Metal Coating and 11 273 Allied Services
13.0600 3482 Small Arms Ammunition 1 5
13.0500 3484 Small Arms 4 44
42.0700 3493 Steel Springs, Except 6 113 Wire
42.0800 3494 Pipe Valves and Pipe 14 795 3498 Fittings
42.0500 3496 Miscellaneous Fab 8 229 Wire Products
42.1100 3499 Fabricated Metal 5 25 Products, n.e.c.
44.0001 3523 Farm Machinery and 11 604 Equipment
44.0002 3524 Lawn and Garden Equip. 2 17
45.0100 3531 Construction Machinery 16 321 and Equipment
45.0200 3532 Mining Machinery, 3 625 Except Oilfield
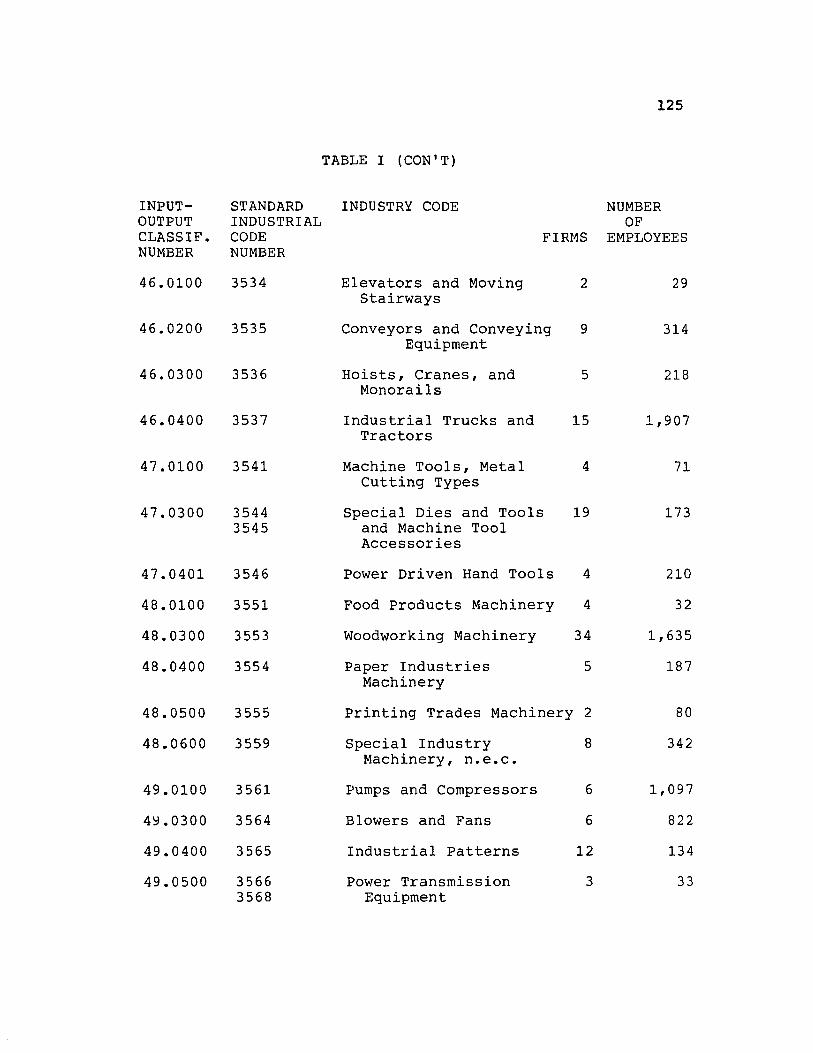
INPUTOUTPUT CLASSIF. NUMBER
46.0100
46.0200
46.0300
46.0400
47.0100
47.0300
47.0401
48.0100
48.0300
48.0400
48.0500
48.0600
49.0100
4~.0300
49.0400
49.0500
125
TABLE I (CON'T)
STANDARD INDUSTRY CODE NUMBER OF
FIRr-1S EMPLOYEES INDUSTRIAL CODE NUMBER
3534 Elevators and Moving 2 29
3535
3536
3537
3541
3544 3545
3546
3551
3553
3554
3555
3559
3561
3564
3565
3566 3568
Stairways
Conveyors and Conveying 9 Equipment
Hoists, Cranes, and 5 Monorails
Industrial Trucks and 15 Tractors
Machine Tools, Metal 4 Cutting Types
Special Dies and Tools 19 and Machine Tool Accessories
Power Driven Hand Tools 4
Food Products Machinery 4
Woodworking Machinery 34
Paper Industries 5 Machinery
Printing Trades Machinery 2
Special Industry Machinery, n.e.c.
Pumps and Compressors
Blowers and Fans
Industrial Patterns
Power Transmission Equipment
8
6
6
12
3
314
218
1,907
71
173
210
32
1,635
187
80
342
1,097
822
134
33

TABLE XX (CON'T)
STANDARD INDUSTRY TITLE INDUSTRIAL
NUMBER OF
126
INPUTOUTPUT CLASSIF. NUMBER
CODE FIRMS EMPLOYEES NUMBER
49.0600 3567
49.0700 3569
51.0100 3573
51.0300 3576
51.0400 3579
52.0100 3581
52.0300 3585
52.0500 3589
50.0001 3592
50.0002 3599
53.0200 3612
53.0300 3613
53.0500 3622
54.0500 3635
55.0300 3643 3644
55.0200 3645
Industrial Furnaces 5 and Ovens
General Industrial Mach. 5
Electronic Computing 5 Equipment
Scales and Balances 2
Office Machines, n.e.c. 2
Automatic Merchandising 2 f-1achines
Refrigeration and 5 Heating Equipment
Service Industry 7 Machines, n.e.c.
Carburetors, Pistons 2 Rings, Valves
Machinery, Except 103 Electrical, n.e.c.
Transformers 4
Switchgear and 8 Switchboard Apparatus
Industry Controls 9
Household Vacuum 1 Cleaners
Wiring Devices 4
Lighting Fixtures and 7
136
94
1,904
14
5
18
156
190
201
1,821
435
412
135
6
150
79
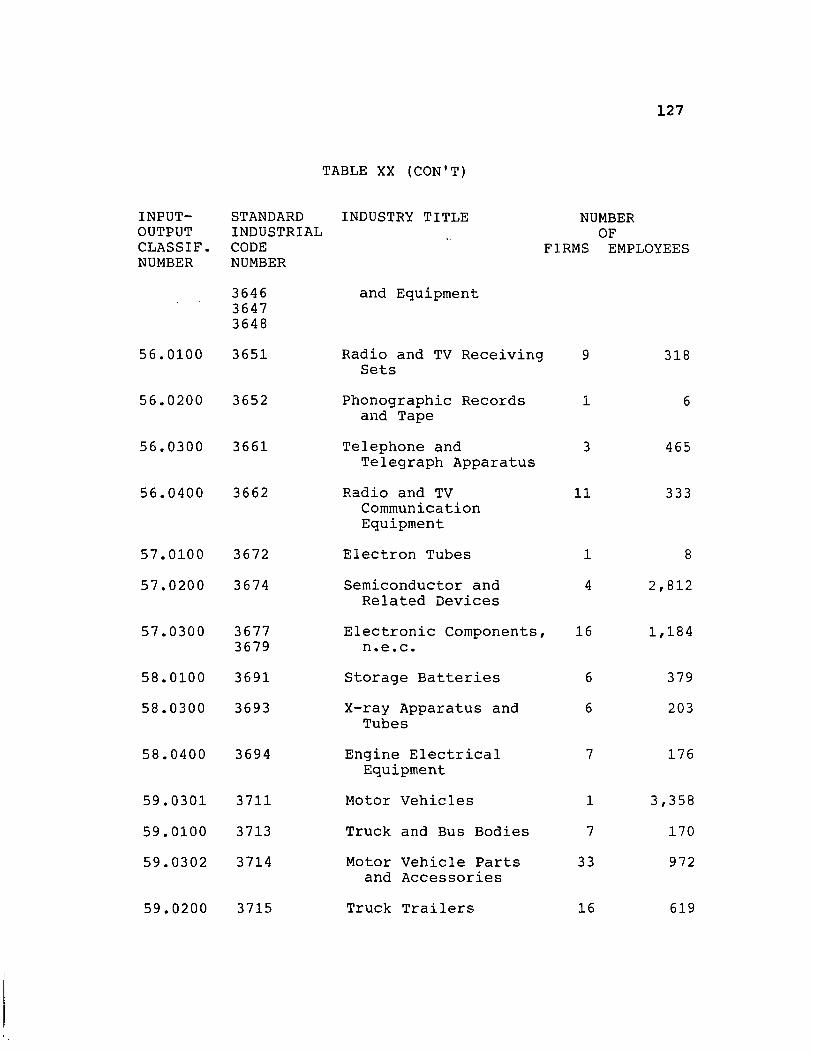
127
TABLE XX (CON'T)
INPUT- STANDARD INDUSTRY TITLE NUMBER OUTPUT INDUSTRIAL OF CLASSIF. CODE FIRMS EMPLOYEES NUMBER NUMBER
3646 and Equipment 3647 3648
56.0100 3651 Radio and TV Receiving 9 318 Sets
56.0200 3652 Phonographic Records 1 6 and Tape
56.0300 3661 Telephone and 3 465 Telegraph Apparatus
56.0400 3662 Radio and TV 11 333 Communication Equipment
57.0100 3672 Electron Tubes 1 8
57.0200 3674 Semiconductor and 4 2,812 Related Devices
57.0300 3677 Electronic Components, 16 1,184 3679 n.e.c.
58.0100 3691 Storage Batteries 6 379
58.0300 3693 X-ray Apparatus and 6 203 Tubes
58.0400 3694 Engine Electrical 7 176 Equipment
59.0301 3711 Motor Vehicles 1 3,358
59.0100 3713 Truck and Bus Bodies 7 170
59.0302 3714 Motor Vehicle Parts 33 972 and Accessories
59.0200 3715 Truck Trailers 16 619
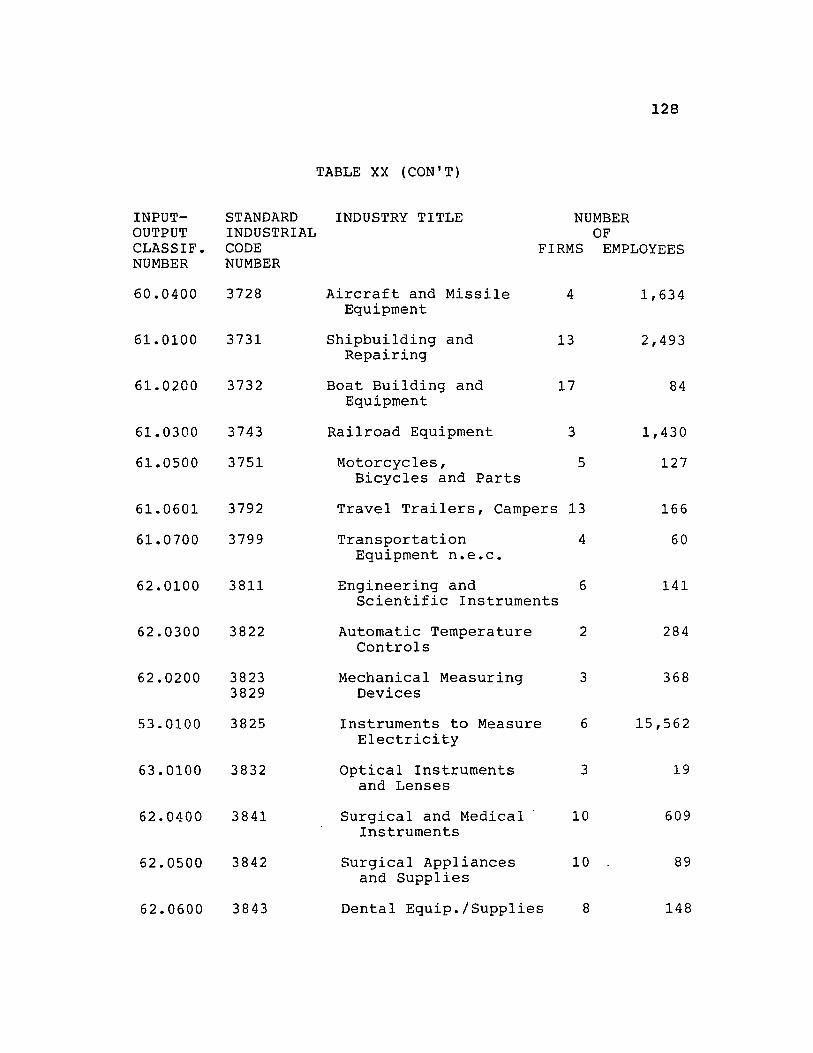
128
TABLE XX (CON'T)
INPUTOUTPUT CLASSIF. NUMBER
STANDARD INDUSTRY TITLE NUMBER OF INDUSTRIAL
CODE NUMBER
60.0400 3728
61. 0100 3731
61. 0200 3732
61.0300 3743
61.0500 3751
61.0601 3792
61.0700 3799
62.0100 3811
62.0300 3822
62.0200 3823 3829
53.0100 3825
63.0100 3832
62.0400 3841
62.0500 3842
62.0600 3843
FIRMS EMPLOYEES
Aircraft and Missile Equipment
Shipbuilding and Repairing
Boat Building and Equipment
Railroad Equipment
Motorcycles, Bicycles and Parts
4
13
17
3
5
Travel Trailers, Campers 13
Transportation 4 Equipment n.e.c.
Engineering and 6 Scientific Instruments
Automatic Temperature 2 Controls
Mechanical Measuring 3 Devices
Instruments to Measure 6 Electricity
Optical Instruments 3 and Lenses
Surgical and Medical 10 Instruments
Surgical Appliances 10 and Supplies
Dental Equip./Supplies 8
1,634
2,493
84
1,430
127
166
60
141
284
368
15,562
19
609
89
148
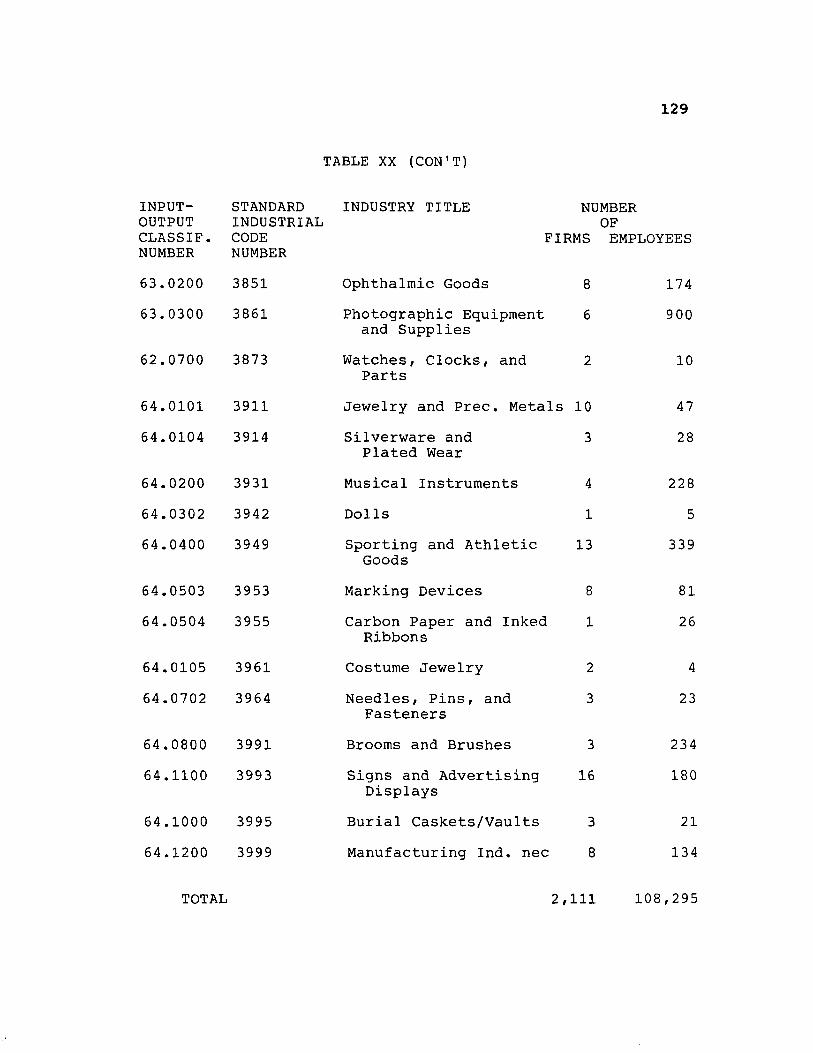
INPUTOUTPUT CLASSIF. NUMBER
63.0200
63.0300
62.0700
64.0101
64.0104
64.0200
64.0302
64.0400
64.0503
64.0504
64.0105
64.0702
64.0800
64.1100
64.1000
64.1200
TOTAL
129
TABLE XX (CON'T)
STANDARD INDUSTRY TITLE NUMBER OF INDUSTRIAL
CODE NUMBER
3851
3861
3873
3911
3914
3931
3942
3949
3953
3955
3961
3964
3991
3993
3995
3999
FIRMS EMPLOYEES
Ophthalmic Goods
Photographic Equipment and Supplies
Watches, Clocks, and Parts
8
6
2
Jewelry and Prec. Metals 10
Silverware and Plated Wear
Musical Instruments
Dolls
Sporting and Athletic Goods
Marking Devices
Carbon Paper and Inked Ribbons
Costume Jewelry
Needles, Pins, and Fasteners
Brooms and Brushes
Signs and Advertising Displays
Burial Caskets/Vaults
Manufacturing Ind. nec
3
4
1
13
8
1
2
3
3
16
3
8
2,111
174
900
10
47
28
228
5
339
81
26
4
23
234
180
21
134
108,295