WKHVWXGHQWUHTXHVWLQJDWUDQVIHU )RUPinternational.syr.edu/_documents/forms/TRF-In 011417 v1.pdf6
Open Journal of Air Pollution, 2015, 4, 139-148 Published Online September 2015 in SciRes. http://www.scirp.org/journal/ojap http://dx.doi.org/10.4236/ojap.2015.43013
How to cite this paper: Al-Hassen, S.I., Sultan, A.W.A., Ateek, A.A., Al-Saad, H.T., Mahdi, S. and Alhello, A.A. (2015) Spatial Analysis on the Concentrations of Air Pollutants in Basra Province (Southern Iraq). Open Journal of Air Pollution, 4, 139-148. http://dx.doi.org/10.4236/ojap.2015.43013
Spatial Analysis on the Concentrations of Air Pollutants in Basra Province (Southern Iraq) Shukri I. Al-Hassen1, Abdul Wahab A. Sultan2, Adnan A. Ateek2, Hamid T. Al-Saad3*, Salah Mahdi3, Abdulzahra A. Alhello3 1Department of Geography, University of Basra, Basra, Iraq 2Technical College, Southern Technical University, Basra, Iraq 3Department of Environmental Chemistry, University of Basra, Basra, Iraq Email: *[email protected]
Received 15 July 2015; accepted 28 August 2015; published 31 August 2015
Copyright © 2015 by authors and Scientific Research Publishing Inc. This work is licensed under the Creative Commons Attribution International License (CC BY). http://creativecommons.org/licenses/by/4.0/
Abstract This paper aims to analyze the geographic distribution of air pollutant concentrations in Basra Province, Southern Iraq, and to cartographically determine the spatial variation of air pollution levels as well as to recognize the hottest spots of air pollution within the study area, and conclude that the levels of air pollution in the study area are spatially varied, with an irregular spatial pat-tern and some hotspots.
Keywords Air Pollution, Air Pollutants, Gaseous Emission, Spatial Analysis, Basra
1. Introduction Air pollution may be defined as any atmospheric condition in which certain substances are present in such con-centrations that they can produce harmful effects on man and his environment. An air pollutant, however, is any gas or substance (such as SOx, NOx, CO, and HCs) or particulate matter (such as smoke, dust, fumes, and aero-sols) that leads to ambient air contamination. A pollutant may originate from natural or anthropogenic sources, or both. Pollutants occur throughout much of the troposphere; however, pollution close to the earth’s surface within the boundary layer is of most concern because of the relatively high concentrations resulting from sources at the surface [1] [2].
Air pollutant concentrations depend mainly on the total mass of pollution emitted into the atmosphere, to-
*Corresponding author.

S. I. Al-Hassen et al.
140
gether with the atmospheric conditions that affect its fate and transport. Obviously, air pollution has many and varied sources, including cars, smokestacks, and other industrial inputs into the atmosphere as well as wind ero-sion of soil. Large emissions from both anthropogenic and natural sources over long periods enhance concentra-tions, as do the chemical and physical properties of these pollutants. For example, when nitrogen oxides and hy-drocarbons in car exhaust are emitted into warm, sunlit air, they readily form ozone molecules (O3). Similarly, the solubility of a pollutant affects how efficiently it is removed by rainfall. In addition, atmospheric conditions have a major effect upon pollutants once these pollutants are emitted into (e.g., nitrogen oxides from car exhaust) or formed within (e.g., O3) the atmosphere. Pollution dispersal is controlled by atmospheric motion, which is af-fected by wind, stability, and the vertical temperature variation within the boundary layer. Stability, in turn, in-fluences both air turbulence and the depth at which mixing of polluted air takes place ([2]; see also [3]-[7]).
In the study area (Basra province), located in southern Iraq, air pollution is of major public concern, which is currently the object of extensive scientific research. Studies of Al-Asadi [8], Al-Mayahi [9], Al-Imarah et al. [10], Al-Saad et al. [11], Garabedian [12], Al-Hassen [13], Qassim [14], Douabul et al. [15], Sultan et al. [16], Karmalla et al. [17], Abdullah and Hussien [18], and Al-Hassen et al. [19], are an example of some local-scale research in this respect.
The study area is rich in petroleum and many existing industrial and human activities as the main sources of gaseous emissions around it (Figure 1). These are emission sources to contaminate the ambient air in Basra. According to above mentioned studies, Basra was recorded, in the last two decades, high quantities of gaseous emissions causing elevated levels of outdoor air pollution, and that concentration of some air pollutants was at risk to the public health. One of the most important driving forces is atmospheric conditions in this region.
(a) (b)
(c) (d)
Figure 1. Photography of some gaseous emission sources in the study area. (a) Petrochemical plant; (b) Najybia power sta-tion; (c) Emissions of petroleum exploitation near Burchesya; (d) Iranian Abadan refinery offshore seeba.

S. I. Al-Hassen et al.
141
The previous studies, however, are focused on values of gaseous pollutant concentration and its implications on the human health in the study area; thus the objective of the present study is to spatially analyze the geo-graphic distribution of air pollutant concentrations in Basra, and to cartographically determine the spatial varia-tion of air pollution levels on the map of this region. The major aim is to recognize the hottest spot of air pollu-tion within whole areas of Basra province.
Basra has a hot desert climate (Köppen climate classification BWh), like the rest of the surrounding region, though it receives slightly more precipitation than inland locations due to its location near the coast. During the summer months, from June to August, Basra is consistently one of the hottest cities on the planet, with tempera-tures regularly exceeding 40˚C (104˚F) and approaching 45˚C (113˚F) in July. In winter Basra experiences mild weather with average high temperatures around 20˚C (68˚F). On some winter nights, minimum temperatures are below 0˚C (32˚F). High humidity—sometimes exceeding 90%—is common due to the proximity to the marshy Persian Gulf [20].
2. Materials and Methods As shown in Figure 2, seventeen sampling stations were chosen in the study area. The selected stations divided to cover the eastern and western region within the study area, and the geographic distribution of sampling sta-tions was taken in consideration in the vicinity of human settlements and involved a variety of local environ-ments (see Table 1).
1 2
3
5 4
8
7
6
10
11
12 13
14
15 16
17 9
0 10 20 Km
Figure 2. Map of the study area (Basra Province, Southern Iraq), showing the selected sam-pling stations. Note: Numbers of sampling stations correspondences their names listed in Table 1 and Table 2.

S. I. Al-Hassen et al.
142
Table 1. Type of environment in the selected sampling stations, and the major sources of gaseous emissions in the study area.
Major source of air pollution Type of environment Sampling station No.
Petroleum exploitation and urban contaminates Agricultural/industrial/urban Midaina 1
Petroleum exploitation and urban contaminates Agricultural/industrial/urban Qurna 2
Petroleum exploitation and urban contaminates Agricultural/industrial/urban Dayer 3
Power station Agricultural/urban Garmatt Ali 4
Urban contaminates Urban Ashar 5
Urban contaminates Agricultural/urban Abo Khaseeb 6
Petroleum industry and exploitation Agricultural/industrial Seeba 7
Urban contaminates Agricultural/urban Faw 8
Natural contaminates Marine Ras Absha 9
Natural and urban contaminates Riverine Shatt Al-Basra 10
Petroleum industry and exploitation Industrial Burchesya 11
Petroleum industry Industrial Petrochemical plant area 12
Petroleum industry Industrial South gas plant area 13
Urban contaminates Urban Safwan 14
Industrial and urban contaminates Industrial/urban Khor Al-Zubayer 15
Petroleum industry and shipping Industrial/marine Gas terminal 16
Urban contaminates Urban/marine Umm Qasr 17
The selected stations were in order to monitor the concentrations of gaseous pollutants released into ambient
air of the study area. A variety of gaseous pollutants such as carbon monoxide (CO), carbon dioxide (CO2), sul-fate oxides (SOx), nitrogen oxides (NOx), ozone (O3), petroleum hydrocarbons (HCs), methane (CH4), hydrogen sulfide (H2S), and formaldehyde (HCHO), measured in this work. Concentrations of HCs, NOx, SOx, HCHO, O3, and CO2 measured using the portable detection instrument of Drager Chip-Measurement System, Germany, whereas the portable instrument of RK1 Gas Monitoring Eagle II, USA, detected the pollutants of CH4, H2S, and CO.
Fieldwork carried out during a one daytime of spring 2015, and all measurements were done at the same time in purpose of obtaining on readings approaching to reality. Therefore, the working team divided into two groups, one of them work in the eastern region (Midaina, Qurna, Dayer, Garmatt Ali, Ashar, Abo Khaseeb, Seeba, Faw, and Ras Absha), while the other group work in the western region (Shatt Al-Basra, Burchesya, Petrochemical plant area, South Gas Plant area, South Gas Plant area, Safwan, Khor Al-Zubayer, Gas terminal, Umm Qasr). The procedure of measuring was as described by Douabul et al. [15].
3. Results and Discussion Table 2 lists the obtained results for concentrations of some air pollutants in the given study area and period. These concentrations recorded from the direct readings displayed on the screen of both employed detectors. The values were adjusted in a statistic form to make a more geographic mode. Thus, the values have been graphical-ly and cartographically represented in Figure 3 and Figure 4, respectively. In this study, data analysis and ex-planation will conducted in the terms of each given element with the emphasis on spatial variation and geo-graphic distribution of air pollution, as follows:
1) Carbon monoxide (CO) is a colorless, odorless, and tasteless gas that is slightly less dense than air. It is toxic to humans when encountered in concentrations above about 35 ppm. In the atmosphere, it is spatially va-riable and short lived, having a role in the formation of ground-level ozone [21].
S. I. Al-Hassen et al.
143
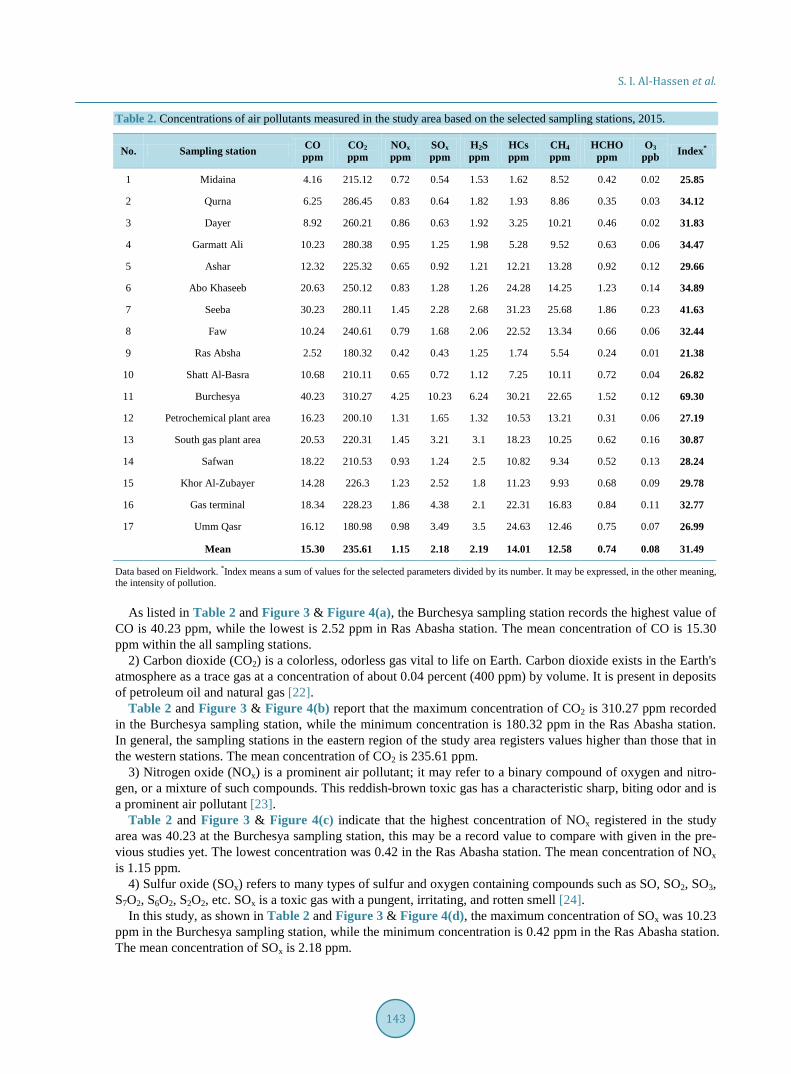
Table 2. Concentrations of air pollutants measured in the study area based on the selected sampling stations, 2015.
Index* O3 ppb
HCHO ppm
CH4 ppm
HCs ppm
H2S ppm
SOx ppm
NOx ppm
CO2 ppm
CO ppm Sampling station No.
25.85 0.02 0.42 8.52 1.62 1.53 0.54 0.72 215.12 4.16 Midaina 1
34.12 0.03 0.35 8.86 1.93 1.82 0.64 0.83 286.45 6.25 Qurna 2
31.83 0.02 0.46 10.21 3.25 1.92 0.63 0.86 260.21 8.92 Dayer 3
34.47 0.06 0.63 9.52 5.28 1.98 1.25 0.95 280.38 10.23 Garmatt Ali 4
29.66 0.12 0.92 13.28 12.21 1.21 0.92 0.65 225.32 12.32 Ashar 5
34.89 0.14 1.23 14.25 24.28 1.26 1.28 0.83 250.12 20.63 Abo Khaseeb 6
41.63 0.23 1.86 25.68 31.23 2.68 2.28 1.45 280.11 30.23 Seeba 7
32.44 0.06 0.66 13.34 22.52 2.06 1.68 0.79 240.61 10.24 Faw 8
21.38 0.01 0.24 5.54 1.74 1.25 0.43 0.42 180.32 2.52 Ras Absha 9
26.82 0.04 0.72 10.11 7.25 1.12 0.72 0.65 210.11 10.68 Shatt Al-Basra 10
69.30 0.12 1.52 22.65 30.21 6.24 10.23 4.25 310.27 40.23 Burchesya 11
27.19 0.06 0.31 13.21 10.53 1.32 1.65 1.31 200.10 16.23 Petrochemical plant area 12
30.87 0.16 0.62 10.25 18.23 3.1 3.21 1.45 220.31 20.53 South gas plant area 13
28.24 0.13 0.52 9.34 10.82 2.5 1.24 0.93 210.53 18.22 Safwan 14
29.78 0.09 0.68 9.93 11.23 1.8 2.52 1.23 226.3 14.28 Khor Al-Zubayer 15
32.77 0.11 0.84 16.83 22.31 2.1 4.38 1.86 228.23 18.34 Gas terminal 16
26.99 0.07 0.75 12.46 24.63 3.5 3.49 0.98 180.98 16.12 Umm Qasr 17
31.49 0.08 0.74 12.58 14.01 2.19 2.18 1.15 235.61 15.30 Mean
Data based on Fieldwork. *Index means a sum of values for the selected parameters divided by its number. It may be expressed, in the other meaning, the intensity of pollution.
As listed in Table 2 and Figure 3 & Figure 4(a), the Burchesya sampling station records the highest value of
CO is 40.23 ppm, while the lowest is 2.52 ppm in Ras Abasha station. The mean concentration of CO is 15.30 ppm within the all sampling stations.
2) Carbon dioxide (CO2) is a colorless, odorless gas vital to life on Earth. Carbon dioxide exists in the Earth's atmosphere as a trace gas at a concentration of about 0.04 percent (400 ppm) by volume. It is present in deposits of petroleum oil and natural gas [22].
Table 2 and Figure 3 & Figure 4(b) report that the maximum concentration of CO2 is 310.27 ppm recorded in the Burchesya sampling station, while the minimum concentration is 180.32 ppm in the Ras Abasha station. In general, the sampling stations in the eastern region of the study area registers values higher than those that in the western stations. The mean concentration of CO2 is 235.61 ppm.
3) Nitrogen oxide (NOx) is a prominent air pollutant; it may refer to a binary compound of oxygen and nitro-gen, or a mixture of such compounds. This reddish-brown toxic gas has a characteristic sharp, biting odor and is a prominent air pollutant [23].
Table 2 and Figure 3 & Figure 4(c) indicate that the highest concentration of NOx registered in the study area was 40.23 at the Burchesya sampling station, this may be a record value to compare with given in the pre-vious studies yet. The lowest concentration was 0.42 in the Ras Abasha station. The mean concentration of NOx is 1.15 ppm.
4) Sulfur oxide (SOx) refers to many types of sulfur and oxygen containing compounds such as SO, SO2, SO3, S7O2, S6O2, S2O2, etc. SOx is a toxic gas with a pungent, irritating, and rotten smell [24].
In this study, as shown in Table 2 and Figure 3 & Figure 4(d), the maximum concentration of SOx was 10.23 ppm in the Burchesya sampling station, while the minimum concentration is 0.42 ppm in the Ras Abasha station. The mean concentration of SOx is 2.18 ppm.

S. I. Al-Hassen et al.
144
(a) (b)
(c) (d)
(e) (f)
(g) (h)
(i)
Figure 3. Graphic representation of the concentrations of air pollutants measured in the study area. Data based on Table 2.

S. I. Al-Hassen et al.
145
(a) (b) (c)
(d) (e) (f)
(g) (h) (i)
Figure 4. Cartographic representation of the concentrations of air pollutants measured in the study area. Data based on Table 1.
5) Hydrogen sulfide is the chemical compound with the formula (H2S). It is a colorless gas with the characte-ristic foul odor of rotten eggs; it is heavier than air, very poisonous, corrosive, flammable, and explosive [25].
Table 2 and Figure 3 & Figure 4(e) refer to the highest value of H2S recorded in this study was 6.24 ppm in the Burchesya sampling station, while the lowest value was 1.21 ppm in the Ashar station. The mean concentra-tion is 2.19 ppm.
S. I. Al-Hassen et al.
146
6) Hydrocarbon (HCs) is an organic compound consisting entirely of hydrogen and carbon. Hydrocarbon poisoning such as that of benzene and petroleum usually occurs accidentally by inhalation or ingestion of these cytotoxic chemical compounds [22].
HCs gas concentrations in the study area were high, in general. The maximum concentration is 31.23 ppm registered at the Seeba sampling station, whereas the minimum concentration is 1.62 in the Midaina station. The mean concentration of HCs is 14.01 ppm, as shown in Table 2 and Figure 3 & Figure 4(f).
7) Methane is a chemical compound with the chemical formula (CH4). It is the simplest alkane and the main component of natural gas. Methane is not toxic, yet it is extremely flammable and may form explosive mixtures with air [26].
The highest values of CH4, as indicated in Table 2 and Figure 3 & Figure 4(g), were concentered in places with the petroleum industry and exploitation within the study area. The maximum concentration, however, is 25.68 ppm in the Seeba station, while the minimum concentration is 5.54 ppm in the Ras Abasha station. The mean concentration of CH4 is 12.58 ppm.
8) Formaldehyde (HCHO) is a colorless, highly toxic, and flammable gas at room temperature that is slightly heavier than air. It has a pungent, highly irritating odor that is detectable at low concentrations, but may not pro-vide adequate warning of hazardous concentrations for sensitized persons [27].
Table 2 and Figure 3 & Figure 4(h) show that the concentration of HCHO records the maximum value is 1.86 ppm in the Seeba station, while the minimum value is 0.24 ppm recorded in the Ras Abasha station. The mean concentration of HCHO is 0.74 ppm.
9) Ozone is an inorganic molecule with the chemical formula (O3). It is a pale blue gas with a distinctively pungent smell. This same high oxidizing potential, however, causes ozone to damage mucous and respiratory tissues in animals, and also tissues in plants, above concentrations of about 100 ppb. This makes ozone a potent respiratory hazard and pollutant near ground level [28].
In the study area, as shown in Table 2 and Figure 3 & Figure 4(i), the concentrations of ground level ozone (O3) were largely varied within the selected sampling stations. The highest value is 0.23 ppb in the Seeba station, whereas the Ras Abasha station register the lowest value is 0.01 ppb. Thus, the mean concentration of O3 is 0.08 ppb.
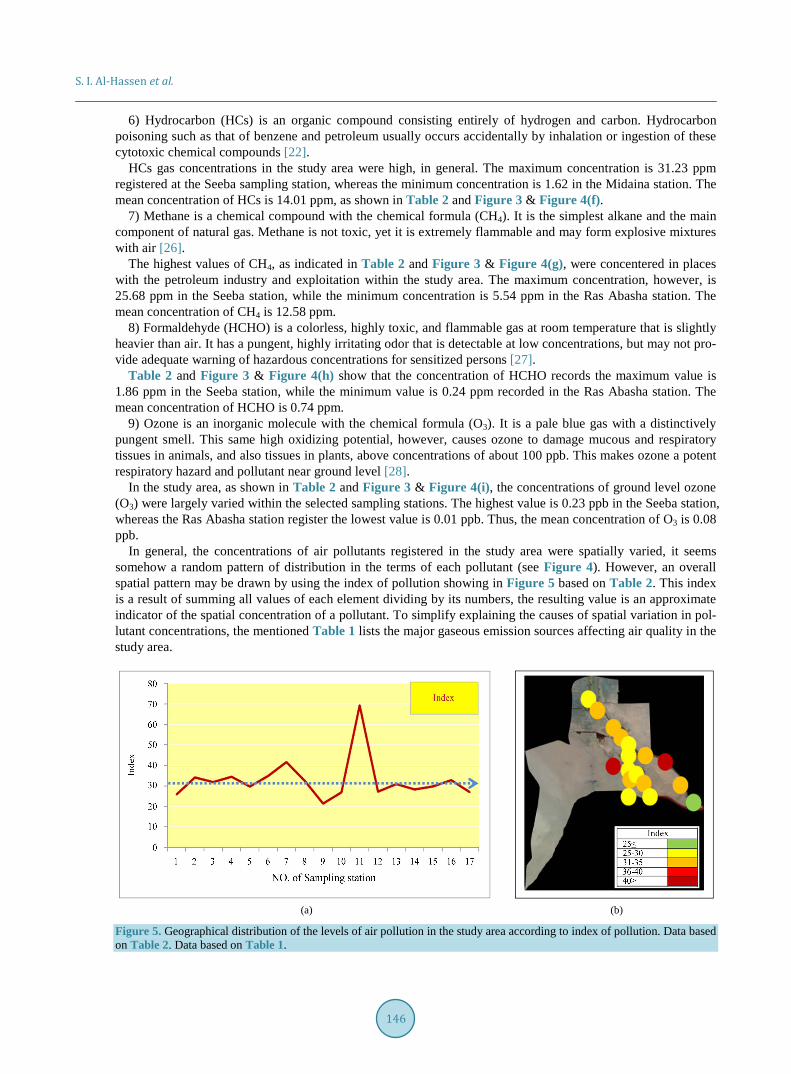
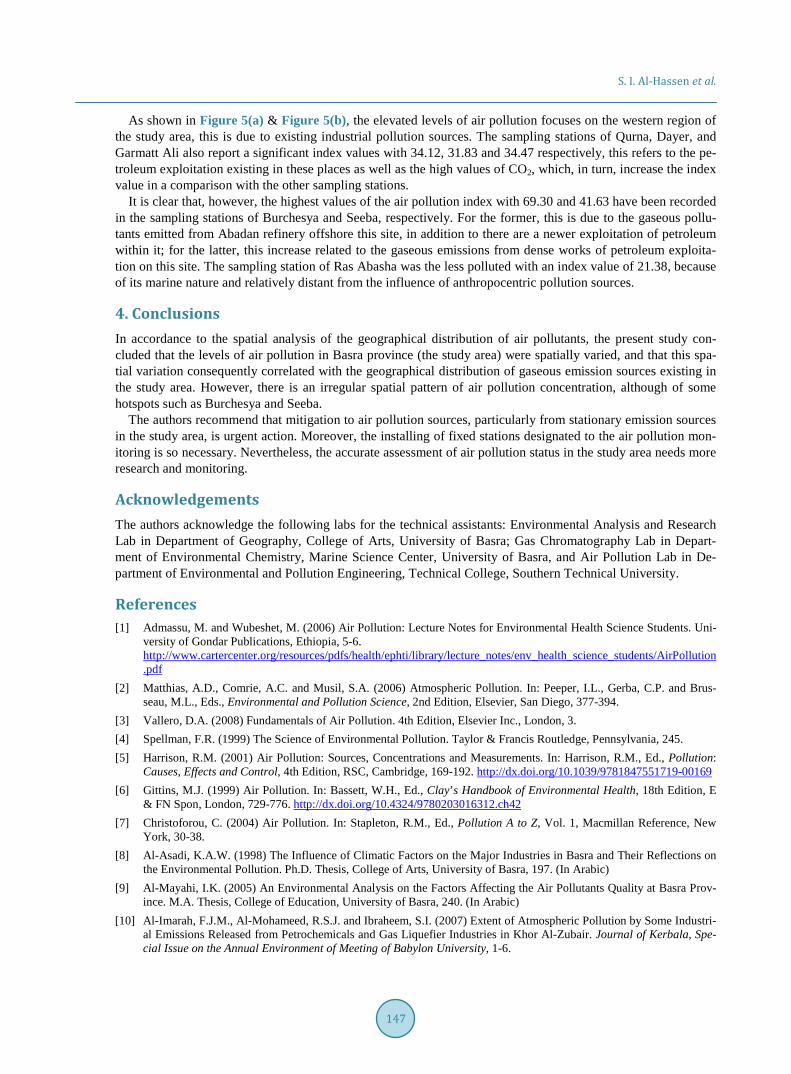
In general, the concentrations of air pollutants registered in the study area were spatially varied, it seems somehow a random pattern of distribution in the terms of each pollutant (see Figure 4). However, an overall spatial pattern may be drawn by using the index of pollution showing in Figure 5 based on Table 2. This index is a result of summing all values of each element dividing by its numbers, the resulting value is an approximate indicator of the spatial concentration of a pollutant. To simplify explaining the causes of spatial variation in pol-lutant concentrations, the mentioned Table 1 lists the major gaseous emission sources affecting air quality in the study area.
(a) (b)
Figure 5. Geographical distribution of the levels of air pollution in the study area according to index of pollution. Data based on Table 2. Data based on Table 1.
S. I. Al-Hassen et al.
147
As shown in Figure 5(a) & Figure 5(b), the elevated levels of air pollution focuses on the western region of the study area, this is due to existing industrial pollution sources. The sampling stations of Qurna, Dayer, and Garmatt Ali also report a significant index values with 34.12, 31.83 and 34.47 respectively, this refers to the pe-troleum exploitation existing in these places as well as the high values of CO2, which, in turn, increase the index value in a comparison with the other sampling stations.
It is clear that, however, the highest values of the air pollution index with 69.30 and 41.63 have been recorded in the sampling stations of Burchesya and Seeba, respectively. For the former, this is due to the gaseous pollu-tants emitted from Abadan refinery offshore this site, in addition to there are a newer exploitation of petroleum within it; for the latter, this increase related to the gaseous emissions from dense works of petroleum exploita-tion on this site. The sampling station of Ras Abasha was the less polluted with an index value of 21.38, because of its marine nature and relatively distant from the influence of anthropocentric pollution sources.
4. Conclusions In accordance to the spatial analysis of the geographical distribution of air pollutants, the present study con-cluded that the levels of air pollution in Basra province (the study area) were spatially varied, and that this spa-tial variation consequently correlated with the geographical distribution of gaseous emission sources existing in the study area. However, there is an irregular spatial pattern of air pollution concentration, although of some hotspots such as Burchesya and Seeba.
The authors recommend that mitigation to air pollution sources, particularly from stationary emission sources in the study area, is urgent action. Moreover, the installing of fixed stations designated to the air pollution mon-itoring is so necessary. Nevertheless, the accurate assessment of air pollution status in the study area needs more research and monitoring.
Acknowledgements The authors acknowledge the following labs for the technical assistants: Environmental Analysis and Research Lab in Department of Geography, College of Arts, University of Basra; Gas Chromatography Lab in Depart-ment of Environmental Chemistry, Marine Science Center, University of Basra, and Air Pollution Lab in De-partment of Environmental and Pollution Engineering, Technical College, Southern Technical University.
References [1] Admassu, M. and Wubeshet, M. (2006) Air Pollution: Lecture Notes for Environmental Health Science Students. Uni-
versity of Gondar Publications, Ethiopia, 5-6. http://www.cartercenter.org/resources/pdfs/health/ephti/library/lecture_notes/env_health_science_students/AirPollution.pdf
[2] Matthias, A.D., Comrie, A.C. and Musil, S.A. (2006) Atmospheric Pollution. In: Peeper, I.L., Gerba, C.P. and Brus-seau, M.L., Eds., Environmental and Pollution Science, 2nd Edition, Elsevier, San Diego, 377-394.
[3] Vallero, D.A. (2008) Fundamentals of Air Pollution. 4th Edition, Elsevier Inc., London, 3. [4] Spellman, F.R. (1999) The Science of Environmental Pollution. Taylor & Francis Routledge, Pennsylvania, 245. [5] Harrison, R.M. (2001) Air Pollution: Sources, Concentrations and Measurements. In: Harrison, R.M., Ed., Pollution:
Causes, Effects and Control, 4th Edition, RSC, Cambridge, 169-192. http://dx.doi.org/10.1039/9781847551719-00169 [6] Gittins, M.J. (1999) Air Pollution. In: Bassett, W.H., Ed., Clay’s Handbook of Environmental Health, 18th Edition, E
& FN Spon, London, 729-776. http://dx.doi.org/10.4324/9780203016312.ch42 [7] Christoforou, C. (2004) Air Pollution. In: Stapleton, R.M., Ed., Pollution A to Z, Vol. 1, Macmillan Reference, New
York, 30-38. [8] Al-Asadi, K.A.W. (1998) The Influence of Climatic Factors on the Major Industries in Basra and Their Reflections on
the Environmental Pollution. Ph.D. Thesis, College of Arts, University of Basra, 197. (In Arabic) [9] Al-Mayahi, I.K. (2005) An Environmental Analysis on the Factors Affecting the Air Pollutants Quality at Basra Prov-
ince. M.A. Thesis, College of Education, University of Basra, 240. (In Arabic) [10] Al-Imarah, F.J.M., Al-Mohameed, R.S.J. and Ibraheem, S.I. (2007) Extent of Atmospheric Pollution by Some Industri-
al Emissions Released from Petrochemicals and Gas Liquefier Industries in Khor Al-Zubair. Journal of Kerbala, Spe-cial Issue on the Annual Environment of Meeting of Babylon University, 1-6.

S. I. Al-Hassen et al.
148
[11] Al-Saad, H.T., Al-Imarah, F.J.M., Hassan, W.F., Jasim, A.H. and Hassan, I.F. (2010) Determination of Some Trace Elements in the Fallen Dust on Basra Governorate. Basrah Journal of Science, 28, 243-252. http://www.iasj.net/iasj?func=fulltext&aId=55085
[12] Garabedian, S.A.K. (2010) Study of the Main Pollutants of Air Caused by Transportation in Basra. Proceedings of the Scientific Conference of Marine Science Center and the National Specialized Workshop on Oceanography, 23-24 De-cember 2008, 125-136. (In Arabic)
[13] Al-Hassen, Sh.I. (2011) Environmental Pollution in Basra City. PhD Thesis, College of Arts, University of Basra, Ba-sra, 232. (In Arabic)
[14] Qassim, M.H. (2011) A Geographic Analysis for Air Pollution Problem in Al-Zubayr City and Its Healthy Effects. M.A. Thesis, College of Arts, University of Basra, Basra, 180. (In Arabic)
[15] Douabul, A.A.Z., Al-Maarofi, S.S., Al-Saad, H.T. and Al-Hassen, Sh.I. (2013) Gaseous Pollutants in Basra City, Iraq. Air, Soil and Water Research, 6, 15-21. http://dx.doi.org/10.4137/ASWR.S10835
[16] Sultan, A.W.A., Al-Hassen, Sh.I., Ateeq, A.A. and Al-Saad, H.T. (2013) Ambient Air Quality in the Industrial Area of Khor Al-Zubayr, Southern Iraq. Journal of Petroleum Research & Studies, 4, 1-11. http://www.iasj.net/iasj?func=fulltext&aId=87876
[17] Karmalla, H.A., Al-Hassen, Sh.I., Adam, R.S. and Qassim, M.H. (2013) A Cartographic Representation to Levels and Impacts of Carbon Monoxide Pollutant in Basra City, Southern Iraq. Journal of Thi-Qar Science, 4, 105-115. (In Arabic) http://www.iasj.net/iasj?func=fulltext&aId=83346
[18] Abdullah, A.S. and Hussien, H.H. (2014) Estimation of Gaseous Pollutants emitted from Al-Najybia Power Station in Basra. Journal of Thi-Qar Science, 4, 68-71. http://www.iasj.net/iasj?func=fulltext&aId=92673
[19] Al-Hassen, Sh.I., Al-Qarroni, E.H., Qassim, M.H., Al-Saad, H.T. and Alhello, A.A. (2015) An Experimental Study on the Determination of Air Pollutant Concentrations released from Selected Outdoor Gaseous Emission Sources in Basra City (Southern Iraq). JIARM, 3, 88-98. http://www.jiarm.com/FEB2015/paper19552.pdf
[20] Wikipedia-Basra. https://en.wikipedia.org/wiki/Basra [21] ATSDR (Agency for Toxic Substances and Disease Registry), Toxic Substances Portal-Carbon Monoxide.
http://www.atsdr.cdc.gov/toxfaqs/TF.asp?id=1163&tid=253 [22] WHO (World Health Organization) (2010) WHO Guidelines for Indoor Air Quality: Selected Pollutants. WHO Re-
gional Office for Europe, Bonn, 454. http://www.euro.who.int/__data/assets/pdf_file/0009/128169/e94535.pdf [23] ATSDR (Agency for Toxic Substances and Disease Registry), Toxic Substances Portal-Nitrogen Oxide.
http://www.atsdr.cdc.gov/toxfaqs/TF.asp?id=396&tid=69 [24] ATSDR (Agency for Toxic Substances and Disease Registry), Toxic Substances Portal-Sulfate Oxide.
http://www.atsdr.cdc.gov/toxfaqs/TF.asp?id=252&tid=46 [25] ATSDR (Agency for Toxic Substances and Disease Registry), Toxic Substances Portal-Hydrogen Sulfide.
http://www.atsdr.cdc.gov/substances/toxsubstance.asp?toxid=67 [26] ATSDR (Agency for Toxic Substances and Disease Registry), Toxic Substances Portal-Methane.
http://www.atsdr.cdc.gov/HAC/landfill/html/ch4.html [27] ATSDR (Agency for Toxic Substances and Disease Registry), Toxic Substances Portal-Formaldehyde.
http://www.atsdr.cdc.gov/mmg/mmg.asp?id=216&tid=39 [28] WHO (World Health Organization) (2005) WHO Air Quality Guidelines for Particulate Matter, Ozone, Nitrogen Dio-
xide and Sulfur Dioxide: Global Update. Geneva, 20. http://whqlibdoc.who.int/hq/2006/who_sde_phe_oeh_06.02_eng.pdf