
Spatial analysis of the electrical energy demand in … · System and spatial statistical methods....
26
Spatial analysis of the electrical energy demand in Greece Hristos Tyralis [1] , Nikos Mamassis [2] and Yorgos N. Photis [3] [1] Department of Water Resources and Environmental Engineering, School of Civil Engineering, National Technical University of Athens, Iroon Polytechniou 5, 157 80 Zografou, Greece, ([email protected]) [2] Department of Water Resources and Environmental Engineering, School of Civil Engineering, National Technical University of Athens, Iroon Polytechniou 5, 157 80 Zografou, Greece ([email protected]) [3] Department of Geography and Regional Planning, School of Rural and Surveying Engineering, National Technical University of Athens, Iroon Polytechniou 9, 157 72 Zografou, Greece ([email protected]) Abstract: The Electrical Energy Demand (EED) of the agricultural, commercial and industrial sector in Greece, as well as its use for domestic activities, public and municipal authorities and street lighting are analysed spatially using Geographical Information System and spatial statistical methods. The analysis is performed on data which span from 2008 to 2012 and have annual temporal resolution and spatial resolution down to the NUTS (Nomenclature of Territorial Units for Statistics) level 3. The aim is to identify spatial patterns of the EED and its transformations such as the ratios of the EED to socioeconomic variables, i.e. the population, the total area, the population density and the Gross Domestic Product (GDP). Based on the analysis, Greece is divided in five regions, each one with a different development model, i.e. Attica and Thessaloniki which are two heavily populated major poles, Thessaly and Central Greece which form a connected geographical region with important agricultural and industrial sector, the islands and some coastal areas which are characterized by an important commercial sector and the rest Greek areas. The spatial patterns can provide additional information for policy decision about the electrical energy management and better representation of the regional socioeconomic conditions. Keywords: cluster and outlier analysis; electrical energy demand; Gross Domestic Product; Grouping analysis; Hot Spot analysis; spatial analysis
Transcript of Spatial analysis of the electrical energy demand in … · System and spatial statistical methods....
SpatialanalysisoftheelectricalenergydemandinGreece
Hristos Tyralis[1], Nikos Mamassis[2] and Yorgos N. Photis[3]
[1] Department of Water Resources and Environmental Engineering, School of Civil
Engineering, National Technical University of Athens, Iroon Polytechniou 5, 157 80
Zografou, Greece, ([email protected])
[2] Department of Water Resources and Environmental Engineering, School of Civil
Engineering, National Technical University of Athens, Iroon Polytechniou 5, 157 80
Zografou, Greece ([email protected])
[3] Department of Geography and Regional Planning, School of Rural and Surveying
Engineering, National Technical University of Athens, Iroon Polytechniou 9, 157 72
Zografou, Greece ([email protected])
Abstract: The Electrical Energy Demand (EED) of the agricultural, commercial and
industrial sector in Greece, as well as its use for domestic activities, public and municipal
authorities and street lighting are analysed spatially using Geographical Information
System and spatial statistical methods. The analysis is performed on data which span from
2008 to 2012 and have annual temporal resolution and spatial resolution down to the
NUTS (Nomenclature of Territorial Units for Statistics) level 3. The aim is to identify
spatial patterns of the EED and its transformations such as the ratios of the EED to
socioeconomic variables, i.e. the population, the total area, the population density and the
Gross Domestic Product (GDP). Based on the analysis, Greece is divided in five regions,
each one with a different development model, i.e. Attica and Thessaloniki which are two
heavily populated major poles, Thessaly and Central Greece which form a connected
geographical region with important agricultural and industrial sector, the islands and
some coastal areas which are characterized by an important commercial sector and the
rest Greek areas. The spatial patterns can provide additional information for policy
decision about the electrical energy management and better representation of the
regional socioeconomic conditions.
Keywords: cluster and outlier analysis; electrical energy demand; Gross Domestic
Product; Grouping analysis; Hot Spot analysis; spatial analysis
2
1. Introduction
A preliminary spatial analysis of the Electrical Energy Demand (EED) in Greece is
presented in Tyralis et al. (2016). In this study the reader can find references concerning
case studies in Greece in which spatial analysis of energy demand was applied. Recently
Tyralis et al. (2017) analysed the EED in Greece in the time domain. A list of the most
recent papers concerning the analysis of the EED in the time domain in Greece and a
presentation of the Greek Interconnected Electric System (GIES) can also be found in
Tyralis et al. (2017).
Many studies can be found in the scientific literature concerning the spatial analysis of
energy demand mainly in China. These studies treat a variety of subjects while their
primary theme is the investigation of the relationship between the energy demand and
socioeconomic variables. E.g. Ito et al. (2010) estimated an upper limit of the energy
demand, after analysing spatially the economic conditions, the industrial infrastructures
and energy demand data. Liu et al. (2014) applied spatial clustering methods to industry
energy efficiency data. Ma and Oxley (2012) analysed the behaviour of energy sectors and
identified energy market spatial convergence clusters using price data. Sheng et al. (2014)
examined the relationship between economic growth, regional disparities and energy
demand - production. Wang et al. (2012) evaluated the efficient use of energy in the
industrial sector. Zhang and Lahr (2014) revealed the regional disparities of energy
consumption and correlated them to economic variables. Zhang et al. (2013) modelled the
interprovincial flow of energy. Zhang et al. (2009a, b) examined the spatial characteristics
of energy consumption patterns in rural China and Zhang et al. (2011) repeated a similar
study in the provincial capital cities.
Spatial statistical methods have been applied to energy data from the rest of the world
however, to a lesser extent. To list a few studies, Ihara et al. (2008) and Schiesser and
Bader (2005) investigated issues of energy demand in urban scale, while Arimah (1993),
Kaijuka (2007), Khan and Ahmad (2008), Lee and Chang (2008) and Taylor et al. (2014)
examined energy issues in country scale. Another interesting application concerning the
spatial load forecasting was presented by Melo et al. (2015), while Yaylaci et al. (2011)
used spatial statistical methods to investigate the spatial distribution of electrical energy
generation and consumption in Turkey.
3
The aforementioned studies are based on statistical data for administrative units larger
or equal to the county level. Lights time-series data obtained from satellites have higher
spatial resolution therefore they offer accurate spatiotemporal information and a better
understanding of the spatial distribution of the EED. In this context He et al. (2012)
modelled the spatiotemporal dynamics of electrical energy consumption in China, while
Shi et al. (2014) contributed, not only by estimating the electrical energy consumption,
but also by using light data to estimate the Gross Domestic Product (GDP) in China. Yi et
al. (2014) added another application of light data, i.e. the estimation of the urbanization
process in Northeast China.
The paper of Francisco et al. (2007) who indicated that the electricity consumption
could be an efficient predictor of income is of particular interest for the present study.
Furthermore, Francisco et al. (2007) proposed the creation of a set of regional indicators
of electricity consumption which would help in the examination of public and urban
affairs.
As mentioned in most of the previous studies the spatial analysis of energy
consumption, energy generation etc. provides information which can support the
management of energy systems and the policy-making for their development.
Furthermore, following the examples of Francisco et al. (2007) and Shi et al. (2014), it
seems that the spatial analysis of the EED can provide additional indicators of the
economic condition of a region, particularly when it is coupled with socioeconomic
indicators.
The spatial analysis of the economic conditions in Greece using socioeconomic
indicators is frequently met in the scientific literature. The examination of convergence
and regional disparities is the main subject of economics studies which analyse spatially
the economic conditions, e.g. see the recent papers from Benos and Karagiannis (2008),
Caraveli and Tsionas (2012), Goletsis and Chletsos (2011), Ikonomou (2011), Liargovas
and Fotopoulos (2009), Liontakis et al. (2010), Monastiriotis (2014), Petrakos and
Saratsis (2000) and Tsionas et al. (2014). Other frequently met subjects are the allocation
of capital and the investments, (e.g. see Benos et al., 2011; Lambrinidis et al., 2005;
Liargovas and Daskalopoulou, 2011; Lolos, 2009; Monastiriotis and Psycharis, 2014;
Psycharis, 2008; Rodríguez-Pose et al., 2015), the economic crisis, (e.g. see Cuadrado-
Roura et al., 2016; Karoulia and Gaki, 2013; Monastiriotis, 2011; Monastiriotis and
Martelli, 2013; Petrakos and Psycharis, 2016; Psycharis, et al., 2014), the sectoral
4
economy, (e.g. see Christofakis and Gkouzos, 2013; Vogiatzoglou and Tsekeris, 2013) and
miscellaneous topics (e.g. see Artelaris and Kandylis, 2014; Christofakis and
Papadaskalopoulos, 2011; Hlepas and Getimis, 2011; Monastiriotis, 2009). In the
aforementioned studies, statistical methods are applied to socioeconomic variables, while
in some of them, the authors visualize the data spatially.
In the present study the EED of six sectors in Greece is analysed spatially: agricultural,
commercial, industrial, domestic, public and municipal authorities and street lighting.
Quite different inference could be made if the EED volume is analysed e.g. compared with
the EED per capita for a given region. Consequently, ratios of specific electrical energy
uses to the total EED and ratios of the EED to variables such as population, total area,
population density and the Gross Domestic Product (GDP) are also examined. The analysis
is performed on data from the years 2008-2012 and have annual temporal resolution and
spatial resolution down to the NUTS (Nomenclature of Territorial Units for Statistics)
level 3 of EUROSTAT. Some of the aforementioned variables were visualized in Tyralis et
al. (2016), a spatial cluster and outlier analysis was performed and the results of the
analysis were also visualized. The present study expands the Tyralis et al. (2016) paper
by performing a hot spot analysis using the Getis-Ord Gi* statistic and a grouping analysis
based on distances between the examined regions and the observed variables. Five years
of data are examined, however only those from 2012 are presented here. Furthermore,
the data and the code for cleaning the raw data and reproducing the visualizations of the
present study as well as of the Tyralis et al. (2016) paper, additional analysis and Figures
for the year 2012 associated with the Tyralis et al. (2016) and the present study, and a
similar analysis on data which span from 2008 to 2011 but not included here for brevity,
are available as supporting material (see Appendix A).
Greece is characterized by a diverse geographic and socioeconomic environment. The
electrical energy consumption has already been used as a socioeconomic indicator in
some studies. Furthermore, little research has been done in analysing the EED in Greece
spatially. Hence, the aim of the paper is to define the spatial patterns of the EED variables
and their transformations, in Greece using spatial statistical analysis methods in a GIS
environment. The analysis can provide a better understanding of the regional
development model of Greece and additional information for policy decision about the
organization and management of the Greek Electric System.
5
2. Dataandmethods
The data and the methods which were used in Section 3 to perform the analysis are
presented in Section 2. The socioeconomic condition in Greece, as it is reflected in the
existing socioeconomic literature is also presented.
2.1 Data
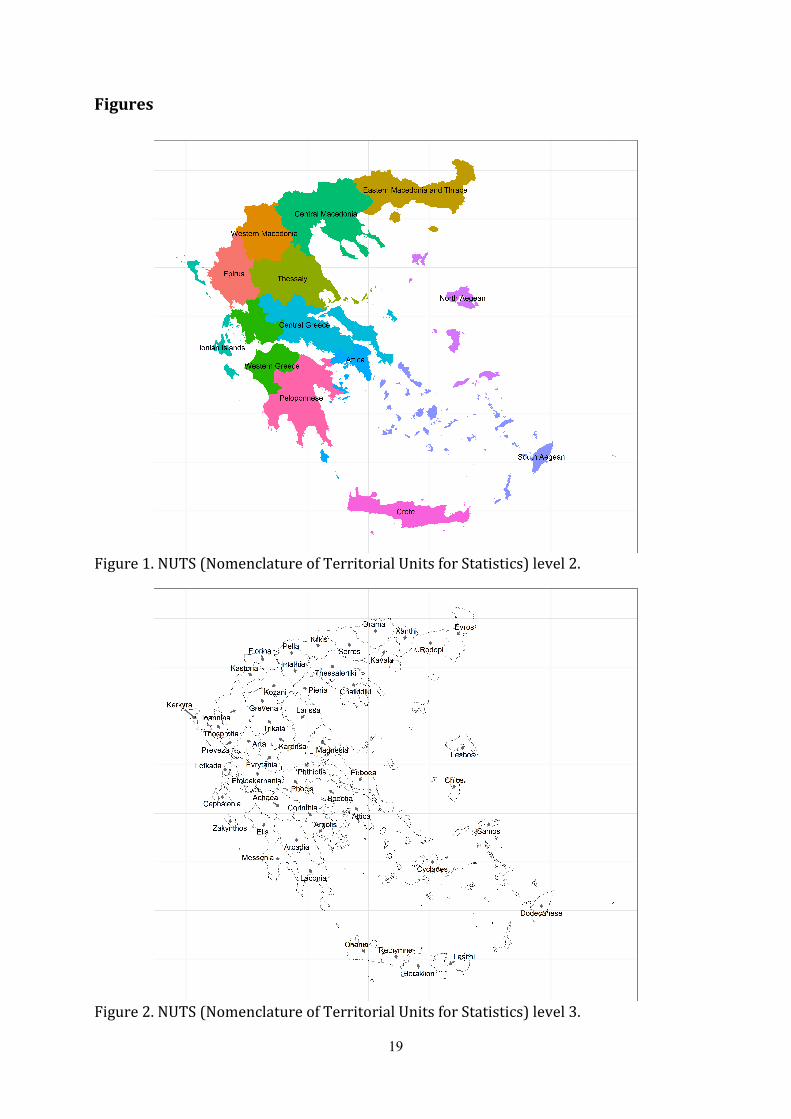
Greece covers an area of 132 000 km2 and has a population of approximately
11 million people. It is divided into 13 administrative regions, which correspond to the
NUTS level 2 as illustrated in Figure 1, and into 51 prefectures, which correspond to the
NUTS level 3 as illustrated in Figure 2. NUTS levels are European standards for the
referencing of administrative divisions for statistical purposes. The mean prefecture area
is approximately equal to 2 600 km2, ranging from approximately 350 km2 to 5 500 km2.
The mean prefecture population is approximately equal to 210 000 (2011 census) and
has a high coefficient of variation approximately equal to 2.6. The capital region of Attica
accommodates approximately 35% of the total population, while the second biggest
region of Thessaloniki accommodates another 10% of the total population (Psycharis,
2008; Artelaris and Kandylis, 2014).
The raw data that were used in the analysis are presented in Table 1. The electricity
data comprise the EED of three sectors (i.e. agricultural, industrial and commercial
sector), as well as the EED used for domestic activities, public and municipal authorities
and street lighting and the total EED. Three more socioeconomic variables, also presented
in Table 1, were taken into account. From hereinafter each data case will be called
variable. In total 9 variables were examined and they are presented in Table 1. The
variables have annual temporal resolution and cover the time period 2008-2012. They
also have spatial resolution down to the level of prefecture.
Moreover, several transformations of the variables of Table 1 which resulted from
operations performed on them were examined. The transformed variables are presented
in Table 2. In particular, they are scaled over the population, the area, the GDP etc. In total
45 variables were examined and visualized, i.e. the sum of the examined cases in Table 1
and Table 2 (cases column). The visualizations can be found in Appendix A. The number
of Figures in Appendix A for all examined variables, for the time period 2008-2012 is 225
(i.e. 45 variables by five years).
6
2.2 Methods
In Tyralis et al. (2016) specific variables for the year 2012 were visualized and a spatial
inference was made after applying to them a cluster and outlier analysis using the Anselin
Local Moran's I statistic. As explained in Tyralis et al. (2016) visualization is not sufficient
for making a complete inference. Thus in this study a hot spot analysis using the Getis-Ord
Gi* statistic and a grouping analysis using spatial statistics are additionally performed.
Moreover, and as a side result the spatial centroid is found. An overview of the methods
that were used is presented in Table 3. The relevant tools of Esri (2015) were used to
apply the methods, while the parameters of the tools were set according to Table 3. Table
3 also contains the documentation of the tools.
Briefly, spatial clusters of similar high or low values or spatial outliers (high/low
outliers surrounded by features with low/high values) can be located using the cluster
and outlier analysis. The possible outcome of this analysis is presented in Table 4 and is
depicted as legend in the Figures. Statistically significant hot spots and cold spots, given a
set of weighted features, can be identified using the hot spot analysis. A region with a high
value is interesting, but may not be a statistically significant hot (or cold) spot. To be a
statistically significant hot (or cold) spot, a region will have a high (or low) value and be
surrounded by other regions with high (or low) values as well. Using the grouping
analysis, regions can be grouped and patterns are revealed based on variable values and
spatial constraints. The outcome of the grouping analysis is a set of groups with high
similarity within-them and high differences between them. The four tools of Table 3 were
applied to all 225 cases and the results are illustrated in 900 Figures of Appendix A.
2.3 Socioeconomic condition in Greece
In Goletsis and Chletsos (2011) and Monastiriotis (2009) a detailed representation of the
regional development model of Greece can be found. To summarize their results, that are
of interest for the present study, it is first noted that Goletsis and Chletsos (2011)
clustered Greece, using multivariate clustering into five groups, i.e. Western Macedonia,
South Aegean islands, Attica, Central Greece and Peloponnese and finally the remaining
regions (see Figure 1). The main feature of Western Macedonia is the high secondary
section and low tourist development. In contrast, the South Aegean islands are
characterized by high tourist development and low primary sector. Attica, is a totally
different case with high GDP per capita and low primary sector. Central Greece and
7
Peloponnese are described by the high secondary and low services sectors. The remaining
regions are characterised by low GDP per capita and an average sectoral structure.
The conclusions of Monastiriotis (2009) are not quite different as he claims that
Greece’s economic geography is heterogeneous, and simultaneously a few and rather
weak high–high clusters appear, which implies a fragmented socio-economic space. This
low number of high-high clusters is also confirmed by Tyralis et al. (2016). When
examining specific economic sectors, Monastiriotis (2009) concludes that the industry is
mainly concentrated in and around Attica, Thessaloniki, Kozani (power generation) and
Eastern Macedonia. Central Greece and southwest Peloponnese specialise in agriculture,
and services are concentrated in the major cities and in the islands.
3. Results
The data, the code and the results of the application of the methods of Section 2.2 to the
data of Section 2.1 are presented in Appendix A. Details concerning the cleaning of the
raw data can also be found in Appendix A. The data cover the time period 2008-2012 and
concern various uses of the EED and socioeconomic variables, therefore the presentation
of all results here would require a huge amount of space. Hence we decided to present
some important results for the year 2012 regarding selected variables. The interested
reader is referred to Appendix A, for additional results of his interest.
The use of EED in the agricultural, commercial and industrial section, its domestic use
and the total EED are examined in Section 3. The aforementioned EED variables coupled
with socioeconomic variables such as the GDP and the population are also examined.
Before analysing the data, all the variables are visualized. For brevity, just a few
visualizations are presented here. Appendix A contains all the visualizations while some
of them have already been presented in Tyralis et al. (2016).
Data visualization helps understanding the data and indicates appropriate methods for
their analysis, however it is not possible to capture all aspects of the problem at hand.
Spatial analysis algorithms must be applied to identify spatial patterns of the variables of
interest. In Sections 3.1-3.5 results from the cluster and outlier analysis, the hot spot
analysis and the grouping analysis are presented. Each Figure of these Sections
simultaneously contains the hot spot analysis for a specific variable and the
corresponding grouping analysis. For brevity, a limited number of Figures with the results

8
of the cluster and outlier analysis are also presented, while the rest of them can be found
in Tyralis et al. (2016) and in Appendix A.
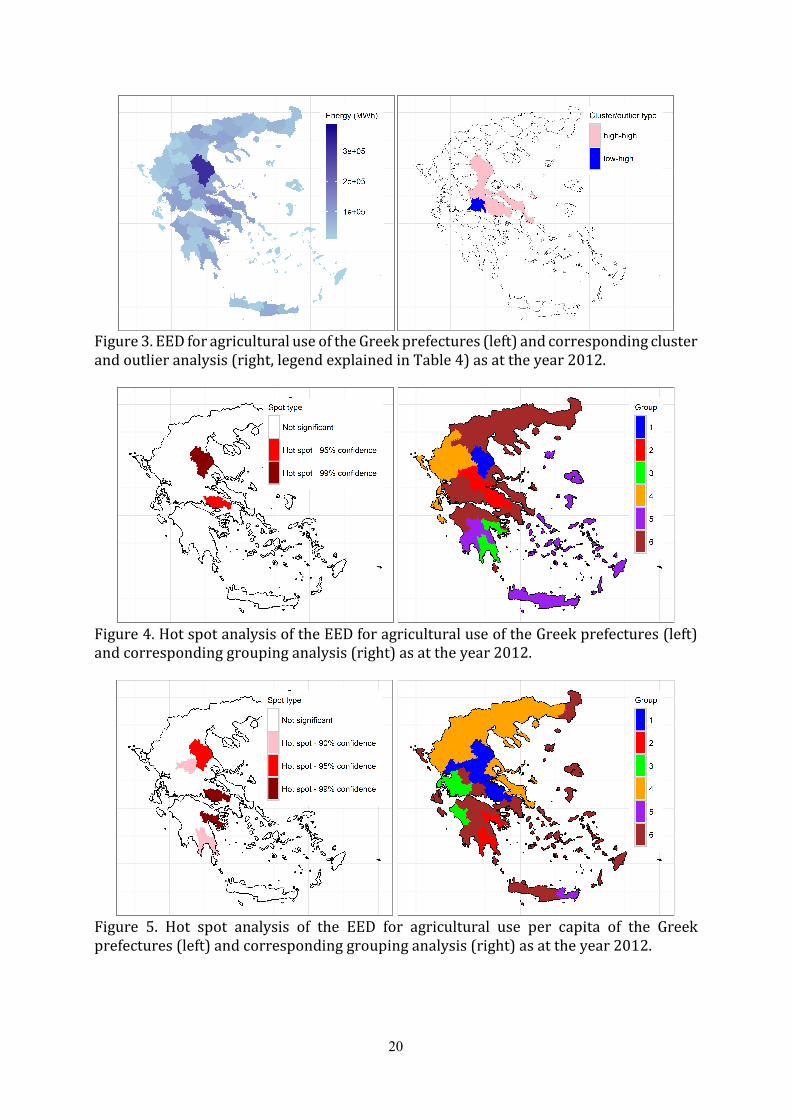
3.1 Agricultural sector
The visualization of the EED in the agricultural sector in Figure 3 indicates that Larissa
and Boeotia are high consumers. A cluster of high values including Larissa, Phthiotis,
Boeotia and Euboea is also observed, while the adjacent Phocis is an outlier of low values.
It is observed in Figure 4 that Larissa and Boeotia are hot spots for EED in the agricultural
sector. It is also observed that Larissa (no. 1) consists a group, while Boeotia belongs to a
group with Phthiotis and Karditsa (no. 2). Another group (no. 3) consists of Argolis and
Laconia in Peloponnese. Groups 4-6 divide Greece almost equally into three regions.
The EED in the agricultural section per capita is of importance, because this scaled
variable can be a reliable indicator of the percentage of people being employed in the
agricultural sector. In Figure 5 three more hot spots compared to Figure 4 are observed,
i.e. Karditsa, Argolis and Laconia. It is also observed in Figure 5 that Larissa and Boeotia
now belong to the same group 1, with Karditsa, Phthiotis and Arta. Group 3 of Figure 4 is
group 2 of Figure 5, while two new distinct groups appear, i.e. 3 and 5.
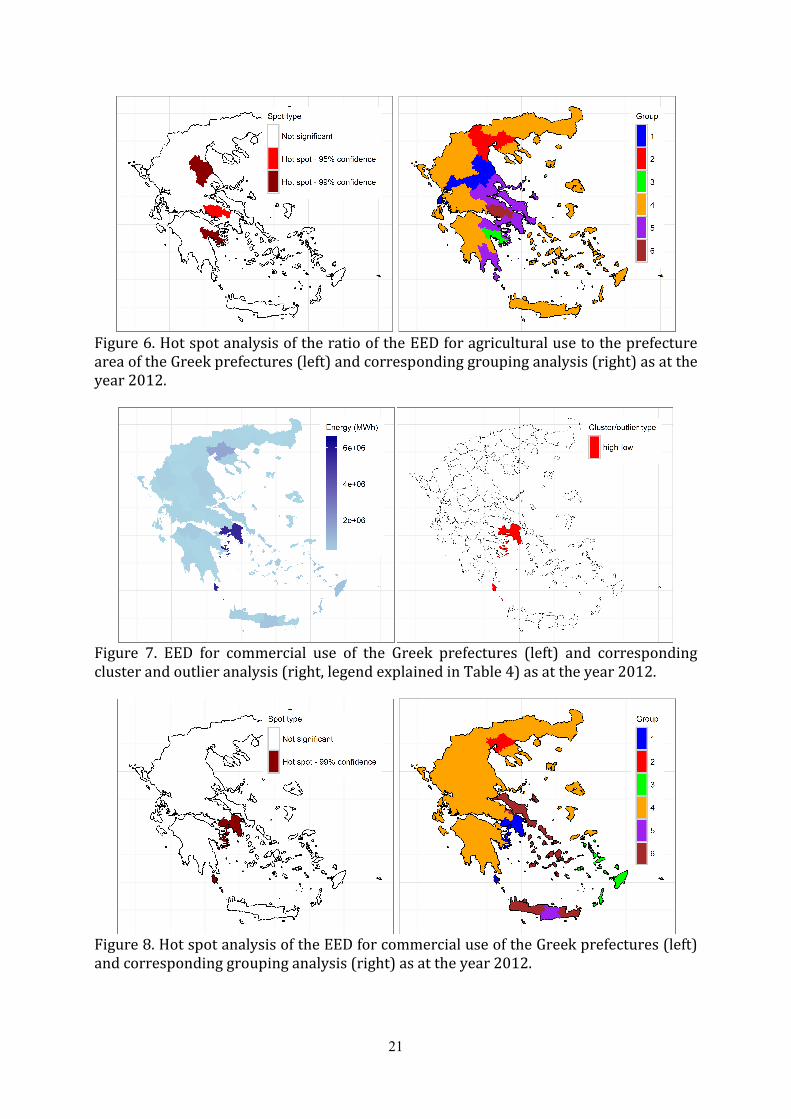
Another useful variable is the ratio of the EED in the agricultural section to the
prefecture area. This variable is presented in Figure 6 and can be an indicator of the
percentage of area of a prefecture which is used in agriculture. Three hot spots are
observed, i.e. Larissa, Boeotia and Argolis. This is a similar pattern to that of Figure 4 and
Figure 5. However, two new groups are observed, i.e. the group 2 in Central Macedonia
and the group 5 which includes prefectures which were hot spots in Figure 4 and Figure
5 (i.e. Phthiotis and Laconia), but not in Figure 6. It is also observed that group 4 extends
to almost all Greece.
3.2 Commercial sector
It seems that a high volume of the activity is concentrated in Attica and Thessaloniki
(Figure 7) regarding the EED in the commercial sector while Attica is also a spatial data
outlier with high value. It is observed in Figure 8 that Attica is a hot spot for the EED in
the commercial sector. Groups 1, 2 (Thessaloniki), 3, 5, 6 form a region with high EED in
the commercial sector (see also Appendix A).
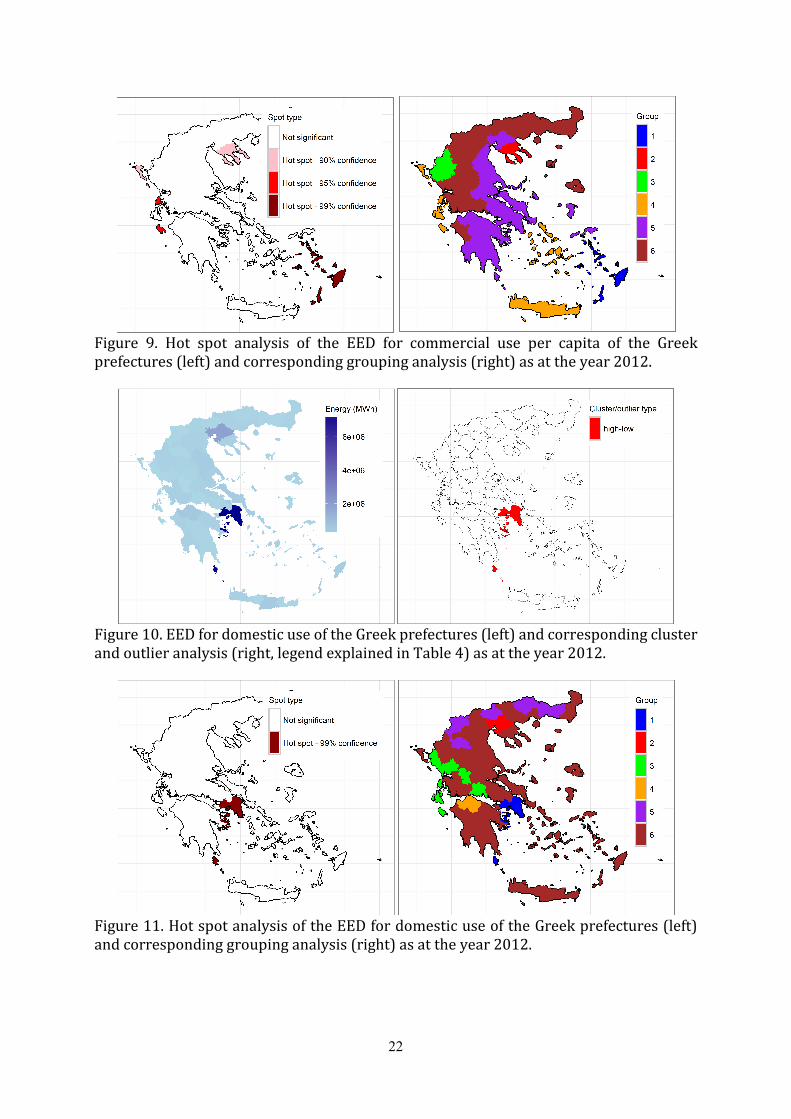
Figure 9 presents the EED in the commercial sector per capita. This variable could be
an indicator of the commercial character of a region. Several hot spots dispersed in Greece

9
are observed, i.e. Chalkidiki, Kerkyra, Lefkada, Zakynthos and Dodecanese. Groups 1 and
2 coincide with their respective hot spots in Figure 9, while group 4 includes the other
dispersed hot spots, as well as the administrative region of Crete and the Cyclades
prefecture. Group 3 is a subset of the administrative region of Epirus, while groups 5 and
6 divide equally the rest of Greece.
3.3 Domestic use
Similarly to Figure 7 and Figure 8, it is observed in Figure 10 and Figure 11 that Attica and
Thessaloniki are high consumers of EED for domestic use while Attica is a hot spot. Attica
in group 1, Thessaloniki in group 2 and Achaea (group 4) are high domestic users of EED
as also shown in Appendix A.
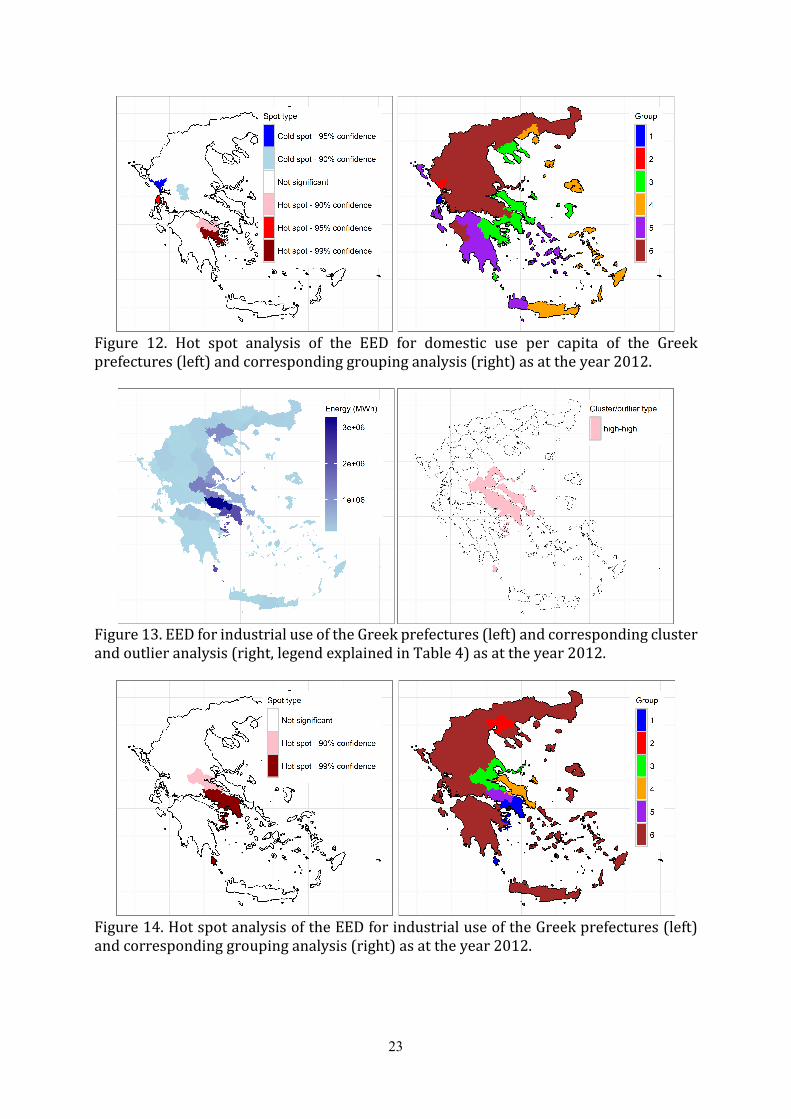
Whereas hot spots were found solely in Sections 3.1 and 3.2, when examining the EED
for domestic use per capita in Figure 12 both hot and cold spots are found. Three hot spots,
i.e. Lefkada, Corinthia and Argolis and two cold spots, i.e. Preveza and Evrytania appear
in Figure 12. Groups 1 and 2 coincide with their respective spots, while the group 3
includes the other two hot spots.
3.4 Industrial sector
The EED in the industrial sector is examined in Section 3.4. Figure 13 indicates that
Magnesia, Phthiotis, Boeotia and Attica form a cluster of high values of the EED in the
industrial sector, while high values are also observed in Thessaloniki. It is observed in
Figure 14 that Phthiotis, Boeotia and Attica are hot spots. The latter prefectures are
simultaneously two groups, while Phthiotis with Magnesia form group 3, Thessaloniki is
group 2 and Euboea is group 4. The rest prefectures belong to group 6. Combined with
the visualization results in Appendix A, it seems that the industrial activity is concentrated
in groups 1-5.
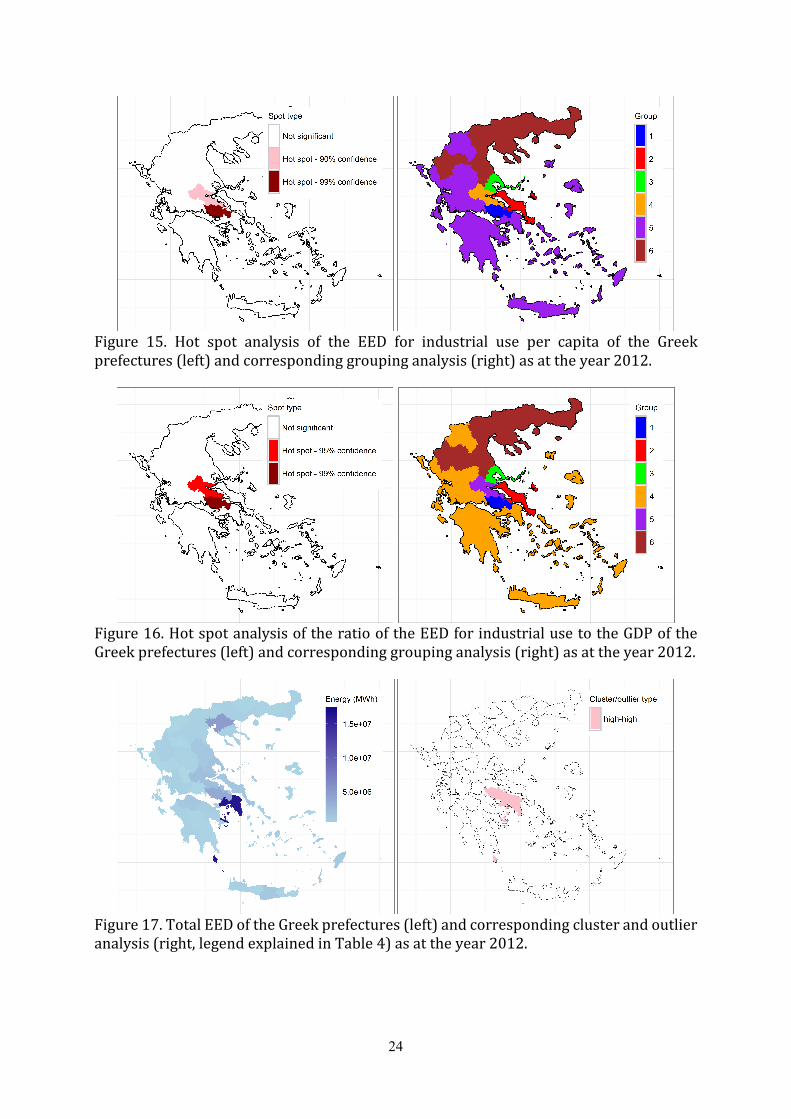
Figure 15 presents the analysis for the EED in the industrial sector per capita. This
variable is an interesting indicator of people being employed in industry. Phthiotis and
Boeotia are hot spots, while it is observed that groups 1-4, each one includes a single
prefecture, while the rest two groups divide Greece almost equally. This result, coupled
with the visualization of the variable in Appendix A indicates that groups 1-4 form a
region with high values of the variable. Figure 16 examines the ratio of the EED for
industrial use to the GDP. The exact same patterns are observed in Figure 15 and Figure
16.
10
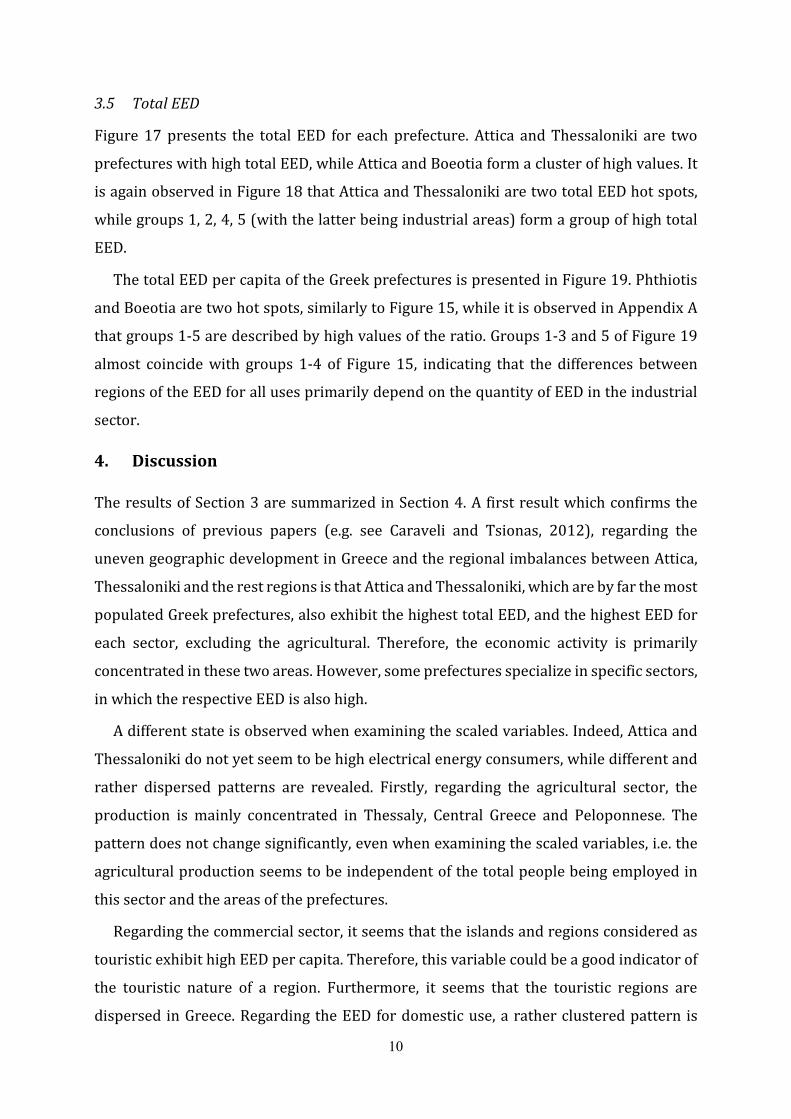
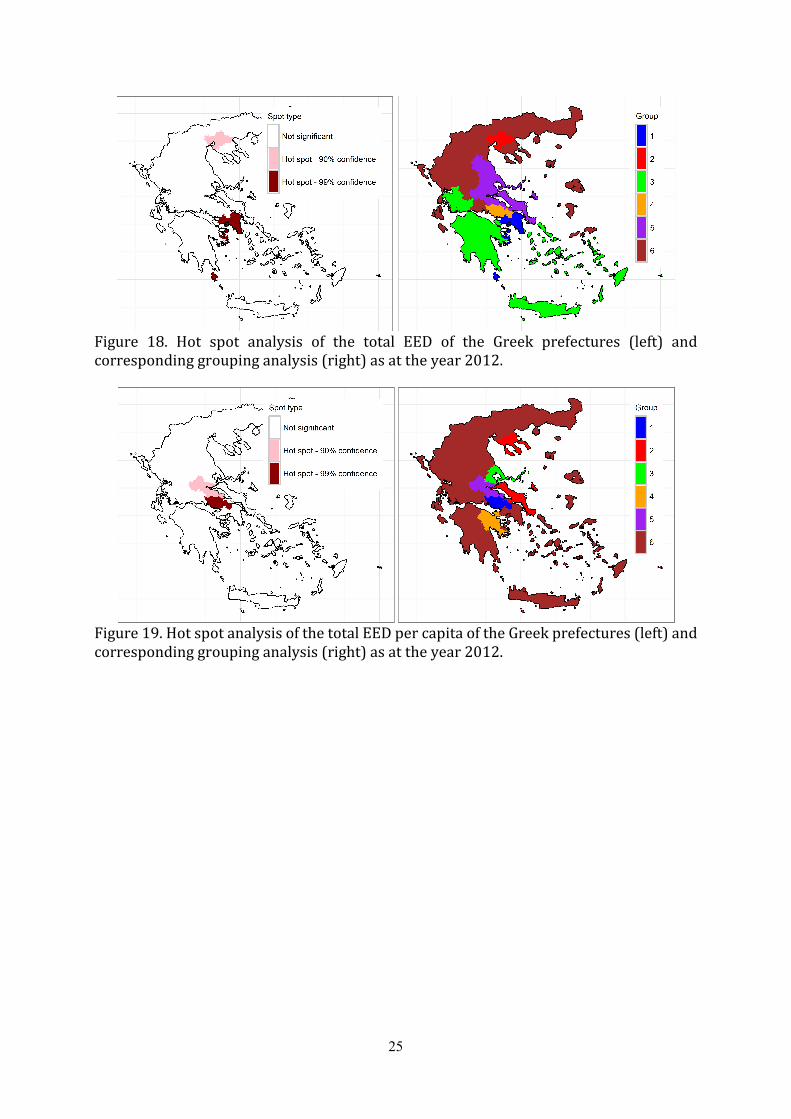
3.5 Total EED
Figure 17 presents the total EED for each prefecture. Attica and Thessaloniki are two
prefectures with high total EED, while Attica and Boeotia form a cluster of high values. It
is again observed in Figure 18 that Attica and Thessaloniki are two total EED hot spots,
while groups 1, 2, 4, 5 (with the latter being industrial areas) form a group of high total
EED.
The total EED per capita of the Greek prefectures is presented in Figure 19. Phthiotis
and Boeotia are two hot spots, similarly to Figure 15, while it is observed in Appendix A
that groups 1-5 are described by high values of the ratio. Groups 1-3 and 5 of Figure 19
almost coincide with groups 1-4 of Figure 15, indicating that the differences between
regions of the EED for all uses primarily depend on the quantity of EED in the industrial
sector.
4. Discussion
The results of Section 3 are summarized in Section 4. A first result which confirms the
conclusions of previous papers (e.g. see Caraveli and Tsionas, 2012), regarding the
uneven geographic development in Greece and the regional imbalances between Attica,
Thessaloniki and the rest regions is that Attica and Thessaloniki, which are by far the most
populated Greek prefectures, also exhibit the highest total EED, and the highest EED for
each sector, excluding the agricultural. Therefore, the economic activity is primarily
concentrated in these two areas. However, some prefectures specialize in specific sectors,
in which the respective EED is also high.
A different state is observed when examining the scaled variables. Indeed, Attica and
Thessaloniki do not yet seem to be high electrical energy consumers, while different and
rather dispersed patterns are revealed. Firstly, regarding the agricultural sector, the
production is mainly concentrated in Thessaly, Central Greece and Peloponnese. The
pattern does not change significantly, even when examining the scaled variables, i.e. the
agricultural production seems to be independent of the total people being employed in
this sector and the areas of the prefectures.
Regarding the commercial sector, it seems that the islands and regions considered as
touristic exhibit high EED per capita. Therefore, this variable could be a good indicator of
the touristic nature of a region. Furthermore, it seems that the touristic regions are
dispersed in Greece. Regarding the EED for domestic use, a rather clustered pattern is

11
observed, while no certain inference could be made by the investigation of this pattern.
The industrial sector is primarily concentrated in Central Greece, confirming the high
level of agglomeration, associated with the location of the industries. High consumers of
electrical energy are the industrial prefectures in Central Greece, which indicates that the
EED in the industrial sector is the main factor affecting the quantity of the EED.
In general, beyond the two major poles, Attica and Thessaloniki, it seems that the
economic activity is concentrated in the adjacent administrative regions of Thessaly and
Central Greece, which are the main consumers of EED in the agricultural and industrial
sector. A few other regions, dispersed in Greece, also exhibit a specialization in agriculture
and industry. On the other hand, the islands and coastal prefectures are commercial
regions.
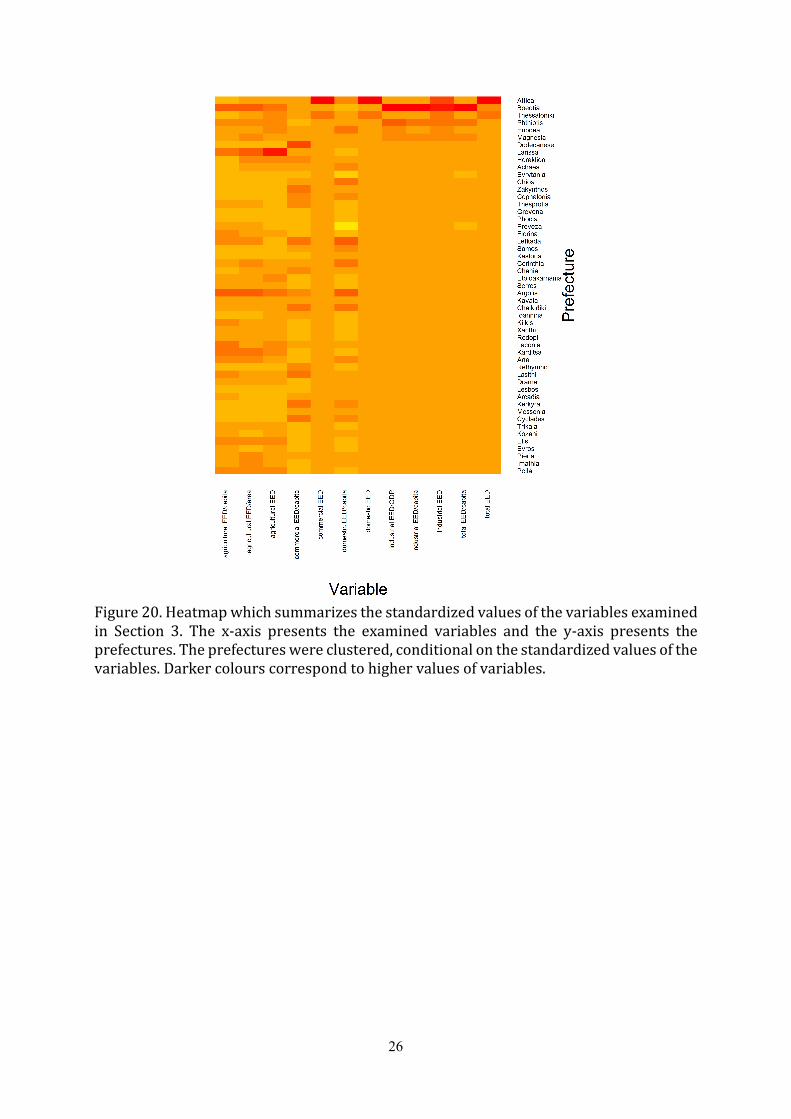
Figure 20 is a heatmap of the standardized values of the variables examined in Section
3. The prefectures in the y-axis where clustered according to the standardized values of
the variables, while variables associated with the EED in the agricultural sector, the
commercial sector, the EED for domestic use, the EED in the industrial sector and the total
EED are presented from left to right. A cluster of high values in the top-right corner of
Figure 20 is again observed when examining the industrial and total EED related
variables. This cluster consists of Attica, Thessaloniki, prefectures in Central Greece and
the adjacent Magnesia (The top six prefectures). Prefectures with high values in several
variables are also Dodecanese (commerce related variables), Larissa and Argolis
(agriculture related variables). A rather dispersed pattern is observed When examining
the agriculture and commerce related variables (in the left of Figure 20).
Therefore, it can be concluded that Greece is divided into 5 regions, according to the
spatial analysis of the EED. Firstly, Attica and Thessaloniki are two distinct major poles.
The third region includes Thessaly and Central Greece, where the agricultural and
industrial production is concentrated. The islands and some coastal regions have a
touristic character. Finally, the rest Greek prefectures are similar in terms of various uses
of the EED, without any specialization.
5. Conclusionsandpolicyimplications
In this study the electrical energy demand of the agricultural, commercial and industrial
sector in Greece, as well as its use for domestic activities, public and municipal authorities
and street lighting was analysed. Ratios of specific electrical energy uses to the total

12
electrical energy demand and ratios of the electrical energy demand to variables such as
population, total area, population density and the Gross Domestic Product were also
examined. The data span from 2008 to 2012 and have annual temporal resolution and
spatial resolution down to the NUTS level 3.
All variables were visualized, a spatial cluster and outlier analysis, a hot spot analysis
and a grouping analysis on all variables were performed and the results of the analysis
were visualized. Five years of data were examined, however only those from 2012 are
presented here, while the full analysis is presented in Appendix A.
Based on the analysis Greece is divided in five regions, each one with a different
development model. Attica and secondary Thessaloniki are two major poles, i.e. two
regions highly populated, thus the absolute volumes of electrical energy demand are
likewise high. Thessaly and Central Greece form a united region with important
agricultural and industrial sector, while the islands and some coastal areas are
characterized by an important commercial sector. The rest Greek areas could form a
region with similar characteristics.
The novelty of the present study is the application of various spatial statistical
methods, to various uses of the electrical energy demand, to infer about the development
model of a country. It was shown that the electrical energy demand and its variants could
serve as substitutes of socioeconomic variables, or could be used, coupled with them,
since the results of the analysis are equivalent to results of papers published in economic
journals. Therefore, the use of such indexes is proposed, especially when taking into
account that such data are automatically available from the local electricity companies.
The results of the analysis could also be used in the planning of the Greek electrical
system, providing directions for a specialized energy supply infrastructure development,
considering the unique characteristics of each region. Attica and Thessaloniki are two
major electrical energy consumers. Boeotia, Euboea, Magnesia and Phthiotis with their
important industrial sector can also be added to the latter regions, since the industrial
activities are the cause of high electrical energy consumption. The distribution of the
electrical energy demand of the industrial section in the time domain has some interesting
properties. E.g. the industries are closed down in the summer due to summer holidays or
in the weekends, resulting in an uneven distribution of the electrical energy demand,
whose bulk is concentrated in smaller time periods. Thus higher picks of electrical energy
13
demand should be satisfied in certain time periods, mainly in winter months and working
days. However, the high level of agglomeration, associated with the location of the
industries which are primarily concentrated in Central Greece helps in the
implementation of target specific mechanisms during the planning procedure.
The agricultural sector in Greece is dispersed, especially when compared to the
industrial sector. Regions with agricultural orientation can be found in Central Greece, but
also in Central Macedonia Peloponnese and Thessaly. The electrical energy demand of the
industrial section is also unevenly distributed in the time domain. However, unlike the
distribution of the industrial sector, the electrical energy demand of the agricultural
sector is concentrated in the summer, thus requiring a respective planning.
Regions with high electrical energy demand for commercial use are also spatially
dispersed in Greece. Of great importance is that most of these regions are islands, e.g.
Kerkyra, Lefkada, Zakynthos and Dodecanese. The islands in Greece are not connected to
the Greek Interconnected Electric System. Furthermore, the commercial activities are
primarily correlated to the touristic character of these regions, hence the bulk of the
electrical energy demand is concentrated in the summer.
In concluding it is recommended that the developers of the Greek electrical system
must consider the peculiarities of the spatial distribution of the electrical energy demand
of each sector for its optimal planning.
Acknowledgement: This research has been partly funded by the Greek General
Secretariat for Research and Technology through the research project “Combined
REnewable Systems for Sustainable Energy DevelOpment” (CRESSENDO project, grant
number 5145).
AppendixA Supplementarymaterial
Supplementary data and the code for cleaning the raw data and reproducing the
visualizations of the present study as well as the Tyralis et al. (2016) paper, additional
analysis and Figures for the year 2012 associated with the Tyralis et al. (2016) and the
present study, and a similar analysis on data which span from 2008 to 2011 are available
as online supplementary material in Appendix A.
References
Anselin, L., 1995. Local Indicators of Spatial Association-LISA. Geogr. Anal. 27 (2), 93–115.
doi:10.1111/j.1538-4632.1995.tb00338.x.
14
Arimah, B.C., 1993. Electricity consumption in Nigeria: a spatial analysis. OPEC Rev. 17
(1), 63–82. doi:10.1111/j.1468-0076.1993.tb00465.x.
Artelaris, P., Kandylis, G., 2014. Mapping poverty at regional level in Greece. Région et
Développement 39, 131–147.
Assunção, R.M., Neves, M.C., Câmara, G., Da Costa Freitas, C., 2006. Efficient regionalization
techniques for socio-economic geographical units using minimum spanning trees.
Int. J. Geogr. Inf. Sci. 20 (7), 797–811. doi:10.1080/13658810600665111.
Benos, N., Karagiannis, S., 2008. Convergence and economic performance in Greece:
evidence at regional and prefecture level. Rev. Urban Reg. Dev. Stud. 20 (1), 52–69.
doi:10.1111/j.1467-940X.2008.00141.x.
Benos, N., Karagiannis, S., Vlamis, P., 2011. Spatial effects of the property sector
investment on Greek economic growth. J. Property Invest. Financ. 29 (3), 233–250.
doi:10.1108/14635781111138073.
Caraveli, H., Tsionas, E.G., 2012. Economic restructuring, crises and the regions: the
political economy of regional inequalities in Greece. GreeSE papers, 61. London
School of Economics and Political Science, Hellenic Observatory, London, UK.
http://eprints.lse.ac.uk/44882/1/GreeSE%20No61.pdf (accessed 23.11.16).
Cuadrado-Roura, J.R., Martin, R., Rodríguez-Pose, A., 2016. The economic crisis in Europe:
urban and regional consequences. Camb. J. Reg. Econ. Soc. 9 (1), 3–11.
doi:10.1093/cjres/rsv036.
Christofakis, M., Gkouzos, A., 2013. Regional Specialization And Efficiency Of The
Agricultural Sector In Greece: The Relationship With Regional Funding Allocation.
Reg. Sectoral Econ. Stud. 13 (1), 119–130.
Christofakis, M., Papadaskalopoulos, A., 2011. The Growth Poles Strategy in Regional
Planning: The Recent Experience of Greece. Theor. Empiric. Res. Urban Manage. 6
(2), 5–20.
Duque, J.C., Ramos, R., Suriñach, J., 2007. Supervised Regionalization Methods: A Survey.
Int. Reg. Sci. Rev. 30 (3), 195–220. doi:10.1177/0160017607301605.
Esri, 2015. ArcGIS for Desktop: Release 10.3.1. California, Redlands.
Getis, A., Ord, J.K., 1992. The Analysis of Spatial Association by Use of Distance Statistics.
Geogr. Anal. 24 (3), 189–206. doi:10.1111/j.1538-4632.1992.tb00261.x.
Goletsis, Y., Chletsos, M., 2011. Measurement of development and regional disparities in
Greek periphery: A multivariate approach. Socio Econ. Plan. Sci. 45 (4), 174–183.
doi:10.1016/j.seps.2011.06.002.
He, C., Ma, Q., Li, T., Yang, Y., Liu, Z., 2012. Spatiotemporal dynamics of electric power
consumption in Chinese Mainland from 1995 to 2008 modeled using DMSP/OLS
stable nighttime lights data. J. Geogr. Sci. 22 (1), 125–136. doi:10.1007/s11442-012-
0916-3.
Hlepas, N.K., Getimis, P., 2011. Impacts of Local Government Reforms in Greece: An
Interim Assessment. Local Gov. Stud. 37 (5), 517–532.
doi:10.1080/03003930.2011.604544.
Ihara, T., Genchi, Y., Sato, T., Yamaguchi, K., Endo, Y., 2008. City-block-scale sensitivity of
electricity consumption to air temperature and air humidity in business districts of
Tokyo, Japan. Energy 33 (11), 1634–1645. doi:10.1016/j.energy.2008.06.005.
Ikonomou, C., 2011. A Microeconomic assessment of Greece’s core-periphery imbalances
(1994-2002) Confirming Krugman’s initial new economic geography model. Eur. J.
Geogr. 2 (2), 62–78.
15
Ito, T., Chen, Y., Ito, S., Yamaguchi, K., 2010. Prospect of the upper limit of the energy
demand in China from regional aspects. Energy 35 (12), 5320–5327.
doi:10.1016/j.energy.2010.07.028.
Jain, A.K., 2010. Data clustering: 50 years beyond K-means. Pattern Recogn. Lett. 31 (8),
651–666. doi:10.1016/j.patrec.2009.09.011.
Kaijuka, E., 2007. GIS and rural electricity planning in Uganda. J. Clean. Prod. 15 (2), 203–
217. doi:10.1016/j.jclepro.2005.11.057.
Karoulia, S., Gaki, E., 2013. The impact of economic crisis on Greek regions and the
importance of regional resilience. 53rd Congress of the European Regional Science
Association (ERSA 2013), Palermo. http://hdl.handle.net/10419/124101 (accessed
23.11.16).
Khan, M.A., Ahmad, U., 2008. Energy demand in Pakistan: a disaggregate analysis. The Pak.
Dev. Rev. 47 (4), 437–455.
Lambrinidis, M., Psycharis, Y., Rovolis, A., 2005. Regional allocation of public
infrastructure investment: The case of Greece. Reg. Stud. 39 (9), 1231–1244.
doi:10.1080/00343400500390057.
Lee, C.C., Chang, C.P., 2008. Energy consumption and economic growth in Asian
economies: A more comprehensive analysis using panel data. Resour. Energy Econ.
30 (1), 50–65. doi:10.1016/j.reseneeco.2007.03.003.
Liargovas, P.G., Daskalopoulou, I., 2011. Capital allocation in the Greek regions. J. Policy
Model. 33 (6), 866–888. doi:10.1016/j.jpolmod.2011.03.011.
Liargovas, P.G., Fotopoulos, G., 2009. Socioeconomic Indicators for Analyzing
Convergence: The Case of Greece: 1960–2004. Soc. Indic. Res. 93 (2), 315–330.
doi:10.1007/s11205-008-9319-3.
Liontakis, A., Papadas, C.T., Tzouramani, I., 2010. Regional Economic Convergence in
Greece: A Stochastic Dominance Approach. 50th Congress of the European Regional
Science Association (ERSA 2010), Jönköping. http://hdl.handle.net/10419/119147
(accessed 23.11.16).
Liu, B., Wang, X., Huo, T., 2014. Spatial Econometric Analysis of the Energy Efficiency of
the Chinese Regional Construction Industry, in: Wang, J., Ding, Z., Zou, L., Zuo, J.
(Eds.), Proceedings of the 17th International Symposium on Advancement of
Construction Management and Real Estate. Springer Berlin Heidelberg, pp. 697–
708. doi:10.1007/978-3-642-35548-6_72.
Lolos, S.E.G., 2009. The effect of EU structural funds on regional growth: assessing the
evidence from Greece, 1990–2005. Econ. Change Restruct. 42 (3), 211–228.
doi:10.1007/s10644-009-9070-z.
Ma, H., Oxley, L., 2012. The emergence and evolution of regional convergence clusters in
China's energy markets. Energy Econ. 34 (1), 82–94.
doi:10.1016/j.eneco.2011.02.015.
Melo, J.D., Padilha-Feltrin, A., Carreno, E.M., 2015. Spatial pattern recognition of urban
sprawl using a geographically weighted regression for spatial electric load
forecasting. 18th International Conference on Intelligent System Application to
Power Systems (ISAP) 1-5. doi:10.1109/ISAP.2015.7325537.
Monastiriotis, V., 2009. Examining the consistency of spatial association patterns across
socio-economic indicators: an application to the Greek regions. Empir. Econ. 37 (1),
25–49. doi:10.1007/s00181-008-0221-2.
Monastiriotis, V., 2011. Making geographical sense of the Greek austerity measures:
compositional effects and long-run implications. Camb. J. Reg. Econ. Soc. 4 (3), 323–
337. doi:10.1093/cjres/rsr026.
16
Monastiriotis, V., 2014. Convergence through crisis? The impact of the crisis on wage
returns across the Greek regions. Région et Développement 39, 35–57.
Monastiriotis, V., Martelli, A., 2013. Beyond rising unemployment: unemployment risk,
crisis and regional adjustments in Greece. GreeSE: Hellenic Observatory papers on
Greece and Southeast Europe, 80. Hellenic Observatory, London School of
Economics and Political Science, London, UK.
http://eprints.lse.ac.uk/55265/1/GreeSE%20No80.pdf (accessed 23.11.16).
Monastiriotis, V., Psycharis, Y., 2014. Between equity, efficiency and redistribution: An
analysis of revealed allocation criteria of regional public investment in Greece. Eur.
Urban Reg. Stud. 21 (4), 445–462. doi:10.1177/0969776412455990.
Ord, J.K., Getis, A., 1995. Local Spatial Autocorrelation Statistics: Distributional Issues and
an Application. Geogr. Anal. 27 (4), 286–306. doi:10.1111/j.1538-
4632.1995.tb00912.x.
Petrakos, G., Psycharis, Y., 2016. The spatial aspects of economic crisis in Greece. Camb. J.
Reg. Econ. Soc. 9 (1), 137–152. doi:10.1093/cjres/rsv028.
Petrakos, G., Saratsis, Y., 2000. Regional inequalities in Greece. Pap. Reg. Sci. 79 (1), 57–
74. doi:10.1007/s101100050003.
Psycharis, Y., 2008. Public Spending Patterns: The Regional Allocation of Public
Investment in Greece by Political Period. London School of Economics and Political
Science, GreeSE Paper 14. doi:10.2139/ssrn.1269940.
Psycharis, Y., Kallioras, D., Pantazis, P., 2014. Economic crisis and regional resilience:
detecting the ‘geographical footprint’ of economic crisis in Greece. Reg. Sci. Policy
Pract. 6 (2), 121–141. doi:10.1111/rsp3.12032.
de Rezende Francisco, E., Aranha, F., Zambaldi, F., Goldszmidt, R., 2007. Electricity
Consumption as a Predictor of Household Income: a Spatial Statistics Approach, in:
Davis Jr, C.A., Monteiro, A.M.V. (Eds.), Advances in Geoinformatics. Springer Berlin
Heidelberg, pp. 267–282. doi:10.1007/978-3-540-73414-7_17.
Rodríguez-Pose, A., Psycharis, Y., Tselios, V., 2015. Politics and Investment: Examining the
Territorial Allocation of Public Investment in Greece. Reg. Stud..
doi:10.1080/00343404.2015.1009027.
Schiesser, H.H., Bader, J., 2005. Continuity of supply in a Swiss urban electrical network
— A spatial analysis. CIRED 2005. 18th International Conference and Exhibition on
Electricity Distribution. doi:10.1049/cp:20051333.
Sheng, Y., Shi, X., Zhang, D., 2014. Economic growth, regional disparities and energy
demand in China. Energy Policy 71, 31–39. doi:10.1016/j.enpol.2014.04.001.
Shi, K., Yu, B., Huang, Y., Hu, Y., Yin, B., Chen, Z., Chen, L., Wu, J., 2014. Evaluating the Ability
of NPP-VIIRS Nighttime Light Data to Estimate the Gross Domestic Product and the
Electric Power Consumption of China at Multiple Scales: A Comparison with DMSP-
OLS Data. Remote Sens. 6 (2), 1705–1724. doi:10.3390/rs6021705.
Taylor, S.C., Firth, S.K., Wang, C., Allinson, D., Quddus, M., Smith, P., 2014. Spatial mapping
of building energy demand in Great Britain. GCB Bioenergy 6 (2), 123–135.
doi:10.1111/gcbb.12165.
Tsionas, M., Sakkas, S., Baltas, N.C., 2014. Regional Convergence in Greece (1995–2005):
A Dynamic Panel Perspective. Econ. Res. Int. 2014 (385038).
doi:10.1155/2014/385038.
Tyralis, H., Mamassis, N., Photis, Y.N., 2016. Spatial analysis of electrical energy demand
patterns in Greece: Application of a GIS-based methodological framework. Energy
Procedia 97, 262–269. doi:10.1016/j.egypro.2016.10.071.
17
Tyralis, H., Karakatsanis, G., Tzouka, K., Mamassis, N., 2017. Visualization of electrical
energy demand in Greece. Submitted to Energy.
Vogiatzoglou, K., Tsekeris, T., 2013. Spatial Agglomeration of Manufacturing in Greece:
Sectoral Patterns and Determinants. Eur. Plann. Stud. 21 (12), 1853–1872.
doi:10.1080/09654313.2012.722964.
Wang, Z.H., Zeng, H.L., Wei, Y.M., Zhang, Y.X., 2012. Regional total factor energy efficiency:
An empirical analysis of industrial sector in China. Appl. Energy 97, 115–123.
doi:10.1016/j.apenergy.2011.12.071.
Yaylaci, E.D., Ismaila, A.B., Uşkay, O., Düzgün, Ş., 2011. Spatial Analyses of Electricity
Supply and Consumption in Turkey for Effective Energy Management and Policy-
making, in: Schmidt, M., Onyango, V., Palekhov, D. (Eds.), Implementing
Environmental and Resource Management. Springer Berlin Heidelberg, pp. 153–
168. doi:10.1007/978-3-540-77568-3_14.
Yi, K., Tani, H., Li, Q., Zhang, J., Guo, M., Bao, Y., Wang, X., Li, J., 2014. Mapping and Evaluating
the Urbanization Process in Northeast China Using DMSP/OLS Nighttime Light Data.
Sensors 14 (2), 3207–3226. doi:10.3390/s140203207.
Zhang, B., Chen, Z.M., Xia, X.H., Xu, X.Y., Chen, Y.B., 2013. The impact of domestic trade on
China's regional energy uses: A multi-regional input–output modeling. Energy
Policy 63, 1169–1181. doi:10.1016/j.enpol.2013.08.062.
Zhang, H., Lahr, M.L., 2014. China's energy consumption change from 1987 to 2007: A
multi-regional structural decomposition analysis. Energy Policy 67, 682–693.
doi:10.1016/j.enpol.2013.11.069.
Zhang, L.X., Yang, Z.F., Chen, B., Chen, G.Q., Zhang, Y.Q., 2009a. Temporal and spatial
variations of energy consumption in rural China. Commun. Nonlinear Sci. Numer.
Simulat. 14 (11), 4022–4031. doi:10.1016/j.cnsns.2008.04.019.
Zhang, L.X., Yang, Z.F., Chen, B., Chen, G.Q., 2009b. Rural energy in China: Pattern and
policy. Renew. Energy 34 (12) , 2813–2823. doi:10.1016/j.renene.2009.04.006.
Zhang, L.X., Yang, Z.F., Liang, J., Cai, Y., 2011. Spatial Variation and Distribution of Urban
Energy Consumptions from Cities in China. Energies 4 (1), 26–38.
doi:10.3390/en4010026.
18
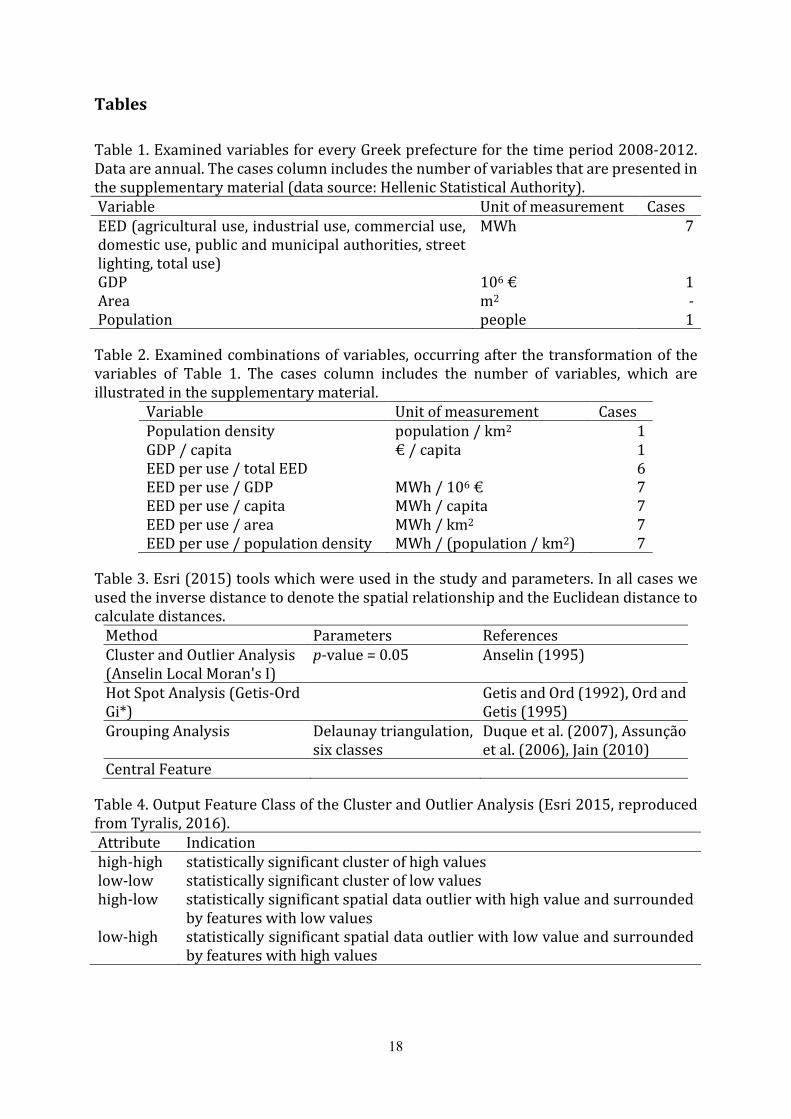
Tables
Table 1. Examined variables for every Greek prefecture for the time period 2008-2012.
Data are annual. The cases column includes the number of variables that are presented in
the supplementary material (data source: Hellenic Statistical Authority).
Variable Unit of measurement Cases
EED (agricultural use, industrial use, commercial use,
domestic use, public and municipal authorities, street
lighting, total use)
MWh 7
GDP 106 € 1
Area m2 -
Population people 1
Table 2. Examined combinations of variables, occurring after the transformation of the
variables of Table 1. The cases column includes the number of variables, which are
illustrated in the supplementary material.
Variable Unit of measurement Cases
Population density population / km2 1
GDP / capita € / capita 1
EED per use / total EED 6
EED per use / GDP MWh / 106 € 7
EED per use / capita MWh / capita 7
EED per use / area MWh / km2 7
EED per use / population density MWh / (population / km2) 7
Table 3. Esri (2015) tools which were used in the study and parameters. In all cases we
used the inverse distance to denote the spatial relationship and the Euclidean distance to
calculate distances.
Method Parameters References
Cluster and Outlier Analysis
(Anselin Local Moran's I)
p-value = 0.05 Anselin (1995)
Hot Spot Analysis (Getis-Ord
Gi*)
Getis and Ord (1992), Ord and
Getis (1995)
Grouping Analysis Delaunay triangulation,
six classes
Duque et al. (2007), Assunção
et al. (2006), Jain (2010)
Central Feature
Table 4. Output Feature Class of the Cluster and Outlier Analysis (Esri 2015, reproduced
from Tyralis, 2016).
Attribute Indication
high-high statistically significant cluster of high values
low-low statistically significant cluster of low values
high-low statistically significant spatial data outlier with high value and surrounded
by features with low values
low-high statistically significant spatial data outlier with low value and surrounded
by features with high values
19
Figures
Figure 1. NUTS (Nomenclature of Territorial Units for Statistics) level 2.
Figure 2. NUTS (Nomenclature of Territorial Units for Statistics) level 3.
20
Figure 3. EED for agricultural use of the Greek prefectures (left) and corresponding cluster
and outlier analysis (right, legend explained in Table 4) as at the year 2012.
Figure 4. Hot spot analysis of the EED for agricultural use of the Greek prefectures (left)
and corresponding grouping analysis (right) as at the year 2012.
Figure 5. Hot spot analysis of the EED for agricultural use per capita of the Greek
prefectures (left) and corresponding grouping analysis (right) as at the year 2012.
21
Figure 6. Hot spot analysis of the ratio of the EED for agricultural use to the prefecture
area of the Greek prefectures (left) and corresponding grouping analysis (right) as at the
year 2012.
Figure 7. EED for commercial use of the Greek prefectures (left) and corresponding
cluster and outlier analysis (right, legend explained in Table 4) as at the year 2012.
Figure 8. Hot spot analysis of the EED for commercial use of the Greek prefectures (left)
and corresponding grouping analysis (right) as at the year 2012.
22
Figure 9. Hot spot analysis of the EED for commercial use per capita of the Greek
prefectures (left) and corresponding grouping analysis (right) as at the year 2012.
Figure 10. EED for domestic use of the Greek prefectures (left) and corresponding cluster
and outlier analysis (right, legend explained in Table 4) as at the year 2012.
Figure 11. Hot spot analysis of the EED for domestic use of the Greek prefectures (left)
and corresponding grouping analysis (right) as at the year 2012.
23
Figure 12. Hot spot analysis of the EED for domestic use per capita of the Greek
prefectures (left) and corresponding grouping analysis (right) as at the year 2012.
Figure 13. EED for industrial use of the Greek prefectures (left) and corresponding cluster
and outlier analysis (right, legend explained in Table 4) as at the year 2012.
Figure 14. Hot spot analysis of the EED for industrial use of the Greek prefectures (left)
and corresponding grouping analysis (right) as at the year 2012.
24
Figure 15. Hot spot analysis of the EED for industrial use per capita of the Greek
prefectures (left) and corresponding grouping analysis (right) as at the year 2012.
Figure 16. Hot spot analysis of the ratio of the EED for industrial use to the GDP of the
Greek prefectures (left) and corresponding grouping analysis (right) as at the year 2012.
Figure 17. Total EED of the Greek prefectures (left) and corresponding cluster and outlier
analysis (right, legend explained in Table 4) as at the year 2012.
25
Figure 18. Hot spot analysis of the total EED of the Greek prefectures (left) and
corresponding grouping analysis (right) as at the year 2012.
Figure 19. Hot spot analysis of the total EED per capita of the Greek prefectures (left) and
corresponding grouping analysis (right) as at the year 2012.
26
Figure 20. Heatmap which summarizes the standardized values of the variables examined
in Section 3. The x-axis presents the examined variables and the y-axis presents the
prefectures. The prefectures were clustered, conditional on the standardized values of the
variables. Darker colours correspond to higher values of variables.